Carmike Cinemas — Wachovia Securities Media & Communications Fixed Income Conference 2005
32 slides from Carmike Cinemas's conference presentation, Apr 11, 2005
Slide 1: Wachovia Securities Media & Communications Fixed Income Conference
Wachovia Securities Media & Communications Fixed Income Conference April 11-12, 2005
Slide 2: Forward-Looking Statements
Forward-Looking Statements This presentation may contain forward-looking statements within the meaning of the federal securities laws. Statements that are not historical facts, including statements about our beliefs and expectations, future dividends, potential financings or acquisitions, the openin
Slide 3: Carmike Investment Update
Carmike Investment Update Proven ability to execute plan and deliver strong performance Strong slate of movies we believe are well suited to our markets Operations on track for theatre openings On track for at least 2 new market entries in 2005 7 new theatre openings in existing markets in 2005 Addi
Slide 4: Carmike Investment Highlights
Carmike Investment Highlights We are America's home town exhibitor Compelling industry fundamentals focused on event pictures and sequels Home town strategy is unique and highly profitable Strong free cash flow profile allows flexibility Increased opportunities for disciplined growth Experienced man
Slide 5: Carmike is America's Home Town Exhibitor
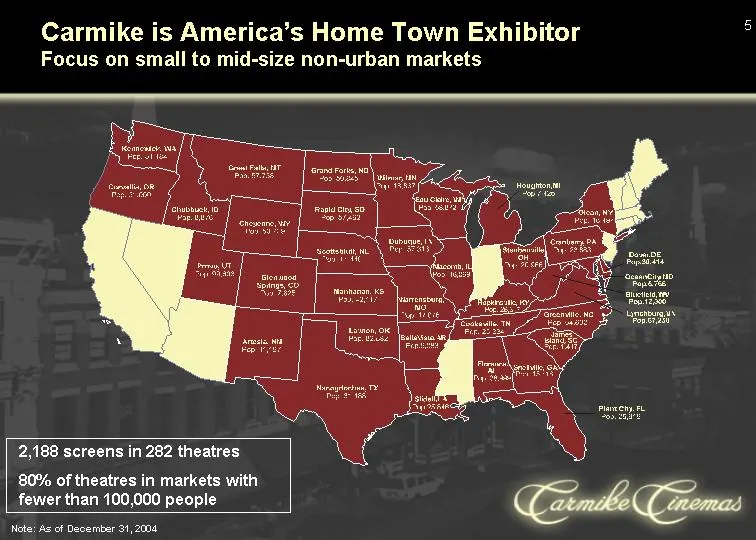
Carmike is America's Home Town Exhibitor Focus on small to mid-size non-urban markets Note: As of December 31, 2004 2,188 screens in 282 theatres 80% of theatres in markets with fewer than 100,000 people
Slide 6: 2004 Releases Drove Strong Performance
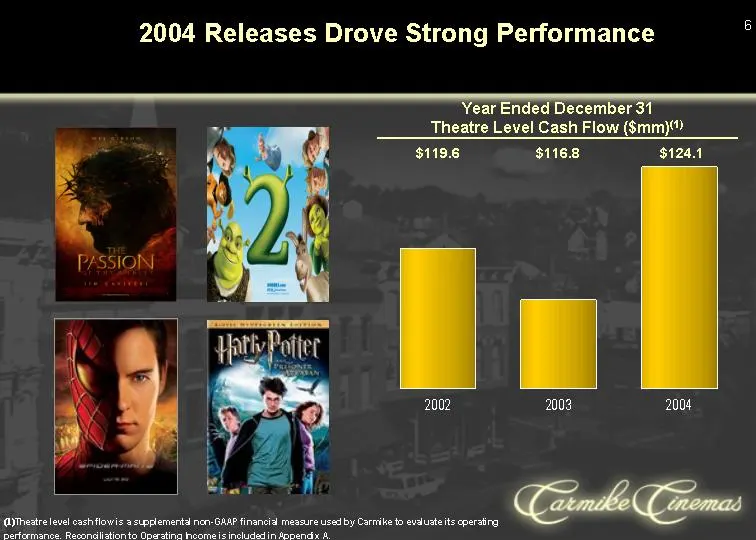
2004 Releases Drove Strong Performance 2002 2003 2004 119.6 116.8 124 Year Ended December 31 Theatre Level Cash Flow ($mm)(1) $119.6 $124.1 $116.8 (1)Theatre level cash flow is a supplemental non-GAAP financial measure used by Carmike to evaluate its operating performance. Reconciliation to Operatin

Slide 7: Buena Vista
Buena Vista
Slide 8: DreamWorks
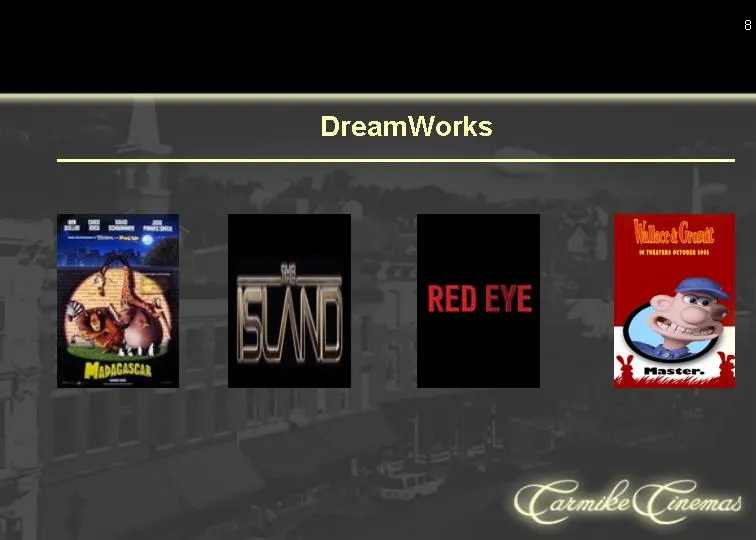
DreamWorks = oe te ais sms RED EE

Slide 9: Fox
Fox
Slide 10: MGM
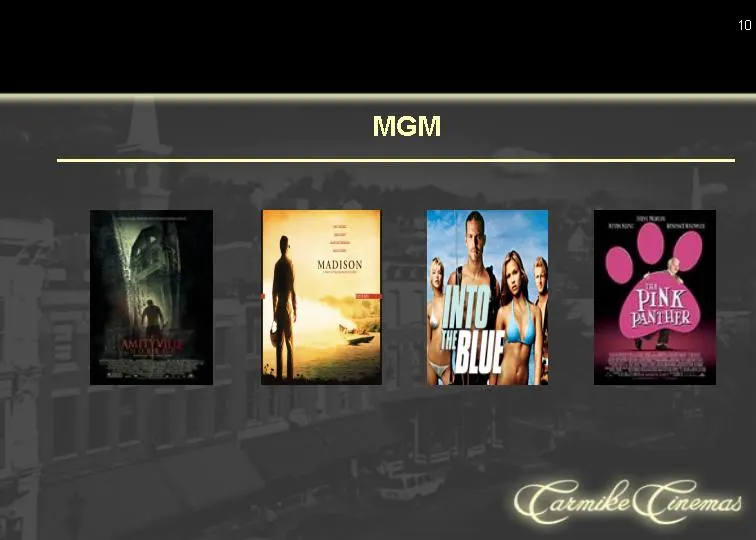
10 MGM
Slide 11: Paramount
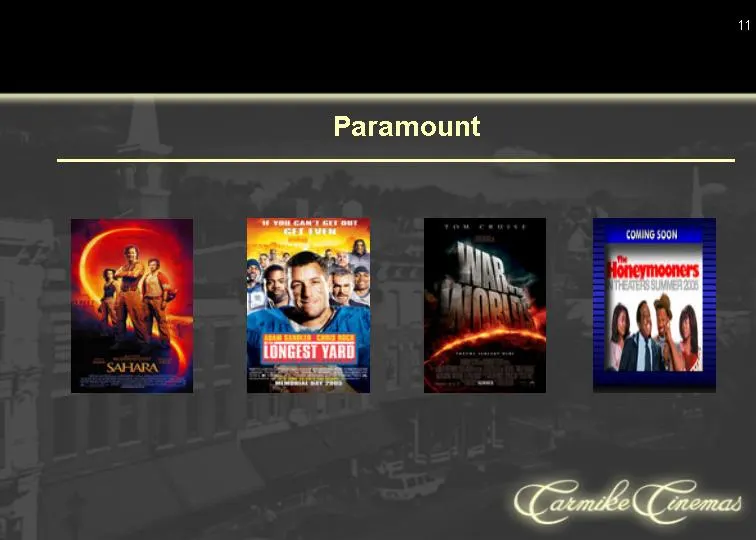
Paramount # PELLLLL LLL =
Slide 12: Sony
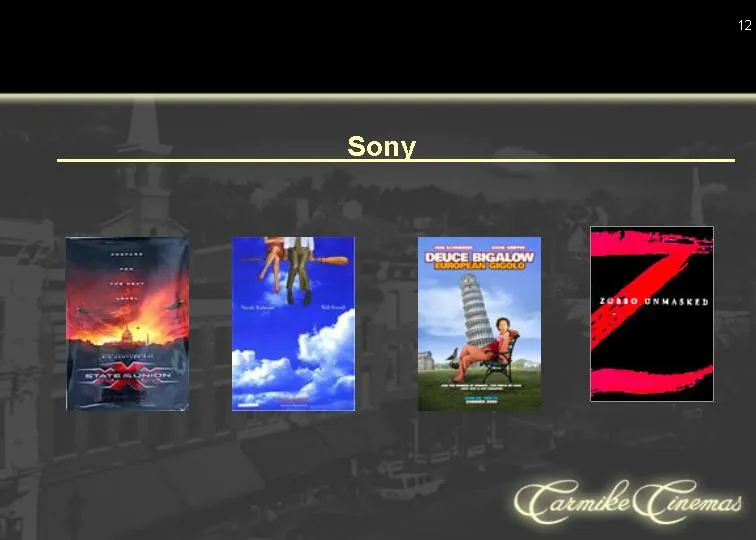
Sony

Slide 13: Universal The Skeleton Key
Universal The Skeleton Key
Slide 14: Warner Brothers
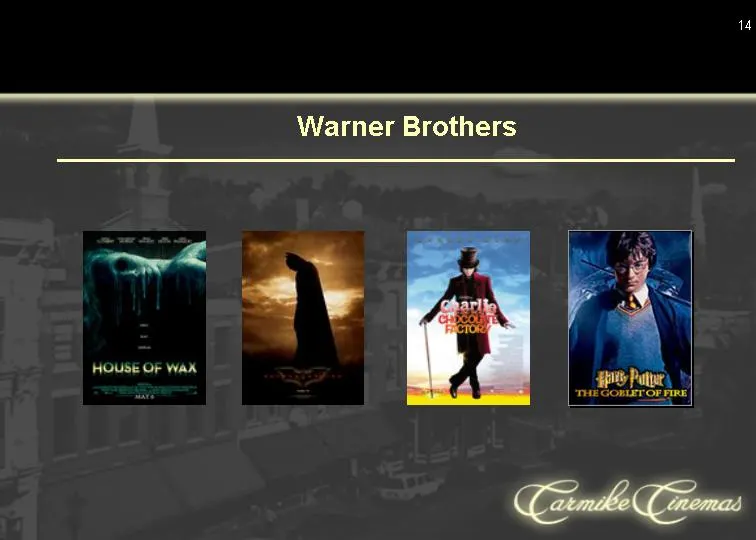
Warner Brothers ~< 4} HOUSE OF WAX 4
Slide 15: Unique and Profitable Home Town Strategy
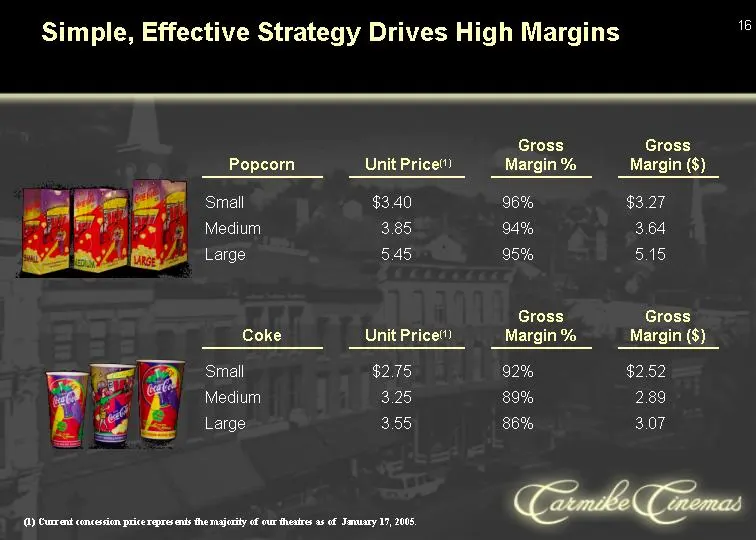
Unique and Profitable Home Town Strategy Home town market Carmike-Plex vs. Mega-Plex Limited competition Simple, efficient and effective strategy: Popcorn, Coke and a Movie
Slide 16: Simple, Effective Strategy Drives High Margins
Simple, Effective Strategy Drives High Margins Small $3.40 96% $3.27 Medium 3.85 94% 3.64 Large 5.45 95% 5.15 Popcorn Unit Price(1) Gross Margin % Small $2.75 92% $2.52 Medium 3.25 89% 2.89 Large 3.55 86% 3.07 Gross Margin ($) Coke Unit Price(1) Gross Margin % Gross Margin ($) (1) Current concession
Slide 17: Modern, High Quality Theatre Circuit Provides Superior Viewing Experience
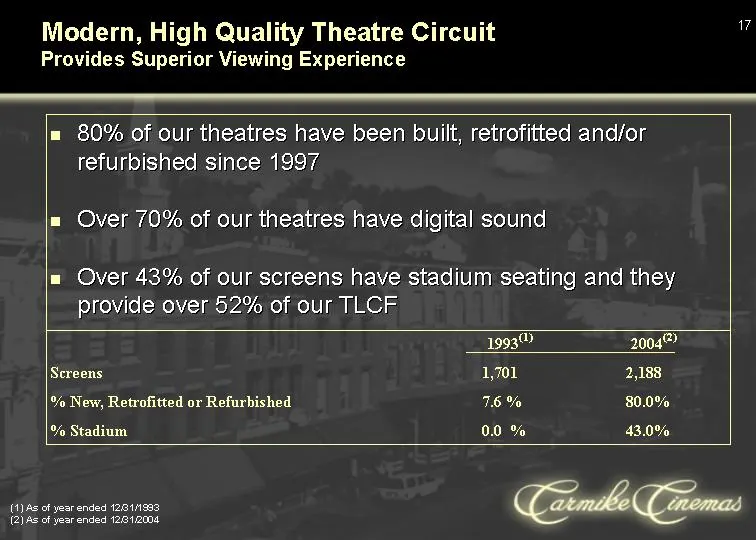
Modern, High Quality Theatre Circuit Provides Superior Viewing Experience 80% of our theatres have been built, retrofitted and/or refurbished since 1997 Over 70% of our theatres have digital sound Over 43% of our screens have stadium seating and they provide over 52% of our TLCF (1) As of year ended
Slide 18: Efficient Capital Deployment: Maintenance
Efficient Capital Deployment: Maintenance In a majority of our markets, the specific expertise to keep our theatres modern and efficient is not readily available. Carmike maintains its' own shop based in Columbus, Georgia, that provides us with internal repair capability and available replacement eq
Slide 19: Efficient Capital Deployment: New Market Entry
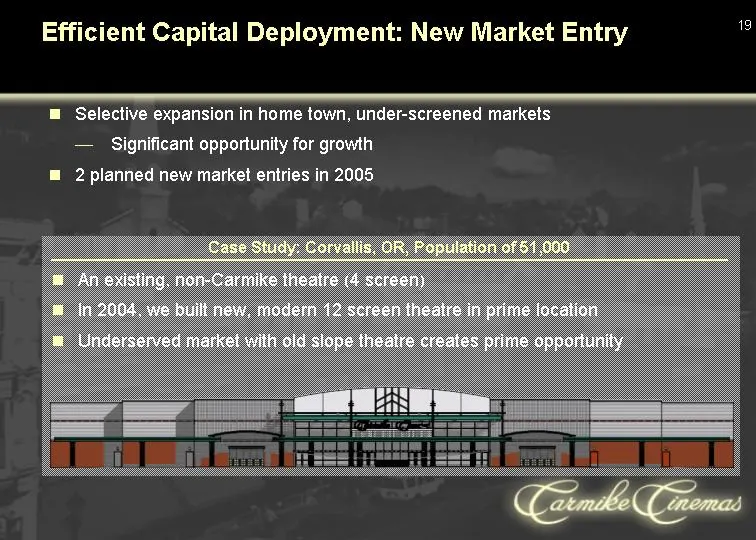
Efficient Capital Deployment: New Market Entry Selective expansion in home town, under-screened markets Significant opportunity for growth 2 planned new market entries in 2005 Case Study: Corvallis, OR, Population of 51,000 An existing, non-Carmike theatre (4 screen) In 2004, we built new, modern 12
Slide 20: New Theatres in 2005
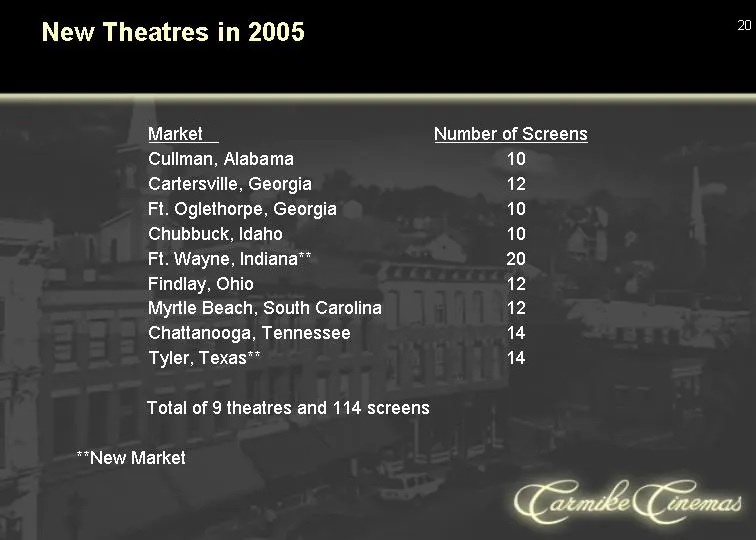
New Theatres in 2005 Market Number of Screens Cullman, Alabama 10 Cartersville, Georgia 12 Ft. Oglethorpe, Georgia 10 Chubbuck, Idaho 10 Ft. Wayne, Indiana** 20 Findlay, Ohio 12 Myrtle Beach, South Carolina 12 Chattanooga, Tennessee 14 Tyler, Texas** 14 Total of 9 theatres and 114 screens **New Mark
Slide 21: 2005 Screen Additions
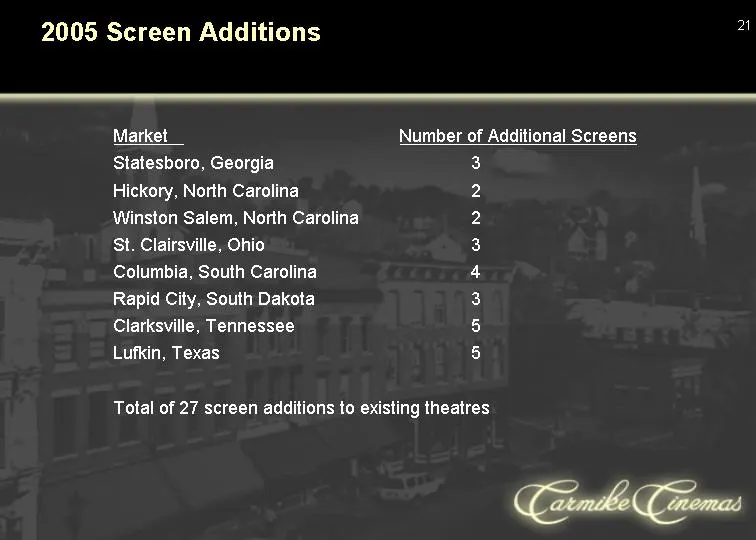
2005 Screen Additions Market Number of Additional Screens Statesboro, Georgia 3 Hickory, North Carolina 2 Winston Salem, North Carolina 2 St. Clairsville, Ohio 3 Columbia, South Carolina 4 Rapid City, South Dakota 3 Clarksville, Tennessee 5 Lufkin, Texas 5 Total of 27 screen additions to existing th
Slide 22: Expected 2005 Stadium Retrofits
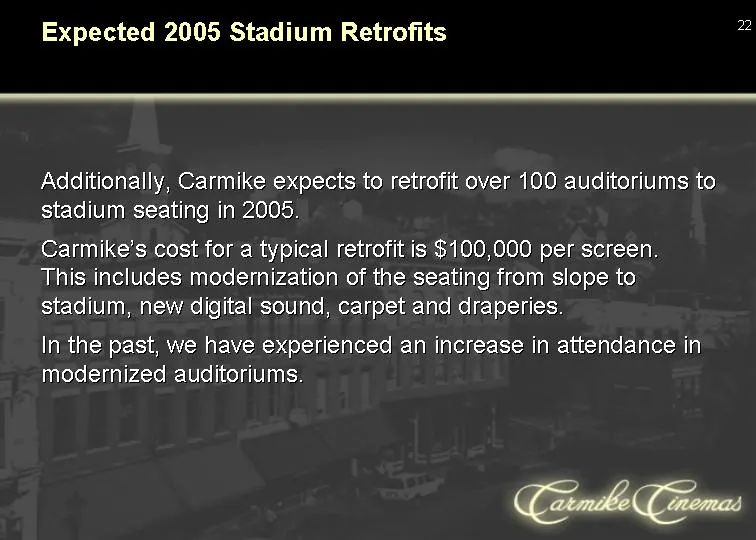
Expected 2005 Stadium Retrofits Additionally, Carmike expects to retrofit over 100 auditoriums to stadium seating in 2005. Carmike's cost for a typical retrofit is $100,000 per screen. This includes modernization of the seating from slope to stadium, new digital sound, carpet and draperies. In the p
Slide 23: Consolidation
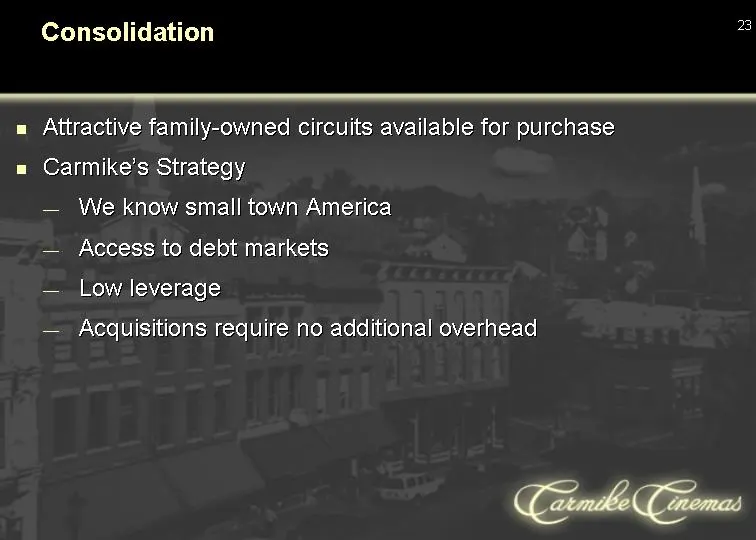
Consolidation Attractive family-owned circuits available for purchase Carmike's Strategy We know small town America Access to debt markets Low leverage Acquisitions require no additional overhead
Slide 24: Efficient, Low Cost Operations
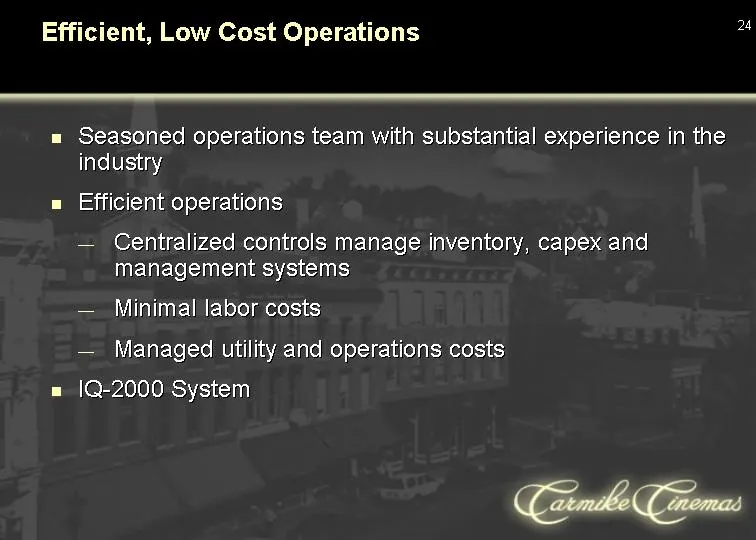
Seasoned operations team with substantial experience in the industry Efficient operations Centralized controls manage inventory, capex and management systems Minimal labor costs Managed utility and operations costs IQ-2000 System Efficient, Low Cost Operations
Slide 25: Financial Summary and Objectives
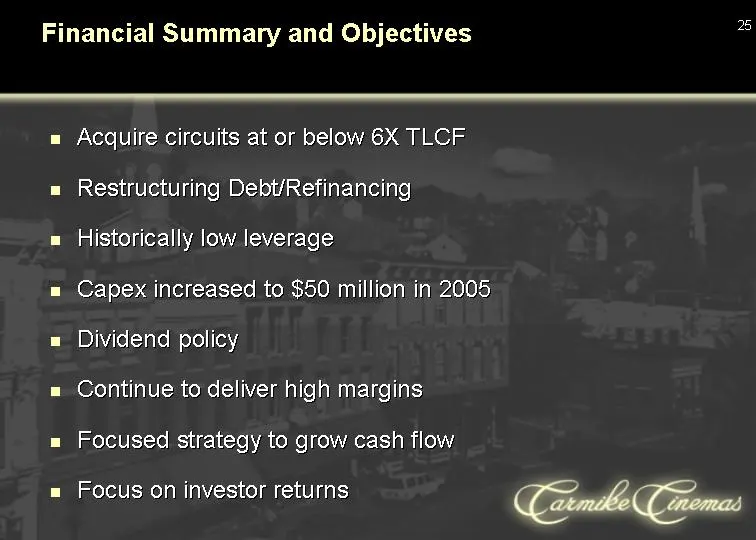
Financial Summary and Objectives Acquire circuits at or below 6X TLCF Restructuring Debt/Refinancing Historically low leverage Capex increased to $50 million in 2005 Dividend policy Continue to deliver high margins Focused strategy to grow cash flow Focus on investor returns
Slide 26: Consolidated Balance Sheets
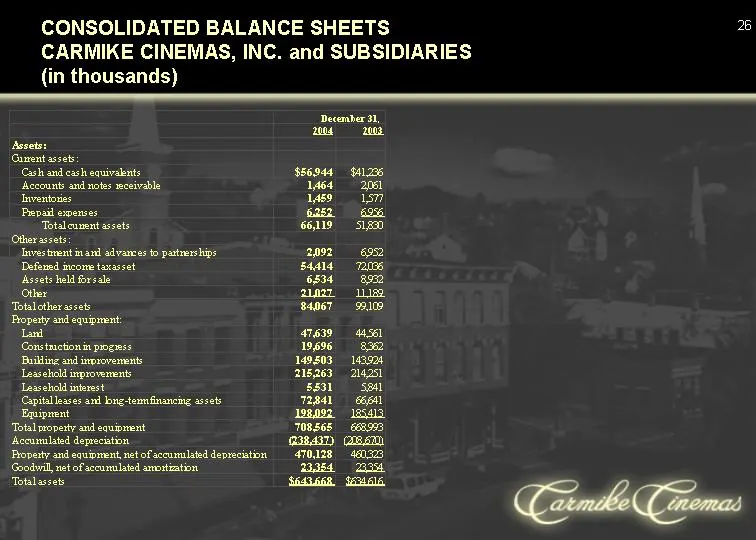
CONSOLIDATED BALANCE SHEETS CARMIKE CINEMAS, INC. and SUBSIDIARIES (in thousands)
Slide 27: Consolidated Balance Sheets (continued)
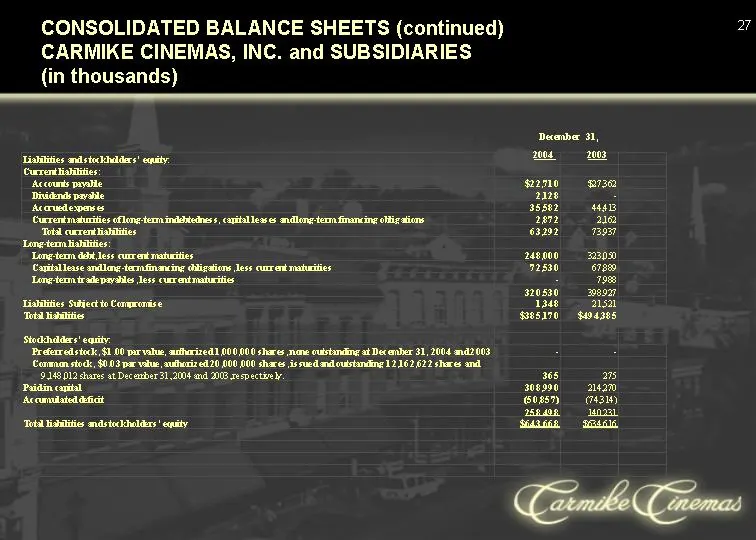
CONSOLIDATED BALANCE SHEETS (continued) CARMIKE CINEMAS, INC. and SUBSIDIARIES (in thousands) December 31, 2004 2003
Slide 28: Consolidated Statements of Operations
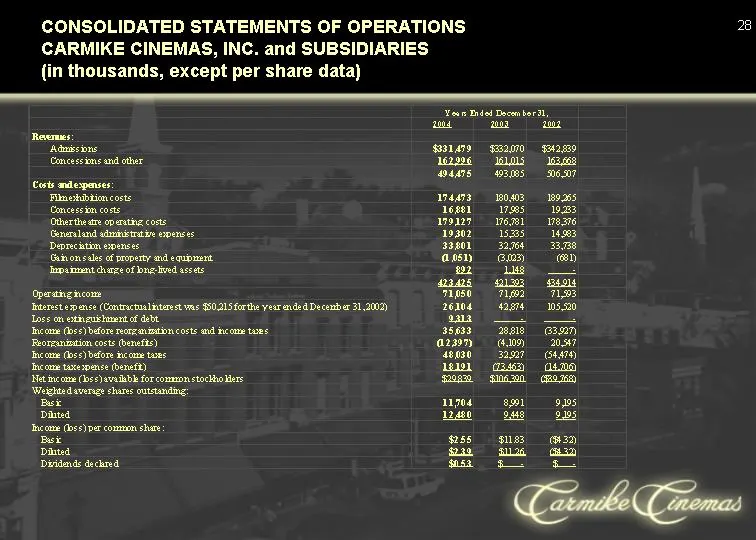
CONSOLIDATED STATEMENTS OF OPERATIONS CARMIKE CINEMAS, INC. and SUBSIDIARIES (in thousands, except per share data) See accompanying notes.
Slide 29: Total Debt and Net Debt
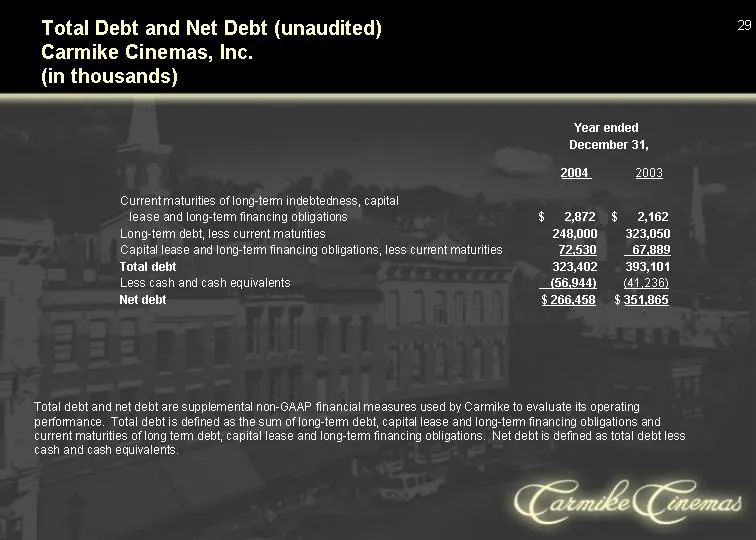
Total Debt and Net Debt (unaudited) Carmike Cinemas, Inc. (in thousands) Total debt and net debt are supplemental non-GAAP financial measures used by Carmike to evaluate its operating performance. Total debt is defined as the sum of long-term debt, capital lease and long-term financing obligations a
Slide 30: Continuing Operating Momentum
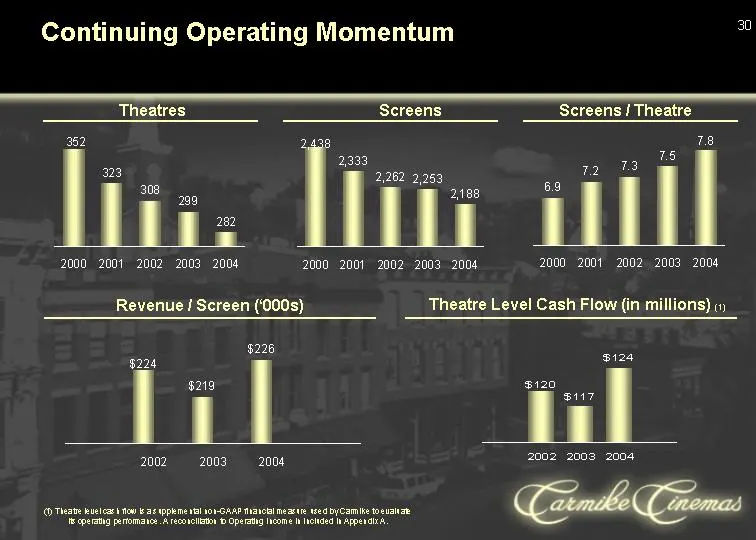
2000 2001 2002 2003 2004 2438 2333 2262 2253 2188 2000 2001 2002 2003 2004 6.9 7.2 7.3 7.5 7.8 2000 2001 2002 2003 2004 352 323 308 299 282 Continuing Operating Momentum Theatres Screens / Theatre Screens Theatre Level Cash Flow (in millions) (1) 2002 2003 2004 224 219 226 2002 2003 2004 119.6 116.8
Slide 31: Pricing Flexibility
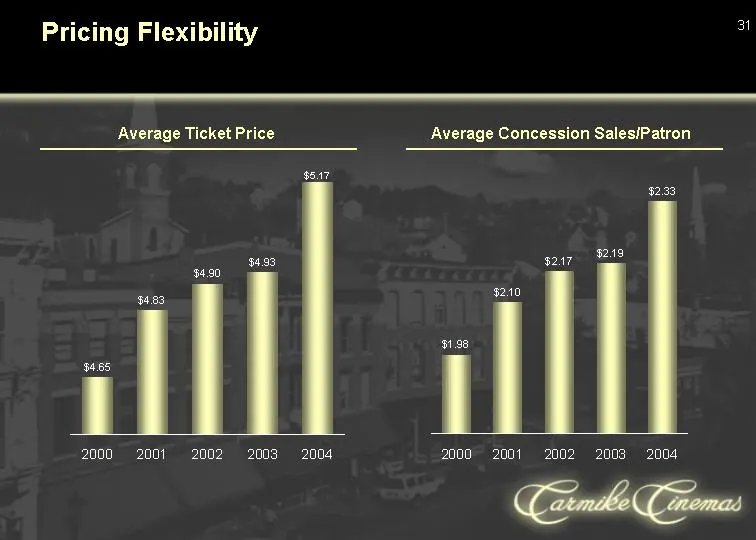
Pricing Flexibility Average Concession Sales/Patron Average Ticket Price 2000 2001 2002 2003 2004 4.65 4.83 4.9 4.93 5.17 2000 2001 2002 2003 2004 1.98 2.1 2.17 2.19 2.33 $5.17
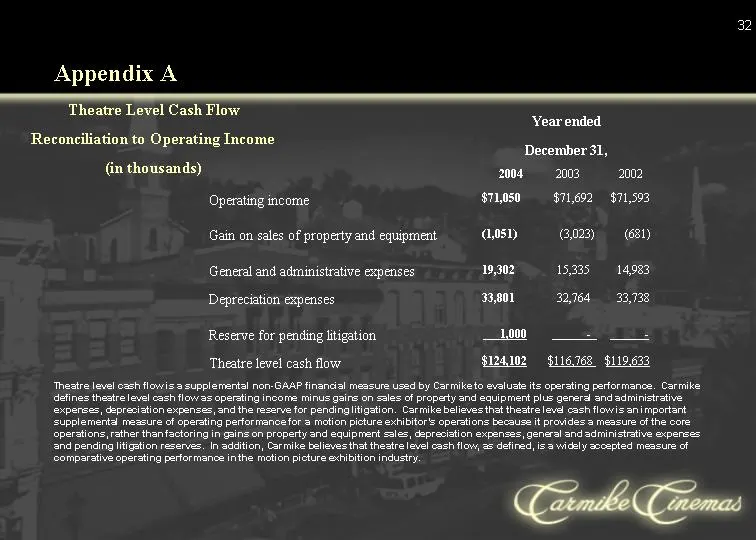
Slide 32: Appendix A Theatre Level Cash Flow Reconciliation to Operating Income
Appendix A Theatre Level Cash Flow Reconciliation to Operating Income (in thousands) Theatre level cash flow is a supplemental non-GAAP financial measure used by Carmike to evaluate its operating performance. Carmike defines theatre level cash flow as operating income minus gains on sales of propert
Source: SEC EDGAR · 8-K filed Apr 11, 2005
More decks from Carmike Cinemas Inc
 Merger or Acquisition (July 2016)16 slides · Jul 25, 2016
 Merger or Acquisition (June 2016)17 slides · Jun 16, 2016
 Investor Presentation (December 2007)35 slides · Dec 11, 2007
 Investor Presentation (November 2007)14 slides · Nov 13, 2007
 Bank of America 2006 Media, Telecommunication and Entertainment Conference31 slides · Mar 30, 2006
 Banc of America Securities Conference (September 2004)23 slides · Sep 22, 2004