Duke Realty — UBS Global Real Estate Conference 2016
37 slides from Duke Realty's conference presentation, Nov 29, 2016
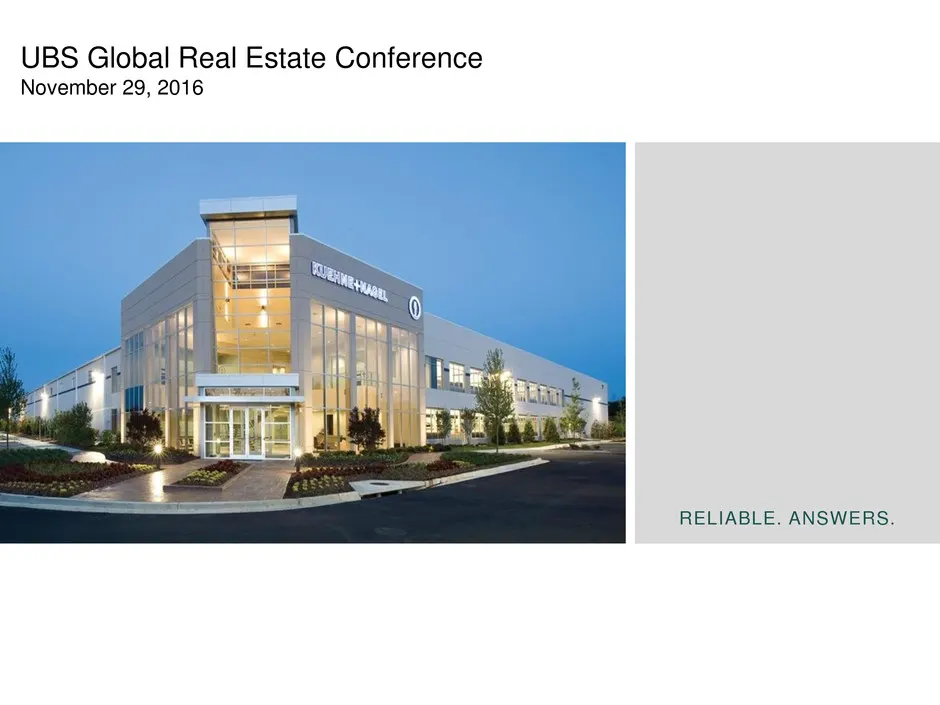
Slide 1: UBS Global Real Estate Conference
UBS Global Real Estate Conference November 29, 2016 RELIABLE. ANSWERS.
Slide 2: Forward-Looking Statement
Forward-Looking Statement This slide presentation contains statements that constitute “forward-looking statements” within the meaning of the Securities Act of 1933 and the Securities Exchange Act of 1934 as amended by the Private Securities Litigation Reform Act of 1995. These forward-looking statem
Slide 3: General Disclaimer
General Disclaimer securities in any she or. jurisdiction shalll be deemed to constitute an offer to sell or a solicitation to buy any Disclaimer for the United Kingdom In the United Kingdom, these slides and thei directed only at p fall within the xemption conained in ani 419 and 49 of the Financia
Slide 4: Contents
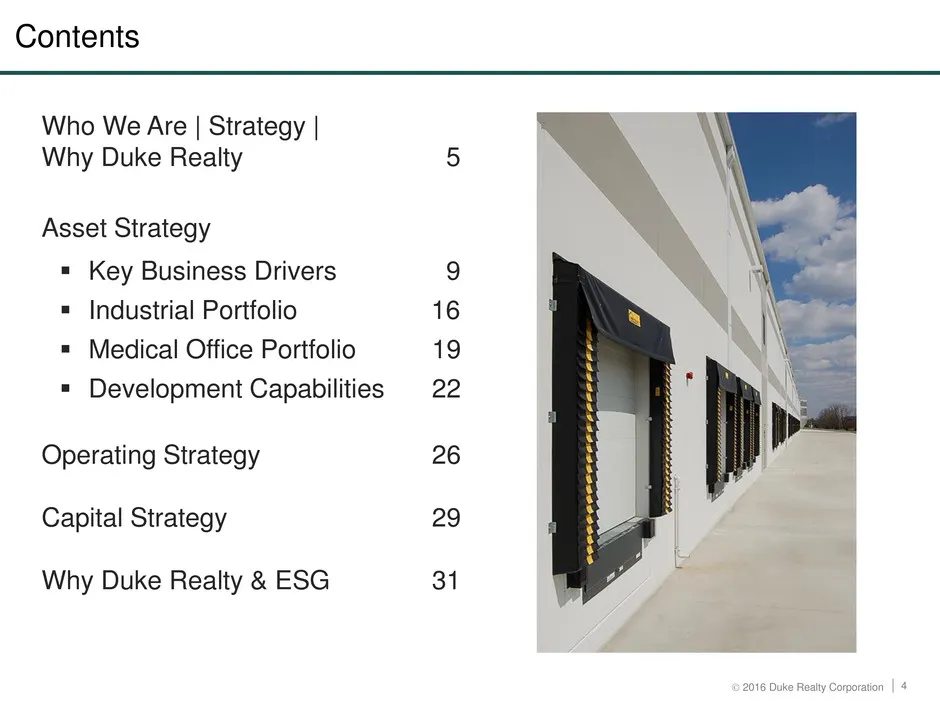
Contents Who We Are | Strategy | Why Duke Realty 5 Asset Strategy = Key Business Drivers 9 = Industrial Portfolio 16 = Medical Office Portfolio 19 = Development Capabilities 22 Operating Strategy 26 Capital Strategy 29 Why Duke Realty & ESG 31 2016 Duke Really Corporation | 4
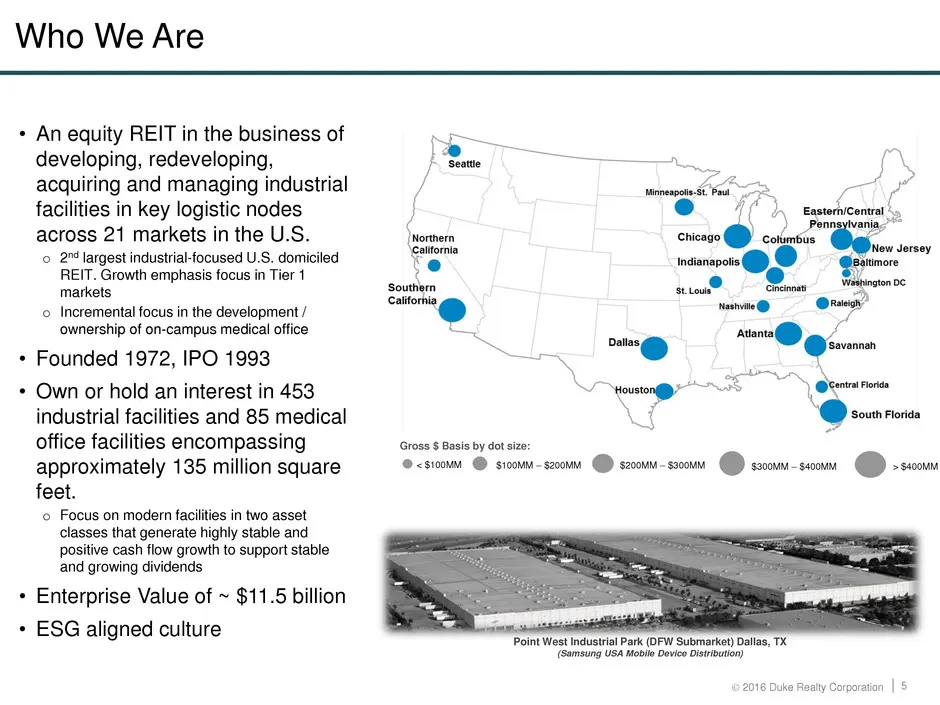
Slide 5: Who We Are
Who We Are + An equity REIT in the business of developing, redeveloping, acquiring and managing industrial facilities in key logistic nodes across 21 markets in the U.S. Snort © 2° largest industrial-focused U.S. domiciled fe. REIT Grote emphasis focus in Tier 1 Ka southern California ° Ine focus in
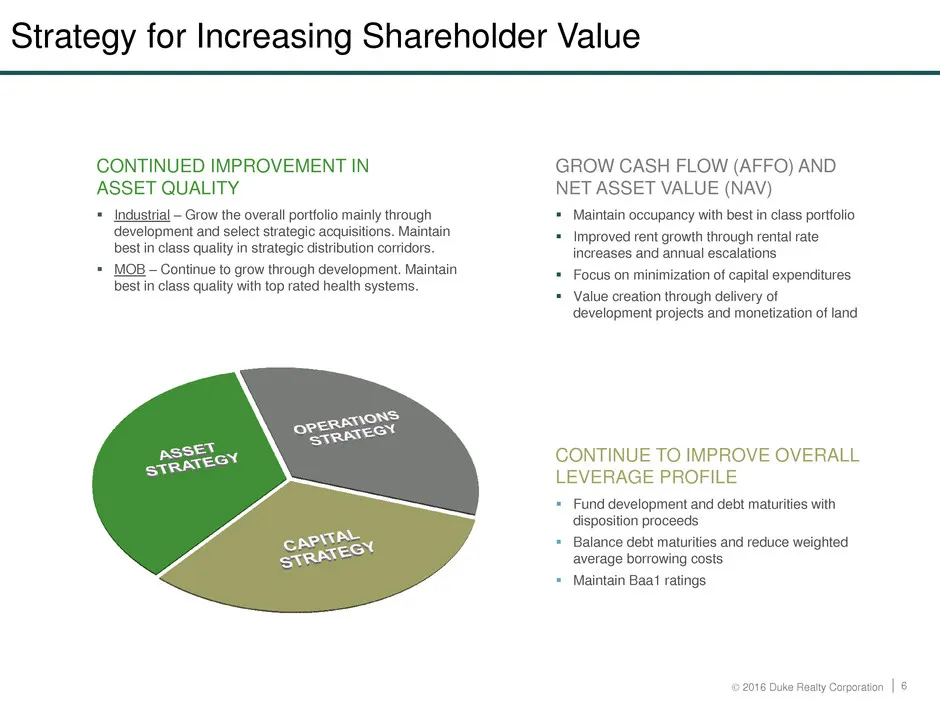
Slide 6: Strategy for Increasing Shareholder Value
Strategy for Increasing Shareholder Value CONTINUED IMPROVEMENT IN ASSET QUALITY the overall p nly throug! GROW CASH FLOW (AFFO) AND. NET ASSET VALUE (NAV) + Maintain occupancy with best in class portfolio Maint os in class ior in strategic distribution corridors. ie to grow through development. Mai
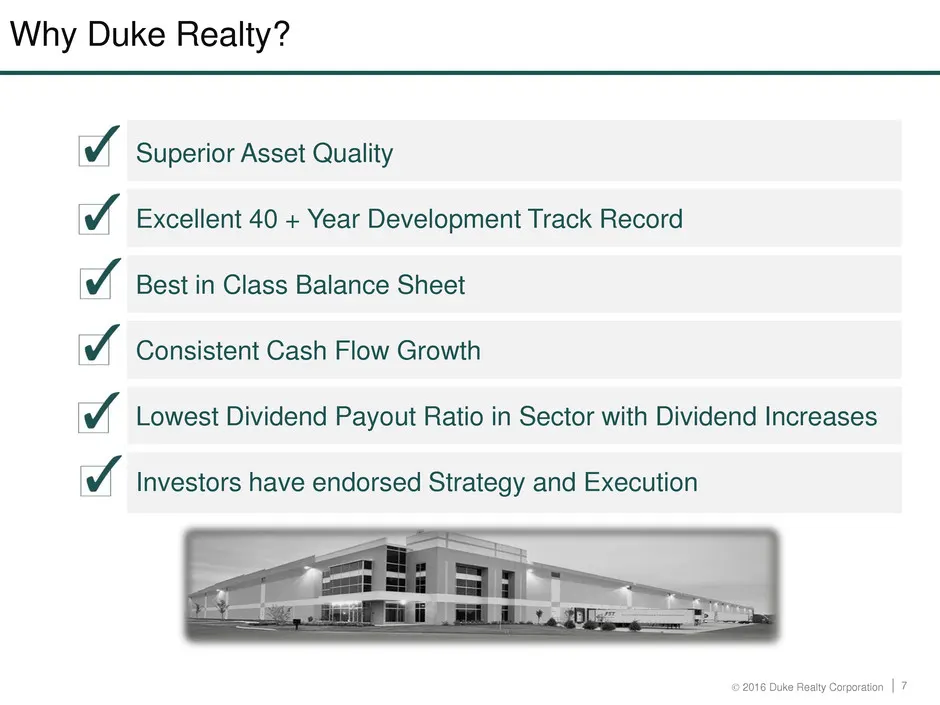
Slide 7: Why Duke Realty?
Why Duke Realty? ra Superior Asset Quality rA Excellent 40 + Year Development Track Record ra Best in Class Balance Sheet rA Consistent Cash Flow Growth ra Lowest Dividend Payout Ratio in Sector with Dividend Increases ra Investors have endorsed Strategy and Execution ly Corporation
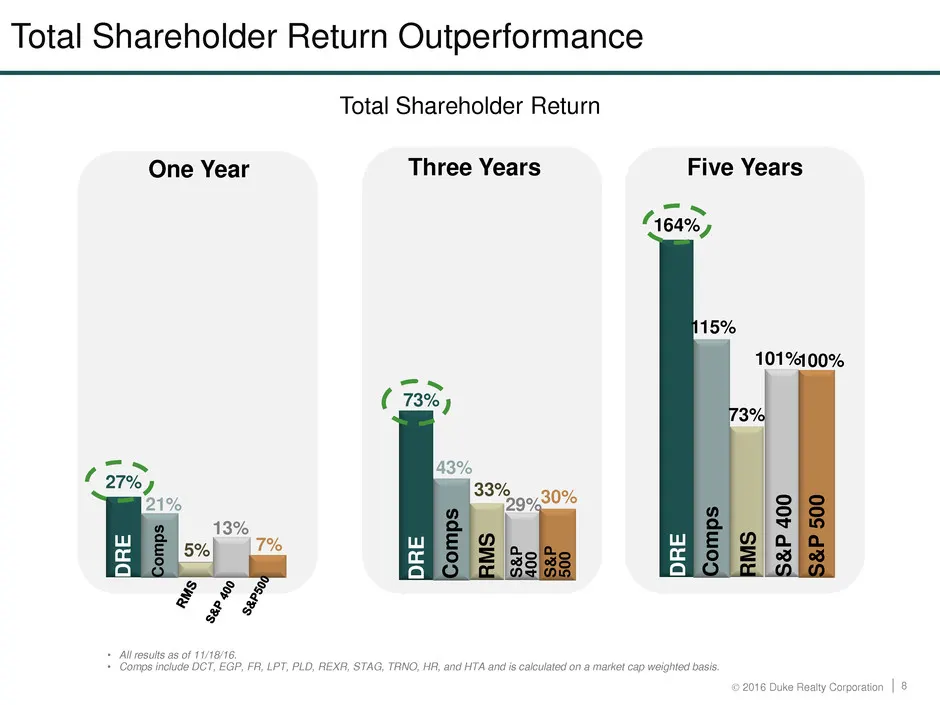
Slide 8: Total Shareholder Return Outperformance
Total Shareholder Return Outperformance Total Shareholder Return One Year Three Years Five Years eS 164%, 15% 101%100% ey ( 73%) 43% 33% 29%30% |&P 400
Slide 9: Key Industrial Business Drivers & State of the Market
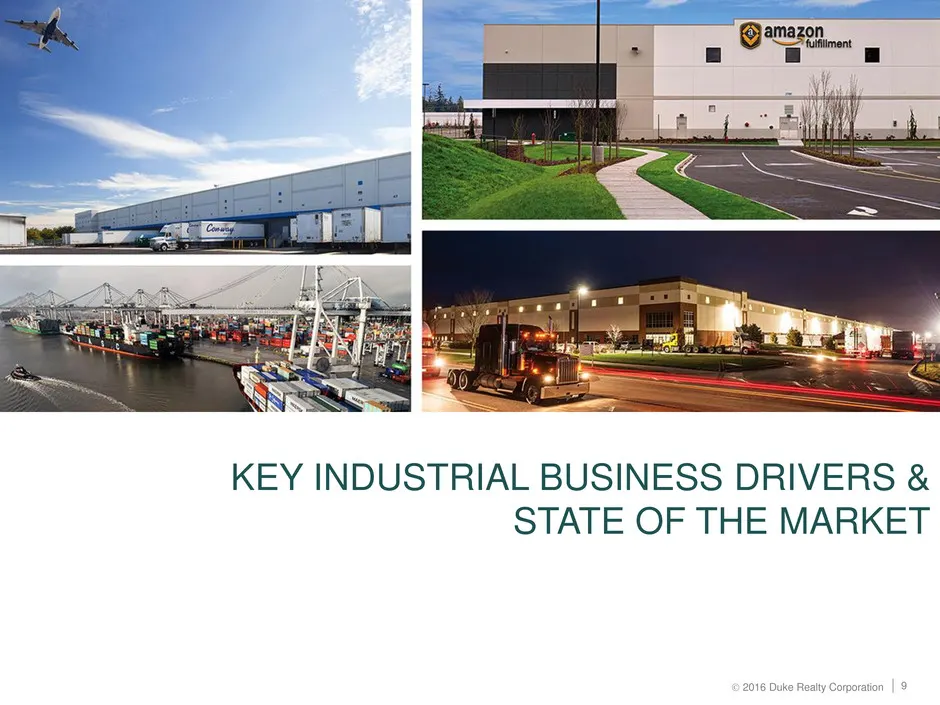
KEY INDUSTRIAL BUSINESS DRIVERS & STATE OF THE MARKET
Slide 10: DEMAND: Macroeconomic Indicators / Drivers
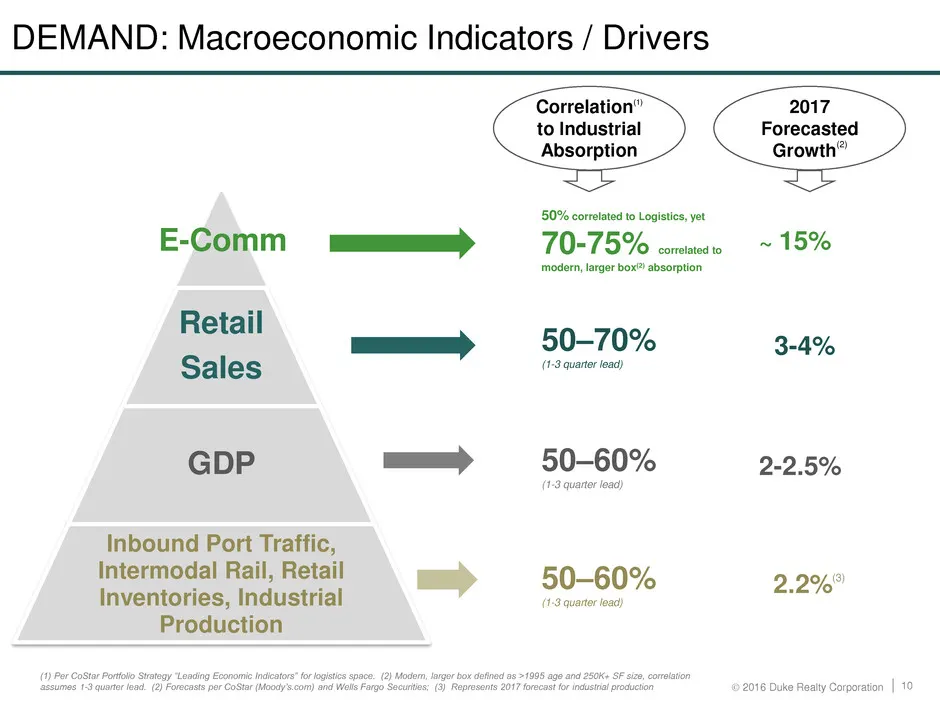
DEMAND: Macroeconomic Indicators / Drivers Correlation” to Industrial Absorption 2017 Forecasted Growth® a 50% correlated to Logistics, yet E-Comnm ===) 70-75% cominsso ~~ 15% ‘modern, larger box® absorption Retail —— 50-70% 3-4% Sales (3m GDP == 50-60% 2-2.5% Inbound Port Traffic, Intermodal Rail,
Slide 11: DEMAND: E-Commerce capturing larger portion of retail sales
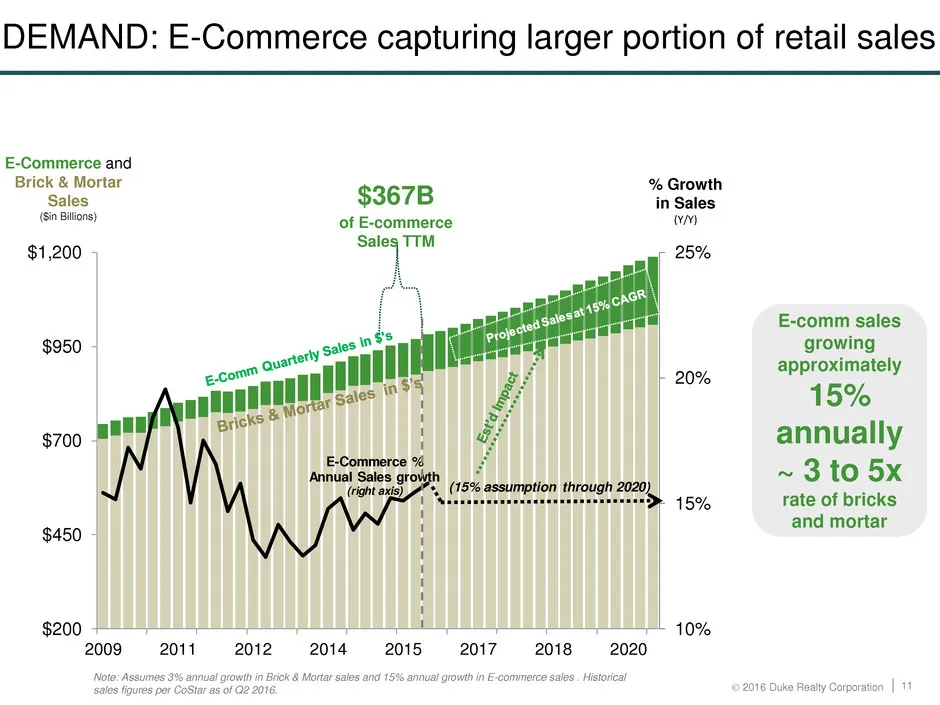
DEMAND: E-Commerce capturing larger portion of retail sales E-Commerce and Brick & Mortar % Growth Sales $367B in Sales (Gin Billions) OEcommeree: wn $1,200 - Sales TTM 25% E-comm sales $950 growing . approximately 20% a 15% 700 wae annually ~ 3 to 5x 15% rate of bricks $450 | and mortar $200 10% 20
Slide 12: DEMAND: New industrial SF needed to keep up with growth in e-commerce sales
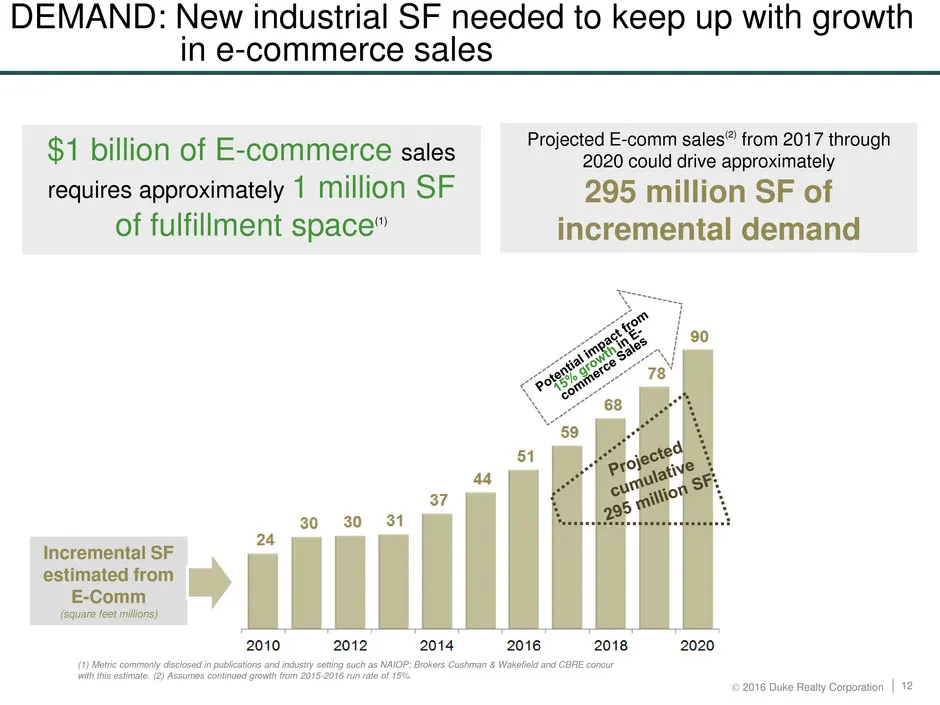
DEMAND: New industrial SF needed to keep up with growth in e-commerce sales ATA Projected E-comm sales” from 2017 through $1 billion of E-commerce sales BoaU Could ivetaccroxinetony requires approximately 1 million SF 295 million SF of of fulfillment space” incremental demand 30 30 24 Incremental SF
Slide 13: DEMAND: E-Commerce warehousing different from traditional distribution
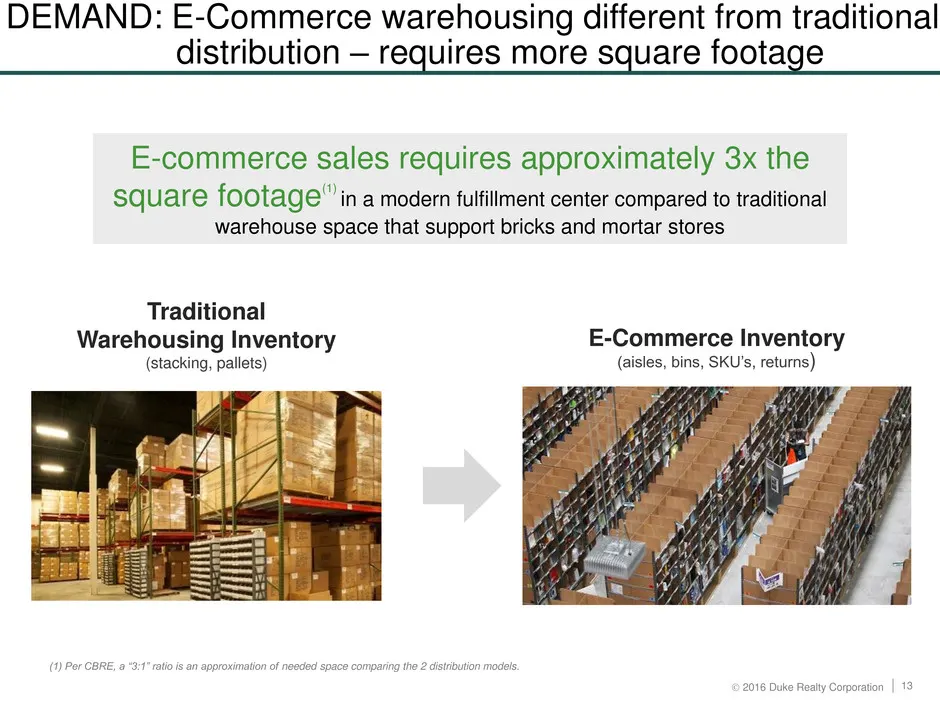
MAND: E-Commerce warehousing different from traditional distribution — requires more square footage E-commerce sales requires approximately 3x the square footage” in a modern fulfillment center compared to traditional warehouse space that support bricks and mortar stores Traditional Warehousing Inve
Slide 14: SUPPLY: Supply in better shape than last cycle
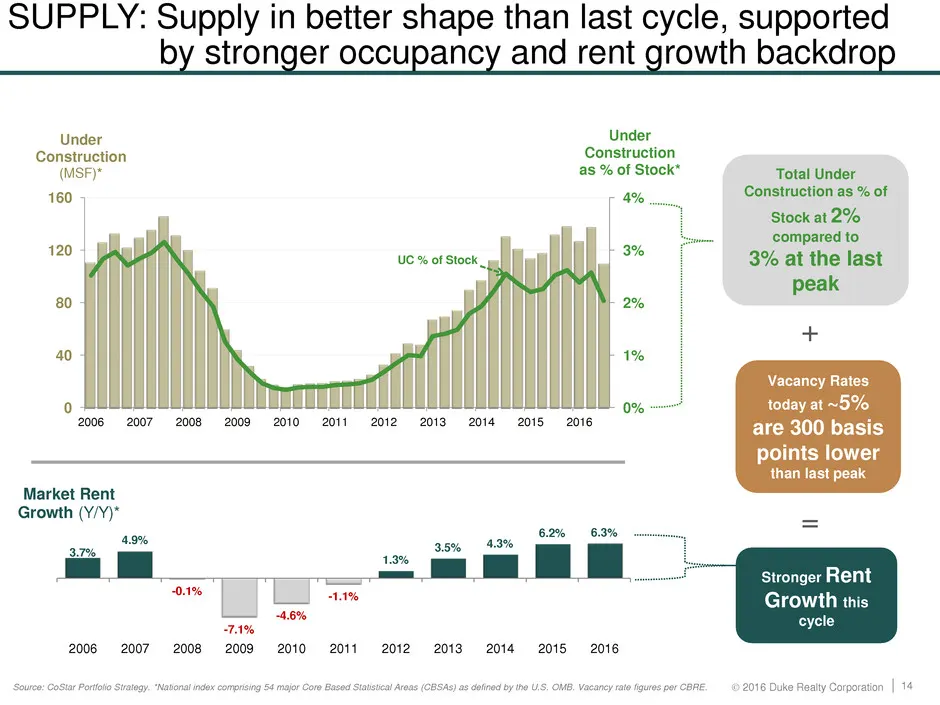
SUPPLY: Supply in better shape than last cycle, supported y stronger occupancy and rent growth backdrop Under : Construction Construction (SFY as % of Stock* 160 Total Under Construction as % of sa Stock at 2% compared to 120 UC % of Stock |, 3% at the last peak 80 af 40 Vacancy Rates today at ~5% 0
Slide 15: Leading the Nation in E-commerce Relationships
Leading the Nation in E-commerce Relationships amazon = Walmart>x a ENG wayfatr COUT carer's TARGET. RH crateapares *PMOCYS = BON'TON FLOOR = — Room&Board. weber FedEx GNC RY 7 @ Ops /:DSUPPLY GRAINGER. Innotrac ef
Slide 16: Asset Strategy: Industrial Portfolio
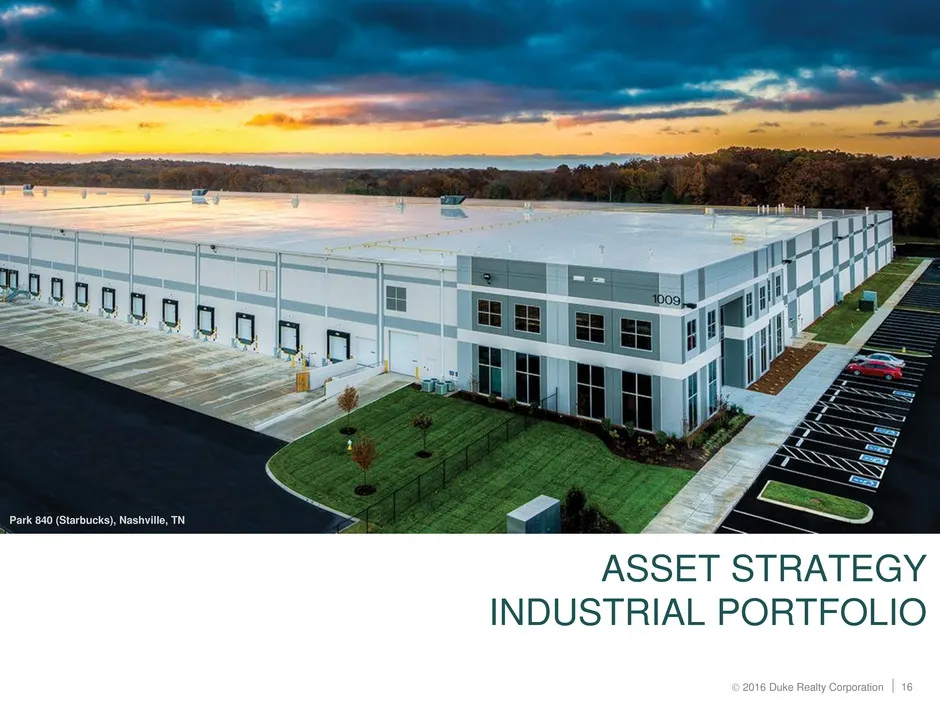
Park 840 (Starbucks), Nashville, TN ASSET STRATEGY INDUSTRIAL PORTFOLIO
Slide 17: Industrial Strategy
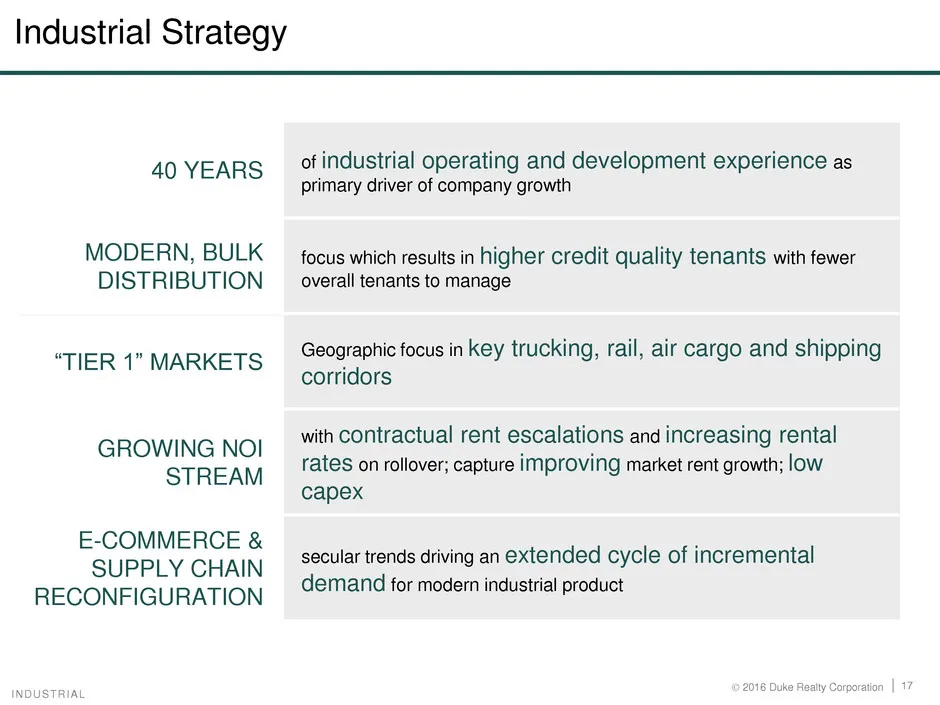
Industrial Strategy 40 YEARS * industrial operating and development experience as primary driver of company growth MODERN, BULK focus which results in higher credit quality tenants with fewer DISTRIBUTION __ overall tenants to manage “TIER 1” MARKETS Geographic focus in key trucking, rail, air cargo
Slide 18: Industrial Best in Class Portfolio
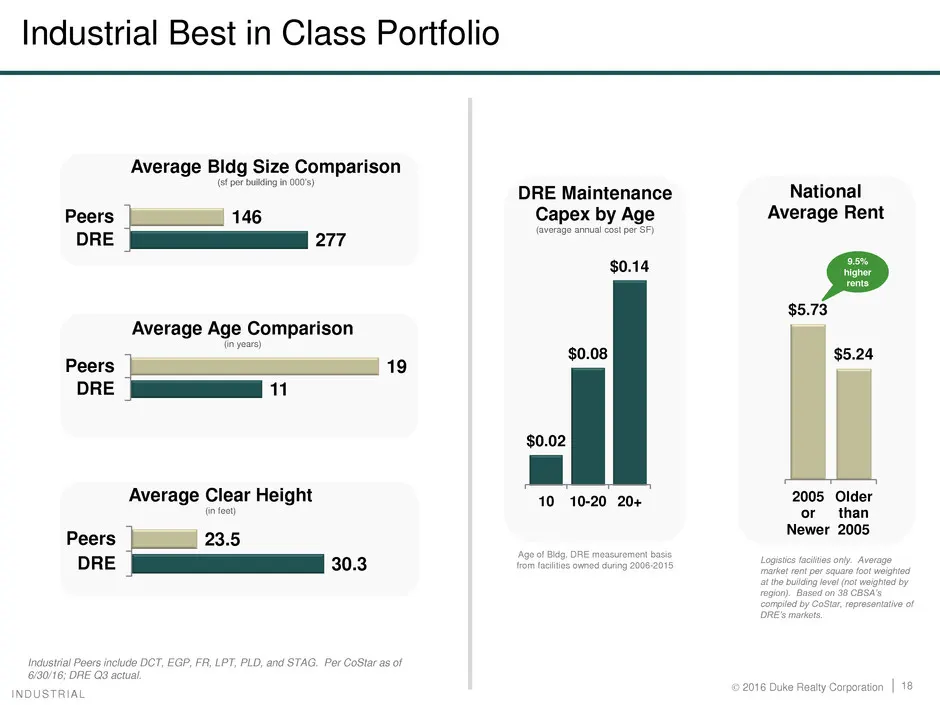
Industrial Best in Class Portfolio Average Bldg ' ize Comparison DRE Maintenance National Peers 146 Capex by Age Average Rent DRE or7 (overage anual cet pr $0.14 f=) $5.73 Average Age Comparison Te years) oo : Peers 19 * $524 DRE 1 $0.02 Average Clear Height 410 10-20 20+ 2005 Older (ates) Newer 200
Slide 19: Asset Strategy: Medical Office Portfolio
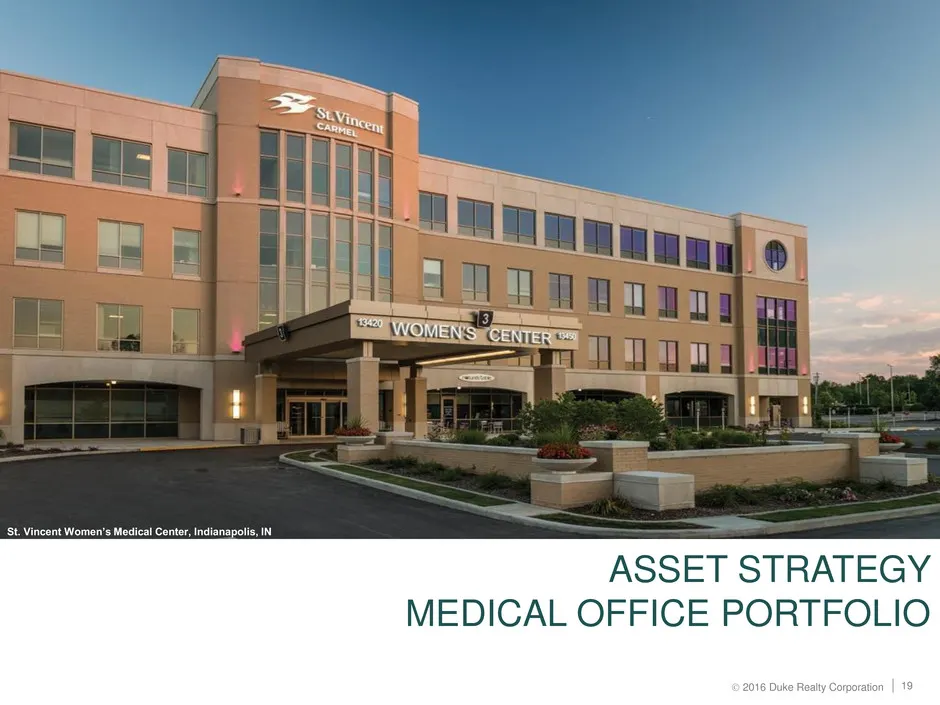
y I See ; a SEU WOWEN Sr CENTERS —— = ASSET STRATEGY MEDICAL OFFICE PORTFOLIO
Slide 20: Medical Office Platform Enhances Risk-adjusted Returns
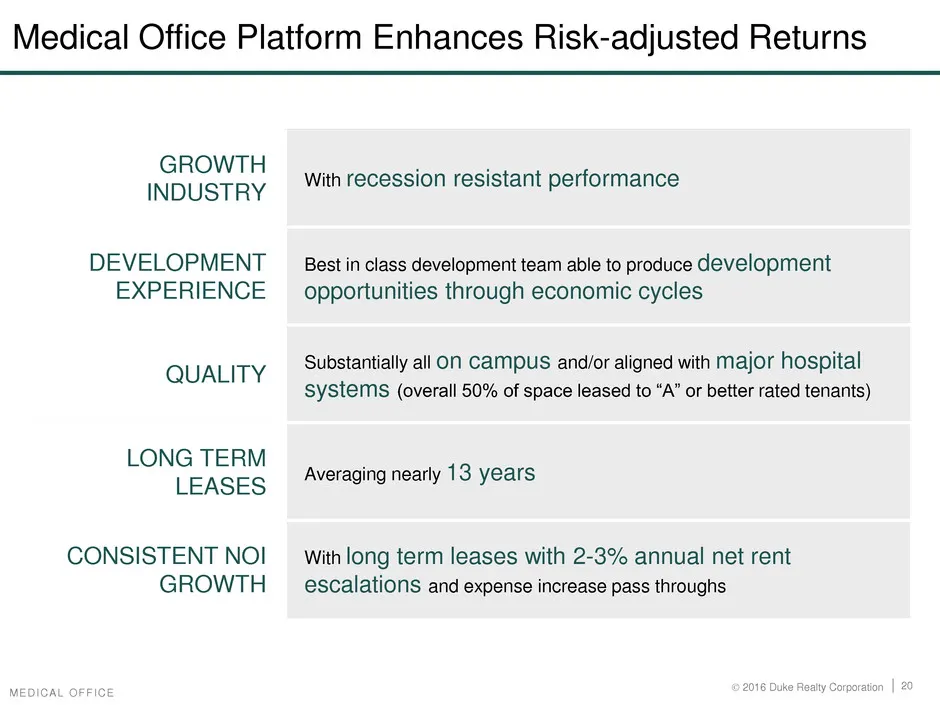
Medical Office Platform Enhances Risk-adjusted Returns GROWTH INDUSTRY DEVELOPMENT EXPERIENCE QUALITY LONG TERM LEASES CONSISTENT NOI GROWT! With recession resistant performance Best in class development team able to produce development opportunities through economic cycles Substantially all ON CAMP
Slide 21: Medical Office - Market Drivers
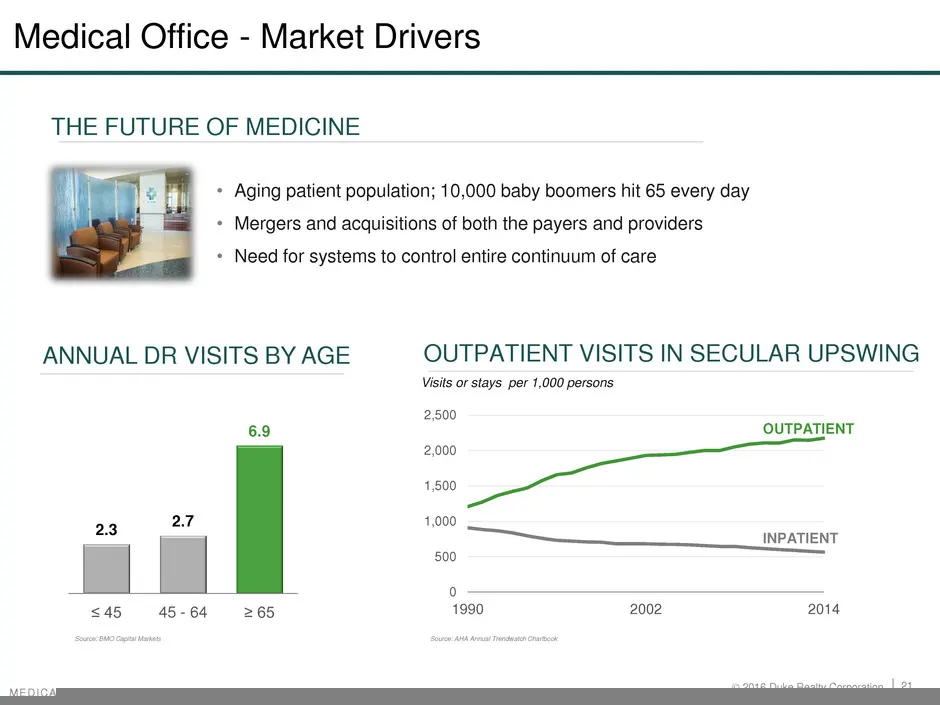
Medical Office - Market Drivers THE FUTURE OF MEDICINE + Aging patient population; 10,000 baby boomers hit 65 every day + Mergers and acquisitions of both the payers and providers - Need for systems to control entire continuum of care ANNUAL DR VISITS BY AGE OUTPATIENT VISITS IN SECULAR UPSWING Visi
Slide 22: Asset Strategy: Development Capabilities
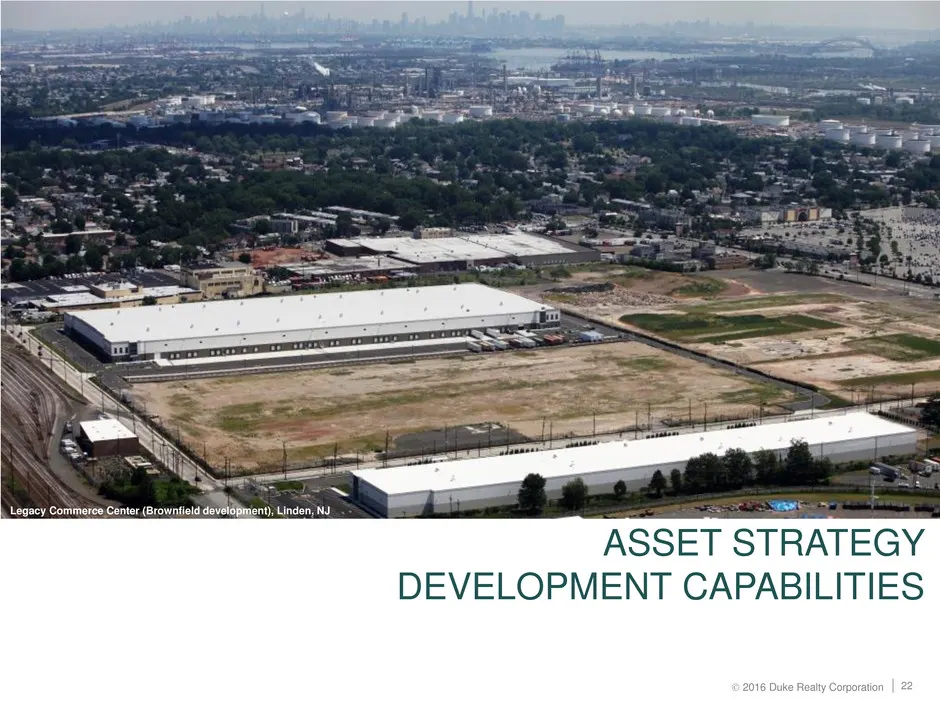
ASSET STRATEGY DEVELOPMENT CAPABILITIES
Slide 23: Development Strategic Advantages
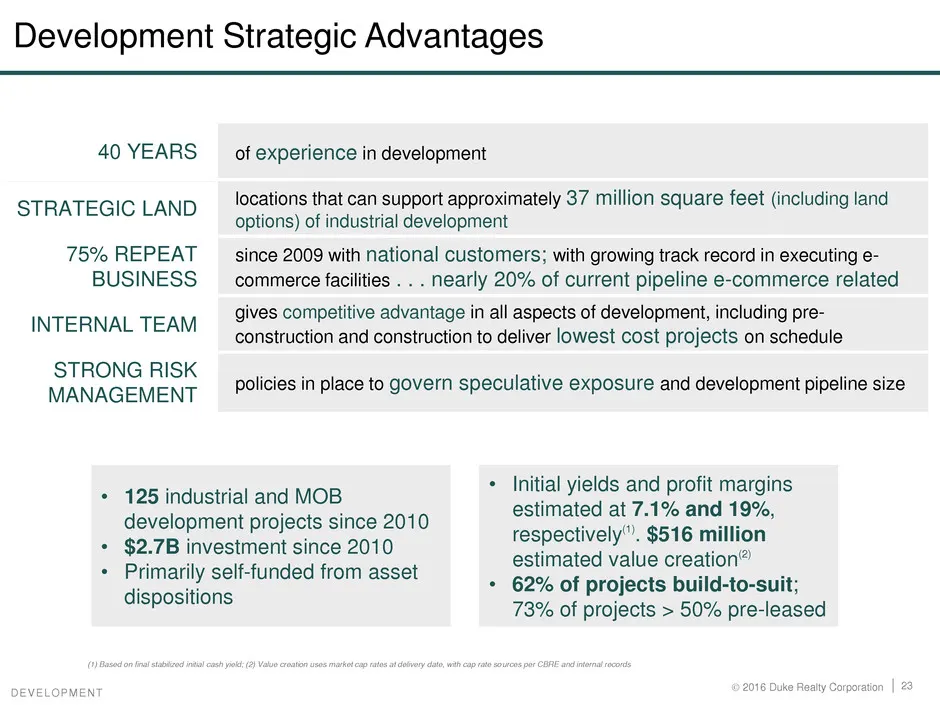
Development Strategic Advantages 40 YEARS STRATEGIC LAND 75% REPEAT BUSINESS INTERNAL TEAM STRONG RISK MANAGEMENT $2.7B inves’ Primarily sel dispositions 125 industrial and MOB development projects since 2010 of experience in development locations that can support approximately 37 million square fee
Slide 24: Select Recent Industrial Development Starts
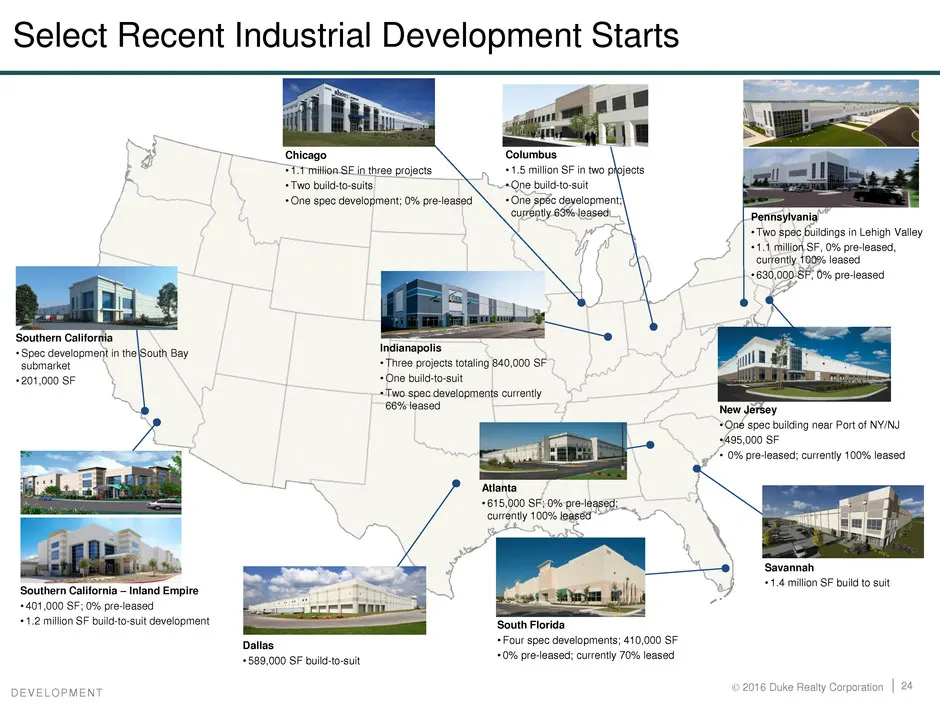
Select Recent Industrial Development Starts —_——_— Columbus _ Chicago + Two buld-to-suits Lge build to-suit + One spec development; 0% pre-leased *One spe cealonment curoaty ee Pennsyiva “Two on in yy Valley. rently. 1003 +680, ee leased Southern California “Ses dee Bara ey Indianapolis. submarket s
Slide 25: Speculative Development: Proven execution
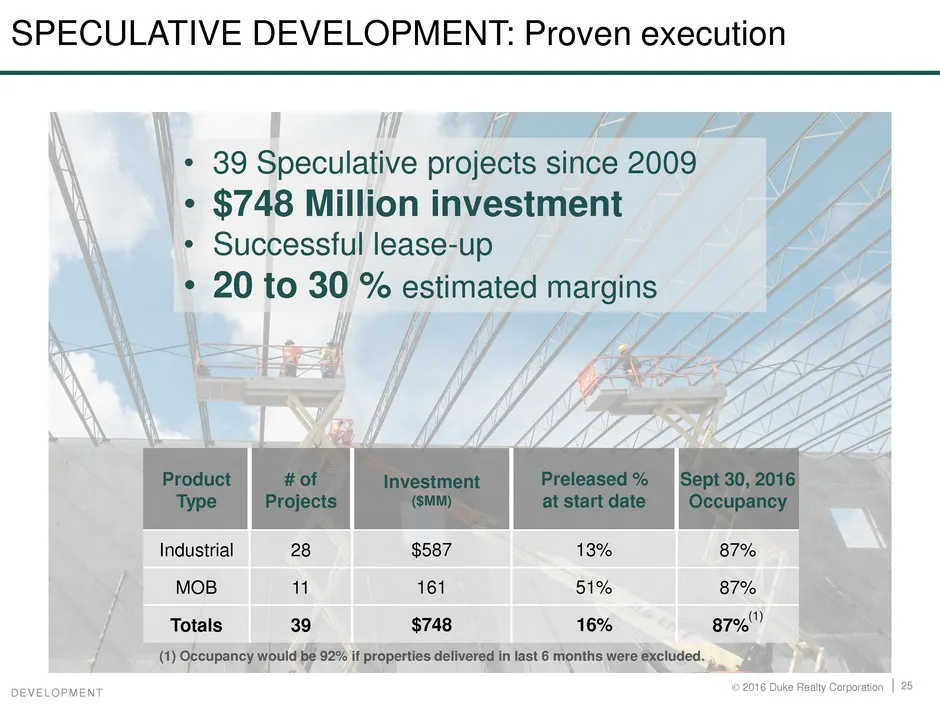
SPECULATIVE DEVELOPMENT: Proven execution \ \ 1) l/s n> ay '\* 39 Speculative projects since 2009 : ¢ $748 Million investment “+ Successful lease-up * 20 to 30% egies margins
Slide 26: Operating Strategy
Slide 27: Continuing NOI Growth to drive NAV Growth
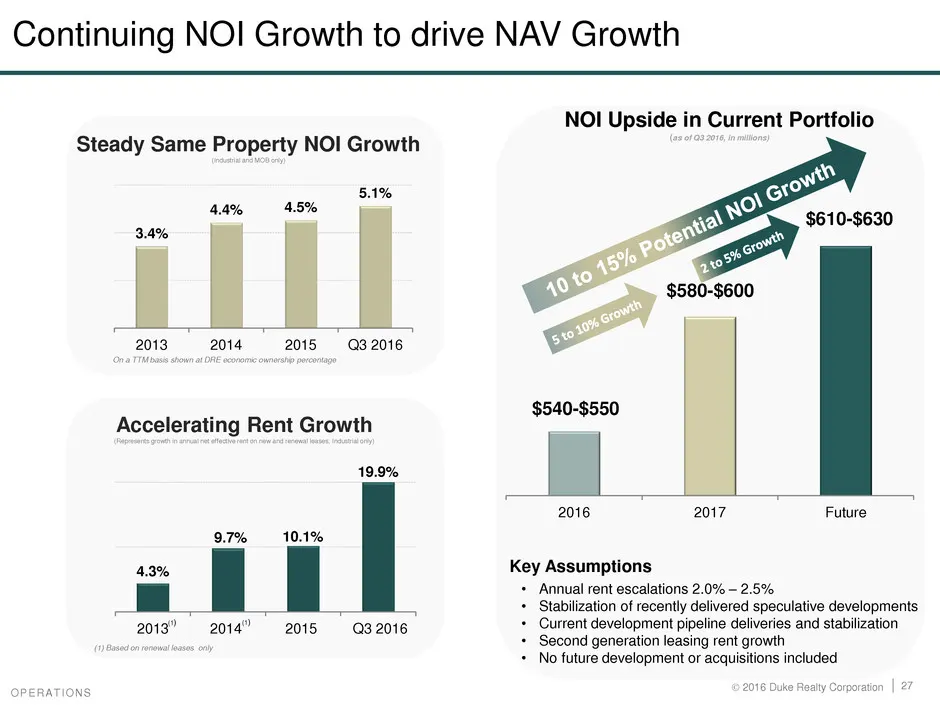
Continuing NOI Growth to drive NAV Growth NOI Upside in Current Portfolio Steady Same Property NOI Growth 5.1% 2013 2014 2015 = Q3. 2016 ; $540-$550 Accelerating Rent Growth 19.9% 2016 2017 Future 9.7% 10.1% 43% Key Assumptions \nnual rent escalations 2.0% — Stabilization of recently Con eats develo
Slide 28: Consistent Cash Flow Growth
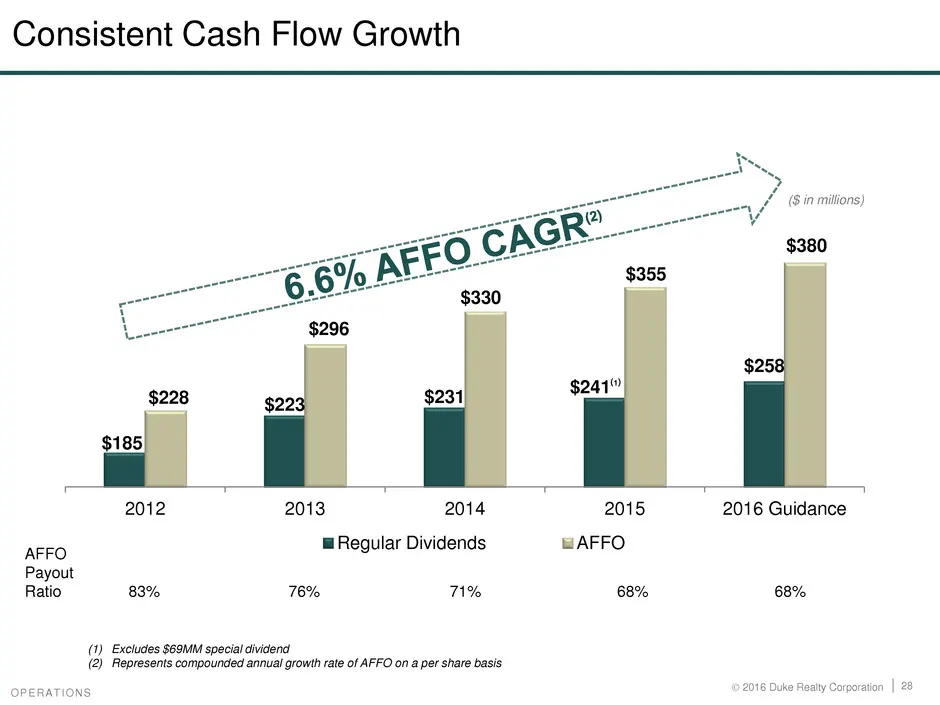
Consistent Cash Flow Growth b. > / ($in millions) $380 2012 2013 2014 2015 2016 Guidance AFFO @ Regular Dividends wAFFO Payout Ratio 83% 76% 1% 68% 68% (1) Excludes $69MM special dividend @ Realty Corporation | 28
Slide 29: Capital Strategy
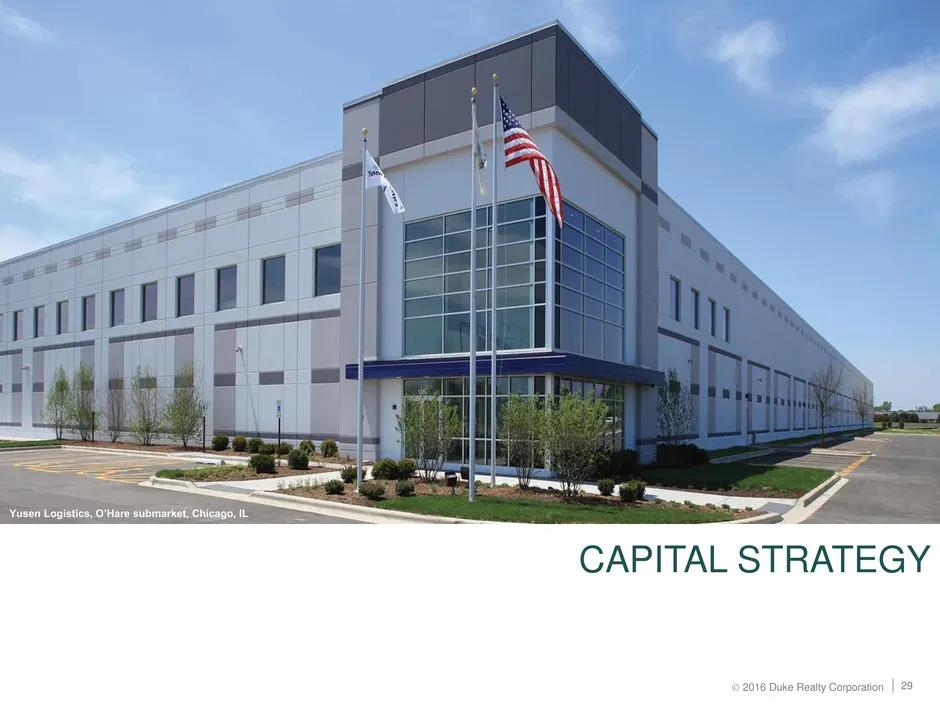
ie, | ane - CAPITAL STRATEGY
Slide 30: Conservative Balance Sheet
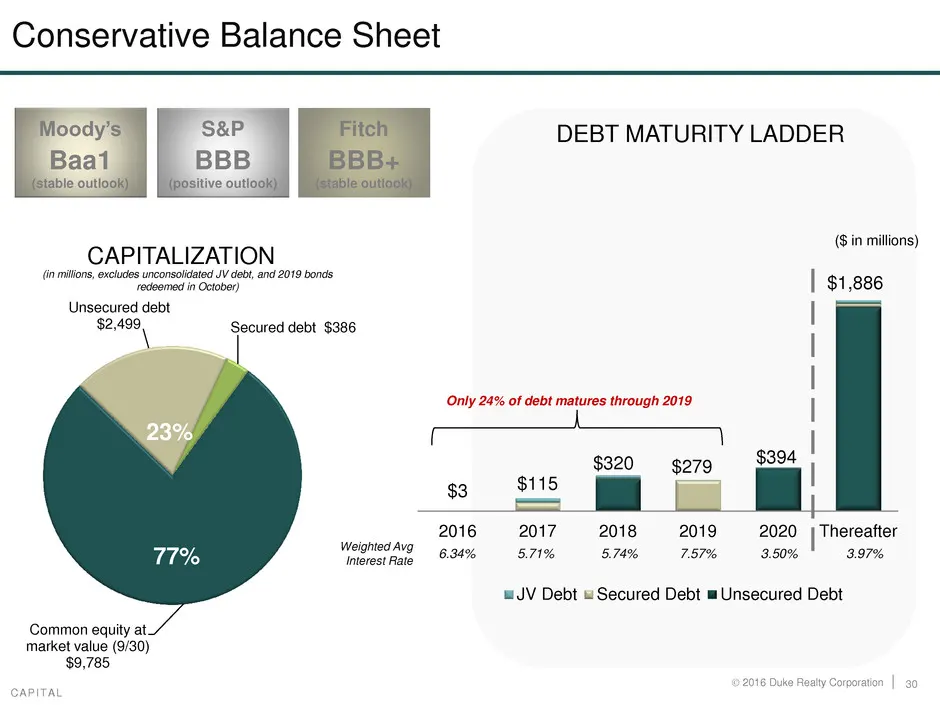
Conservative Balance Sheet DEBT MATURITY LADDER ler ata (Sin millions) nmin, exces uncnsldsed ce, ana 209 bonds s.286 Tinsseued Skt debt $2,499, Secured debt $386 Only 24% of debt matures through 2019 $320 $279 $115 2016 2017 2018 2019 2020 [ Mereatter 7% aNd 6.34% «5.71% 574% 7.57% Interest Rate JV
Slide 31: Why Duke Realty?
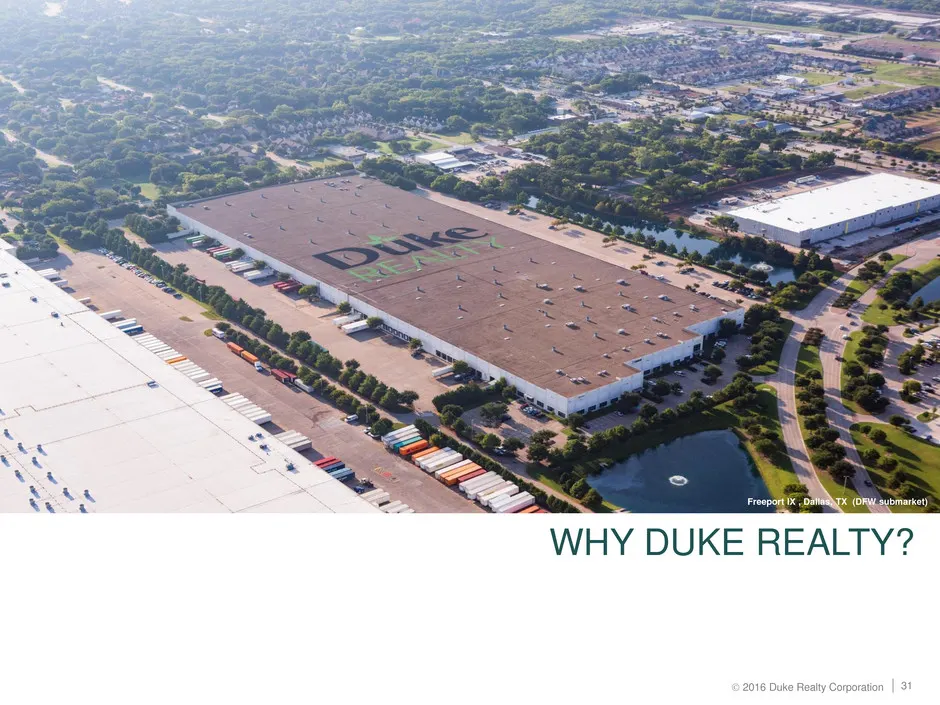
WHY DUKE REALTY?
Slide 32: Why Duke Realty?
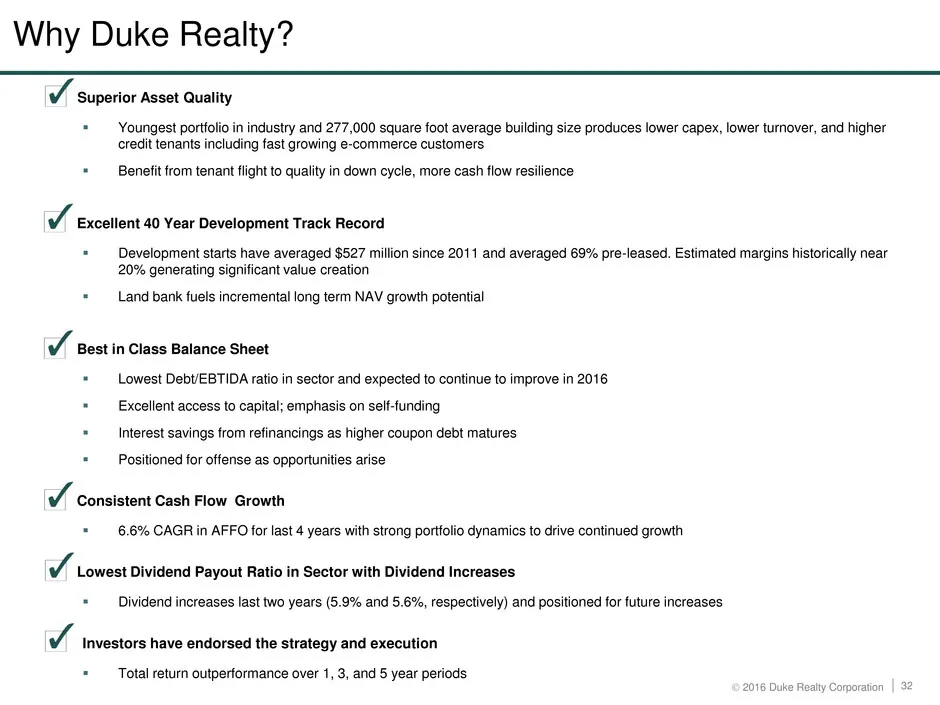
Why Duke Realty? ov Superior Asset Quality . and 277, i i capex, lower turnover, and higher 19 * Benefit from tenant flight to quality in down cycle, o Excellent 40 Year Development Track Record 20% generating significant value creation = Land bank fuels incremental long term NAV growth potential ov
Slide 33: Sustainability at Duke Realty
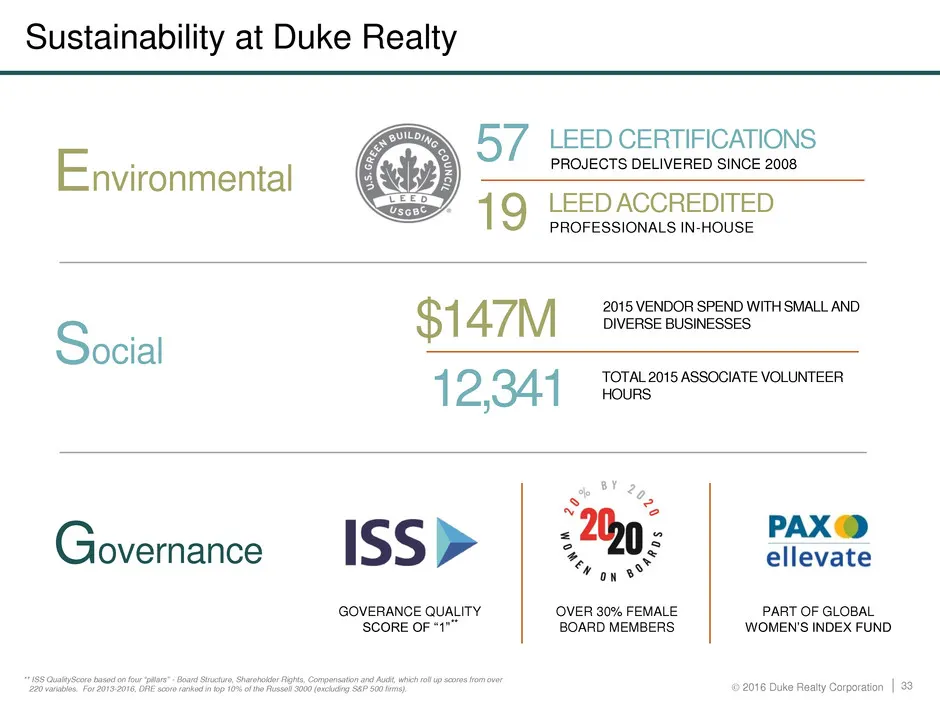
Sustainability at Duke Realty LEED CERTIFICATIONS PROJECTS DELIVERED SINCE 2008 LEED ACCREDITED PROFESSIONALS IN-HOUSE Environmental 2015 VENDOR SPEND WITH SMALL AND DIVERSE BUSINESSES S ocial TOTAL 2015 ASSOCIATE VOLUNTEER 5 HOURS Governance ISS > +20: Hee te, S 4 on v® GOVERANCE QUALITY OVER 30% F
Slide 34: CoStar Disclaimer
CoStar Disclaimer THESE COSTAR PORTFOLIO STRATEGY MATERIALS CONTAIN FINANCIAL AND OTHER, INFORMATION FROM A VARIETY OF PUBLIC AND PROPRIETARY SOURCES. COSTAR GROUP, INC. AND ITS AFFILIATES (COLLECTIVELY, “COSTAR”) HAVE ASSUMED AND RELIED UPON, WITHOUT INDEPENDENT VERIFICATION, THE ACCURACY AND COMPL
Slide 35: Definitions
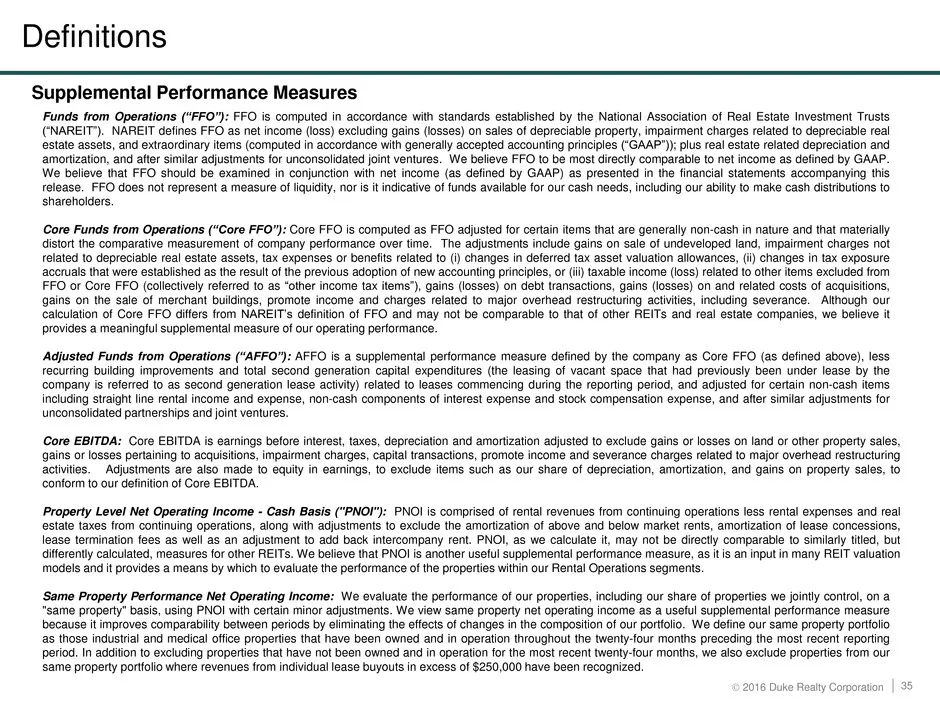
Definitions Supplemental Performance Measures Funds from Operations ("FO"): FFO is computed in accordance with standards established by the National Association of Real Estate Investment Trusts CNAREIT). NAREIT (/GAAP") sreriesion ans Wo bolowe nal FFO should be/eramned in conuncton wit net eam (as
Slide 36: FFO, Core FFO and AFFO
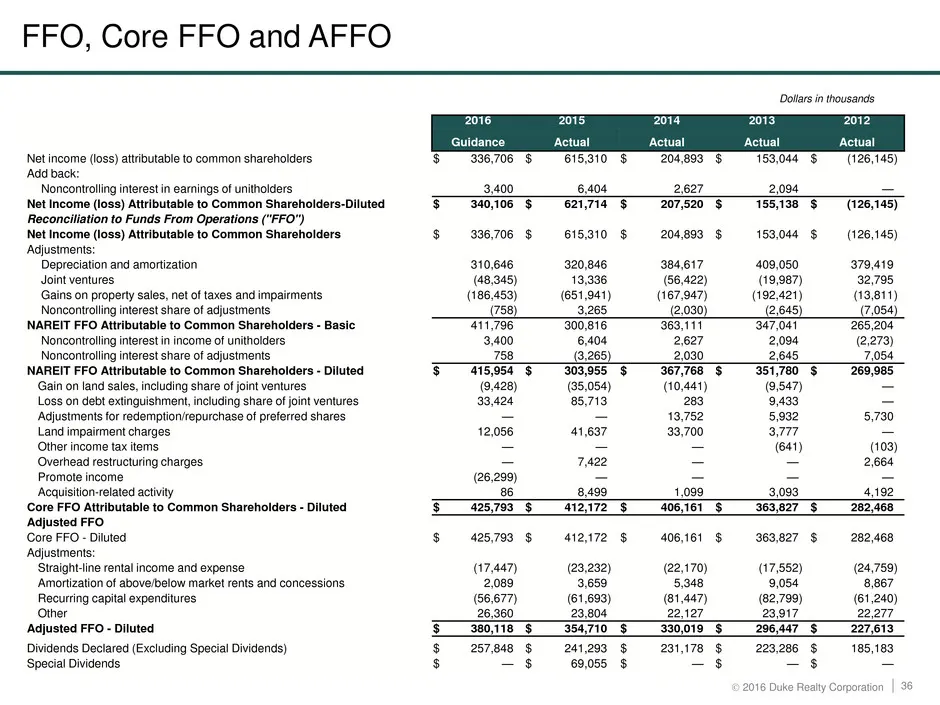
FFO, Core FFO and AFFO Net income (loss) attributable to common shareholders ‘Add back: Noncontrollig interest in earnings of unitholders Reconciliation to Funds From Operations ("FFO") Adjustments: Depreciation and amortization Joint ventures Gains on property sales, net of taxes and impairments No
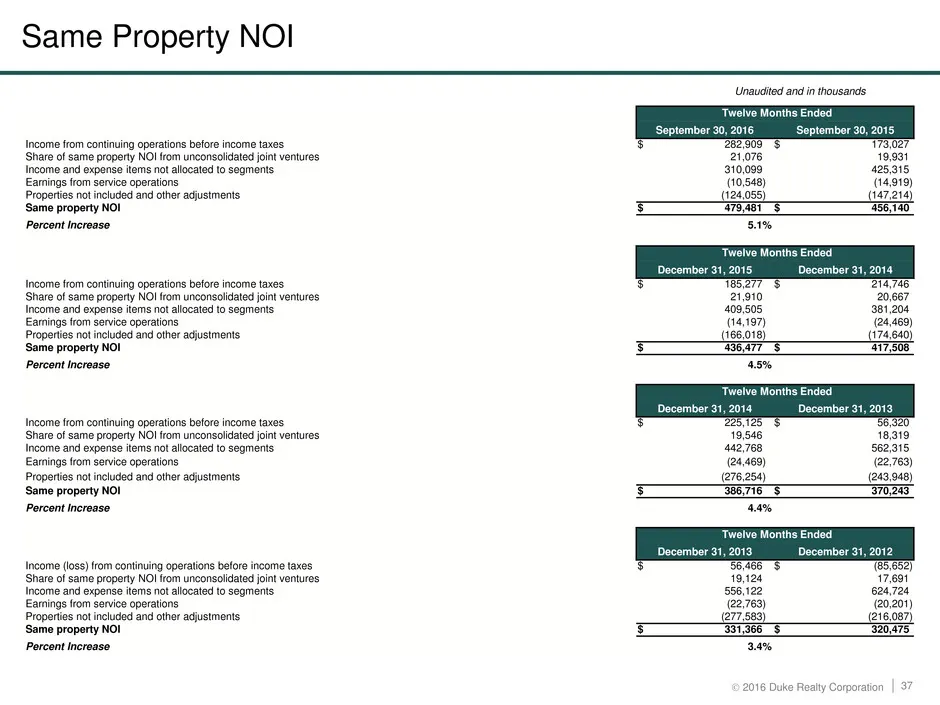
Slide 37: Same Property NOI
Same Property NOI Unaudited and in thousands Income from continuing operations before income Share of sam property NO! Kom ucenslaated ee ventures pense items not allocated to segments Eamungs fom sovice operations Properties not included and other adjustments ‘Same property NO! “Twelve Months Ended
Source: SEC EDGAR · 8-K filed Nov 29, 2016
More decks from Duke Realty Corporation
 Merger or Acquisition (June 2022)14 slides · Jun 13, 2022
 Investor Presentation (June 2021)58 slides · Jun 7, 2021
 Investor Presentation (May 2021)44 slides · May 10, 2021
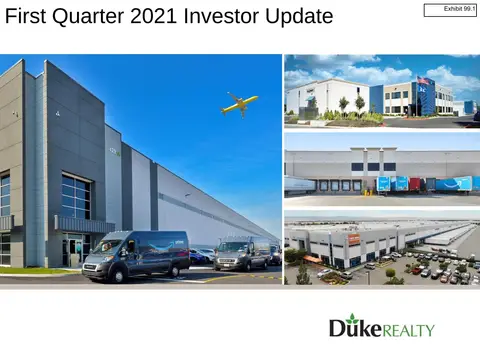 Investor Presentation (February 2021)58 slides · Feb 22, 2021
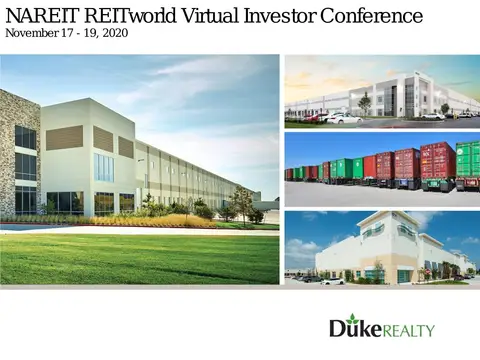 NAREIT REITworld Virtual Investor Conference 202056 slides · Nov 16, 2020
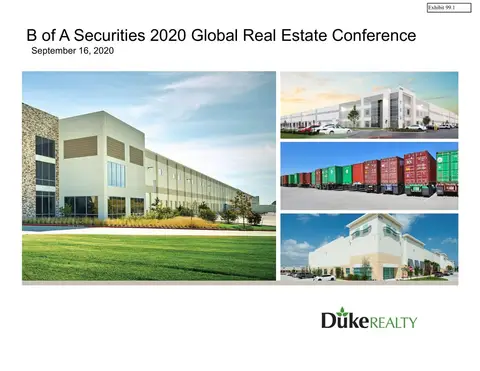 B of A Securities 2020 Global Real Estate Conference56 slides · Sep 15, 2020