Village Bank and Trust Financial
Village Bank and Trust Financial — Q2 2019 Earnings Presentation
21 slides from Village Bank and Trust Financial's earnings presentation, Aug 6, 2019
Slide 1: You're a Neighbor, Not a Number: Q2 2019 Investor Presentation
You're a Neighbor, Not a Number Q2 201 9 Investor Presentation Exhibit 99.1
Slide 2: Cautionary Statement Regarding Forward-Looking Statements
Cautionary Statement Regarding Forward - Looking Statements This presentation contains forward - looking statements within the meaning of the Private Securities Litigation Reform Act of 1995. These forward - looking statements include, but are not limited to, statements about (i) the Company’s plans
Slide 3: Non-GAAP Financial Measures
Non - GAAP Financial Measures The accounting and reporting polices of the Company conform to generally accepted accounting principles (“GAAP”) in the United States and prevailing practices in the banking industry. However, management uses certain non - GAAP measures to supplement the evaluation of t
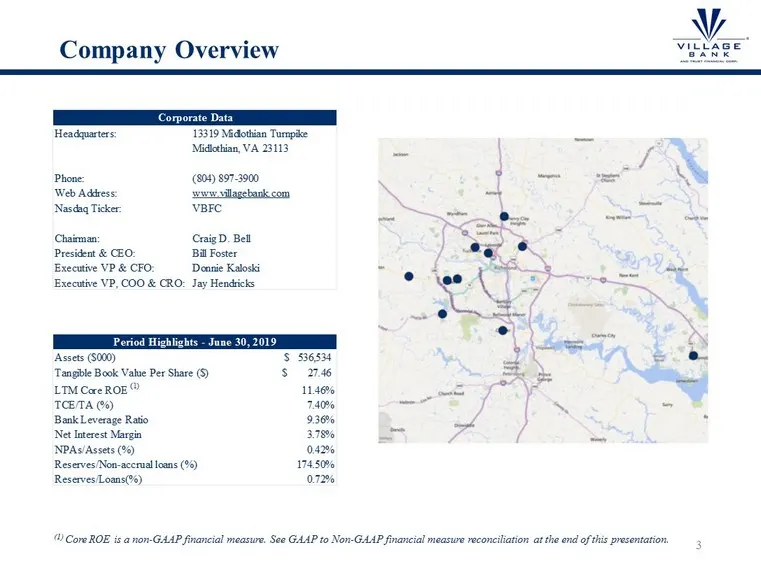
Slide 4: Company Overview
Company Overview Assets ($000) 536,534$ Tangible Book Value Per Share ($) 27.46$ LTM Core ROE (1) 11.46% TCE/TA (%) 7.40% Bank Leverage Ratio 9.36% Net Interest Margin 3.78% NPAs/Assets (%) 0.42% Reserves/Non-accrual loans (%) 174.50% Reserves/Loans(%) 0.72% Period Highlights - June 30, 2019 Headqua
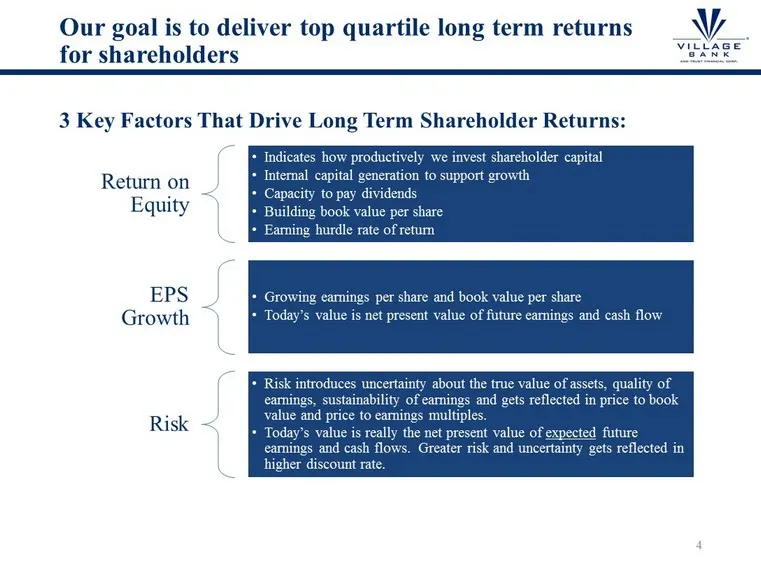
Slide 5: Our goal is to deliver top quartile long term returns for shareholders
Our goal is to deliver top quartile l ong t erm returns for shareholders Return on Equity • Indicates how productively we invest shareholder capital • Internal capital generation to support growth • Capacity to pay dividends • Building book value per share • Earning hurdle rate of return EPS Growth
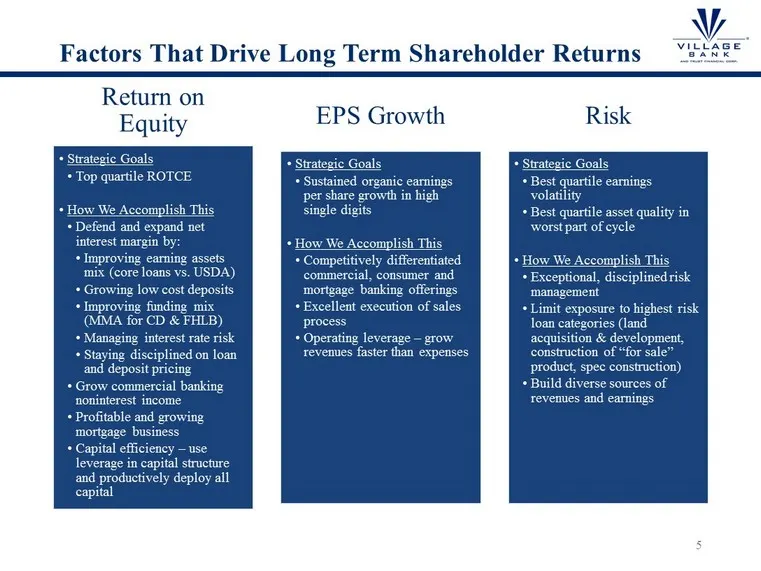
Slide 6: Factors That Drive Long Term Shareholder Returns
Factors That Drive Long Term Shareholder Returns Return on Equity • Strategic Goals • Top quartile ROTCE • How We Accomplish This • Defend and expand net interest margin by: • Improving earning assets mix (core loans vs. USDA) • Growing low cost deposits • Improving funding mix (MMA for CD & FHLB) •
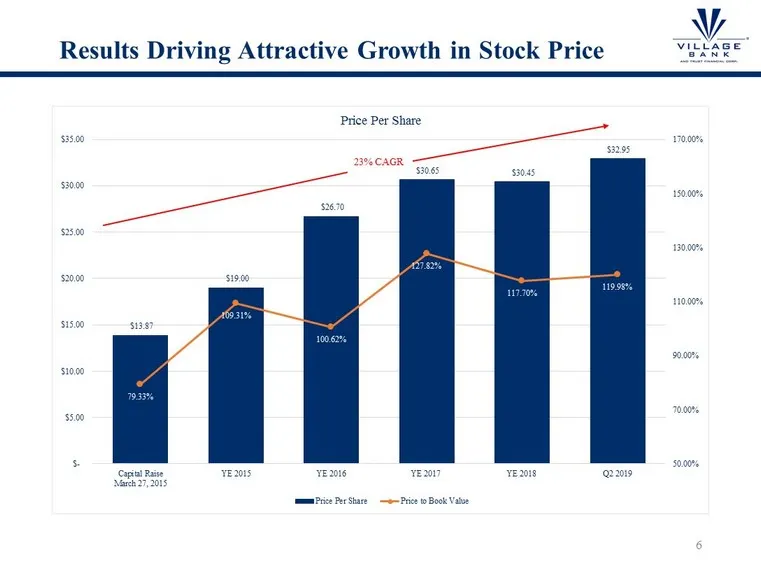
Slide 7: Results Driving Attractive Growth in Stock Price
Results Driving Attractive Growth in Stock Price $13.87 $19.00 $26.70 $30.65 $30.45 $32.95 79.33% 109.31% 100.62% 127.82% 117.70% 119.98% 50.00% 70.00% 90.00% 110.00% 130.00% 150.00% 170.00% $- $5.00 $10.00 $15.00 $20.00 $25.00 $30.00 $35.00 Capital Raise March 27, 2015 YE 2015 YE 2016 YE 2017 YE 20
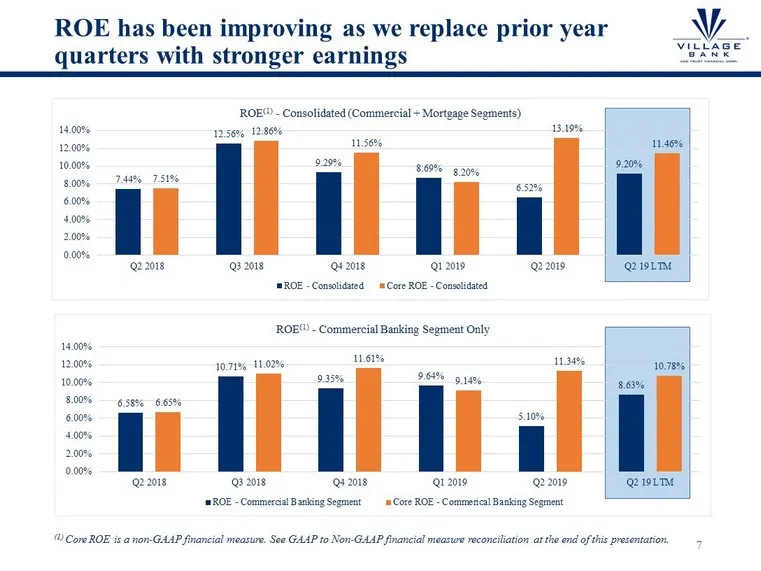
Slide 8: ROE has been improving as we replace prior year quarters with stronger earnings
ROE has been improving as we replace prior year quarters with stronger earnings (1) Core ROE is a non - GAAP financial measure. See GAAP to Non - GAAP financial measure reconciliation at the end of this presentation. 7.44% 12.56% 9.29% 8.69% 6.52% 9.20% 7.51% 12.86% 11.56% 8.20% 13.19% 11.46% 0.00%
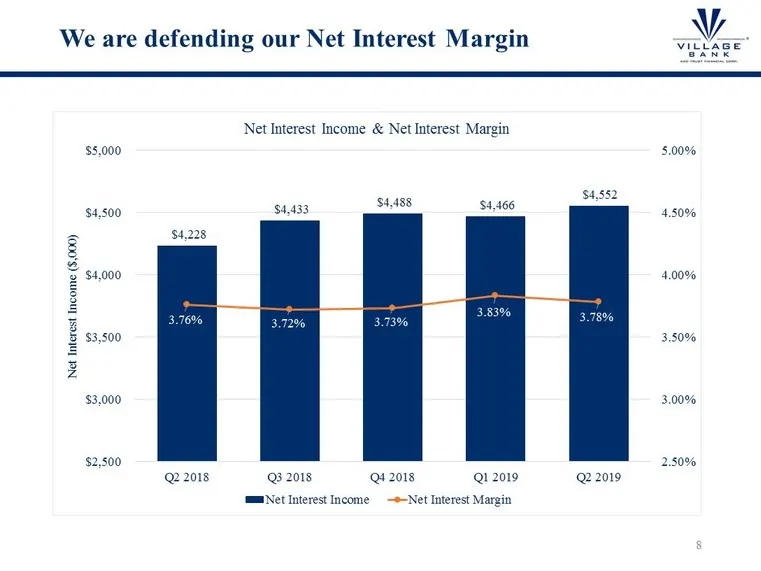
Slide 9: We are defending our Net Interest Margin
We are defending our Net Interest Margin $4,228 $4,433 $4,488 $4,466 $4,552 3.76% 3.72% 3.73% 3.83% 3.78% 2.50% 3.00% 3.50% 4.00% 4.50% 5.00% $2,500 $3,000 $3,500 $4,000 $4,500 $5,000 Q2 2018 Q3 2018 Q4 2018 Q1 2019 Q2 2019 Net Interest Income ($,000) Net Interest Income & Net Interest Margin Net In
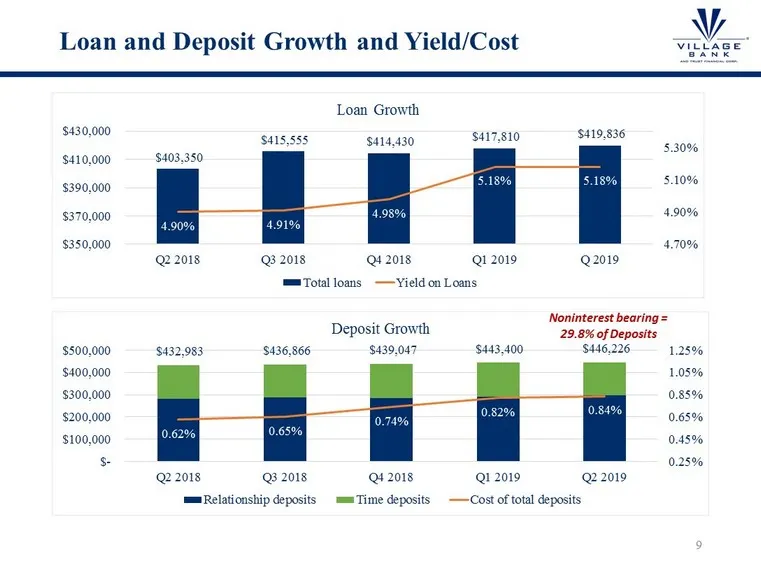
Slide 10: Loan and Deposit Growth and Yield/Cost
Loan and Deposit Growth and Yield/Cost $403,350 $415,555 $414,430 $417,810 $419,836 4.90% 4.91% 4.98% 5.18% 5.18% 4.70% 4.90% 5.10% 5.30% $350,000 $370,000 $390,000 $410,000 $430,000 Q2 2018 Q3 2018 Q4 2018 Q1 2019 Q 2019 Loan Growth Total loans Yield on Loans $432,983 $436,866 $439,047 $443,400 $44
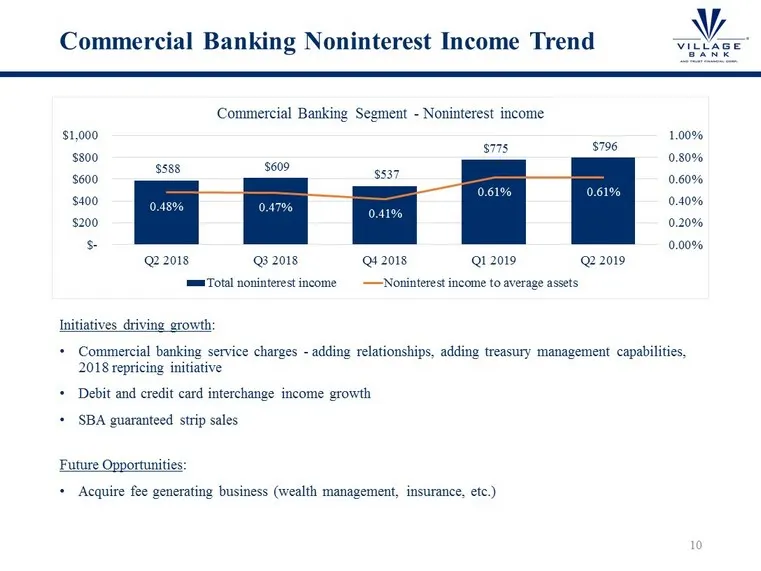
Slide 11: Commercial Banking Noninterest Income Trend
Commercial Banking Noninterest Income Trend $588 $609 $537 $775 $796 0.48% 0.47% 0.41% 0.61% 0.61% 0.00% 0.20% 0.40% 0.60% 0.80% 1.00% $- $200 $400 $600 $800 $1,000 Q2 2018 Q3 2018 Q4 2018 Q1 2019 Q2 2019 Commercial Banking Segment - Noninterest income Total noninterest income Noninterest income to
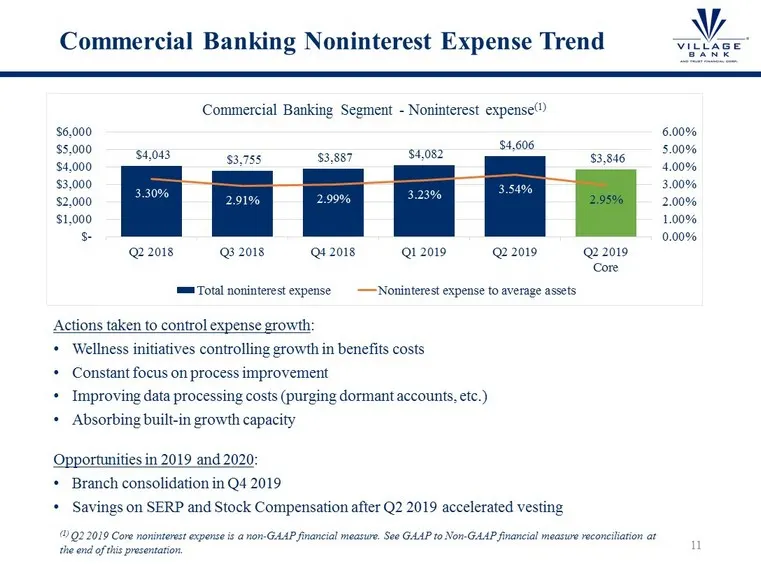
Slide 12: Commercial Banking Noninterest Expense Trend
Commercial Banking Noninterest Expense Trend $4,043 $3,755 $3,887 $4,082 $4,606 $3,846 3.30% 2.91% 2.99% 3.23% 3.54% 2.95% 0.00% 1.00% 2.00% 3.00% 4.00% 5.00% 6.00% $- $1,000 $2,000 $3,000 $4,000 $5,000 $6,000 Q2 2018 Q3 2018 Q4 2018 Q1 2019 Q2 2019 Q2 2019 Core Commercial Banking Segment - Noninter
Slide 13: Drivers of noninterest expense improvement
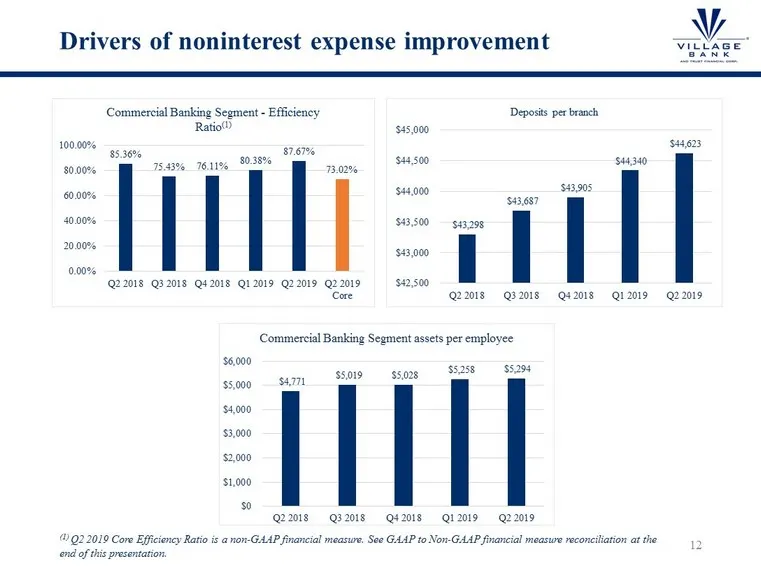
Drivers of noninterest expense improvement $43,298 $43,687 $43,905 $44,340 $44,623 $42,500 $43,000 $43,500 $44,000 $44,500 $45,000 Q2 2018 Q3 2018 Q4 2018 Q1 2019 Q2 2019 Deposits per branch (1) Q2 2019 Core Efficiency Ratio is a non - GAAP financial measure. See GAAP to Non - GAAP financial measure
Slide 14: Mortgage Banking Segment
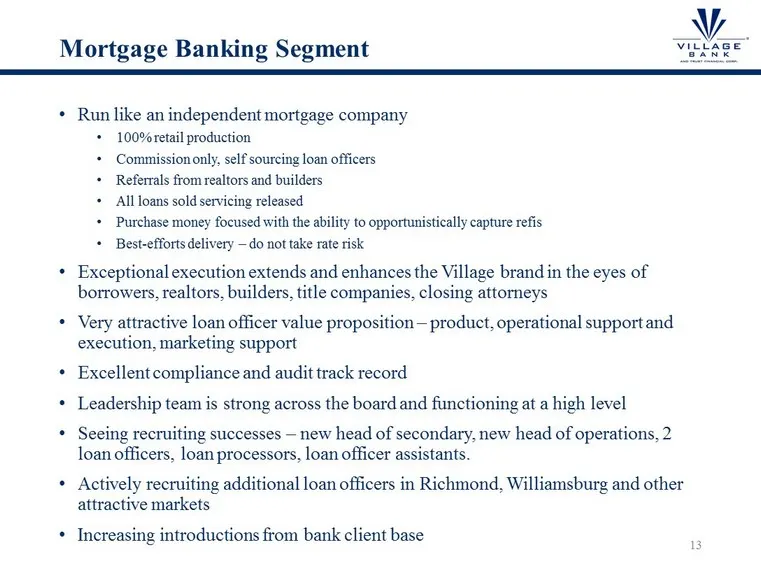
Mortgage Banking Segment • Run like an independent mortgage company • 100% retail production • Commission only, self sourcing loan officers • Referrals from realtors and builders • A ll loans sold servicing released • Purchase money focused with the ability to opportunistically capture refis • Best
Slide 15: Credit costs have a material impact on shareholder returns
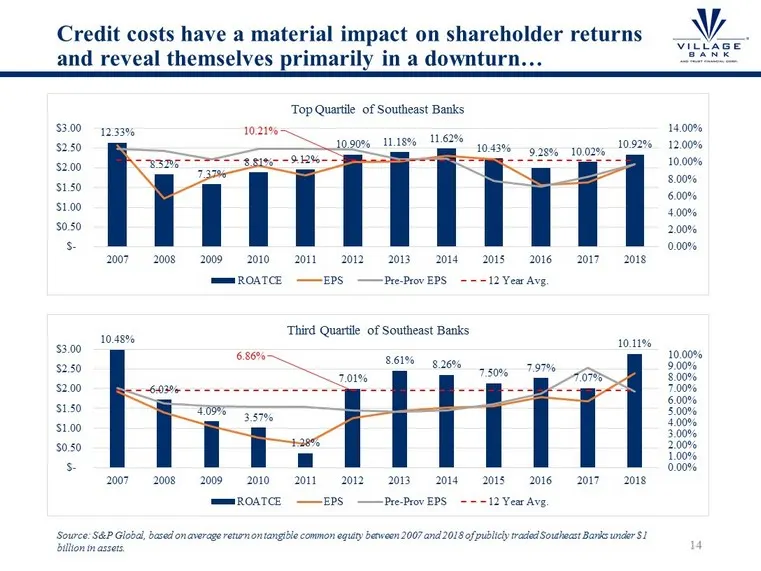
Credit costs have a material impact on shareholder returns and reveal themselves primarily in a downturn… Source: S&P Global, based on average return on tangible common equity between 2007 and 2018 of publicly traded Southeast Bank s u nder $1 billion in assets. 12.33% 8.52% 7.37% 8.81% 9.12% 10.90%
Slide 16: Our credit strategy is designed to deliver best quartile asset quality
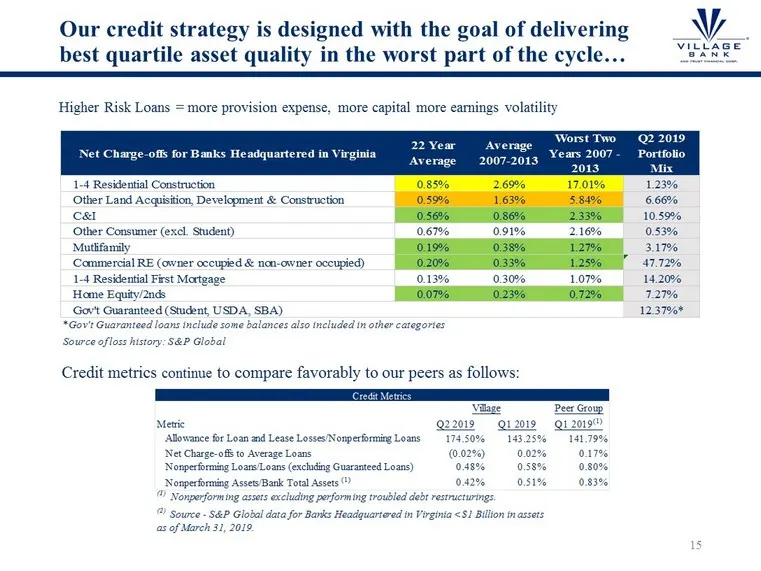
Our credit strategy is designed with the goal of delivering best quartile asset quality in the worst part of the cycle… Higher Risk Loans = more provision expense, more capital more earnings volatility Credit metrics continue to compare favorably to our peers as follows: Peer Group Q2 2019 Q1 2019 Q
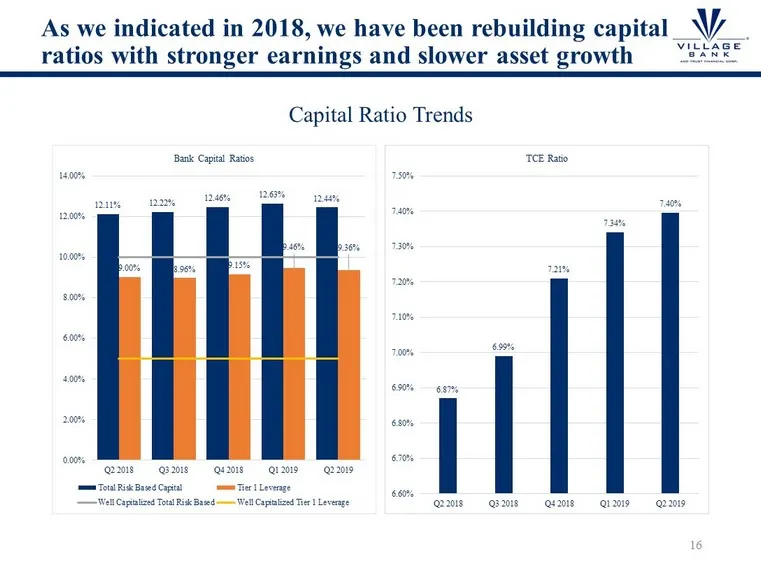
Slide 17: Rebuilding capital ratios with stronger earnings and slower asset growth
As we indicated in 2018, we have been rebuilding capital ratios with stronger earnings and slower asset growth Capital Ratio Trends 12.11% 12.22% 12.46% 12.63% 12.44% 9.00% 8.96% 9.15% 9.46% 9.36% 0.00% 2.00% 4.00% 6.00% 8.00% 10.00% 12.00% 14.00% Q2 2018 Q3 2018 Q4 2018 Q1 2019 Q2 2019 Bank Capital
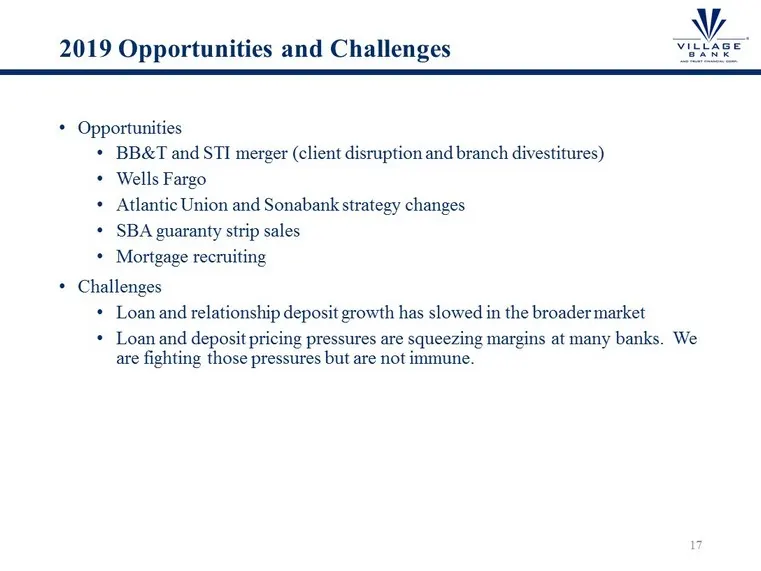
Slide 18: 2019 Opportunities and Challenges
2019 Opportunities and Challenges • Opportunities • BB&T and STI merger (client disruption and branch divestitures) • Wells Fargo • Atlantic Union and Sonabank strategy changes • SBA guaranty strip sales • Mortgage recruiting • Challenges • Loan and relationship deposit growth has slowed in the broa
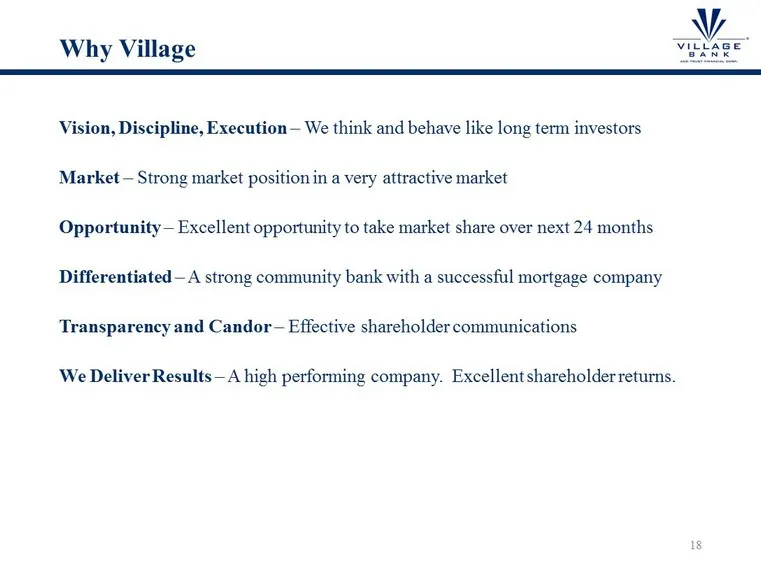
Slide 19: Why Village
Why Village Vision, Discipline, Execution – We think and behave like long term investors Market – Strong market position in a very attractive market Opportunity – Excellent opportunity to take m arket share over next 24 months Differentiated – A strong community bank with a successful mortgage compa
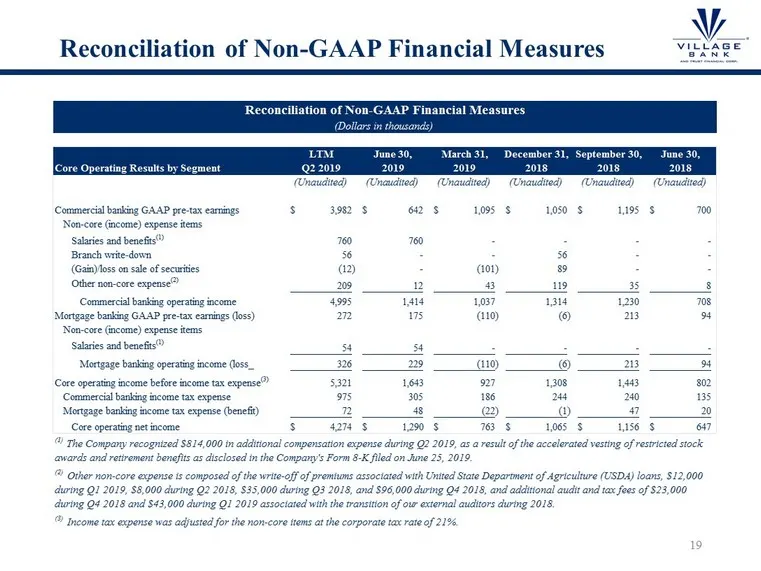
Slide 20: Reconciliation of Non-GAAP Financial Measures
Reconciliation of Non - GAAP Financial Measures LTM June 30, March 31, December 31, September 30, June 30, Core Operating Results by Segment Q2 2019 2019 2019 2018 2018 2018 (Unaudited) (Unaudited) (Unaudited) (Unaudited) (Unaudited) (Unaudited) Commercial banking GAAP pre-tax earnings 3,982$ 642$ 1
Slide 21: Reconciliation of Non-GAAP Financial Measures
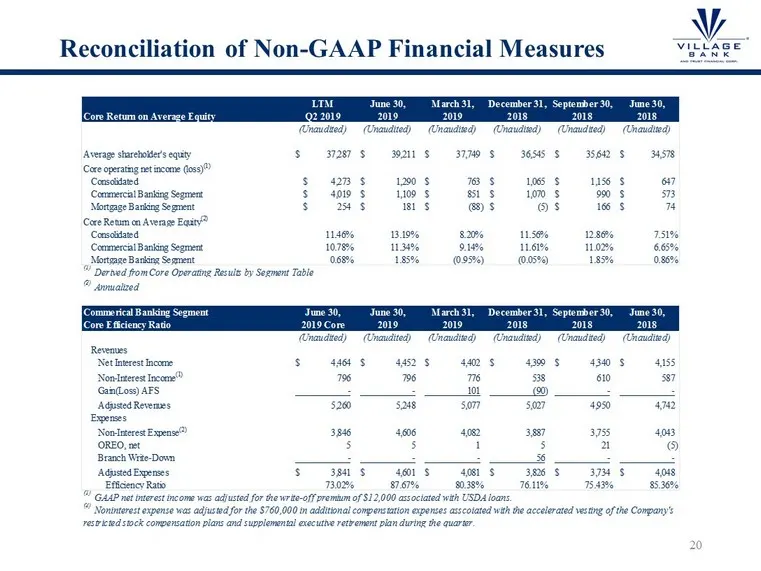
Reconciliation of Non - GAAP Financial Measures LTM June 30, March 31, December 31, September 30, June 30, Core Return on Average Equity Q2 2019 2019 2019 2018 2018 2018 (Unaudited) (Unaudited) (Unaudited) (Unaudited) (Unaudited) (Unaudited) Average shareholder's equity 37,287$ 39,211$ 37,749$ 36,54
Source: SEC EDGAR · 8-K filed Aug 6, 2019
More decks from Village Bank and Trust Financial
 Shareholder Meeting (May 2024)23 slides · May 21, 2024
 Investor Presentation (January 2024)27 slides · Jan 26, 2024
 Shareholder Meeting (May 2023)25 slides · May 23, 2023
 Investor Presentation (September 2022)27 slides · Sep 19, 2022
 Shareholder Meeting (May 2022)19 slides · May 24, 2022
 Investor Presentation (January 2022)26 slides · Jan 28, 2022