C&J Energy Services — Credit Suisse Energy Conference 2018
21 slides from C&J Energy Services's conference presentation, Feb 9, 2018
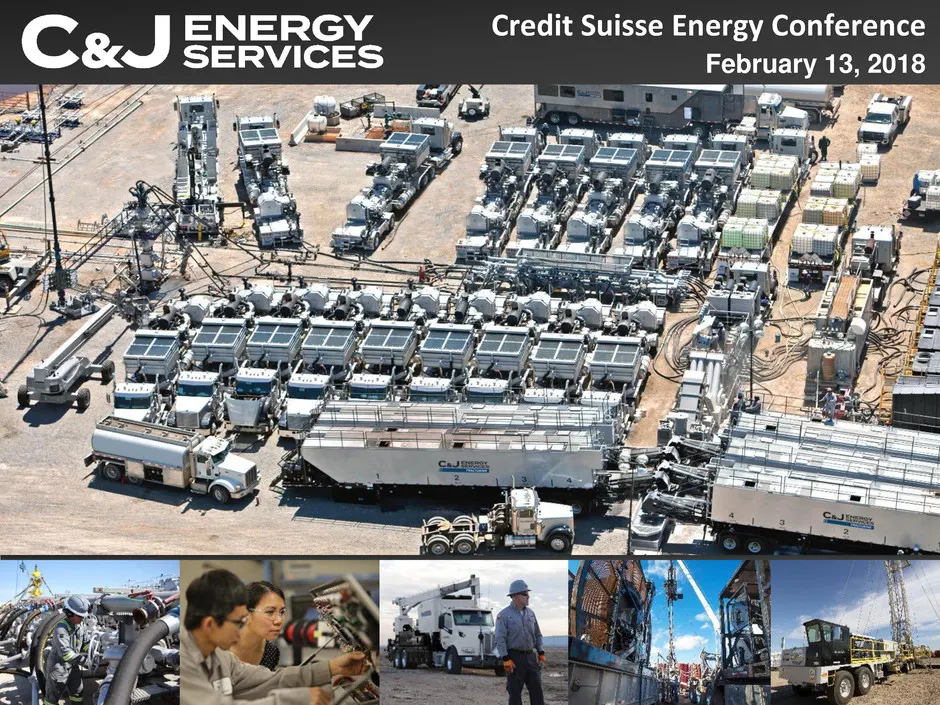
Slide 1: Credit Suisse Energy Conference
February 13, 2018 Credit Suisse Energy Conference
Slide 2: Important Disclaimer
2 Important Disclaimer This presentation contains certain statements and information that may constitute “forward-looking statements” within the meaning of Section 27A of the Securities Act of 1933, as amended, and Section 21E of the Securities Exchange Act of 1934, as amended. All statements, other
Slide 3: Market Summary
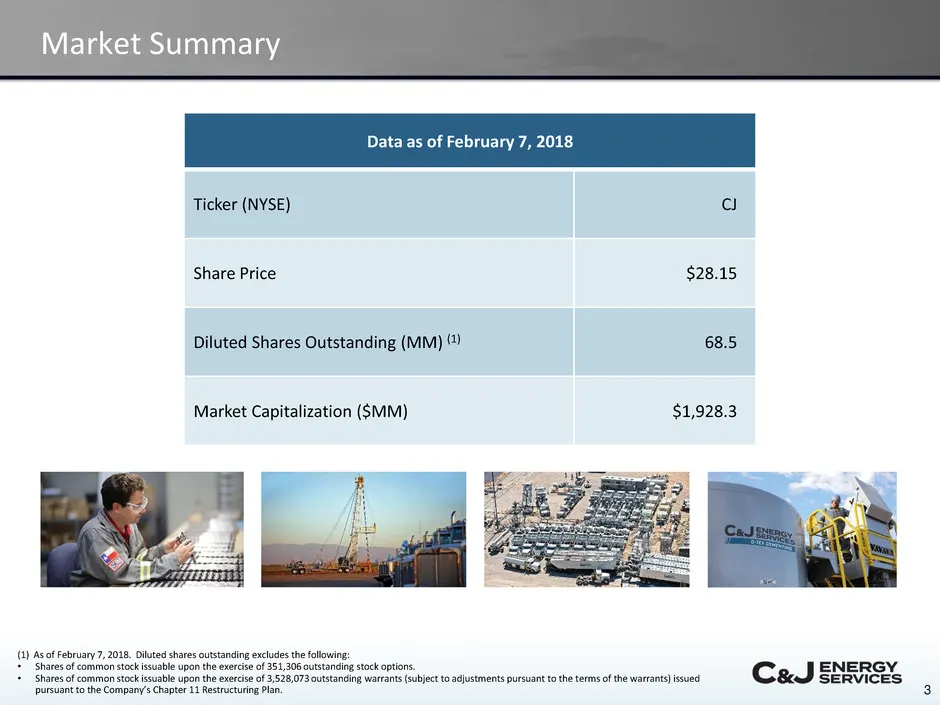
3 Market Summary Data as of February 7, 2018 Ticker (NYSE) CJ Share Price $28.15 Diluted Shares Outstanding (MM) (1) 68.5 Market Capitalization ($MM) $1,928.3 (1) As of February 7, 2018. Diluted shares outstanding excludes the following: • Shares of common stock issuable upon the exercise of 351,306
Slide 4: C&J Energy Services Snapshot
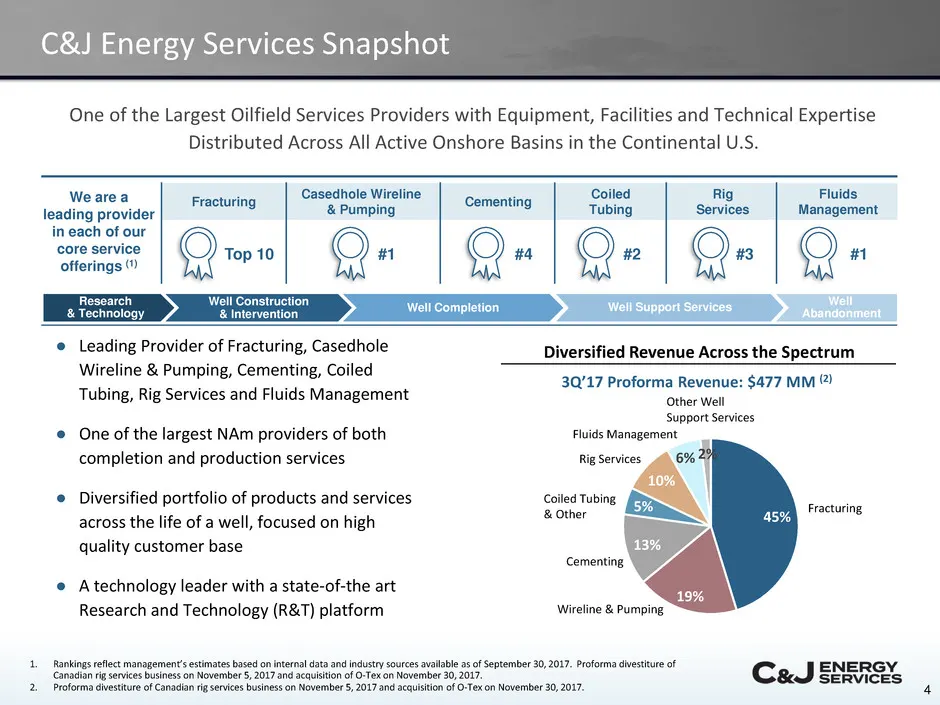
4 C&J Energy Services Snapshot One of the Largest Oilfield Services Providers with Equipment, Facilities and Technical Expertise Distributed Across All Active Onshore Basins in the Continental U.S. Key Differentiators We are a leading provider in each of our core service offerings (1) Fracturing Cas
Slide 5: Strong Presence in All Active Onshore U.S. Basins
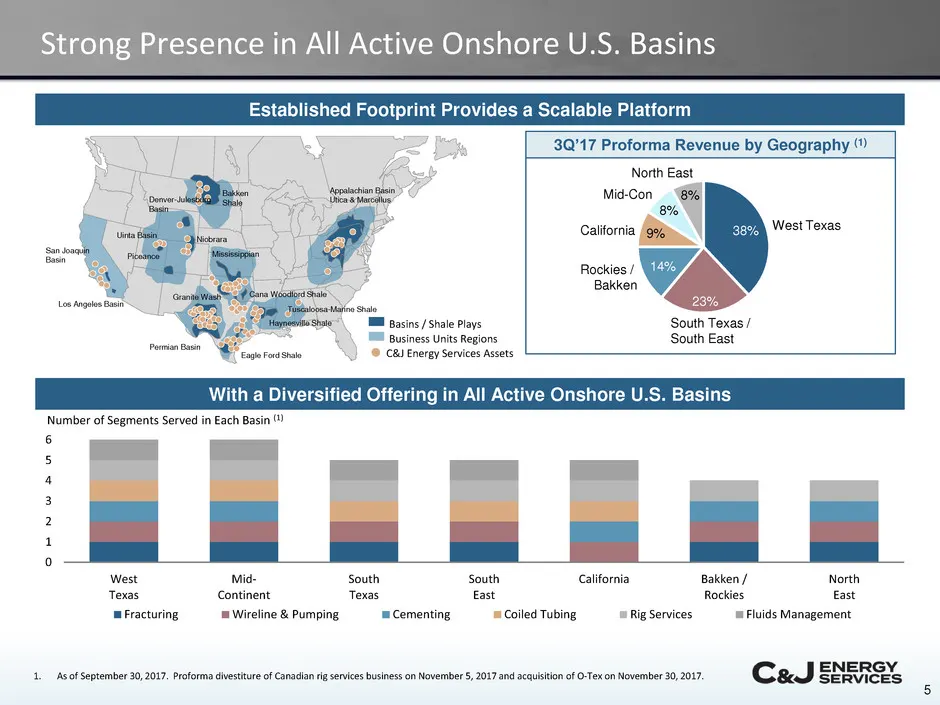
5 Strong Presence in All Active Onshore U.S. Basins Tuscaloosa-Marine Shale Haynesville Shale Eagle Ford Shale Cana Woodford Shale Permian Basin Granite Wash Mississippian Niobrara Los Angeles Basin San Joaquin Basin Piceance Uinta Basin Denver-Julesburg Basin Bakken Shale Appalachian Basin Utica &
Slide 6: Our Modern, High Quality Asset Base
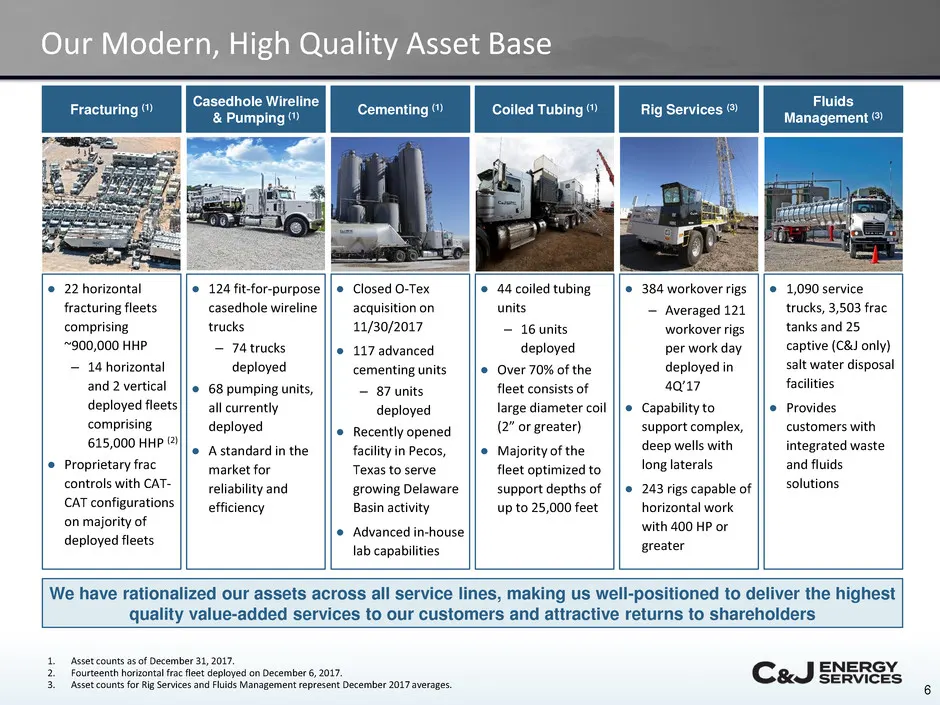
6 Our Modern, High Quality Asset Base We have rationalized our assets across all service lines, making us well-positioned to deliver the highest quality value-added services to our customers and attractive returns to shareholders Fracturing (1) Casedhole Wireline & Pumping (1) Cementing (1) Rig Serv
Slide 7: Our Completions Footprint Will Continue to Grow
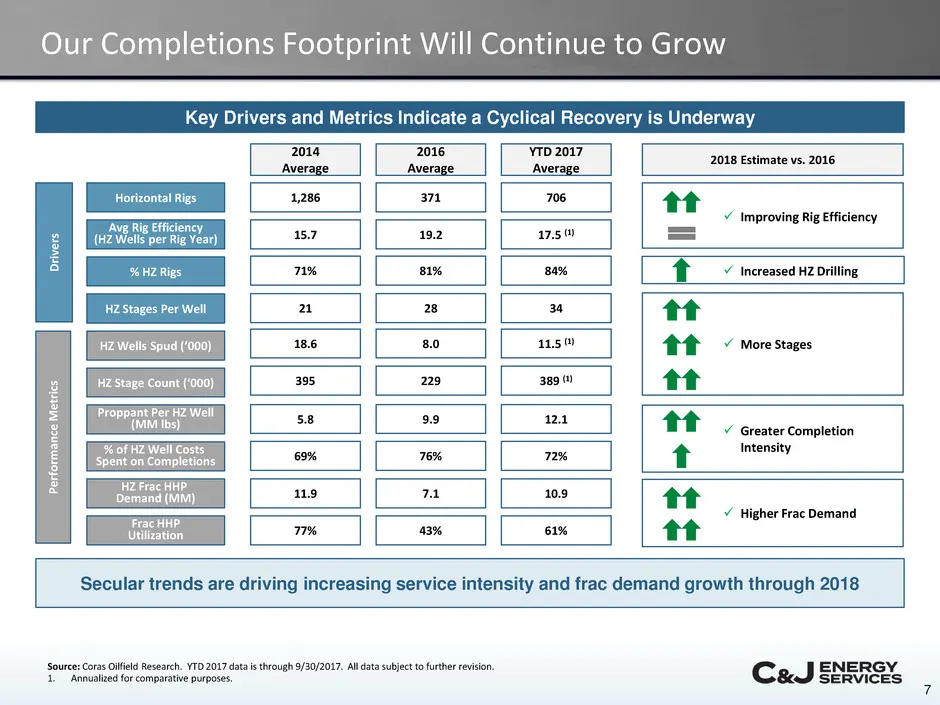
7 Our Completions Footprint Will Continue to Grow Horizontal Rigs % HZ Rigs Avg Rig Efficiency (HZ Wells per Rig Year) HZ Wells Spud (’000) HZ Stage Count (‘000) HZ Stages Per Well HZ Frac HHP Demand (MM) 2014 Average 2016 Average 2018 Estimate vs. 2016 3711,286 81%71% 19.215.7 8.018.6 229395 2821 7
Slide 8: Quality of Our Horsepower Leading to Full Utilization
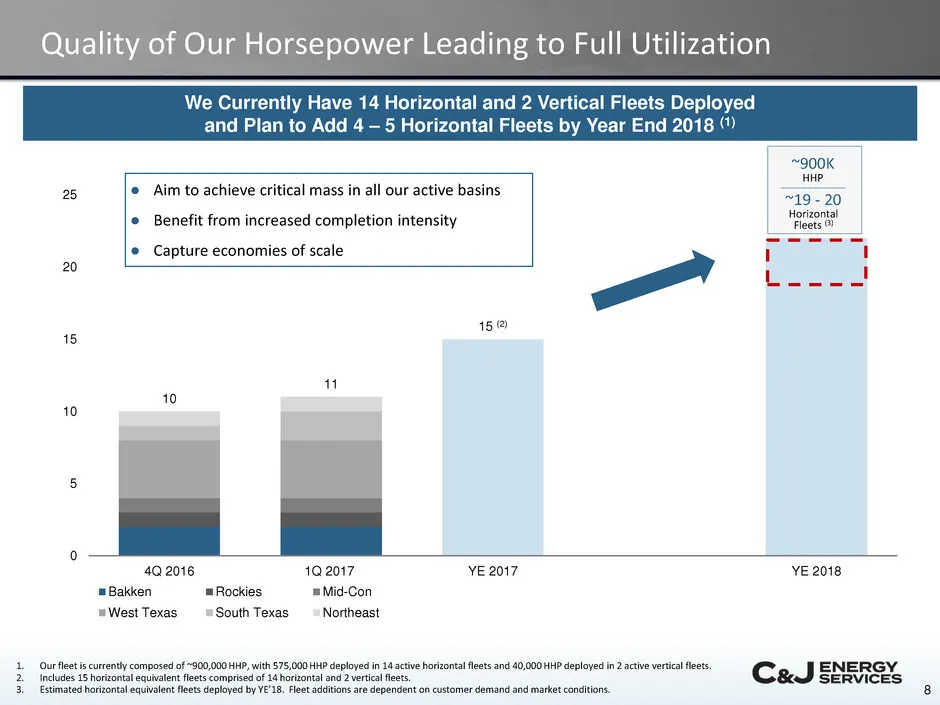
8 Quality of Our Horsepower Leading to Full Utilization We Currently Have 14 Horizontal and 2 Vertical Fleets Deployed and Plan to Add 4 – 5 Horizontal Fleets by Year End 2018 (1) 10 11 15 (2) 0 5 10 15 20 25 4Q 2016 1Q 2017 YE 2017 YE 2018 Bakken Rockies Mid-Con West Texas South Texas Northeast ~90
Slide 9: O-Tex Pumping: A Leading Specialty Cementing Services Provider
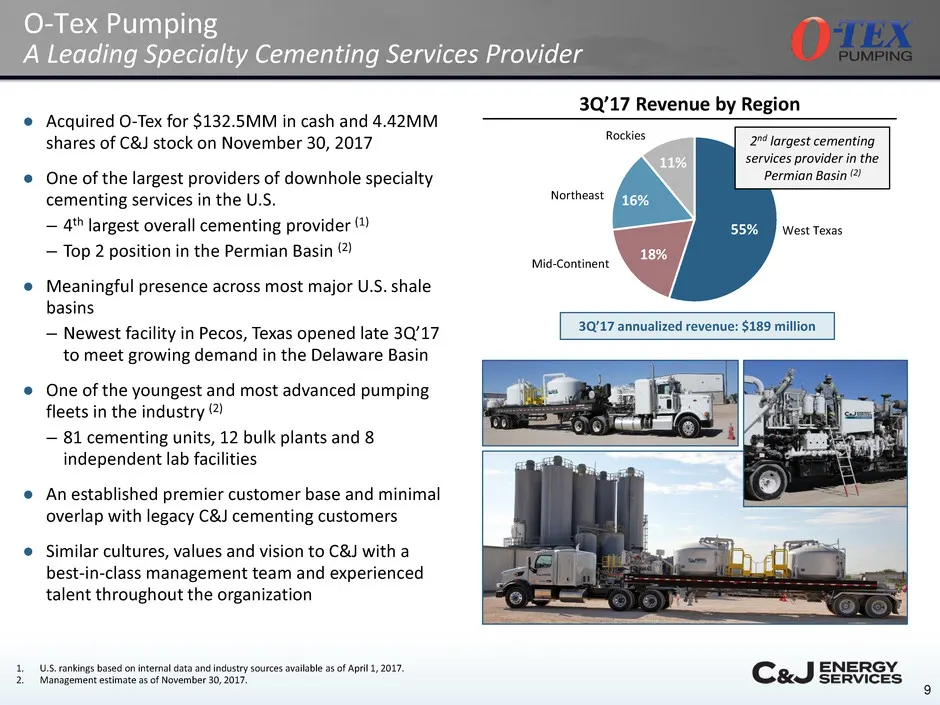
9 O-Tex Pumping A Leading Specialty Cementing Services Provider ● Acquired O-Tex for $132.5MM in cash and 4.42MM shares of C&J stock on November 30, 2017 ● One of the largest providers of downhole specialty cementing services in the U.S. – 4th largest overall cementing provider (1) – Top 2 position
Slide 10: Why Cementing?
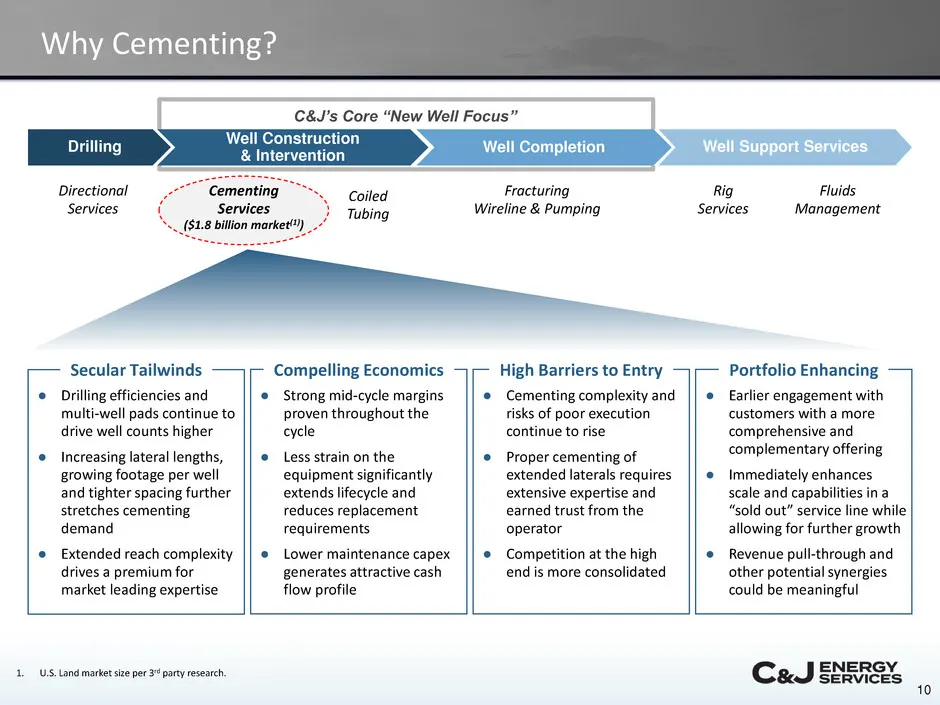
10 Drilling C&J’s Core “New Well Focus” Why Cementing? Well Completion Well Support Services Directional Services Cementing Services ($1.8 billion market(1)) Fracturing Wireline & Pumping Coiled Tubing Fluids Management Rig Services 1. U.S. Land market size per 3rd party research. Secular Tailwinds
Slide 11: A Leading Provider of Service Rigs in the Market
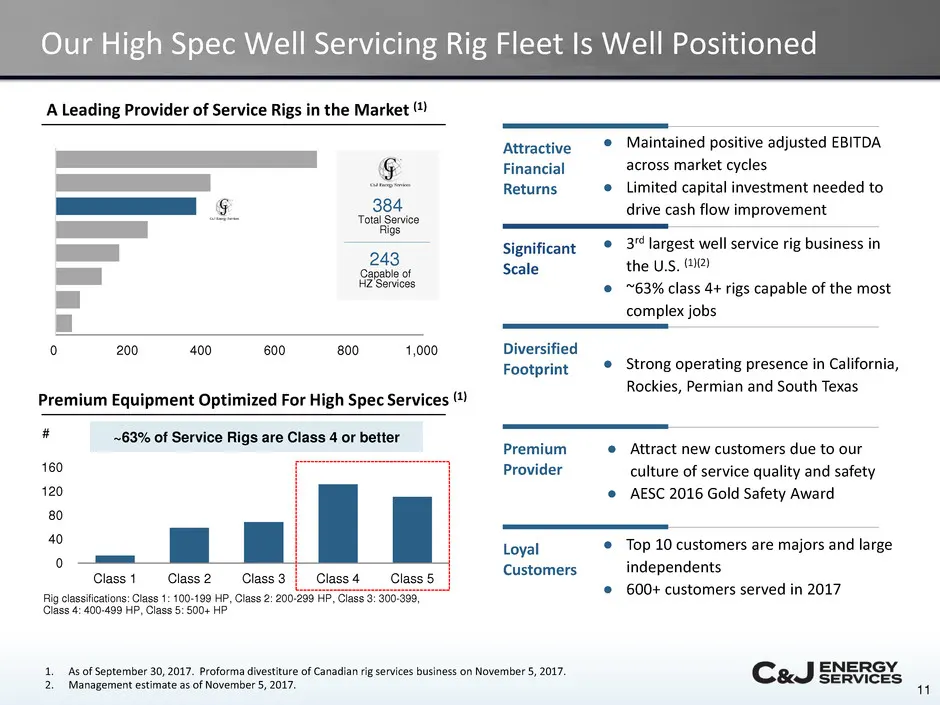
11 A Leading Provider of Service Rigs in the Market (1) Rig classifications: Class 1: 100-199 HP, Class 2: 200-299 HP, Class 3: 300-399, Class 4: 400-499 HP, Class 5: 500+ HP Our High Spec Well Servicing Rig Fleet Is Well Positioned Premium Equipment Optimized For High Spec Services (1) 0 40 80 120
Slide 12: Long-Term Relationships with High Quality Customers
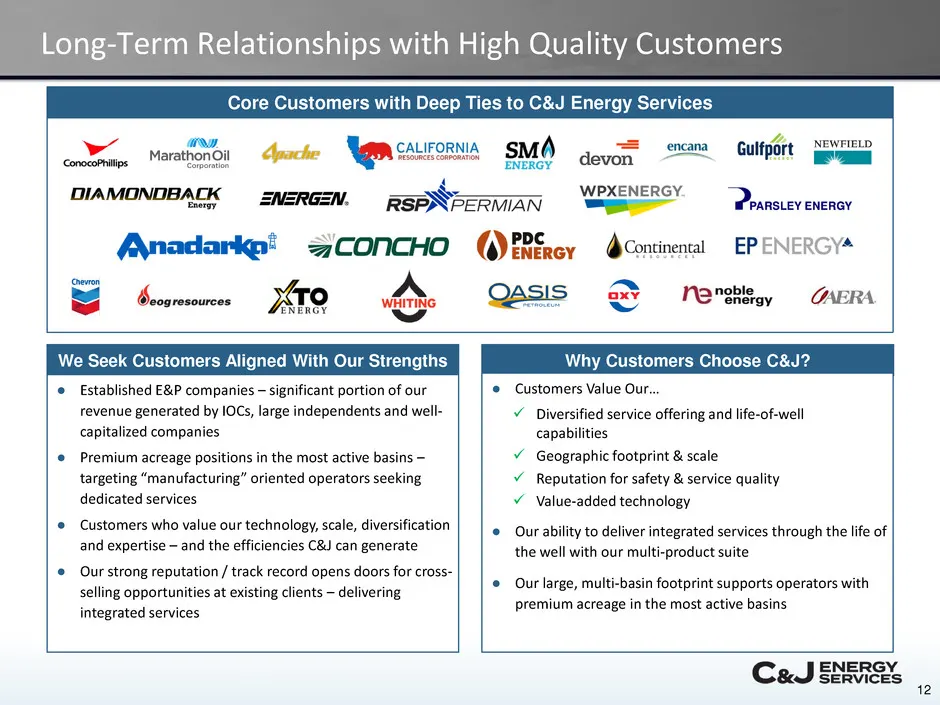
12 Long-Term Relationships with High Quality Customers Why Customers Choose C&J? ● Customers Value Our… ● Our ability to deliver integrated services through the life of the well with our multi-product suite ● Our large, multi-basin footprint supports operators with premium acreage in the most active
Slide 13: Our Frac Refurbishments Are Targeting Fleet Optimization
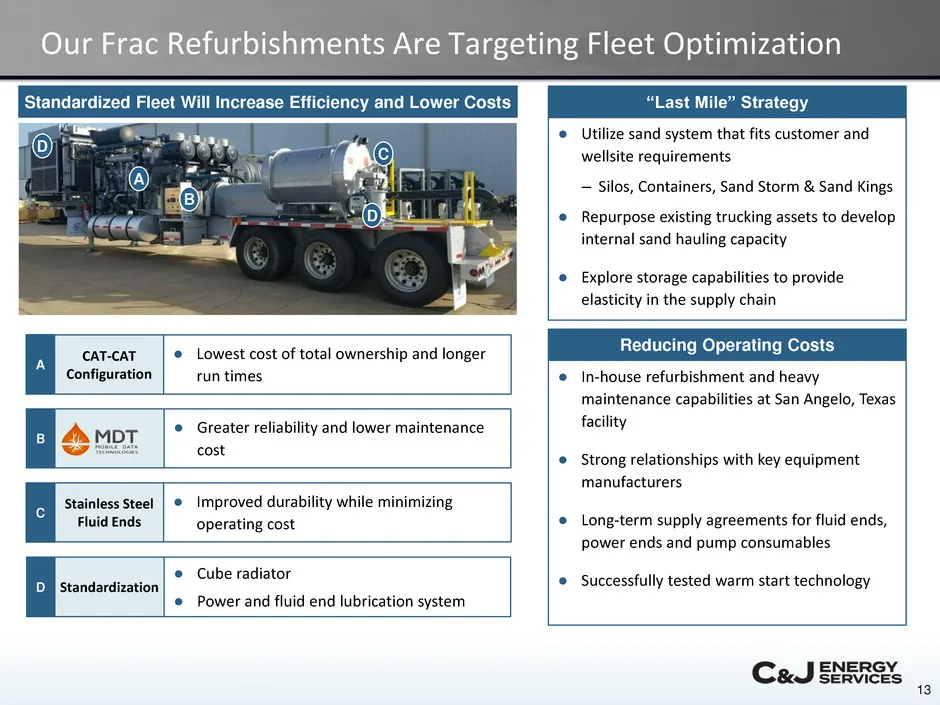
13 Our Frac Refurbishments Are Targeting Fleet Optimization Standardized Fleet Will Increase Efficiency and Lower Costs CAT-CAT Configuration A ● Lowest cost of total ownership and longer run times StandardizationD ● Cube radiator ● Power and fluid end lubrication system Stainless Steel Fluid Ends C
Slide 14: Our Evolutionary Technology Advantage
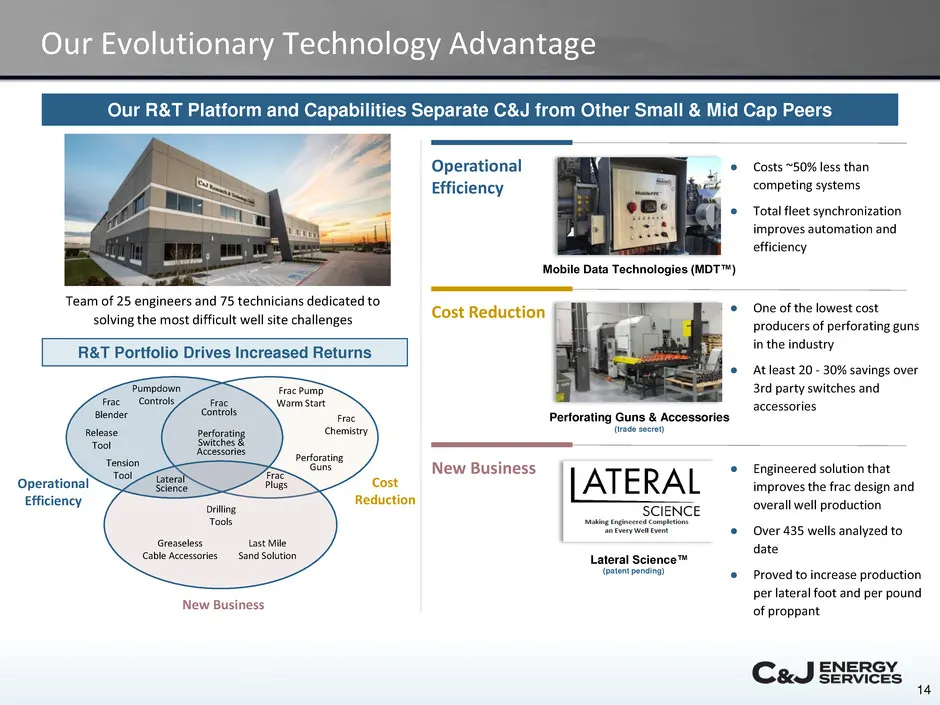
14 Our Evolutionary Technology Advantage Our R&T Platform and Capabilities Separate C&J from Other Small & Mid Cap Peers Team of 25 engineers and 75 technicians dedicated to solving the most difficult well site challenges R&T Portfolio Drives Increased Returns Perforating GunsTension Tool Perforatin
Slide 15: Our Quality Management System is Designed to Enhance Service Quality
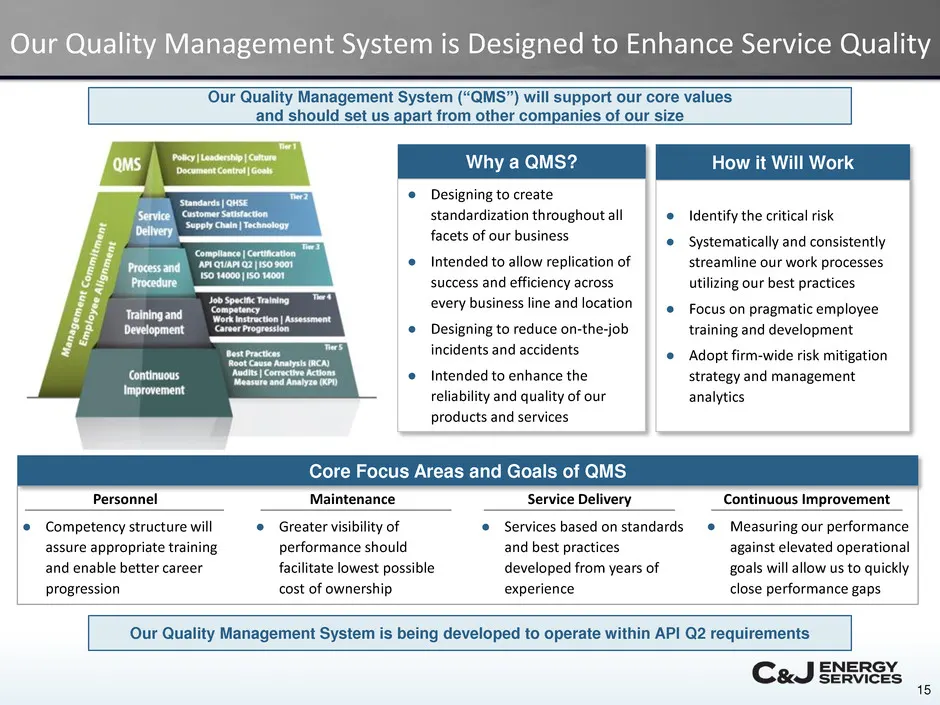
15 Our Quality Management System is Designed to Enhance Service Quality Our Quality Management System (“QMS”) will support our core values and should set us apart from other companies of our size How it Will Work ● Identify the critical risk ● Systematically and consistently streamline our work proc
Slide 16: Section 2: Financial Review
CaJ Seavices SECTION 2: Financial Review
Slide 17: Core Tenets of Our Financial Policy
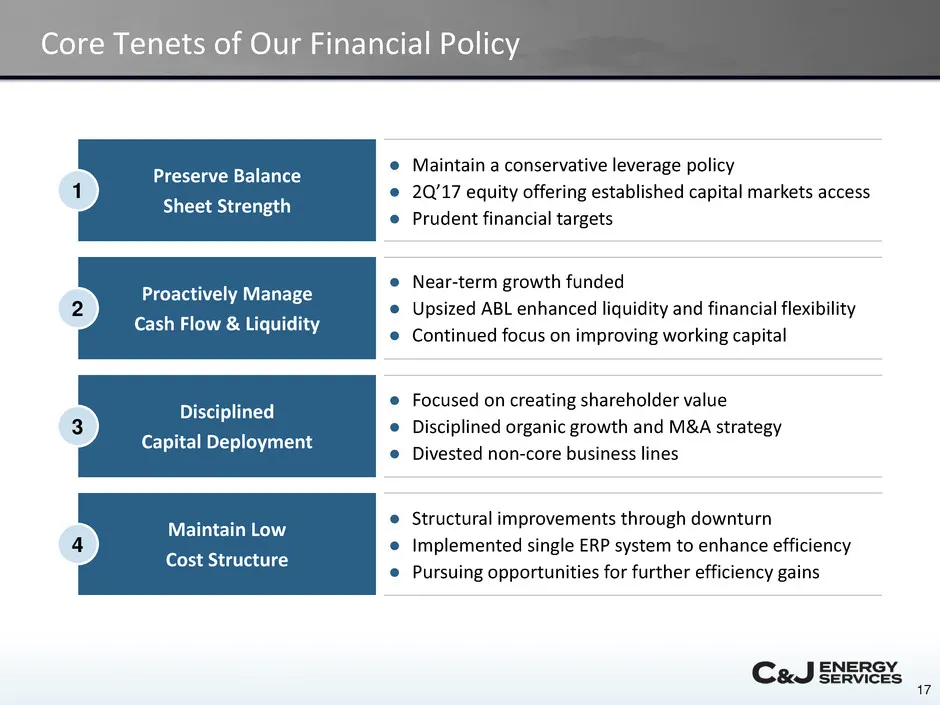
17 Core Tenets of Our Financial Policy ● Maintain a conservative leverage policy ● 2Q’17 equity offering established capital markets access ● Prudent financial targets Preserve Balance Sheet Strength 1 ● Near-term growth funded ● Upsized ABL enhanced liquidity and financial flexibility ● Continued f
Slide 18: Renewed Capital Structure Supports Growth
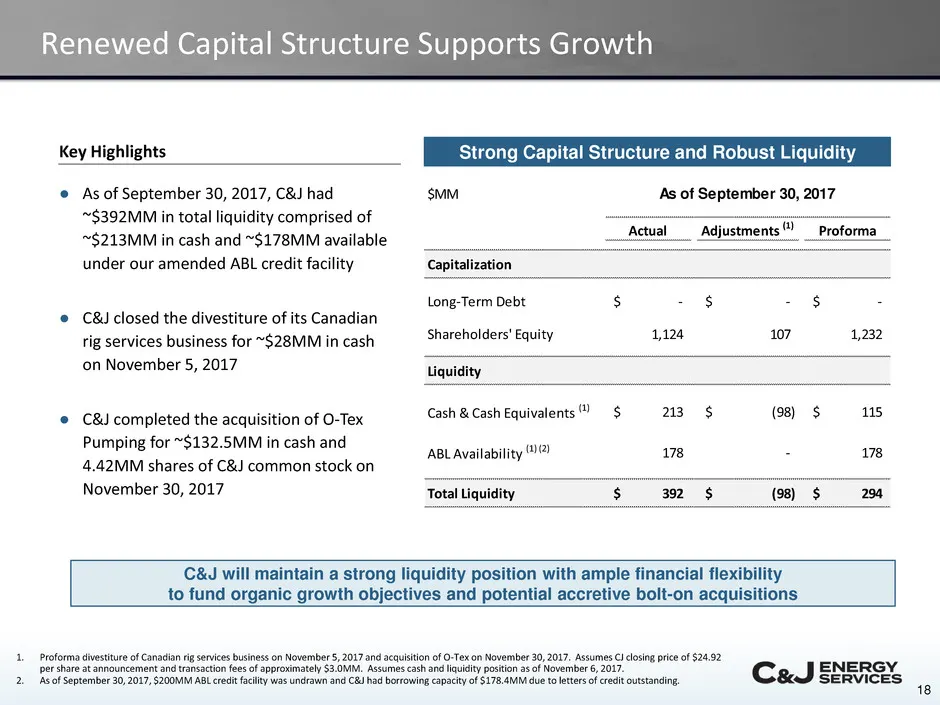
18 Renewed Capital Structure Supports Growth 1. Proforma divestiture of Canadian rig services business on November 5, 2017 and acquisition of O-Tex on November 30, 2017. Assumes CJ closing price of $24.92 per share at announcement and transaction fees of approximately $3.0MM. Assumes cash and liquid
Slide 19: Select Historical Financial Information
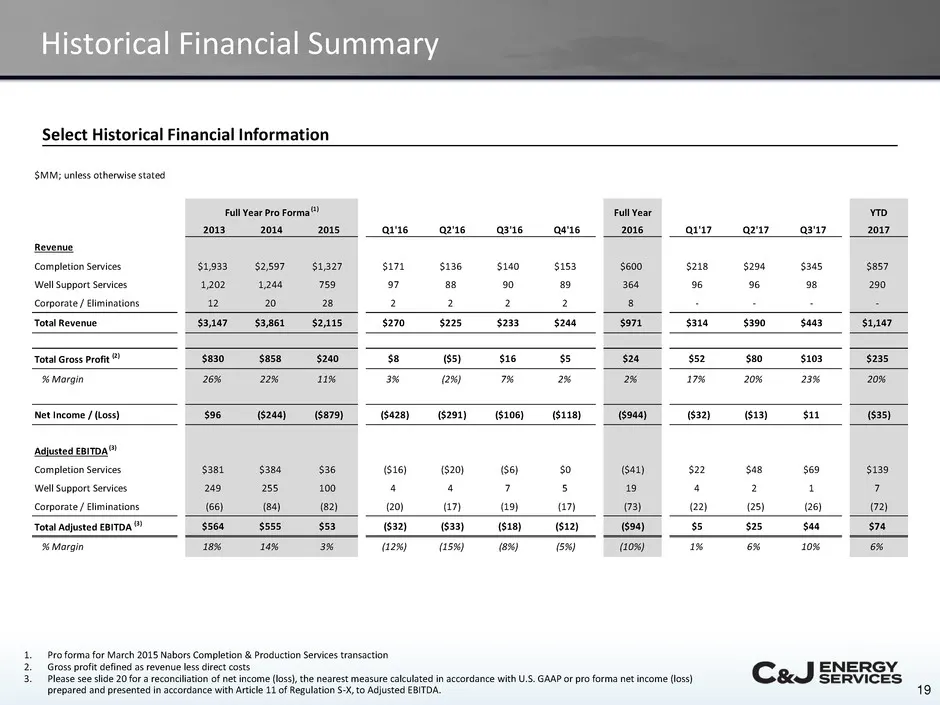
19 Select Historical Financial Information Historical Financial Summary 1. Pro forma for March 2015 Nabors Completion & Production Services transaction 2. Gross profit defined as revenue less direct costs 3. Please see slide 20 for a reconciliation of net income (loss), the nearest measure calculate
Slide 20: Adjusted EBITDA Reconciliation
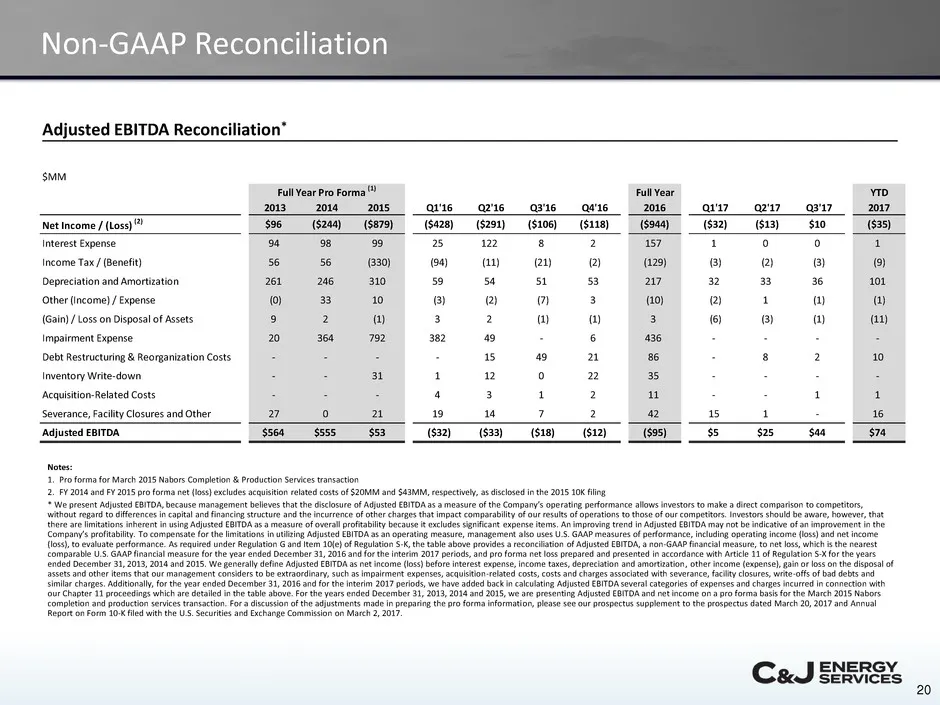
20 Adjusted EBITDA Reconciliation* Non-GAAP Reconciliation Notes: 1. Pro forma for March 2015 Nabors Completion & Production Services transaction 2. FY 2014 and FY 2015 pro forma net (loss) excludes acquisition related costs of $20MM and $43MM, respectively, as disclosed in the 2015 10K filing * We
Slide 21: The Differentiated U.S. Oilfield Services Company
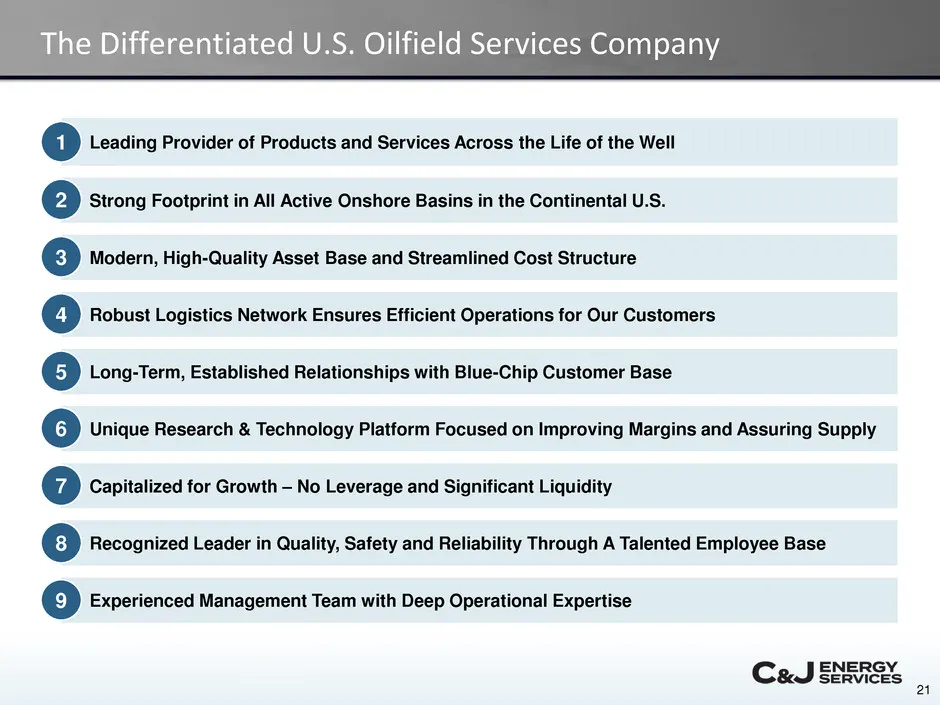
21 The Differentiated U.S. Oilfield Services Company Leading Provider of Products and Services Across the Life of the Well Strong Footprint in All Active Onshore Basins in the Continental U.S. Modern, High-Quality Asset Base and Streamlined Cost Structure Robust Logistics Network Ensures Efficient O
Source: SEC EDGAR · 8-K filed Feb 9, 2018
More decks from C&J Energy Services Inc
 Barclays CEO Energy-Power Conference 201933 slides · Sep 3, 2019
 Q2 2019 Earnings Presentation42 slides · Aug 6, 2019
 Q2 2019 Earnings Presentation22 slides · Aug 6, 2019
 Merger or Acquisition (June 2019)20 slides · Jun 17, 2019
 Investor Presentation (May 2019)42 slides · May 14, 2019
 Q1 2019 Earnings Presentation21 slides · May 7, 2019