CTC Media — 4th Annual EMEA Equity Conference 2007
23 slides from CTC Media's conference presentation, Jan 25, 2007
Slide 1: At the forefront of Russian broadcast entertainment
Exhibit 99.2 At the forefront of Russian broadcast entertainment 4th Annual EMEA Equity Conference 25-26 January, 2007
Slide 2: Disclaimer
Disclaimer The information contained in this presentation, including market data that are attributed to specific sources and have not been independently verified. No representation, warranty or undertaking, express or implied, is made as to, and no reliance should be placed on, the fairness, accurac
Slide 3: CTC Media at a Glance
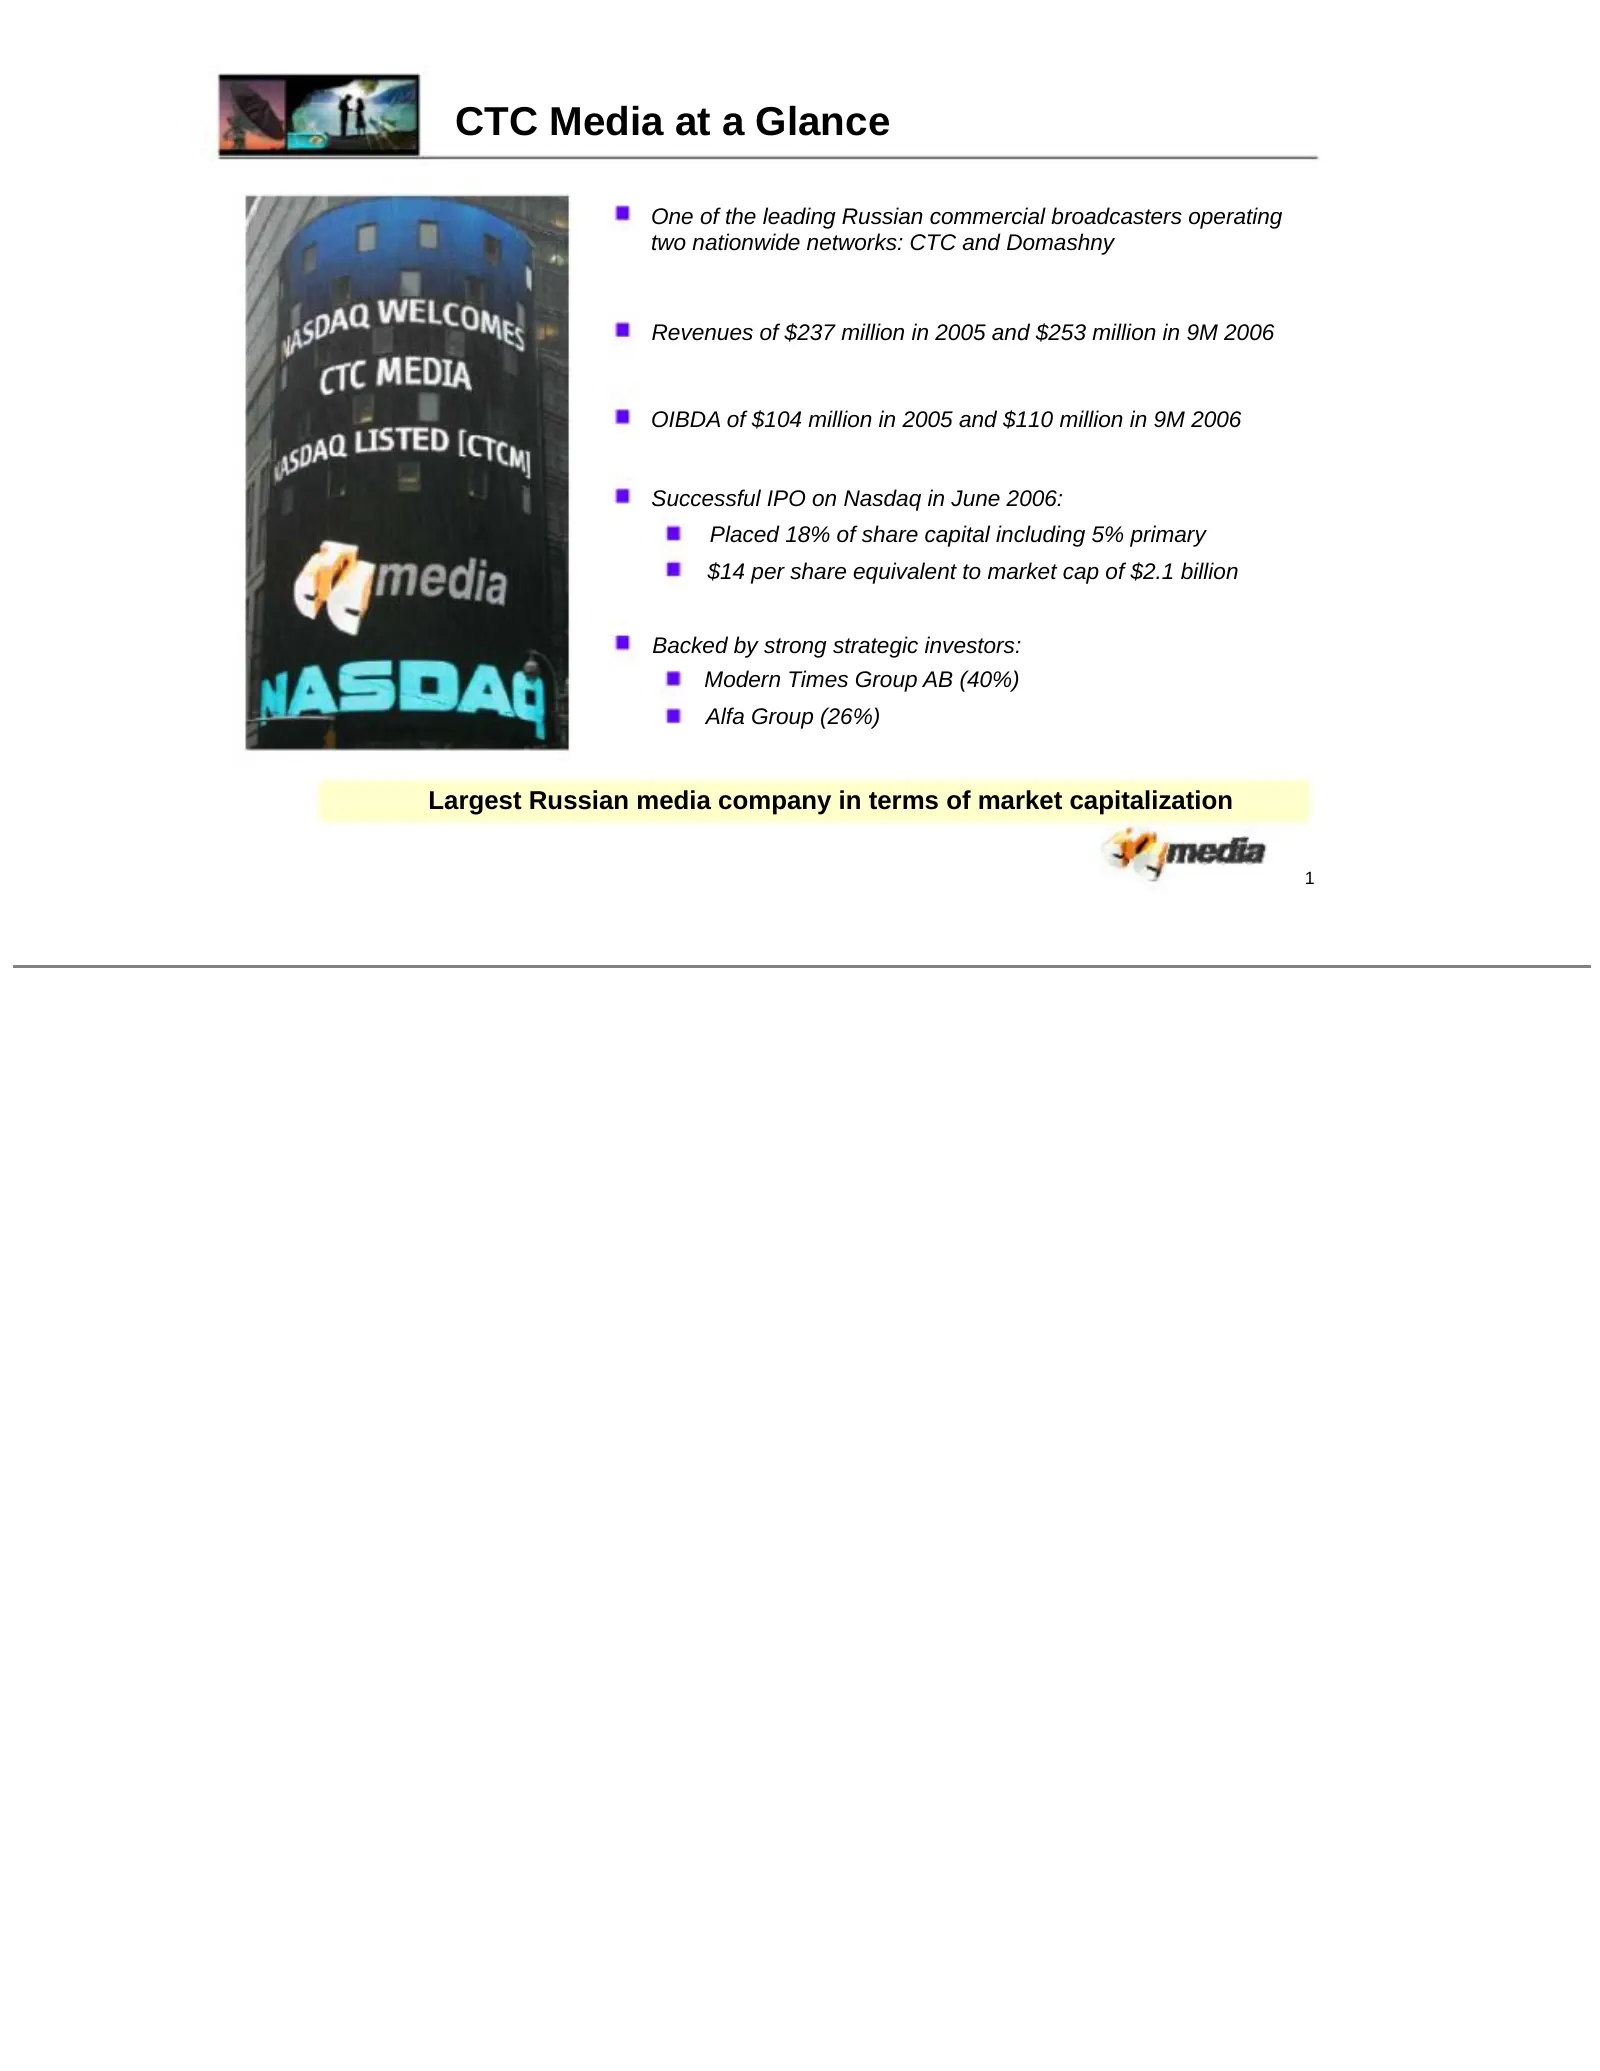
CTC Media at a Glance One of the leading Russian commercial broadcasters operating two nationwide networks: CTC and Domashny Revenues of $237 million in 2005 and $253 million in 9M 2006 OIBDA of $104 million in 2005 and $110 million in 9M 2006 Successful IPO on Nasdaq in June 2006: Placed 18% of sha
Slide 4: Entertaining Russia…
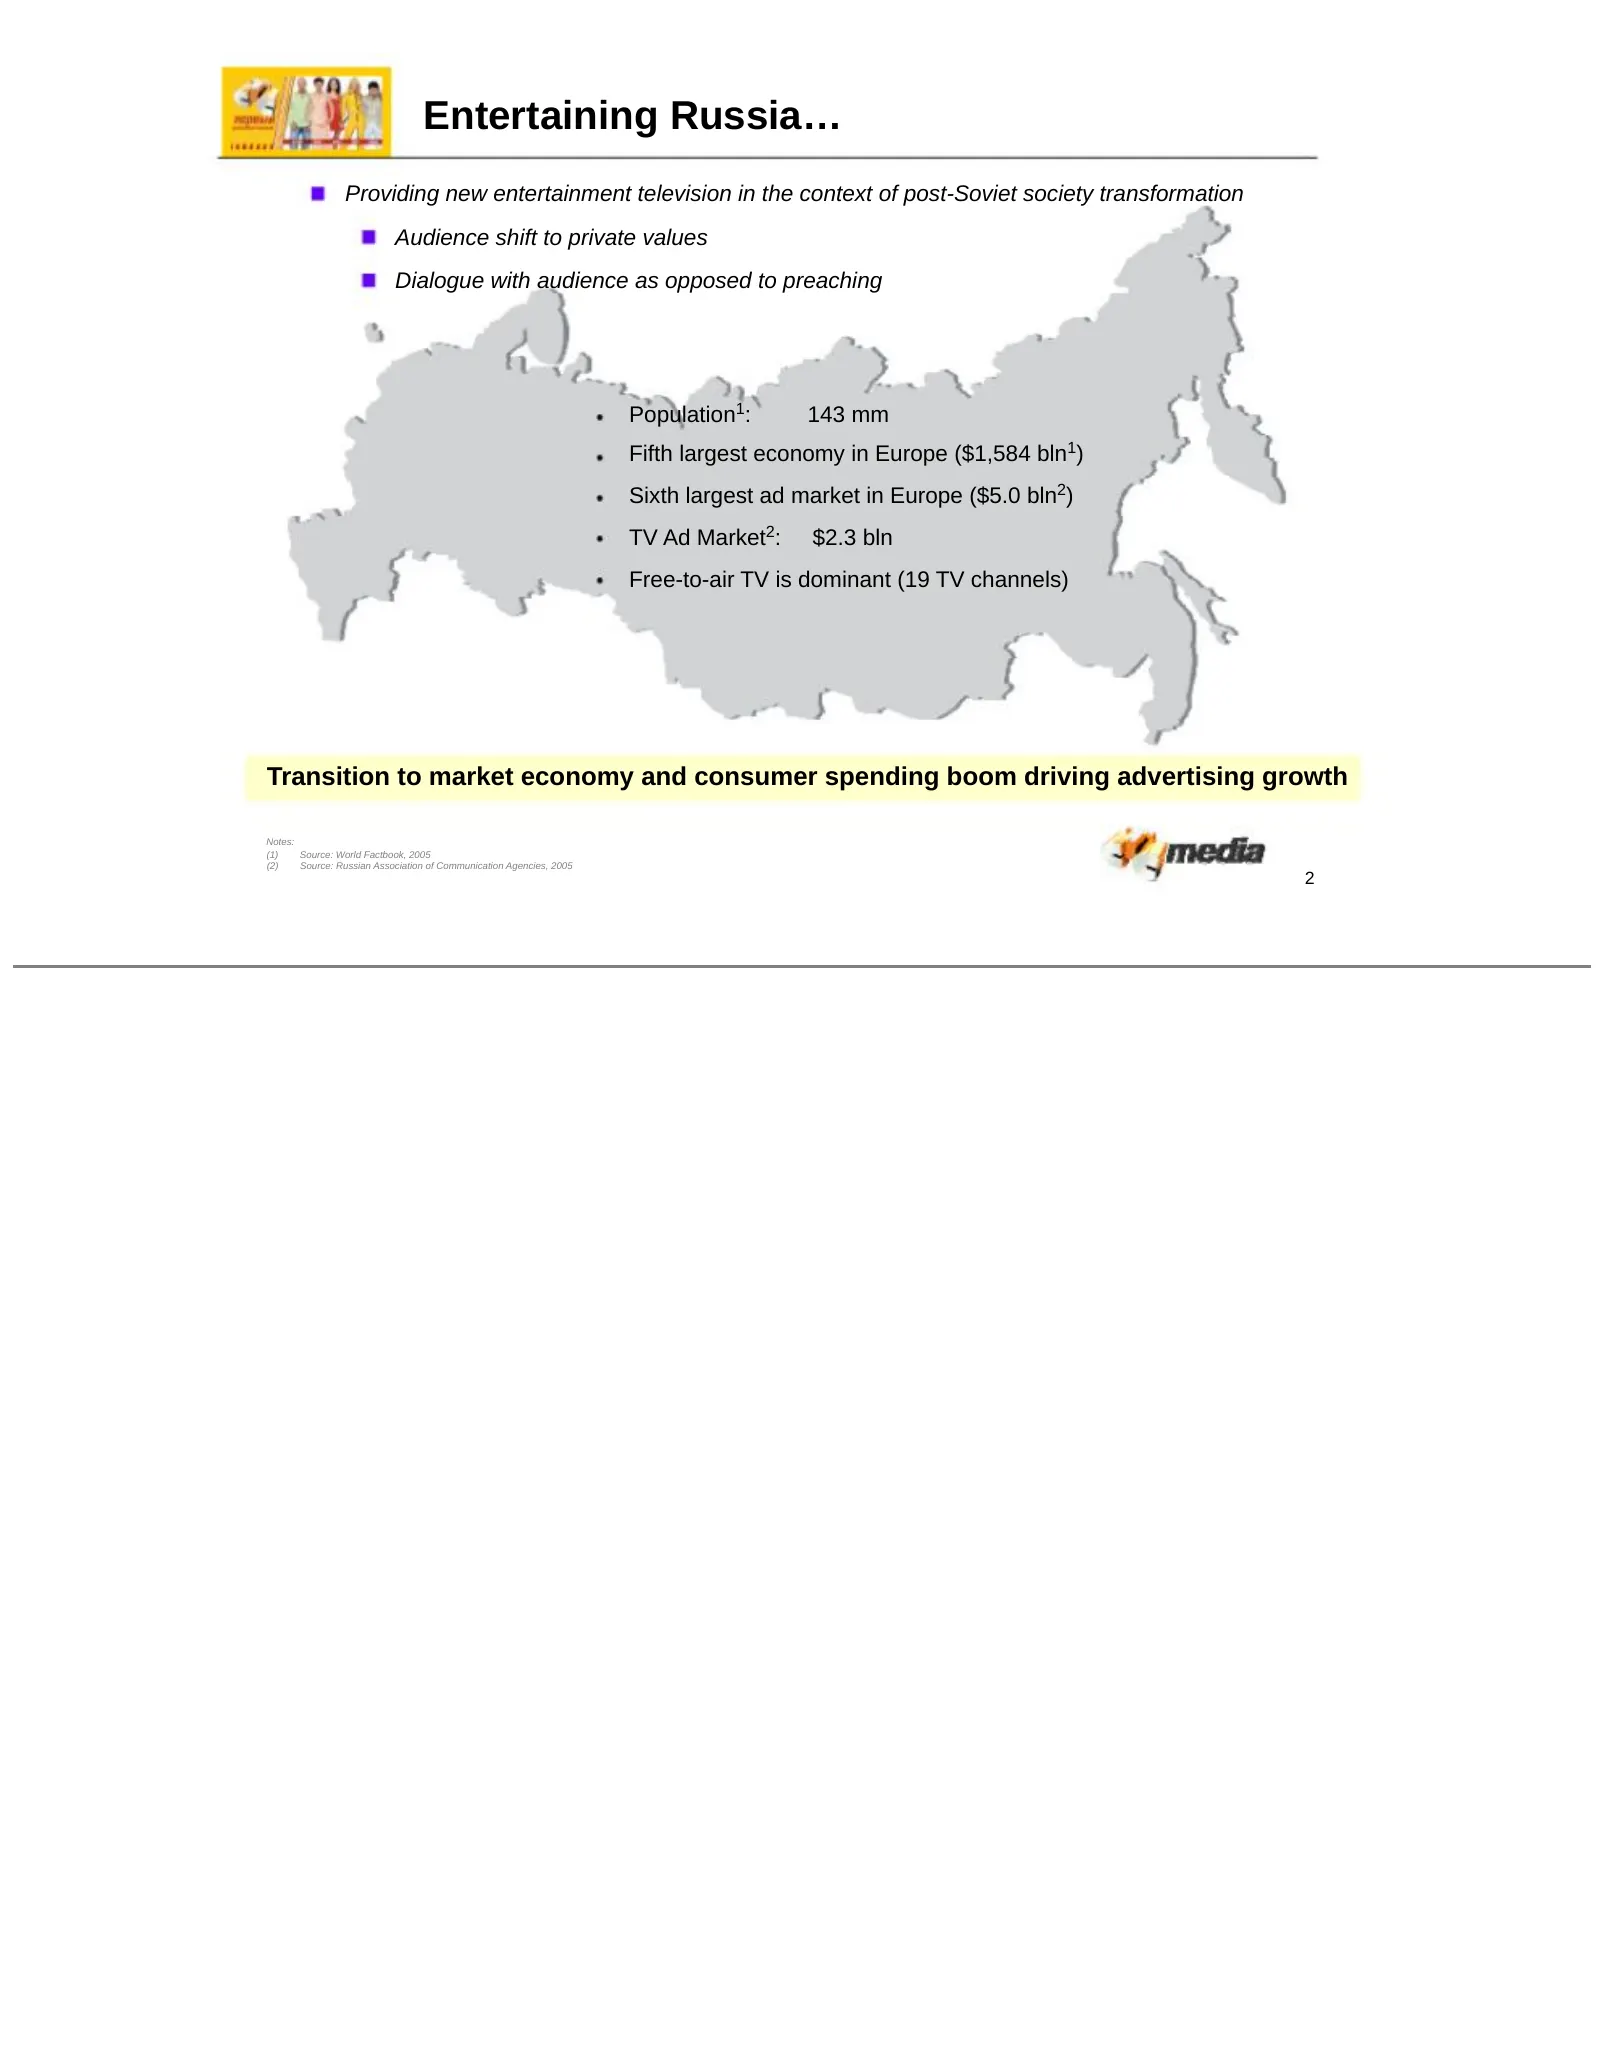
Entertaining Russia… Providing new entertainment television in the context of post-Soviet society transformation Audience shift to private values Dialogue with audience as opposed to preaching Population1: 143 mm Fifth largest economy in Europe ($1,584 bln1) Sixth largest ad market in Europe ($5.0 b
Slide 5: The CTC Media Group
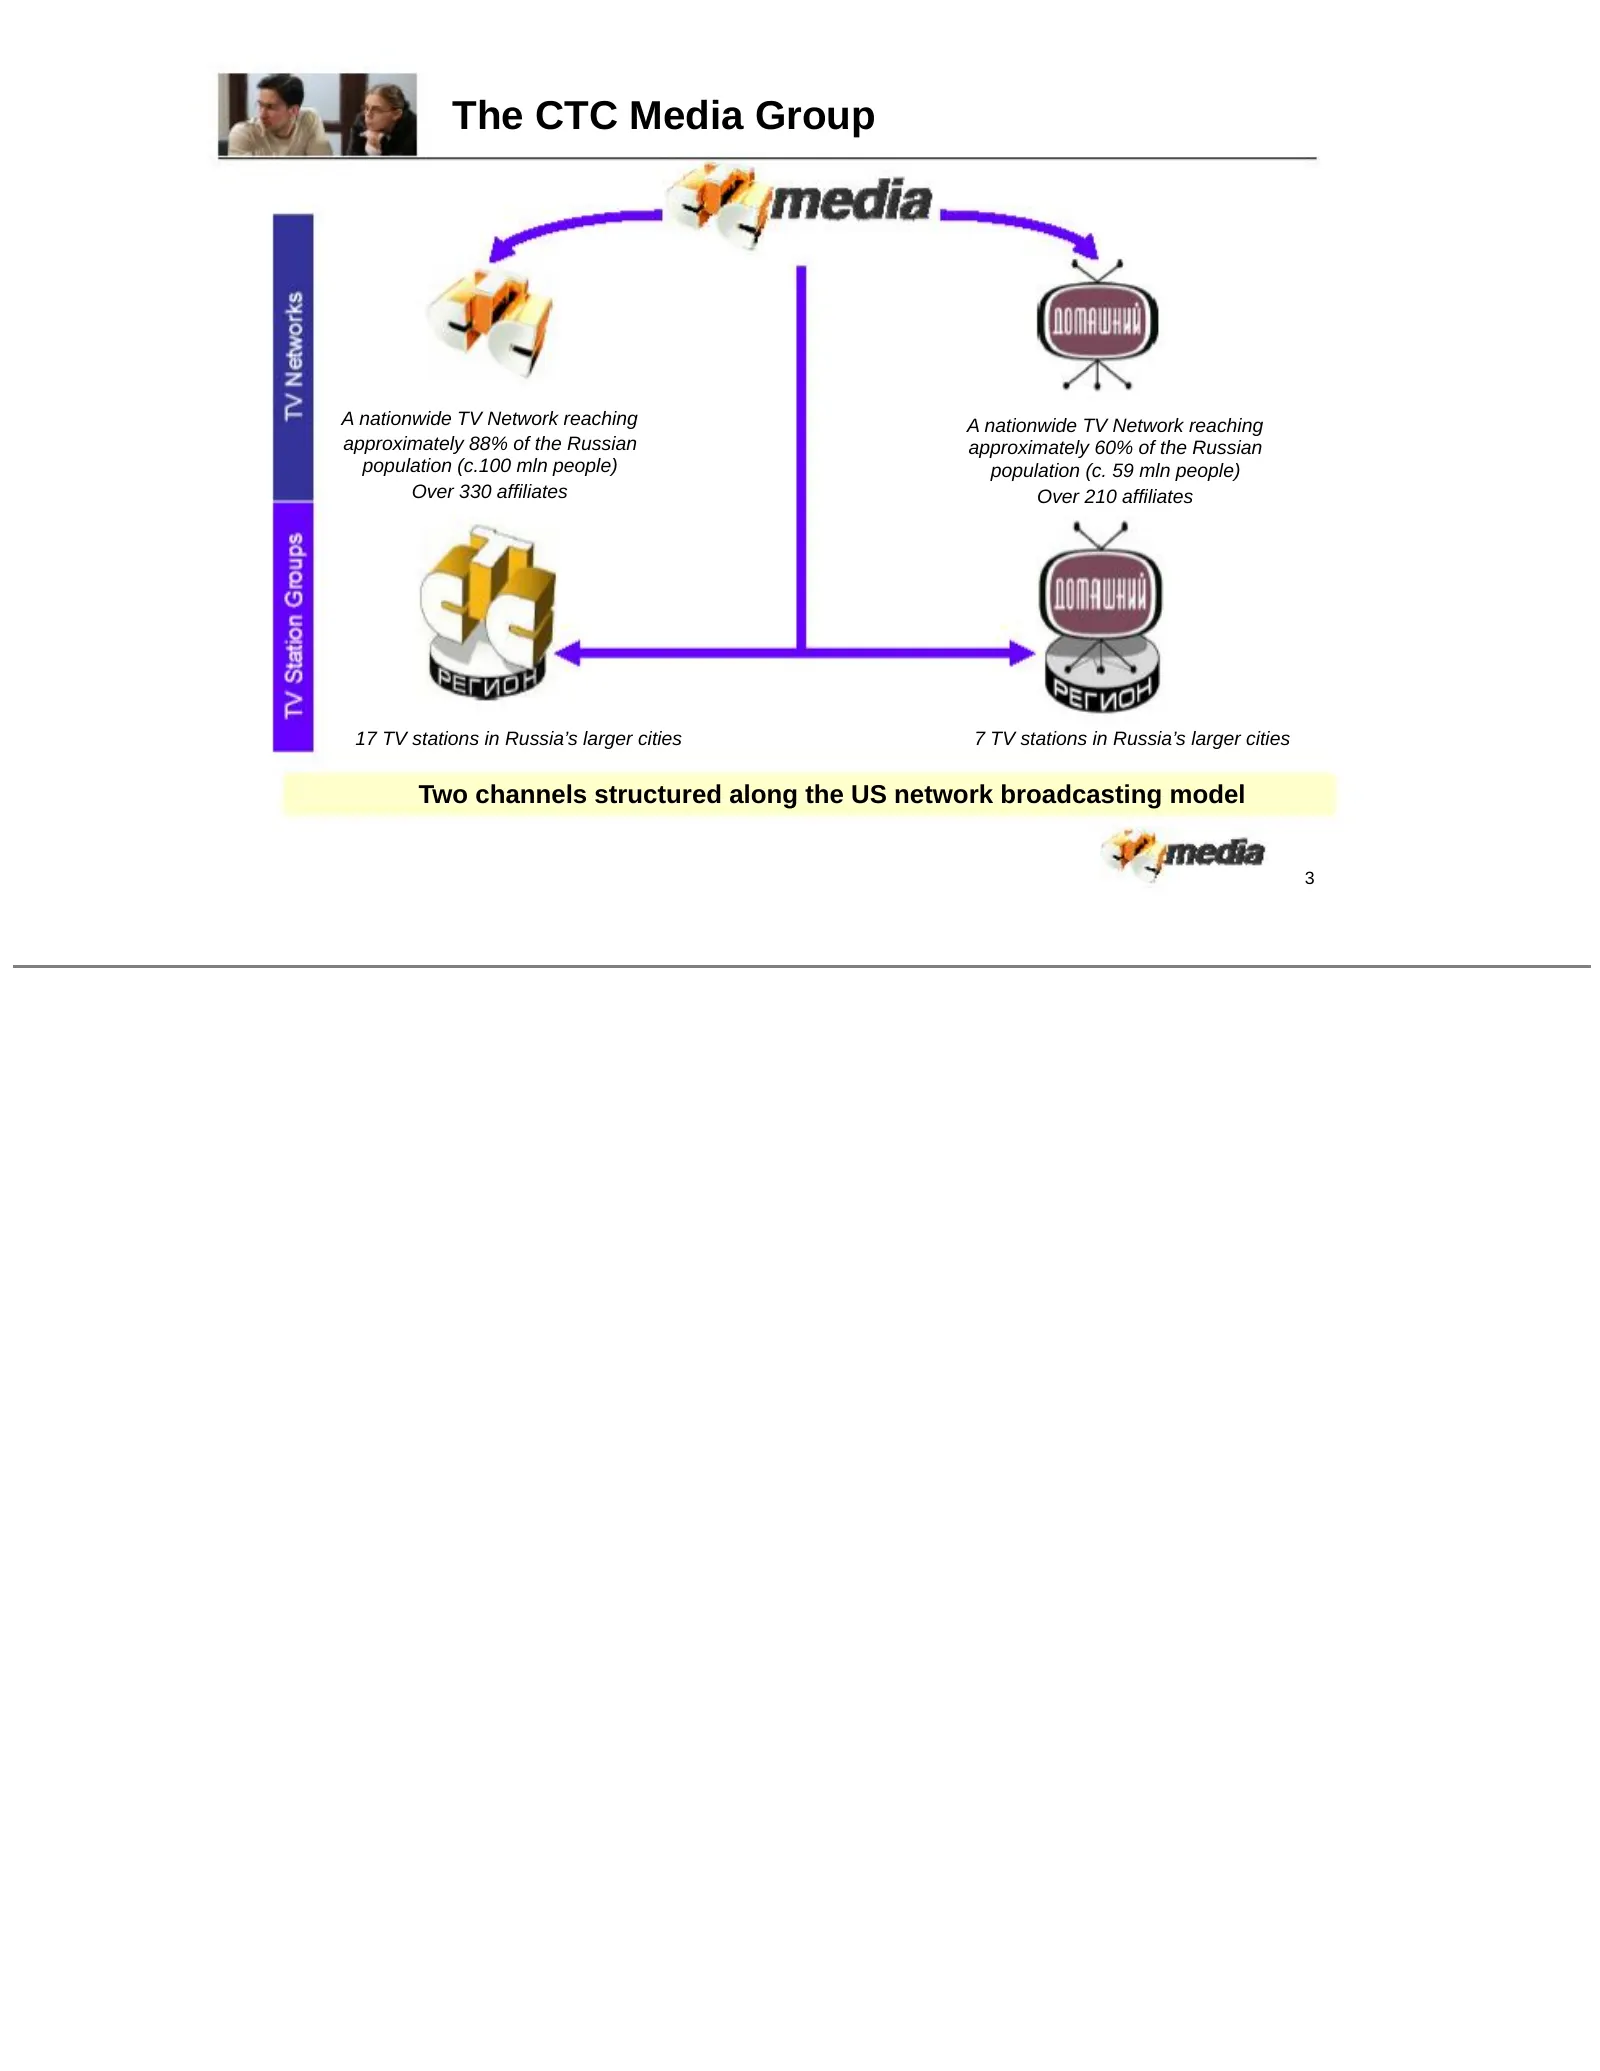
The CTC Media Group A nationwide TV Network reaching A nationwide TV Network reaching approximately 88% of the Russian approximately 60% of the Russian population (c.100 mln people) population (c. 59 mln people) Over 330 affiliates Over 210 affiliates 17 TV stations in Russia’s larger cities 7 TV st
Slide 6: Benefits of Network Model in Russia
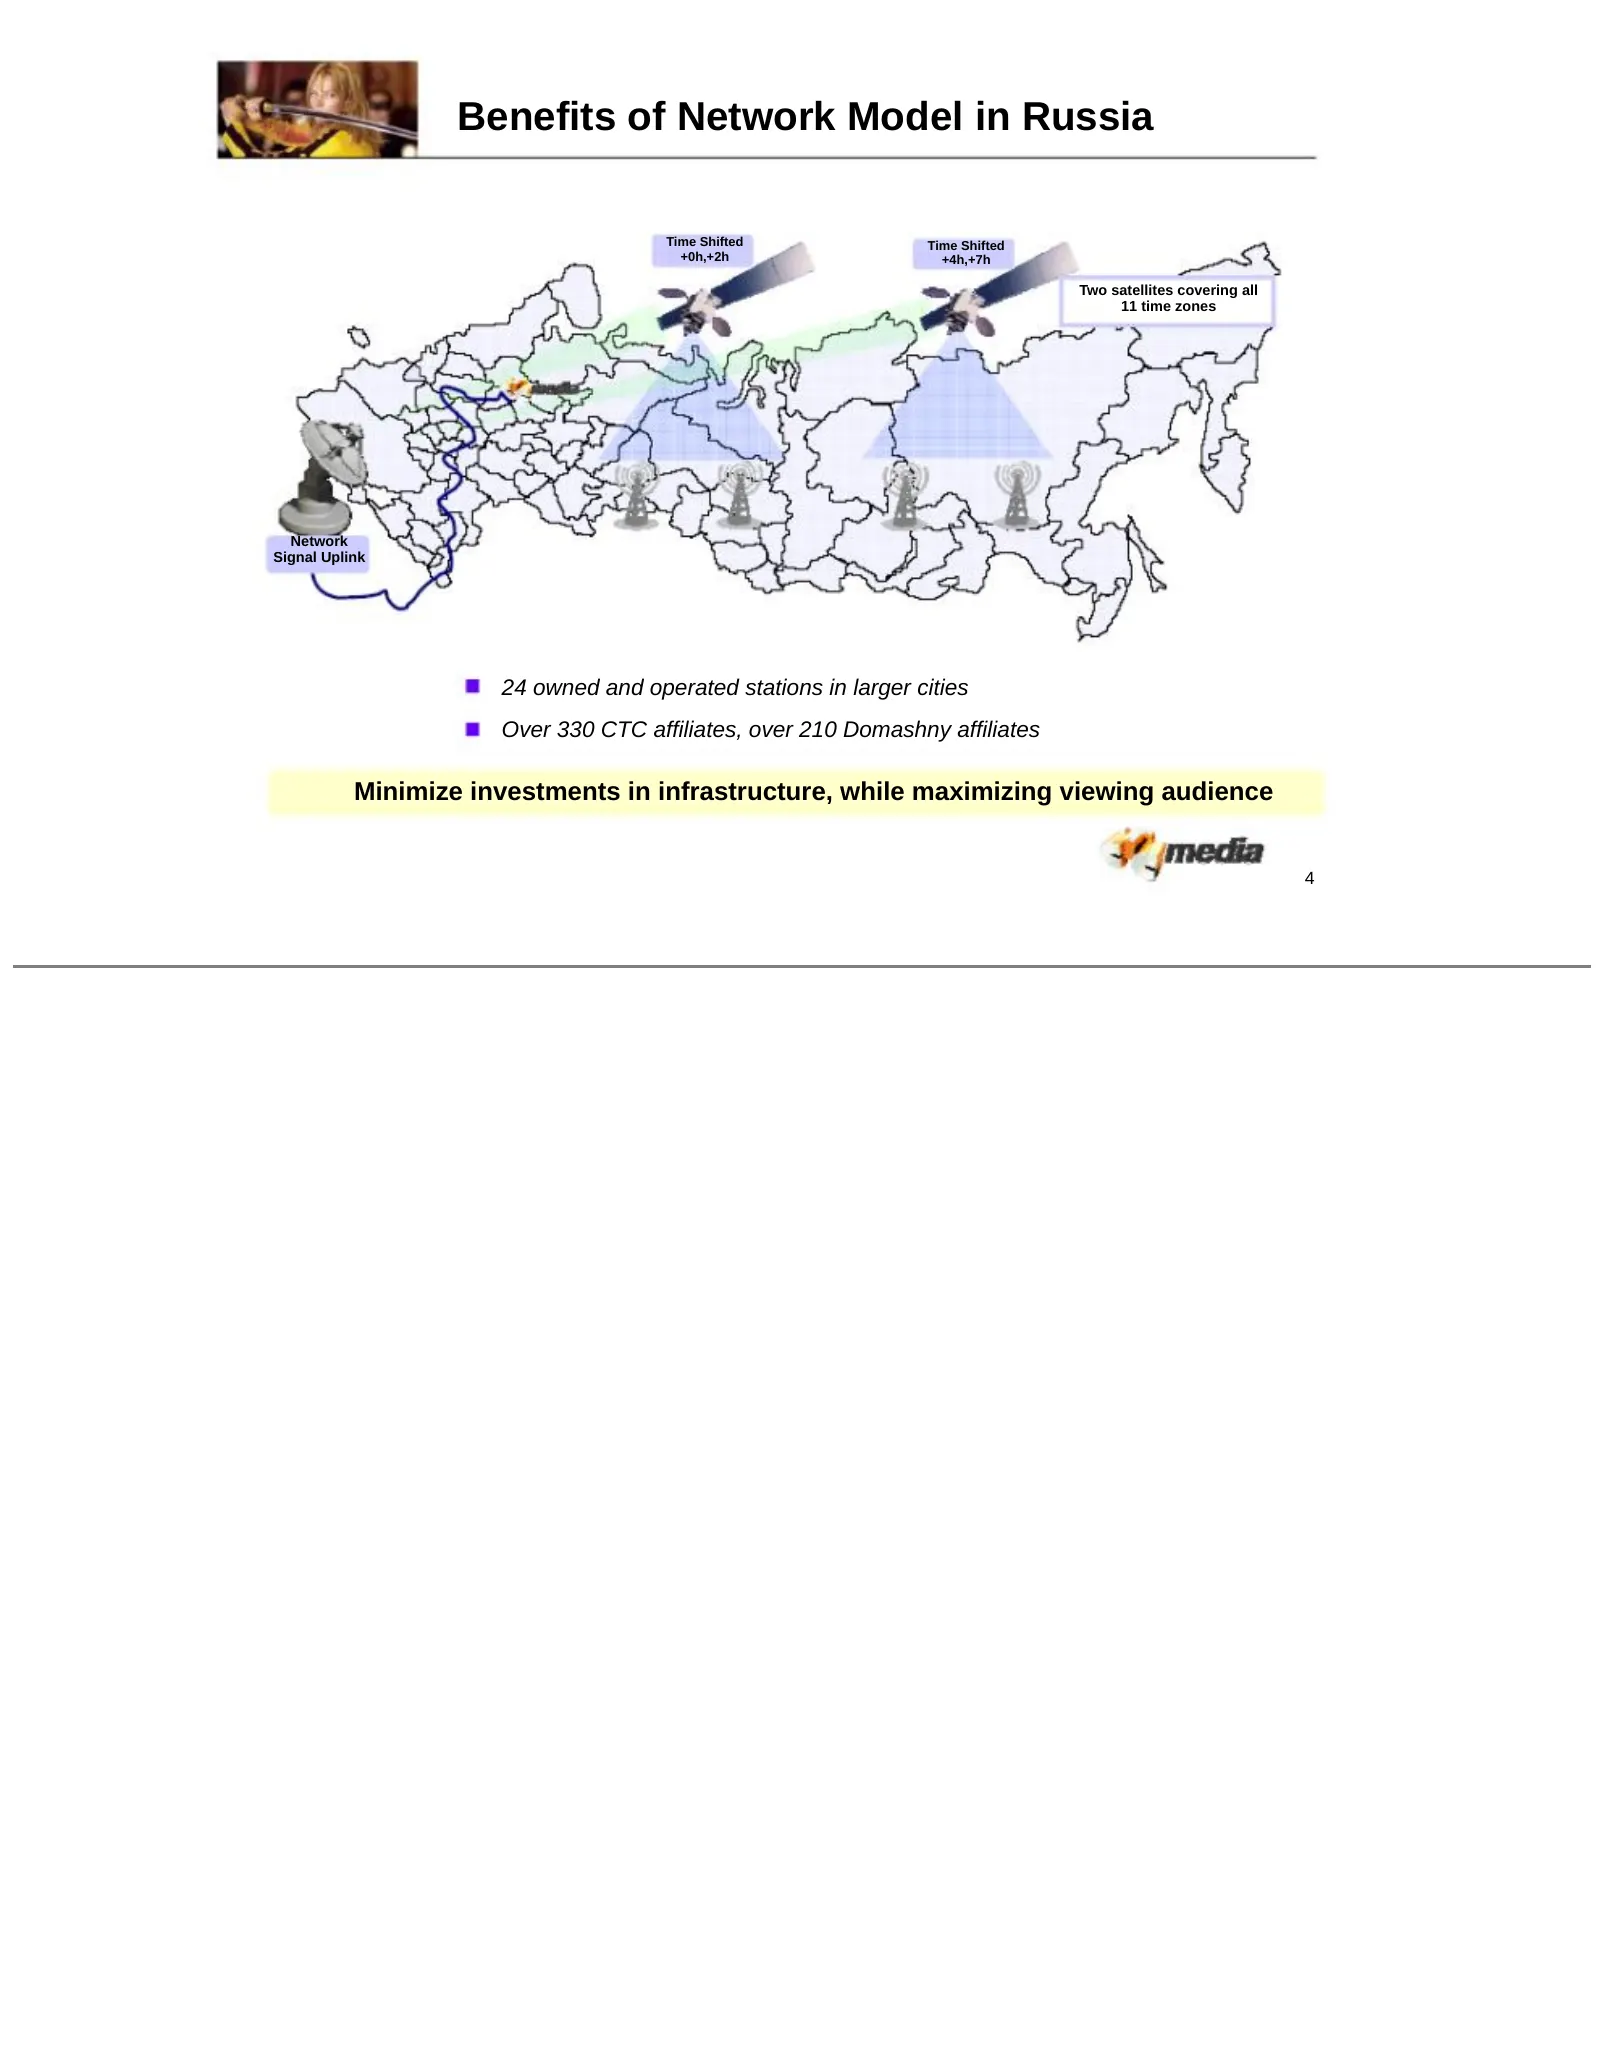
Benefits of Network Model in Russia Time Shifted Time Shifted +0h,+2h +4h,+7h Two satellites covering all 11 time zones Network Signal Uplink 24 owned and operated stations in larger cities Over 330 CTC affiliates, over 210 Domashny affiliates Minimize investments in infrastructure, while maximizing
Slide 7: One of the Largest Ad Markets in Europe
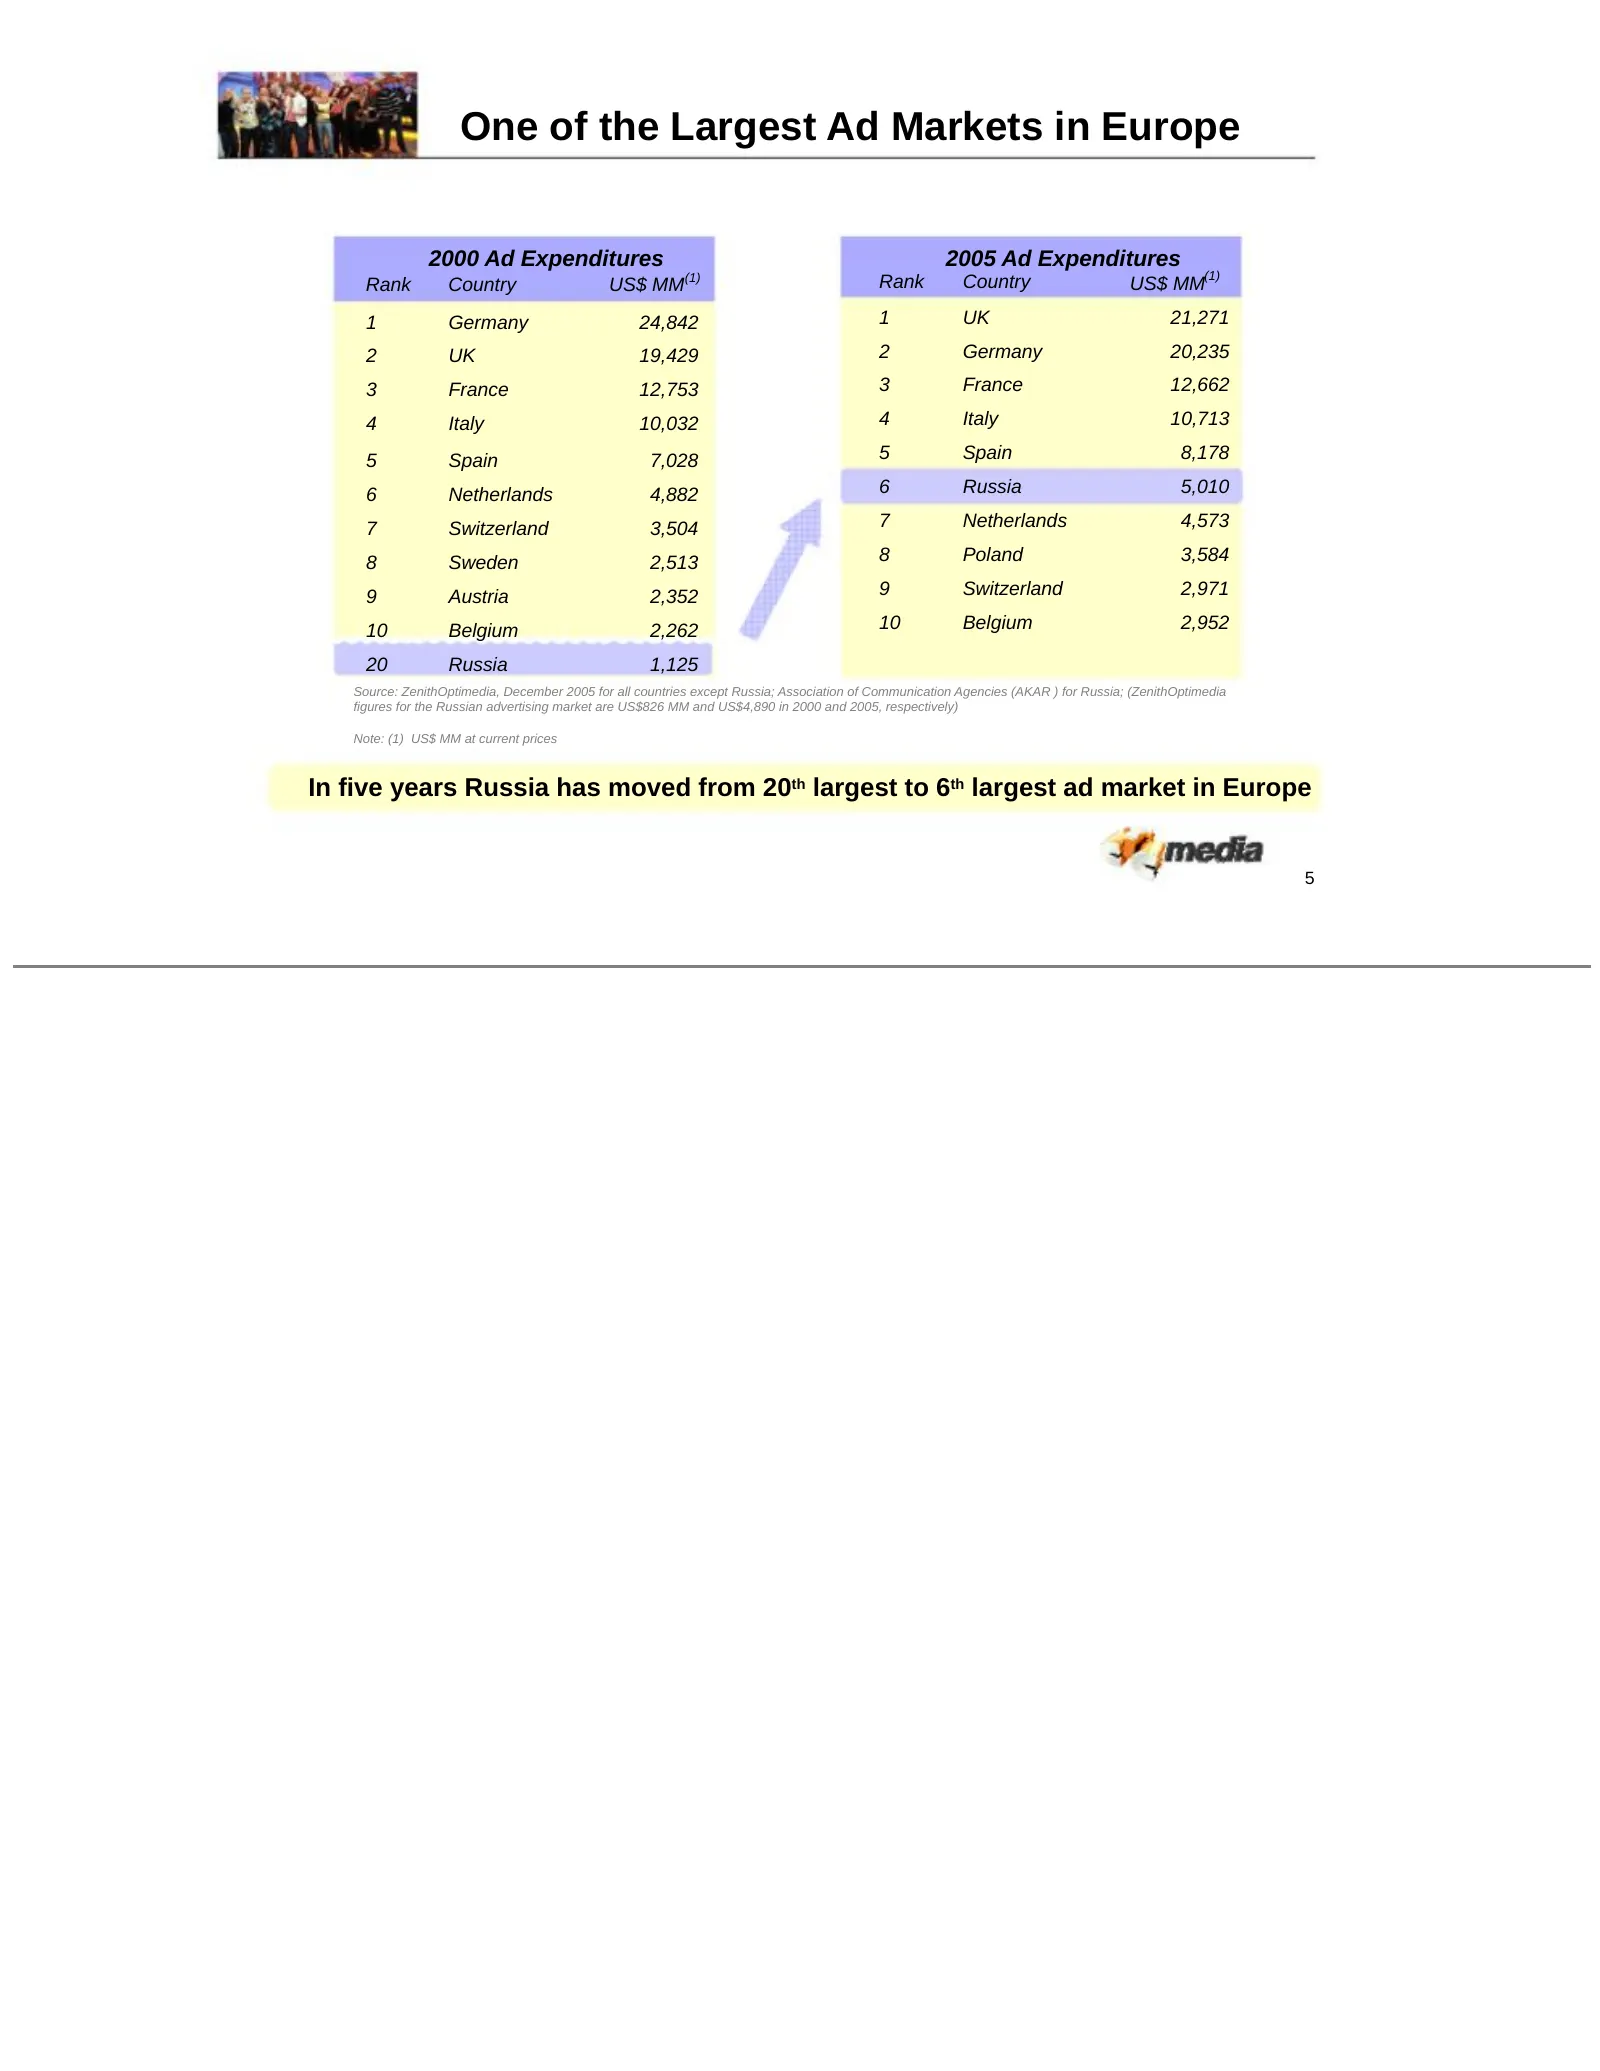
One of the Largest Ad Markets in Europe 2000 Ad Expenditures 2005 Ad Expenditures (1) (1) Rank Country US$ MM Rank Country US$ MM 1 Germany 24,842 1 UK 21,271 2 UK 19,429 2 Germany 20,235 3 France 12,753 3 France 12,662 4 Italy 10,032 4 Italy 10,713 5 Spain 7,028 5 Spain 8,178 6 Netherlands 4,882 6
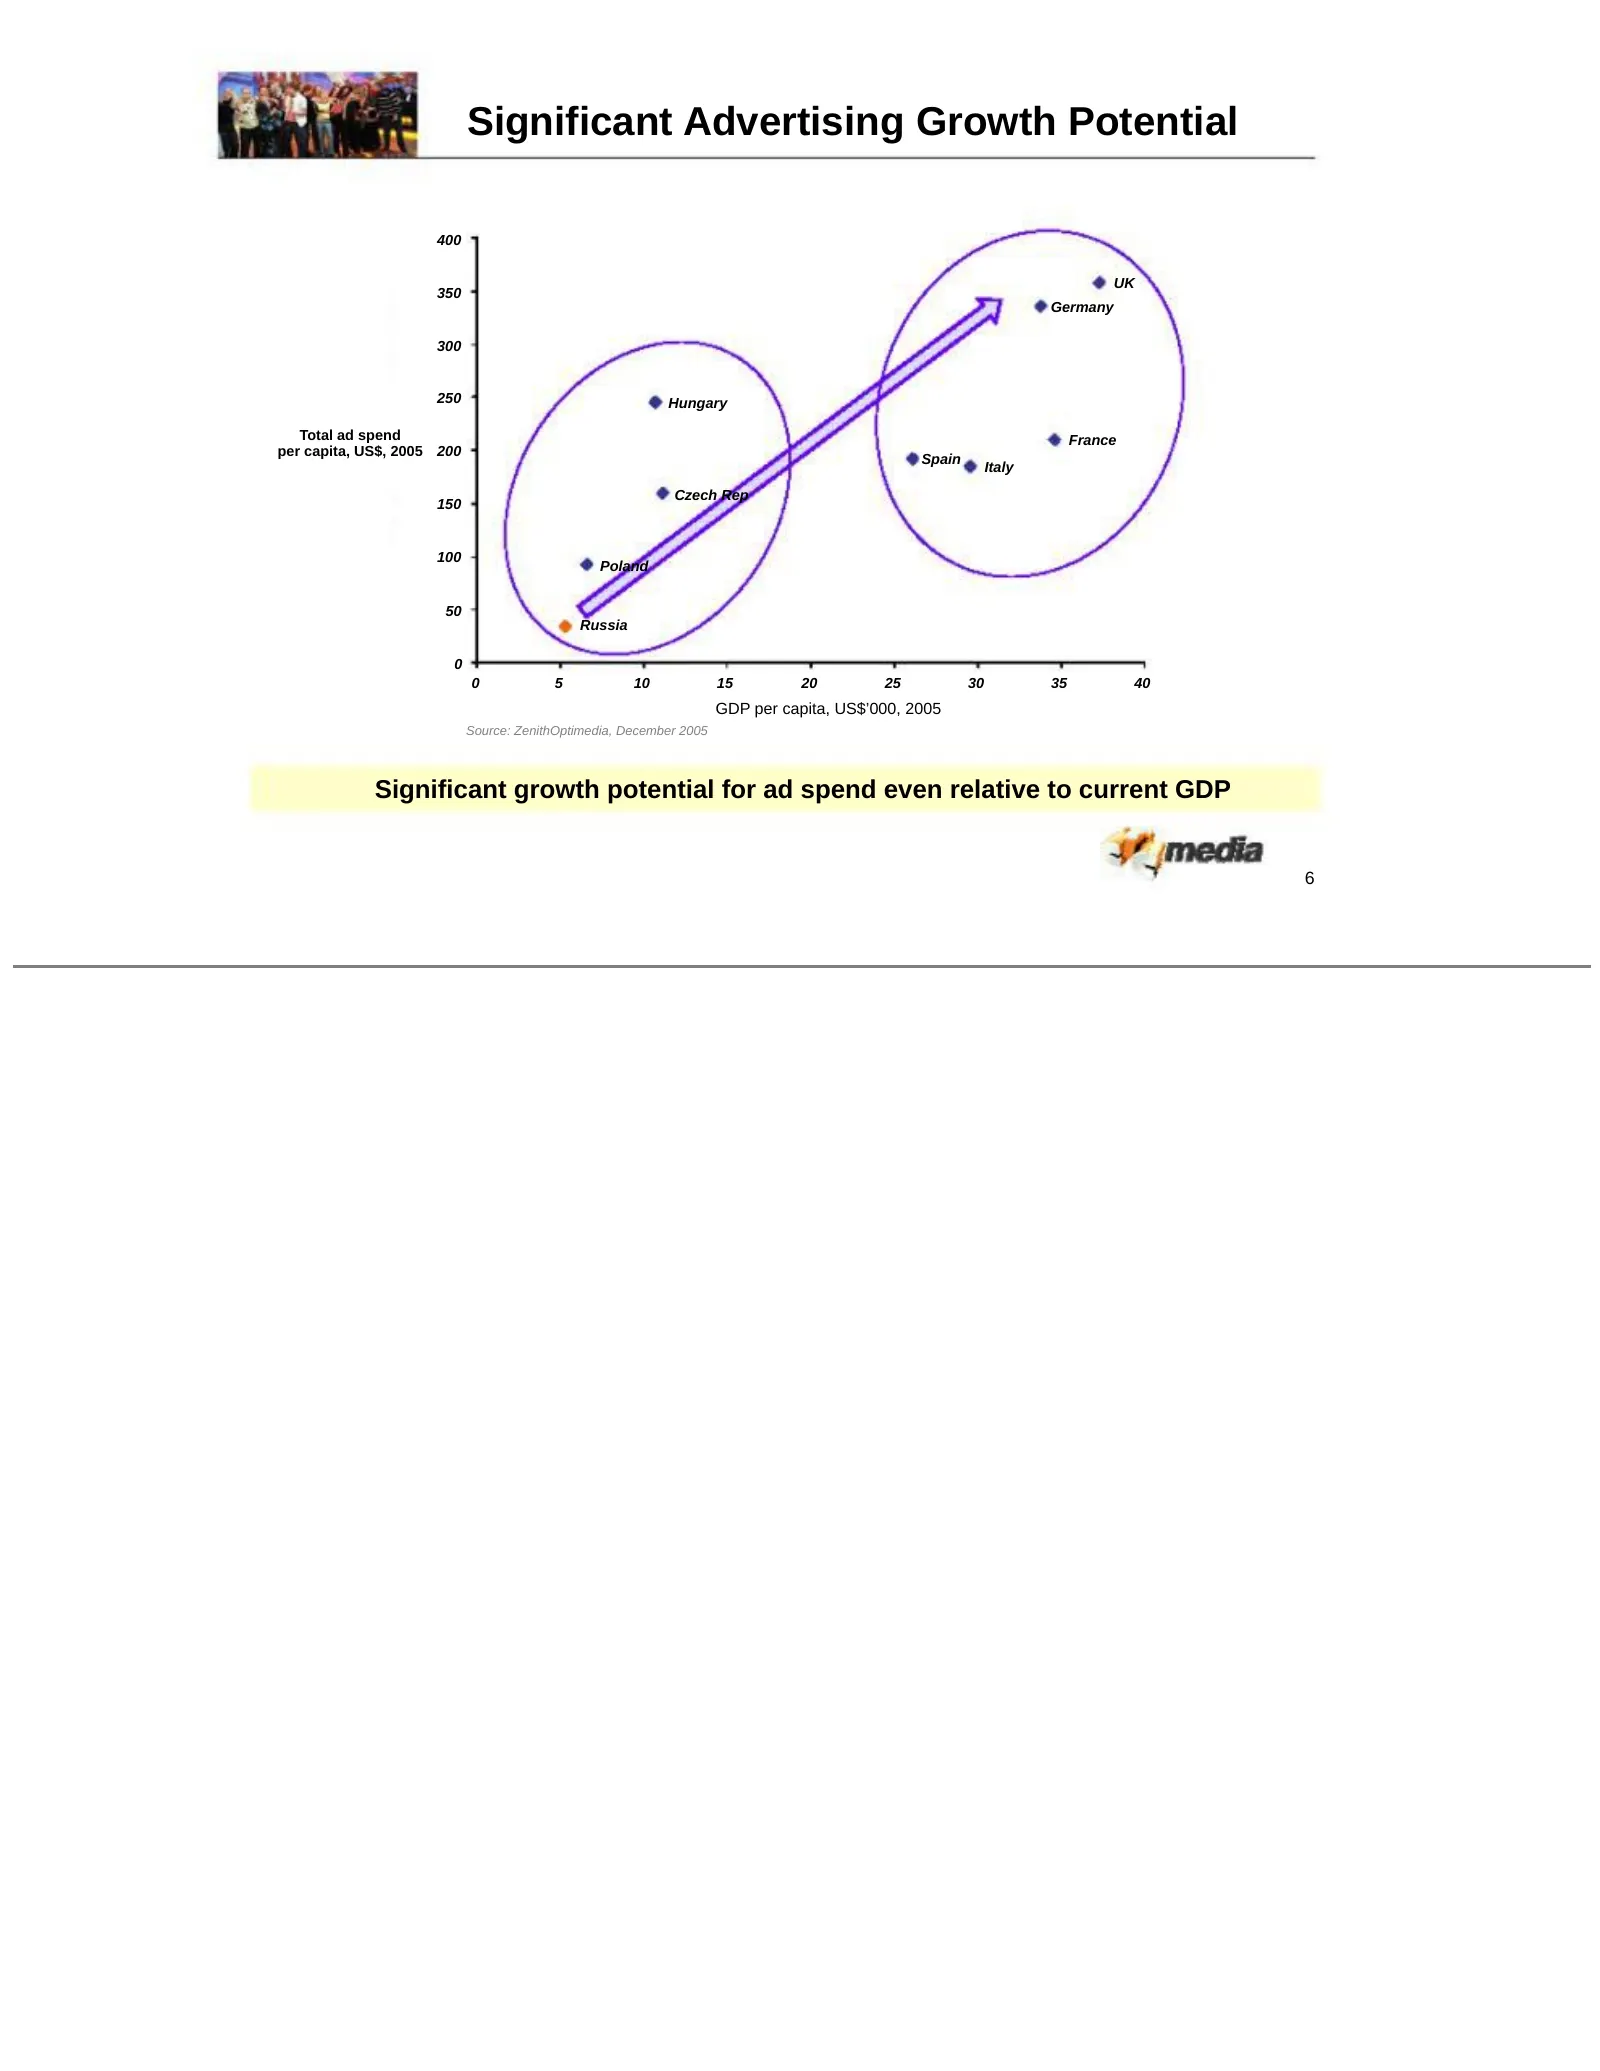
Slide 8: Significant Advertising Growth Potential
Significant Advertising Growth Potential 400 UK 350 Germany 300 250 Hungary Total ad spend France per capita, US$, 2005 200 Spain Italy Czech Rep 150 100 Poland 50 Russia 0 0 5 10 15 20 25 30 35 40 GDP per capita, US$’000, 2005 Source: ZenithOptimedia, December 2005 Significant growth potential for
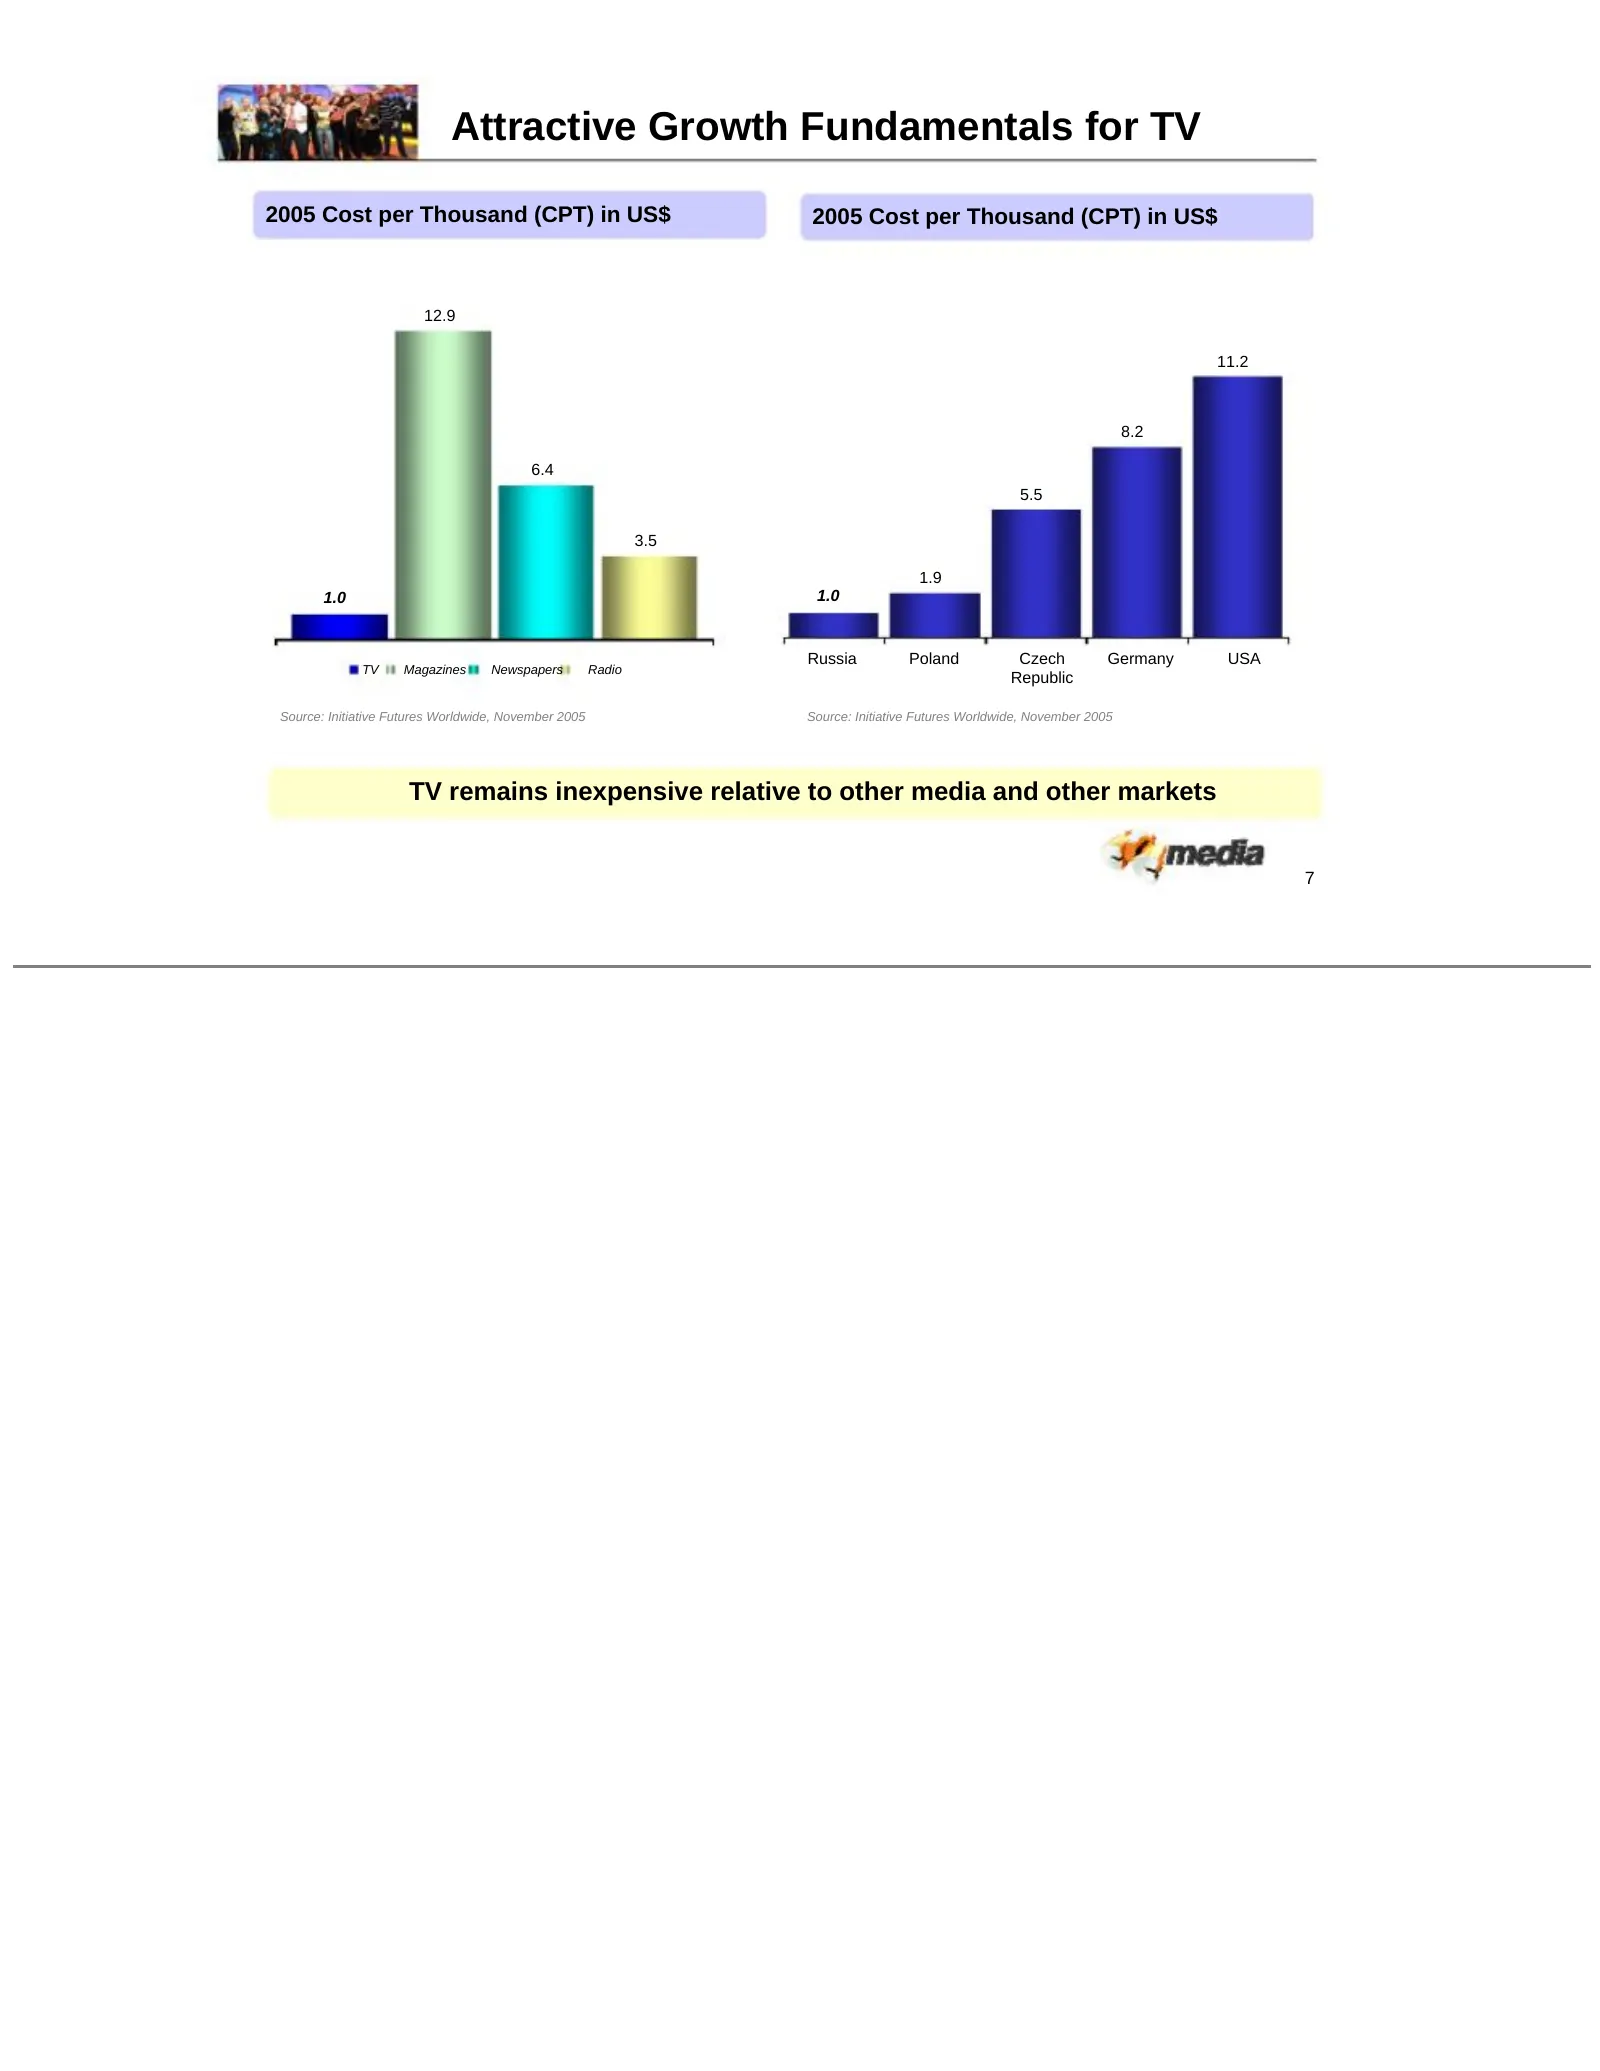
Slide 9: Attractive Growth Fundamentals for TV
Attractive Growth Fundamentals for TV 2005 Cost per Thousand (CPT) in US$ 2005 Cost per Thousand (CPT) in US$ 12.9 11.2 8.2 6.4 5.5 3.5 1.9 1.0 1.0 Russia Poland Czech Germany USA TV Magazines Newspapers Radio Republic Source: Initiative Futures Worldwide, November 2005 Source: Initiative Futures Wo
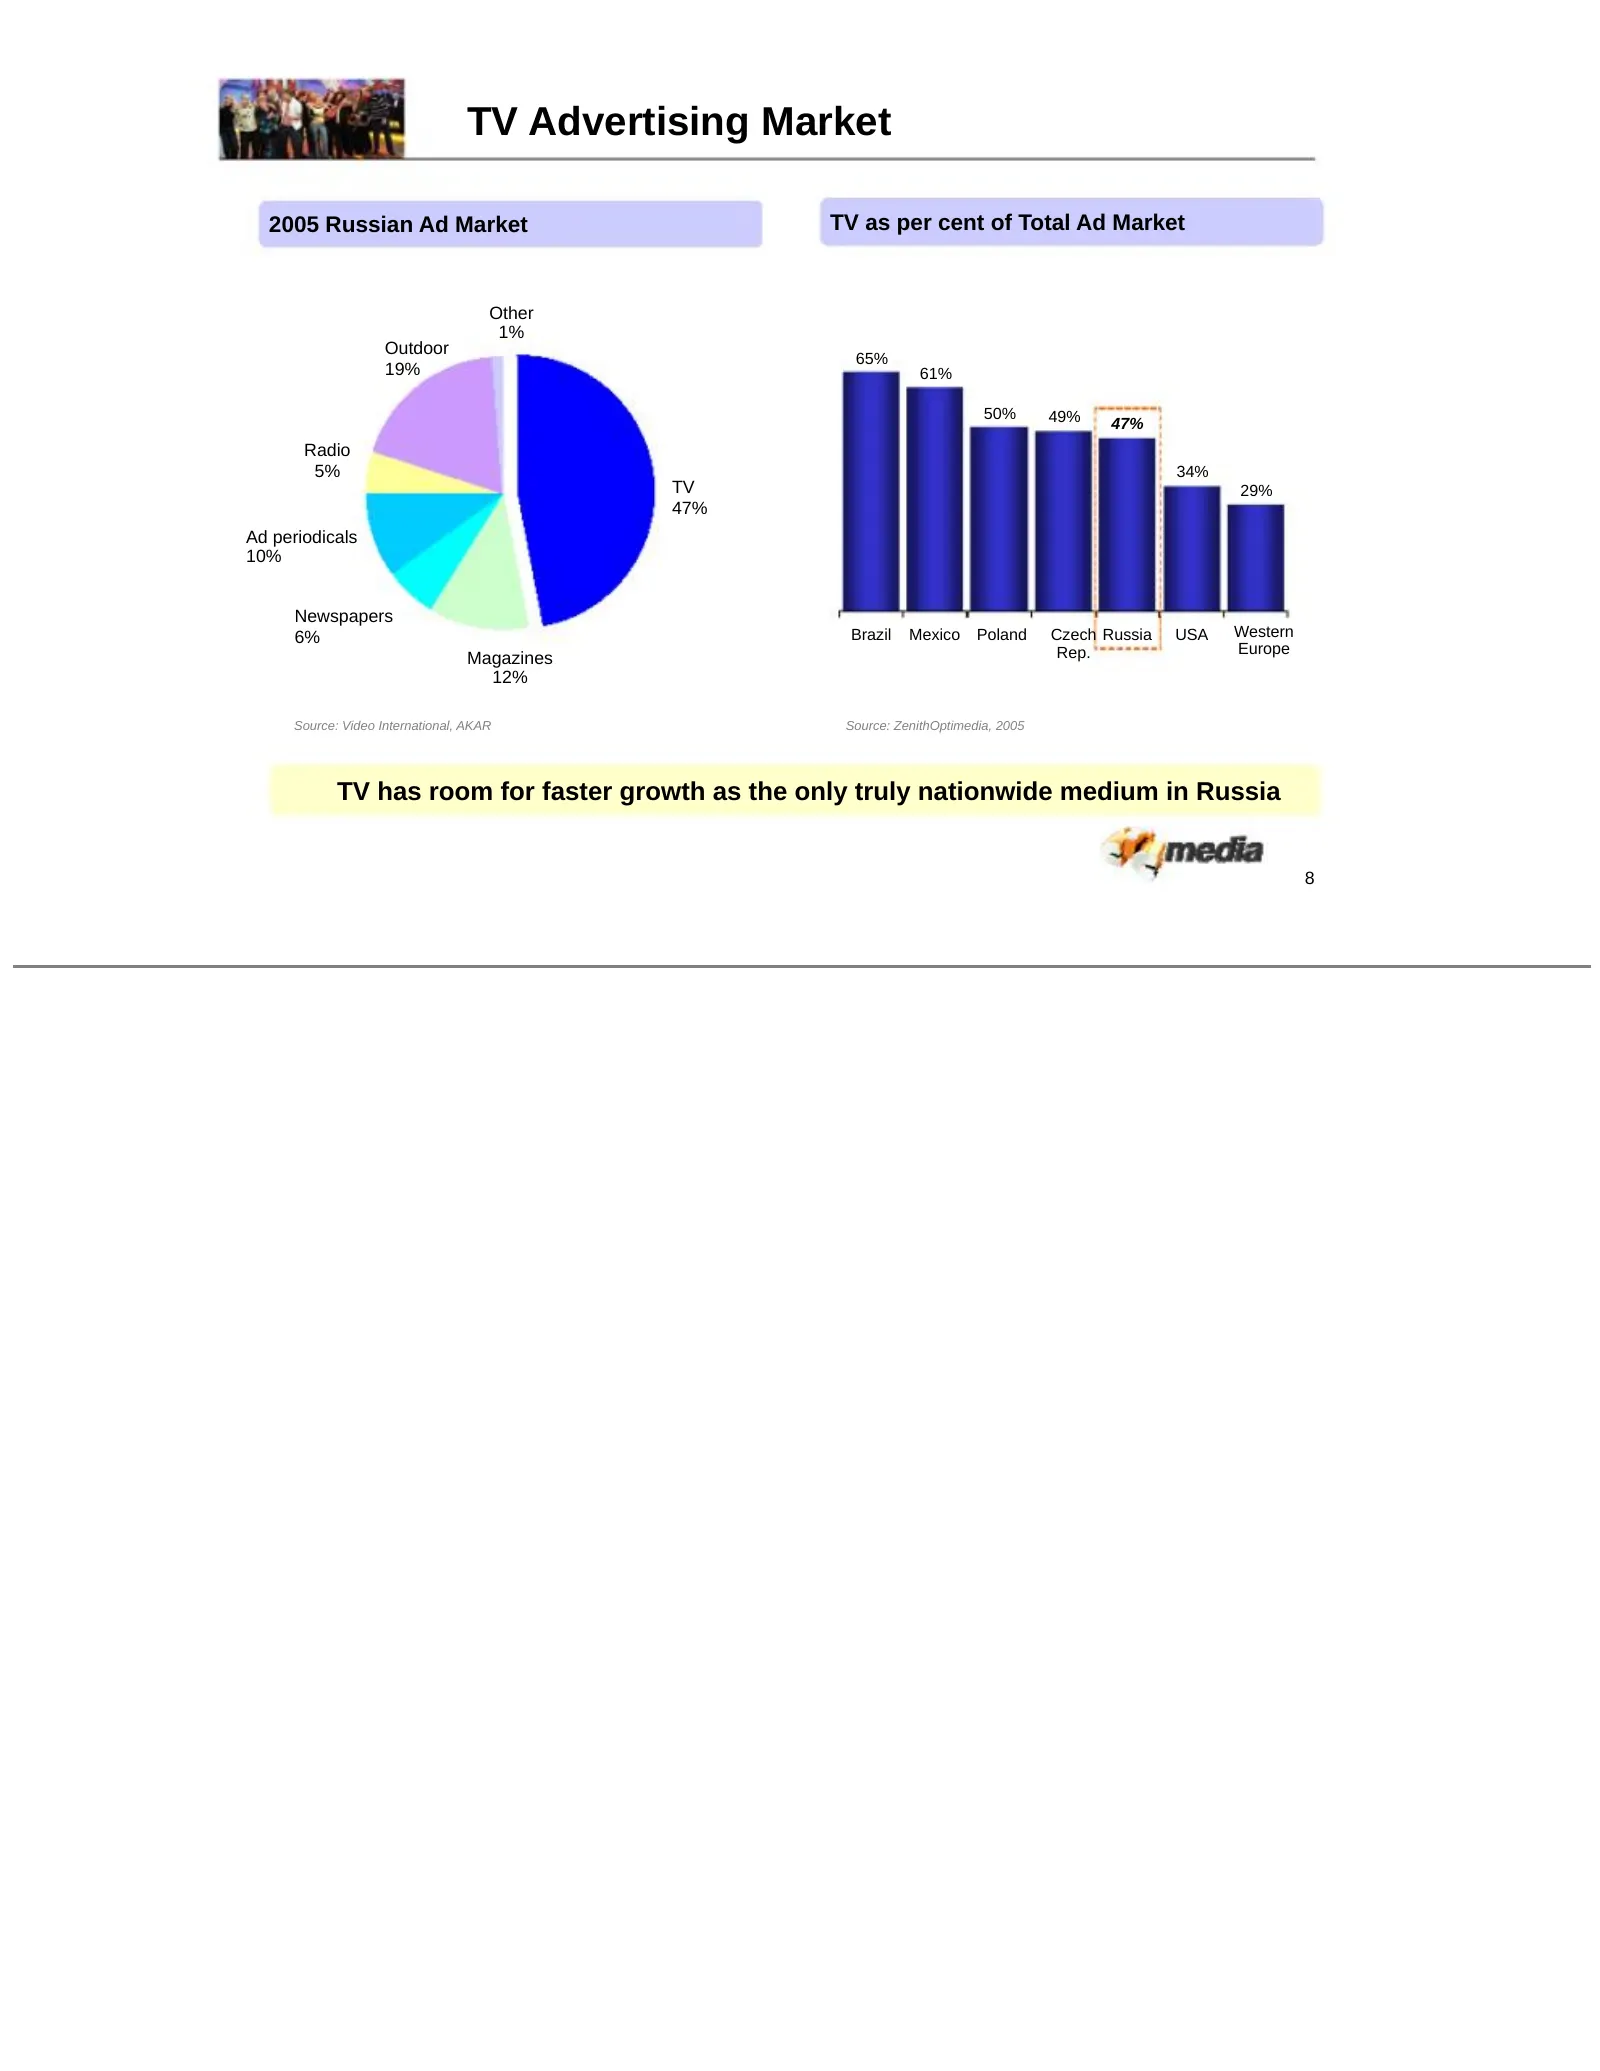
Slide 10: TV Advertising Market
TV Advertising Market 2005 Russian Ad Market TV as per cent of Total Ad Market Other 1% Outdoor 65% 19% 61% 50% 49% 47% Radio 5% 34% TV 29% 47% Ad periodicals 10% Newspapers 6% Brazil Mexico Poland Czech Russia USA Western Rep. Europe Magazines 12% Source: Video International, AKAR Source: ZenithOpt
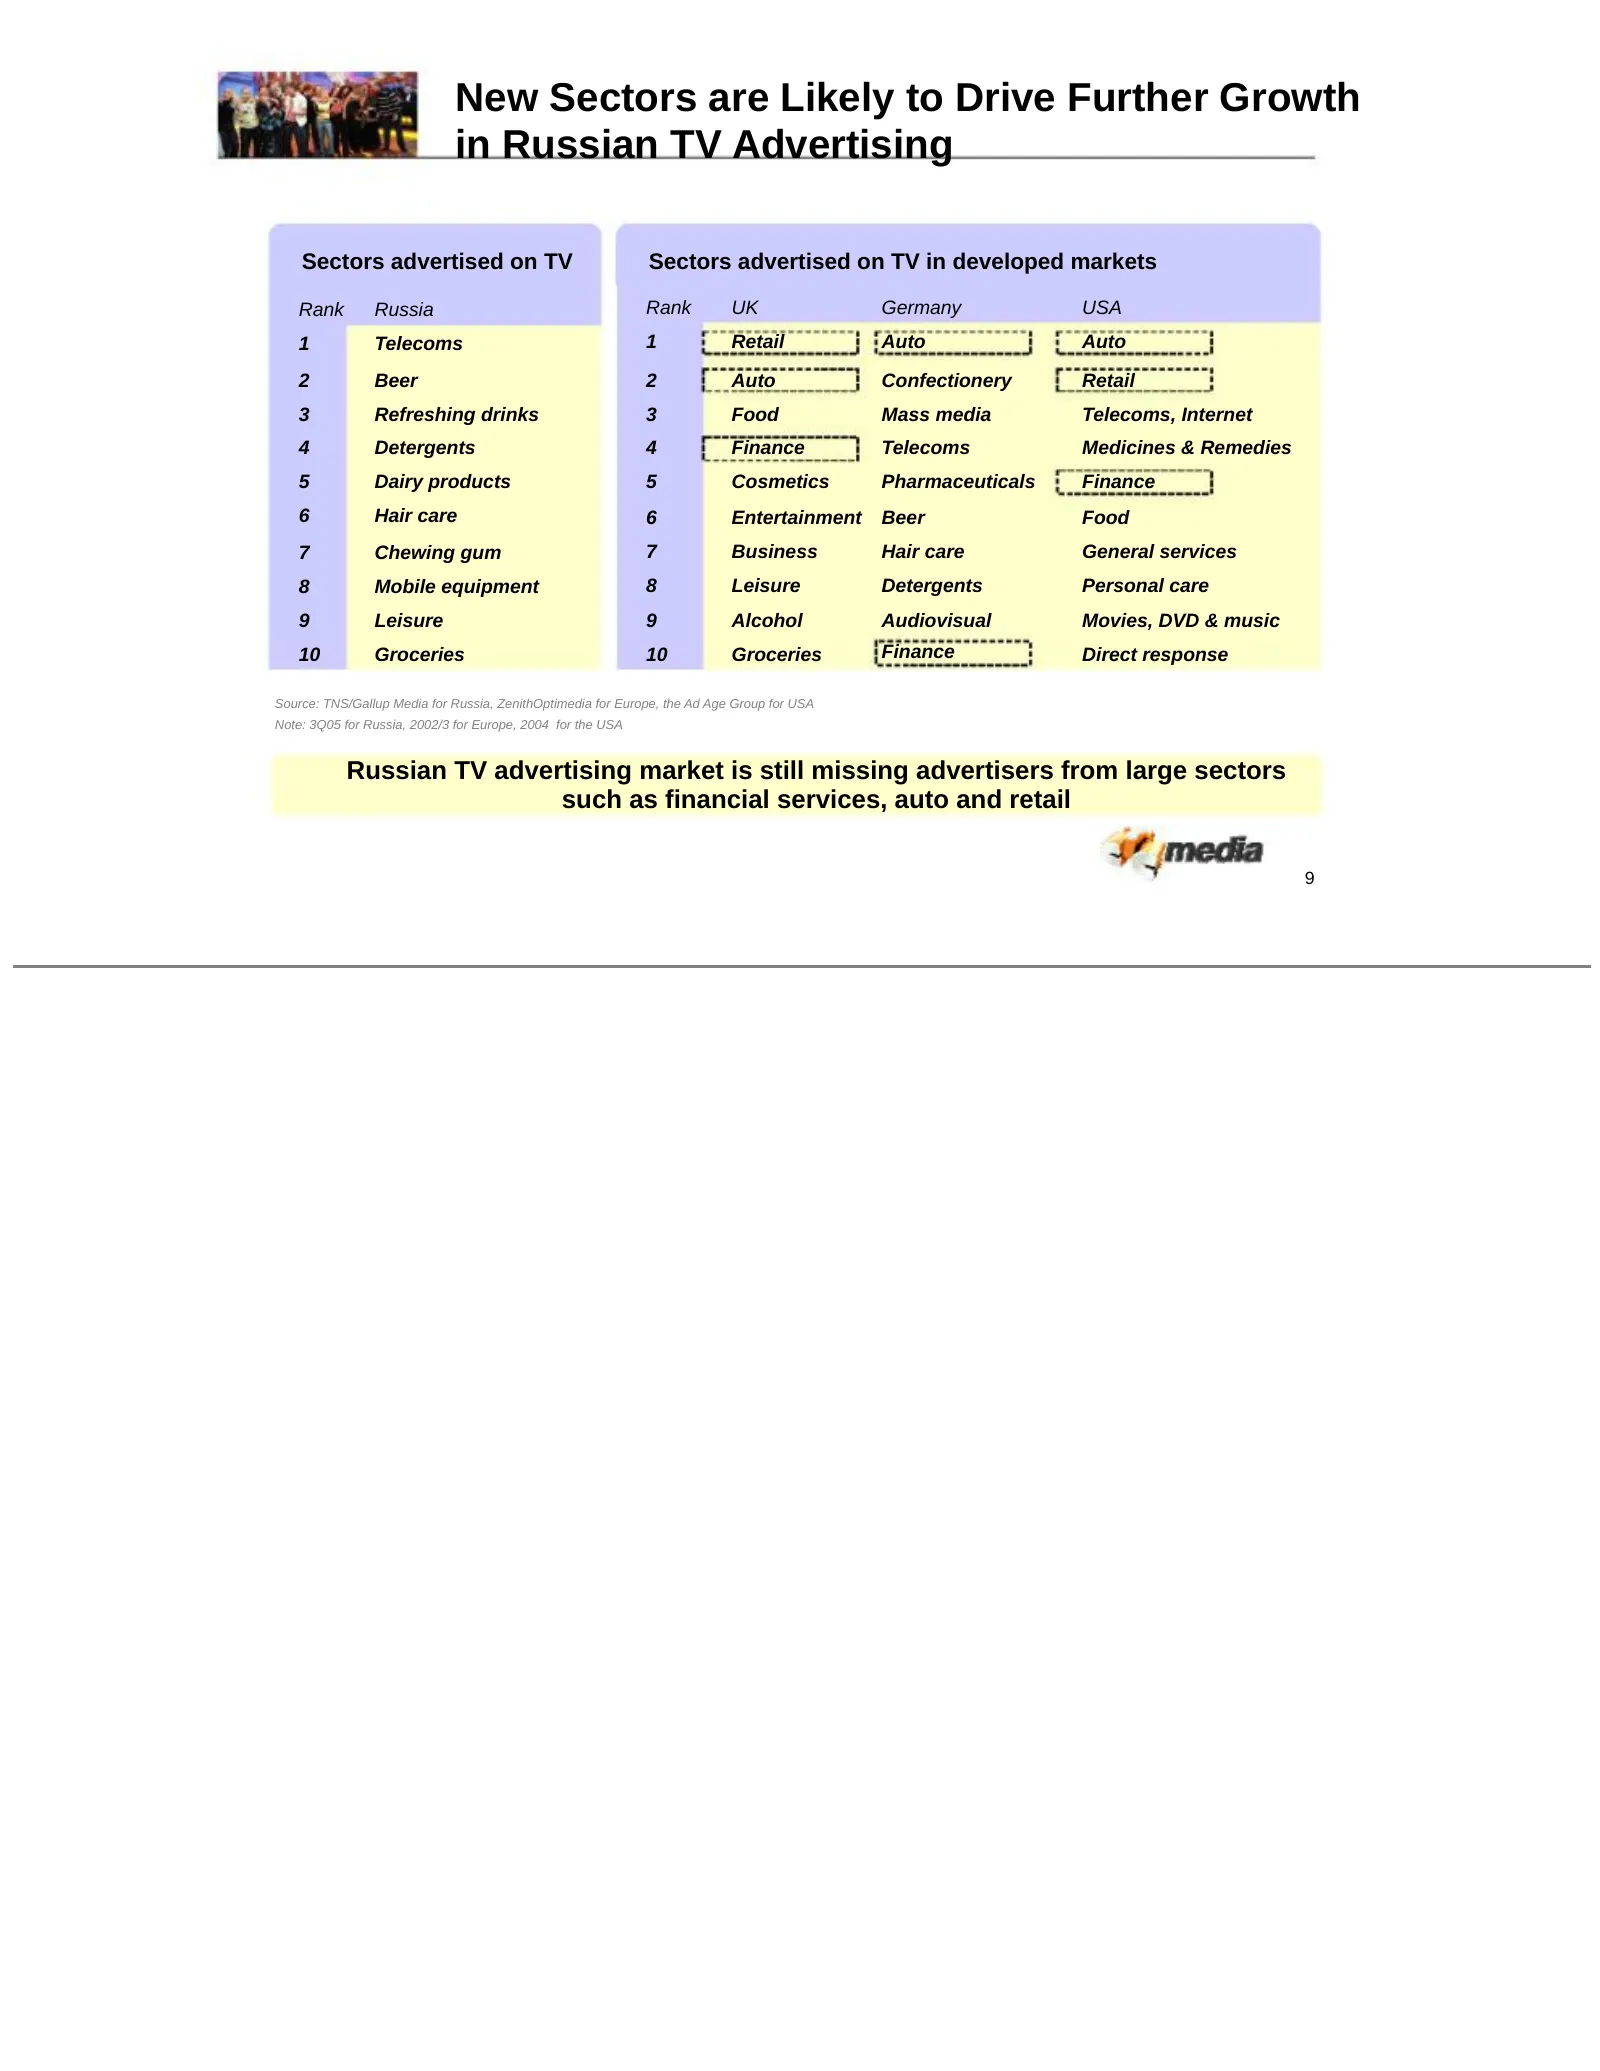
Slide 11: New Sectors are Likely to Drive Further Growth in Russian TV Advertising
New Sectors are Likely to Drive Further Growth in Russian TV Advertising Sectors advertised on TV Sectors advertised on TV in developed markets Rank Russia Rank UK Germany USA 1 Telecoms 1 Retail Auto Auto 2 Beer 2 Auto Confectionery Retail 3 Refreshing drinks 3 Food Mass media Telecoms, Internet 4
Slide 12: Targeting Audiences which are Most Attractive to Advertisers
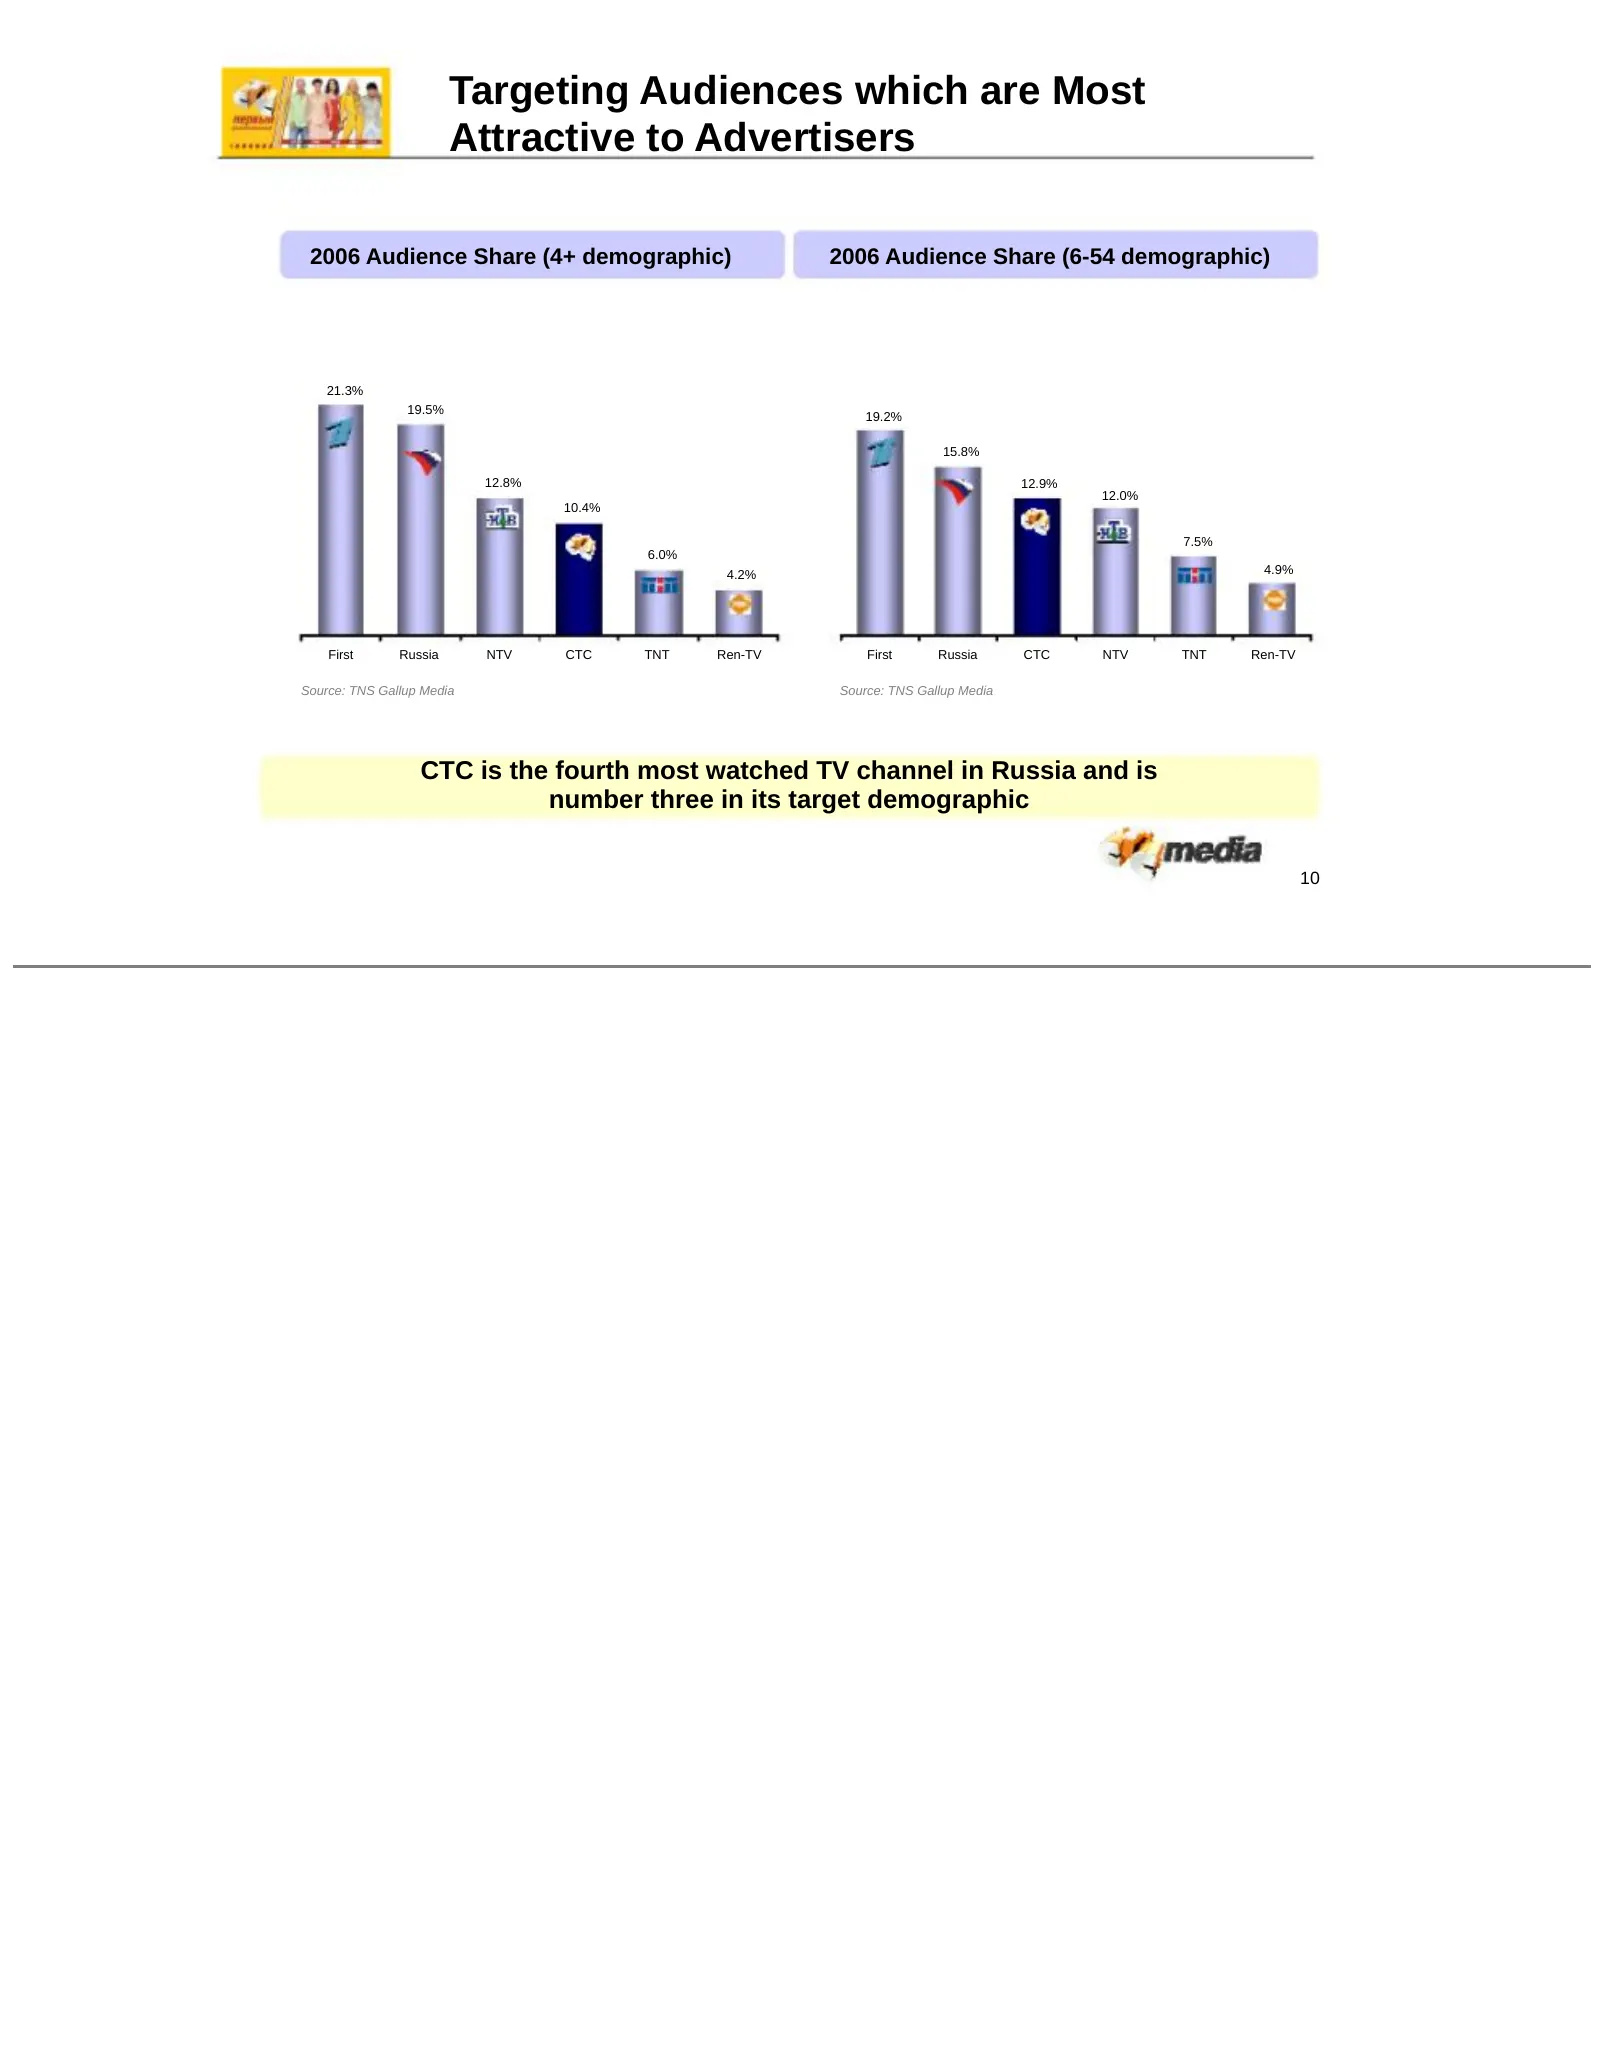
Targeting Audiences which are Most Attractive to Advertisers 2006 Audience Share (4+ demographic) 2006 Audience Share (6-54 demographic) 21.3% 19.5% 19.2% 15.8% 12.8% 12.9% 12.0% 10.4% 7.5% 6.0% 4.2% 4.9% First Russia NTV CTC TNT Ren-TV First Russia CTC NTV TNT Ren-TV Source: TNS Gallup Media Source
Slide 13: Pure Entertainment Focus at CTC
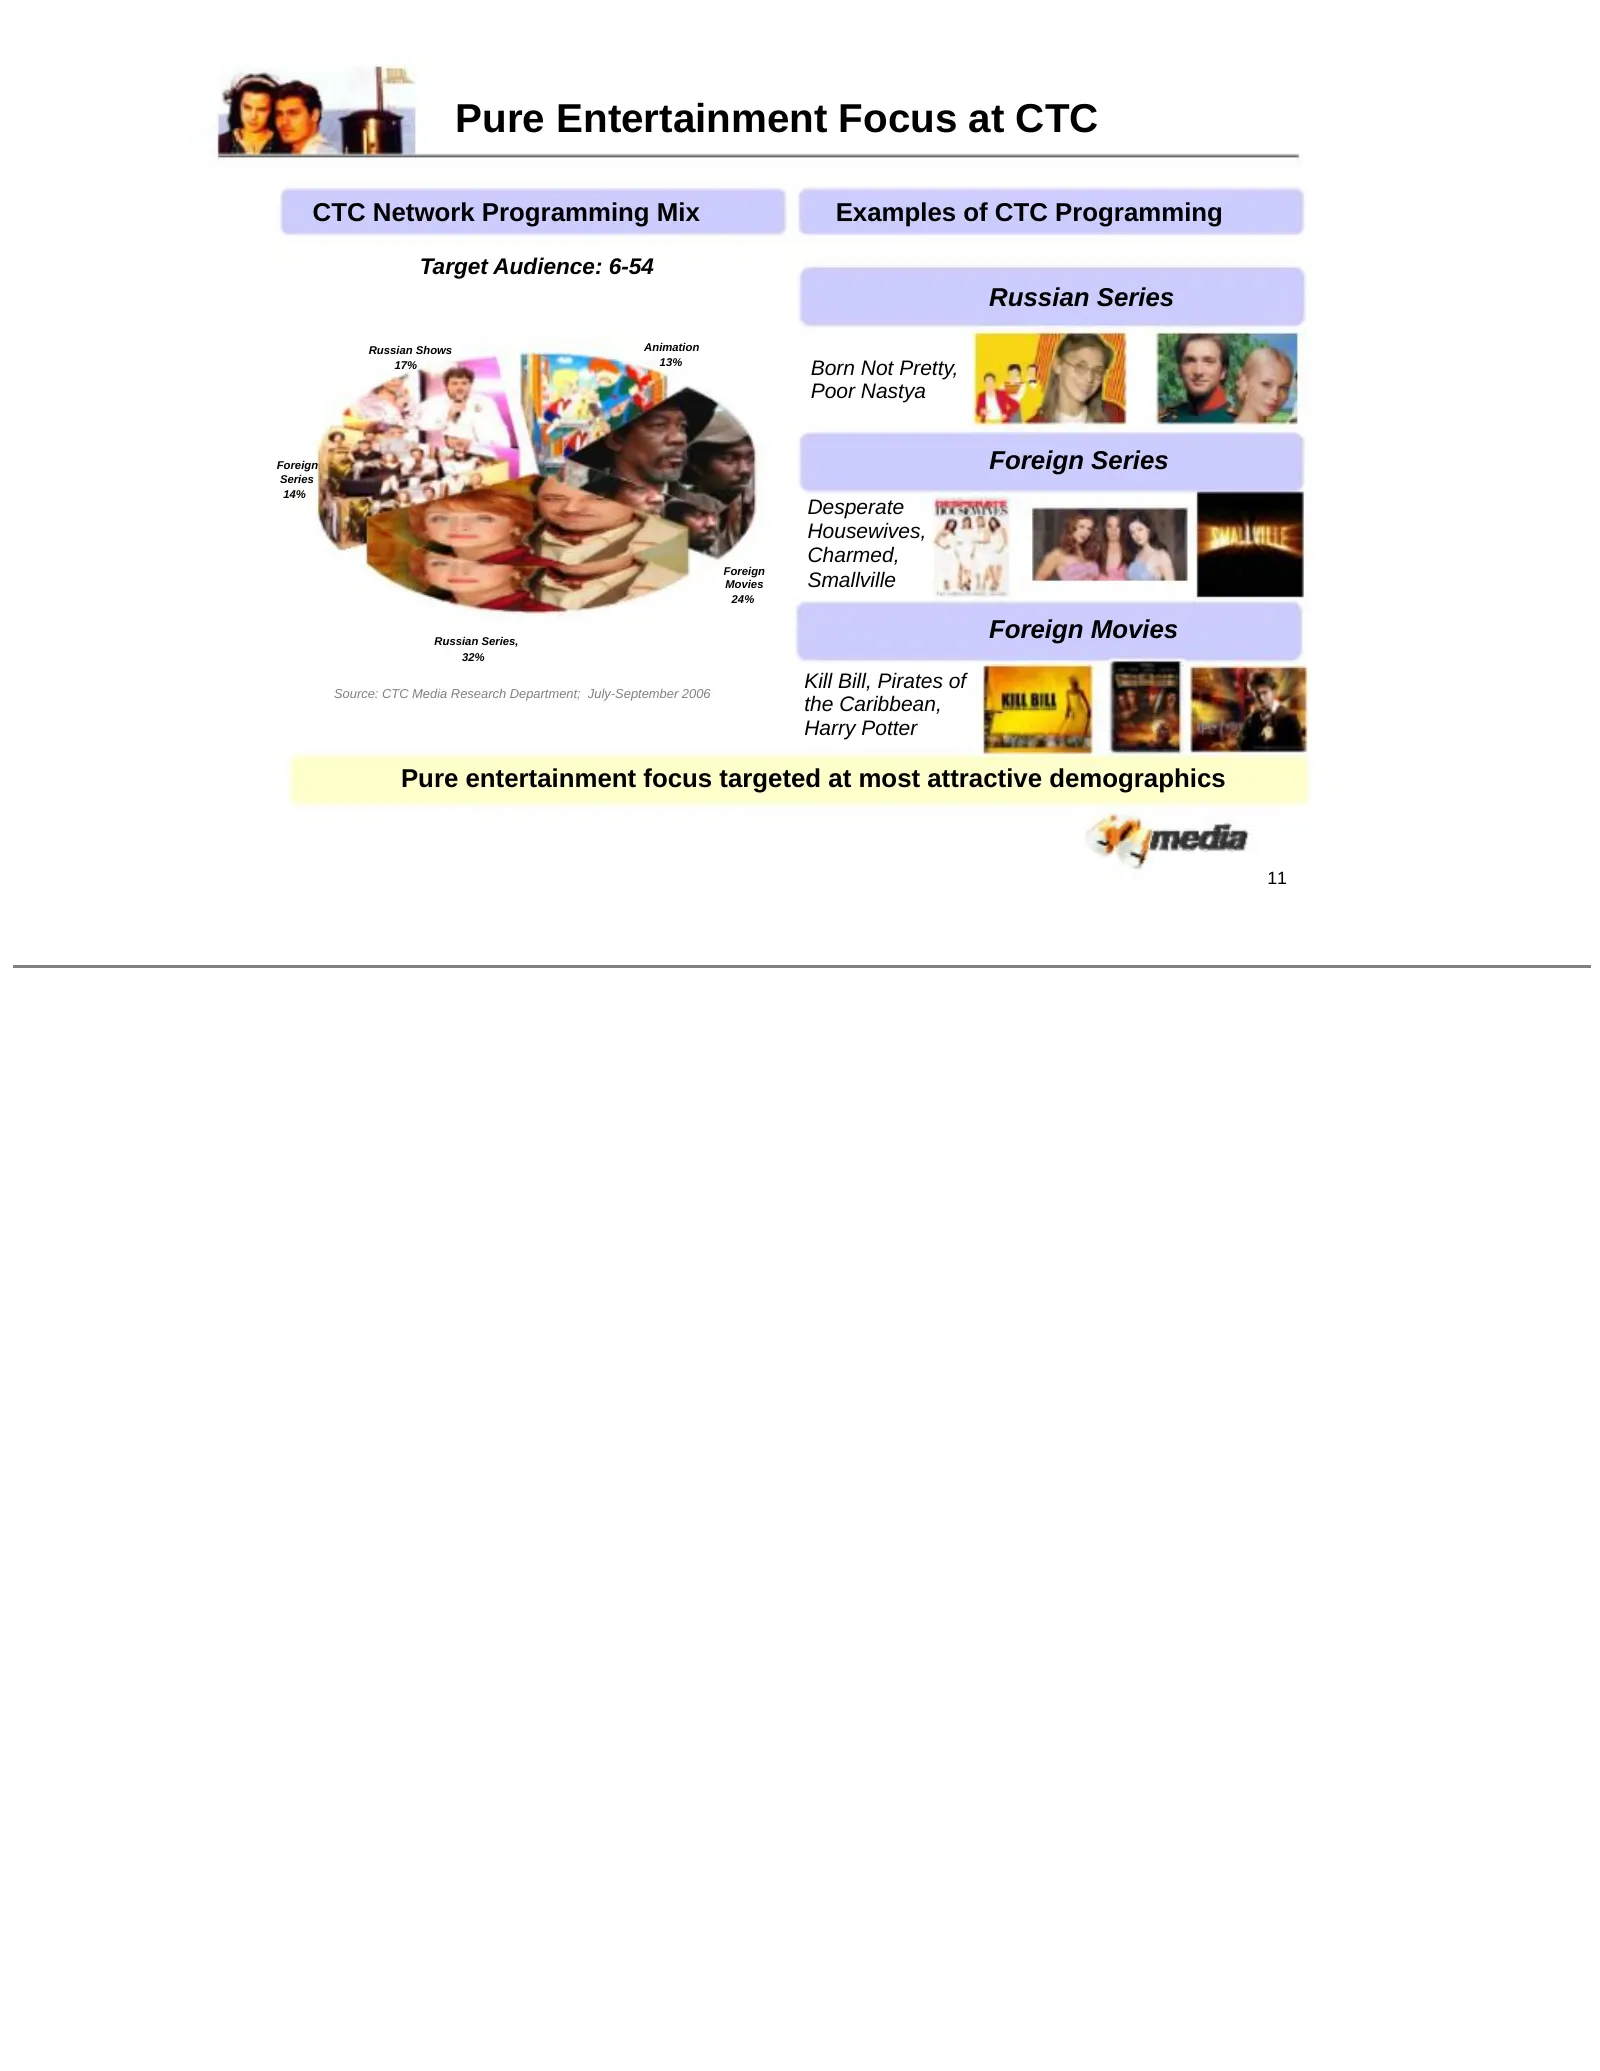
Pure Entertainment Focus at CTC CTC Network Programming Mix Examples of CTC Programming Target Audience: 6-54 Russian Series Russian Shows Animation 13% 17% Born Not Pretty, Poor Nastya Foreign Foreign Series Series 14% Desperate Housewives, Charmed, Foreign Movies Smallville 24% Russian Series, For
Slide 14: Targeting Female Audiences at Domashny
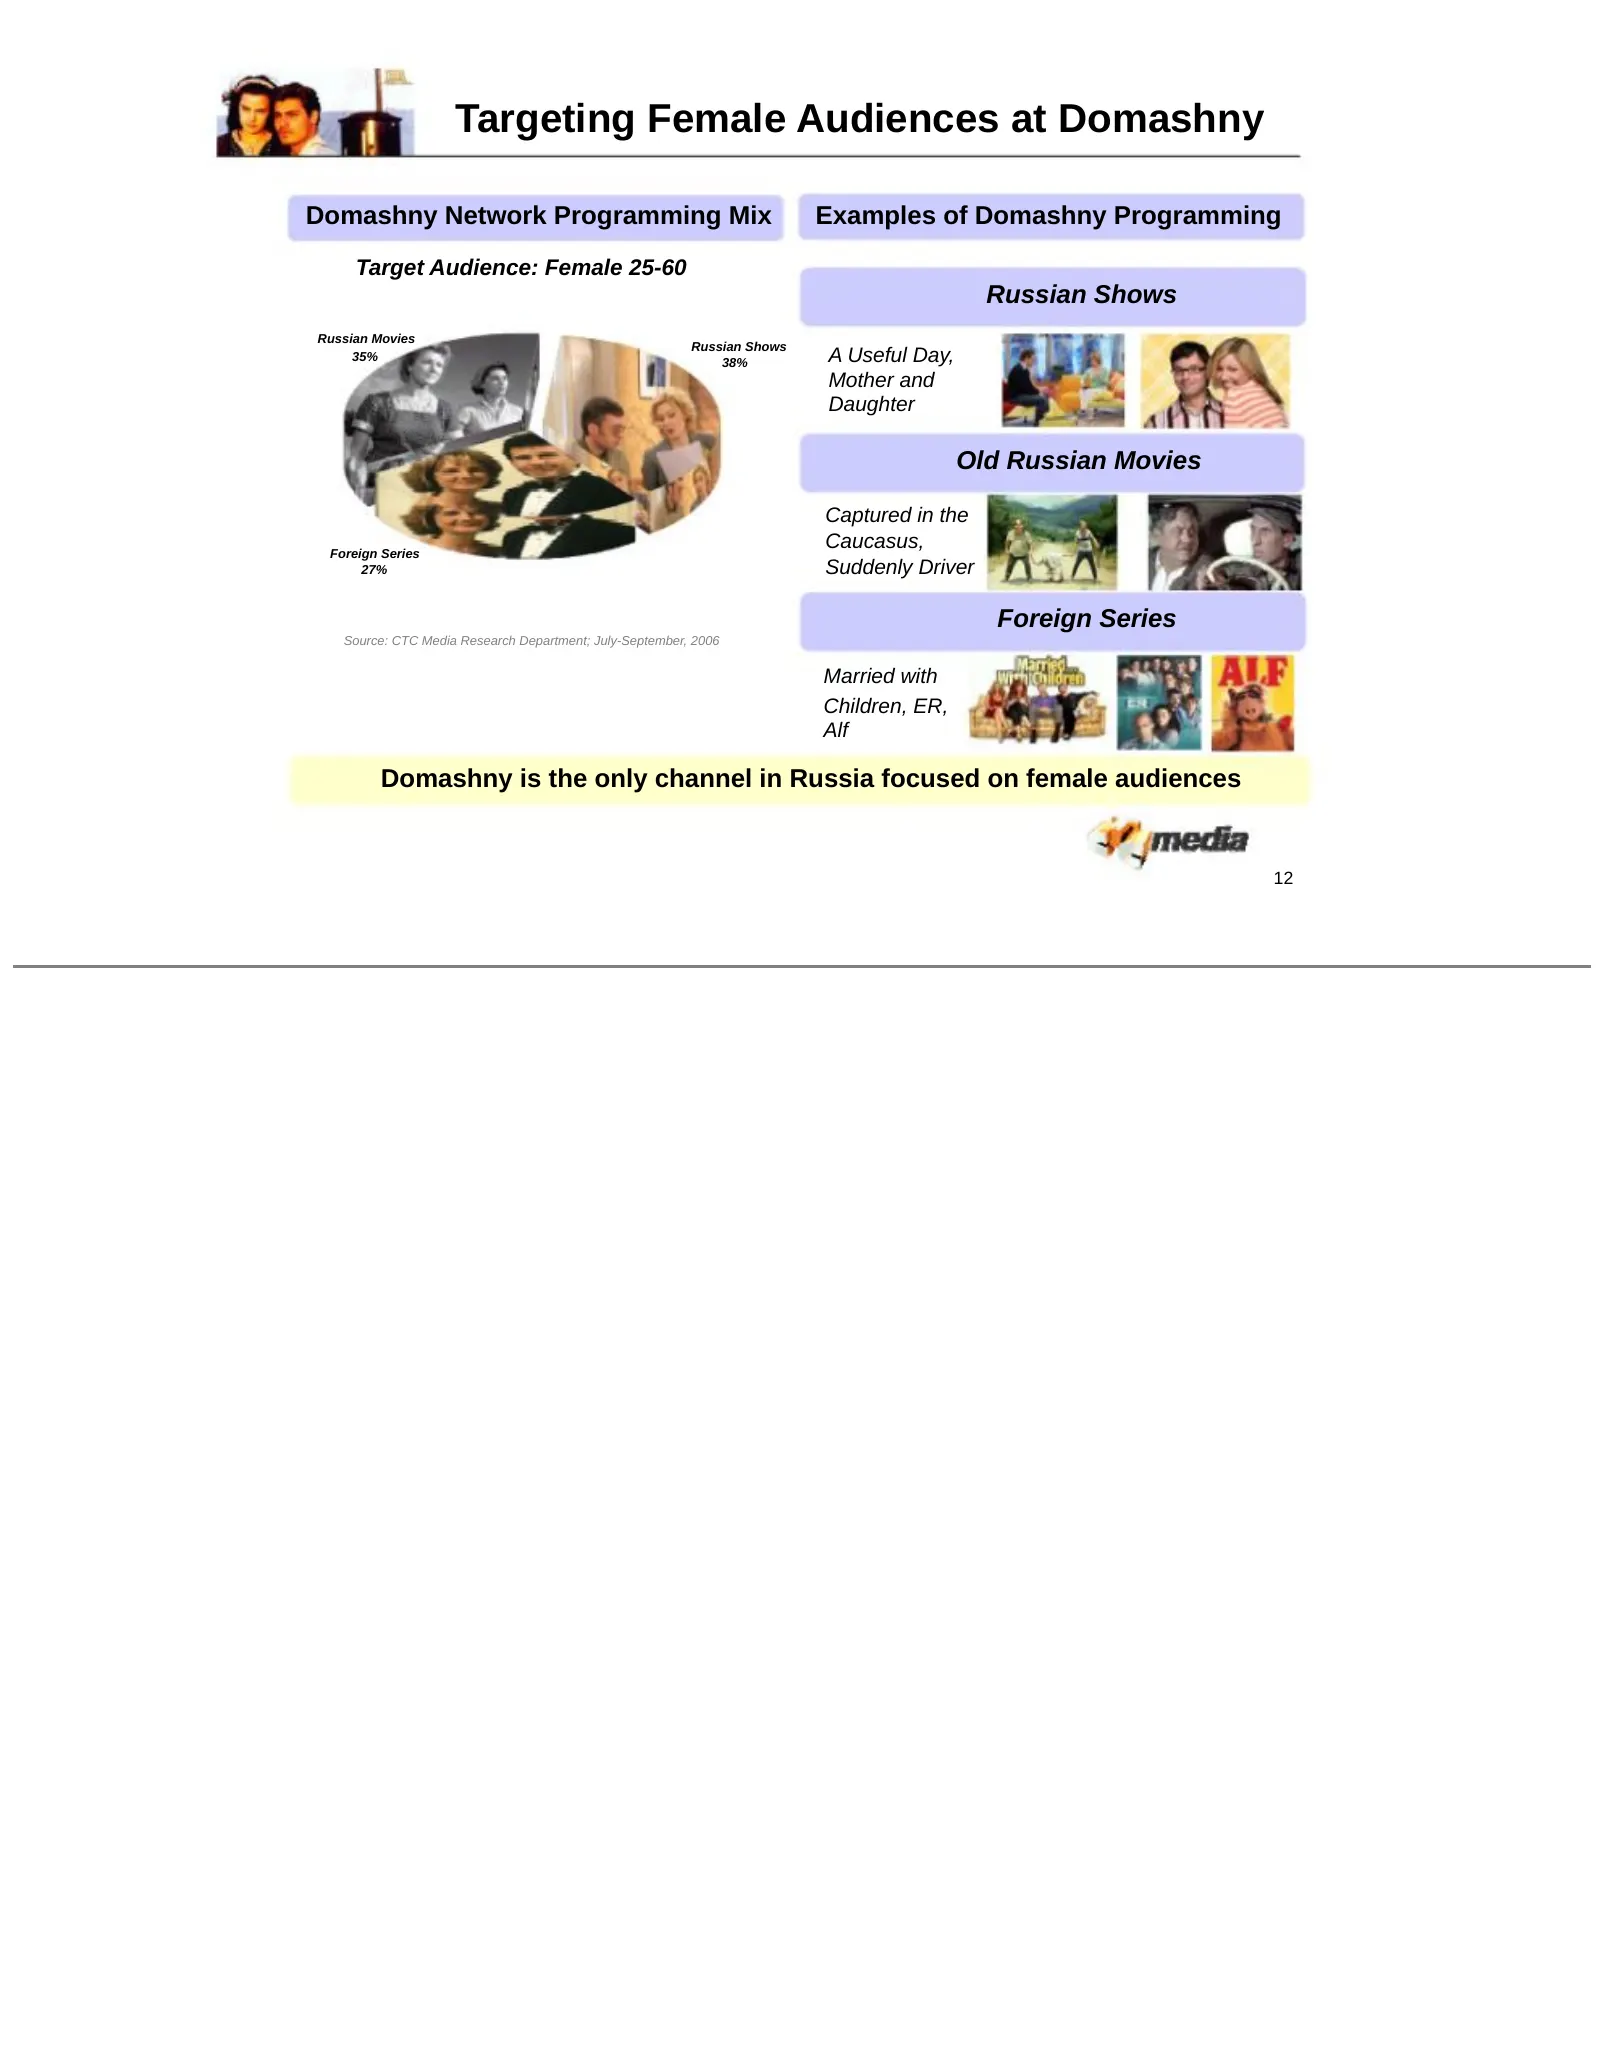
Targeting Female Audiences at Domashny Domashny Network Programming Mix Examples of Domashny Programming Target Audience: Female 25-60 Russian Shows Russian Movies Russian Shows 35% 38% A Useful Day, Mother and Daughter Old Russian Movies Captured in the Foreign Series Caucasus, 27% Suddenly Driver
Slide 15: Advertising Sales Market Structure
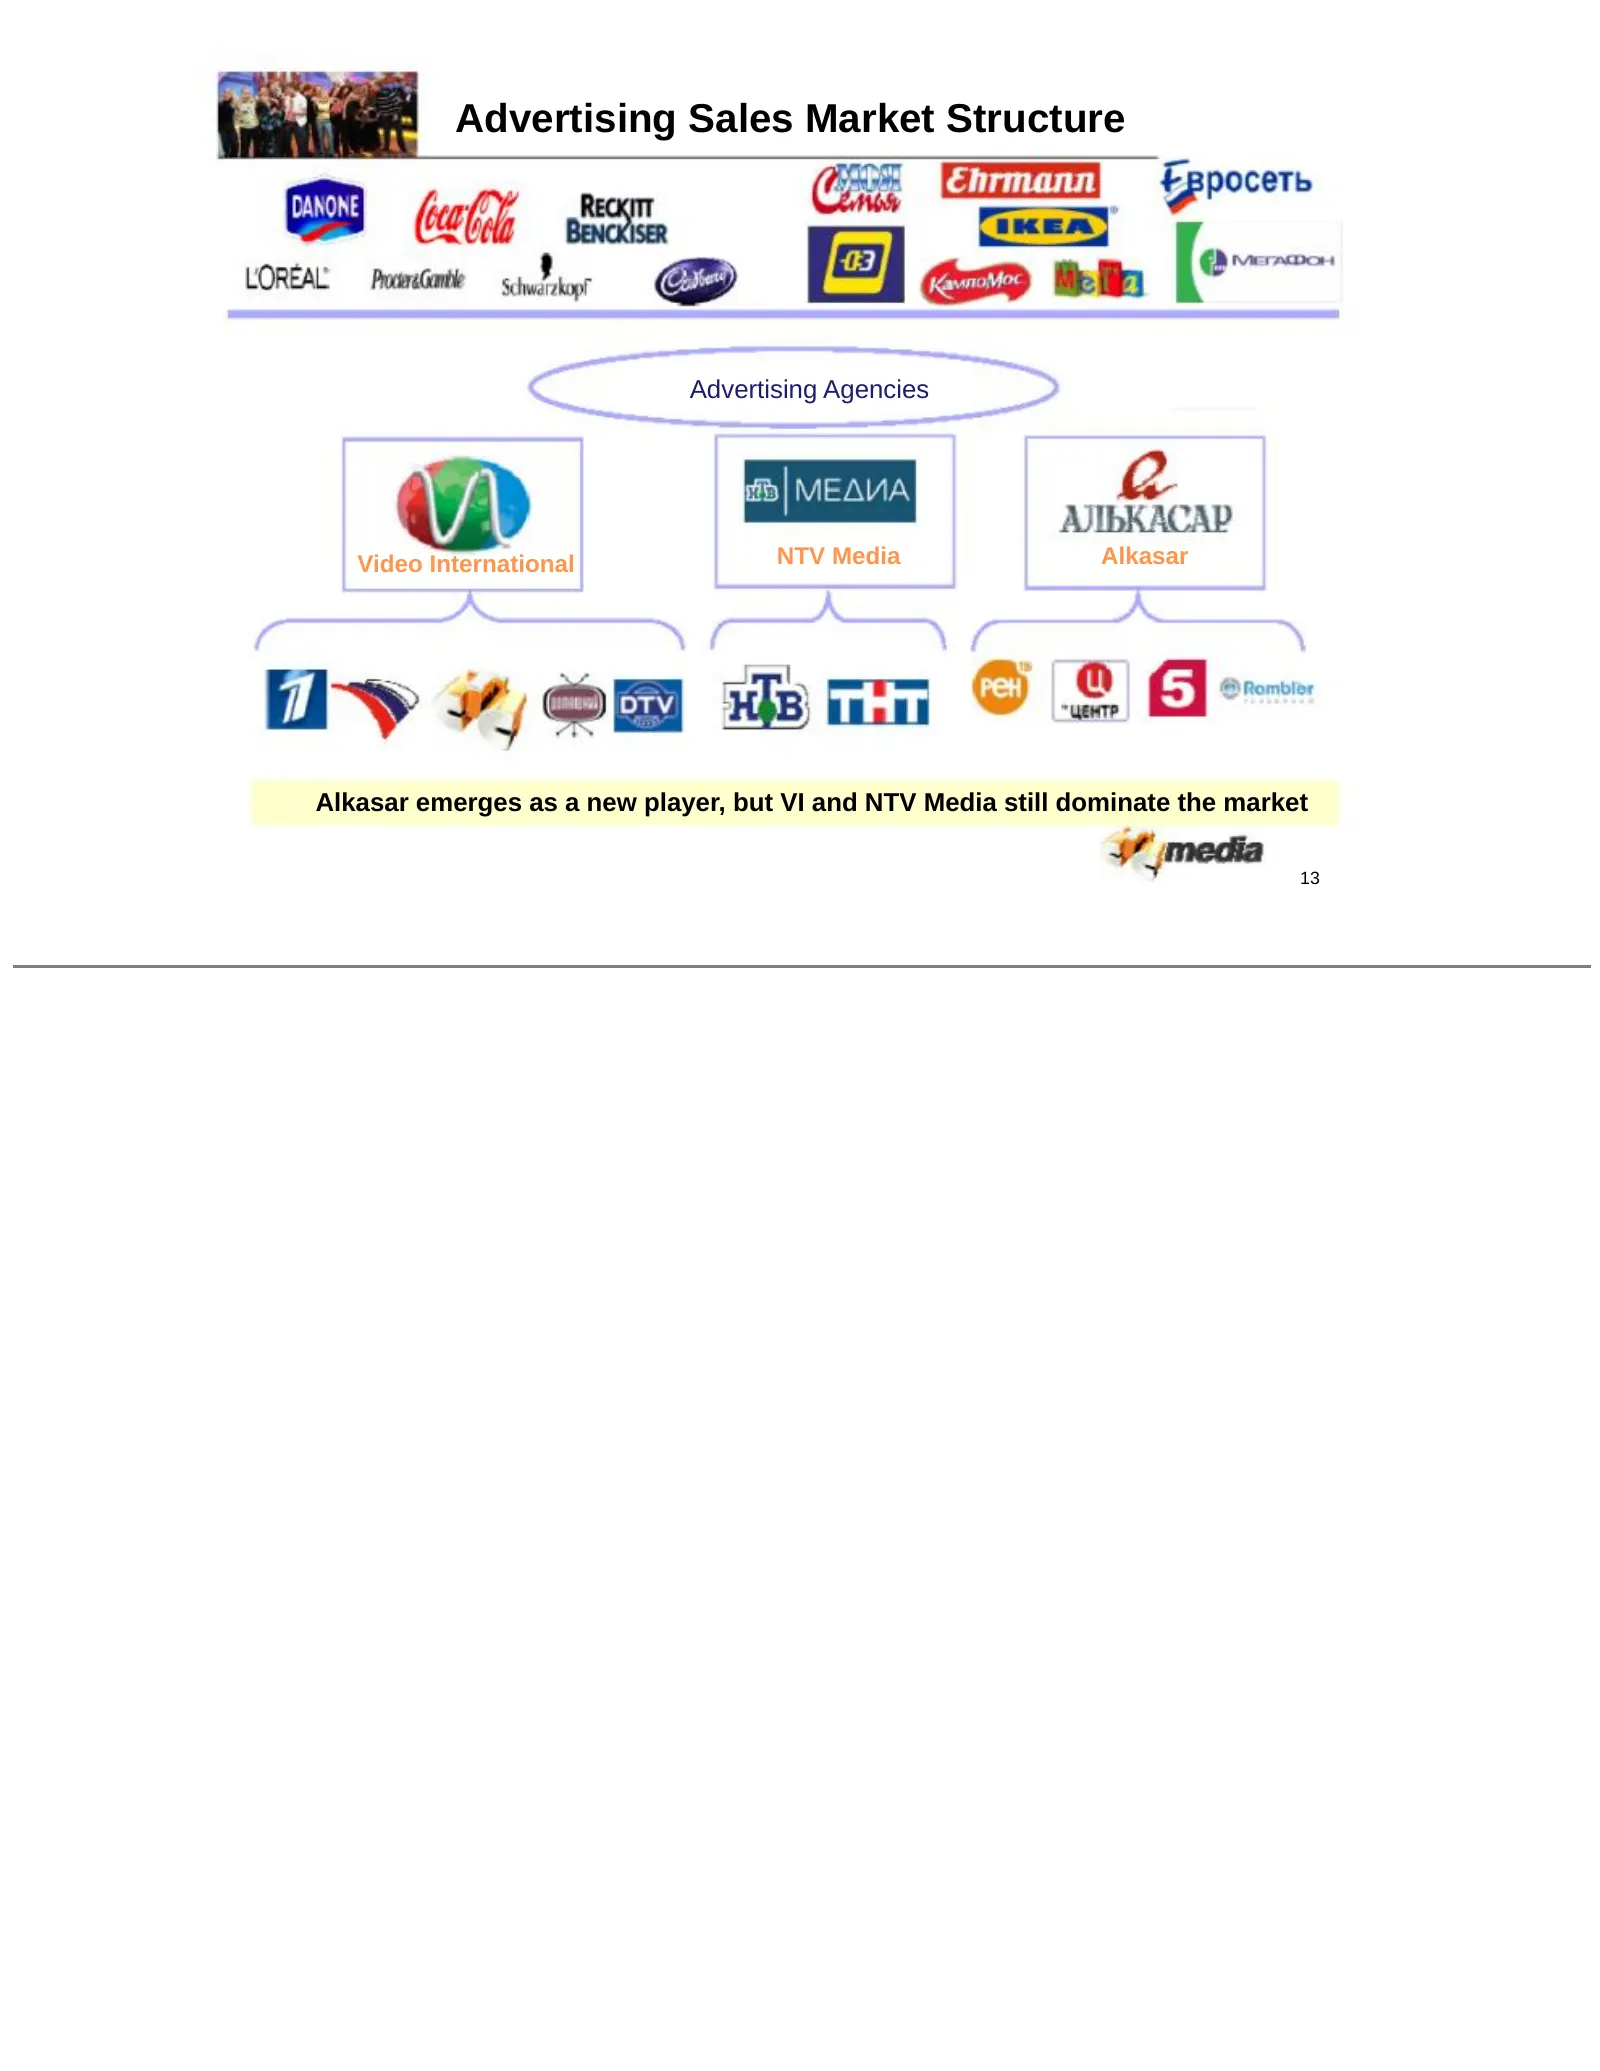
Advertising Sales Market Structure Advertising Agencies Video International NTV Media Alkasar Alkasar emerges as a new player, but VI and NTV Media still dominate the market 13
Slide 16: Track Record of Robust Financial Performance
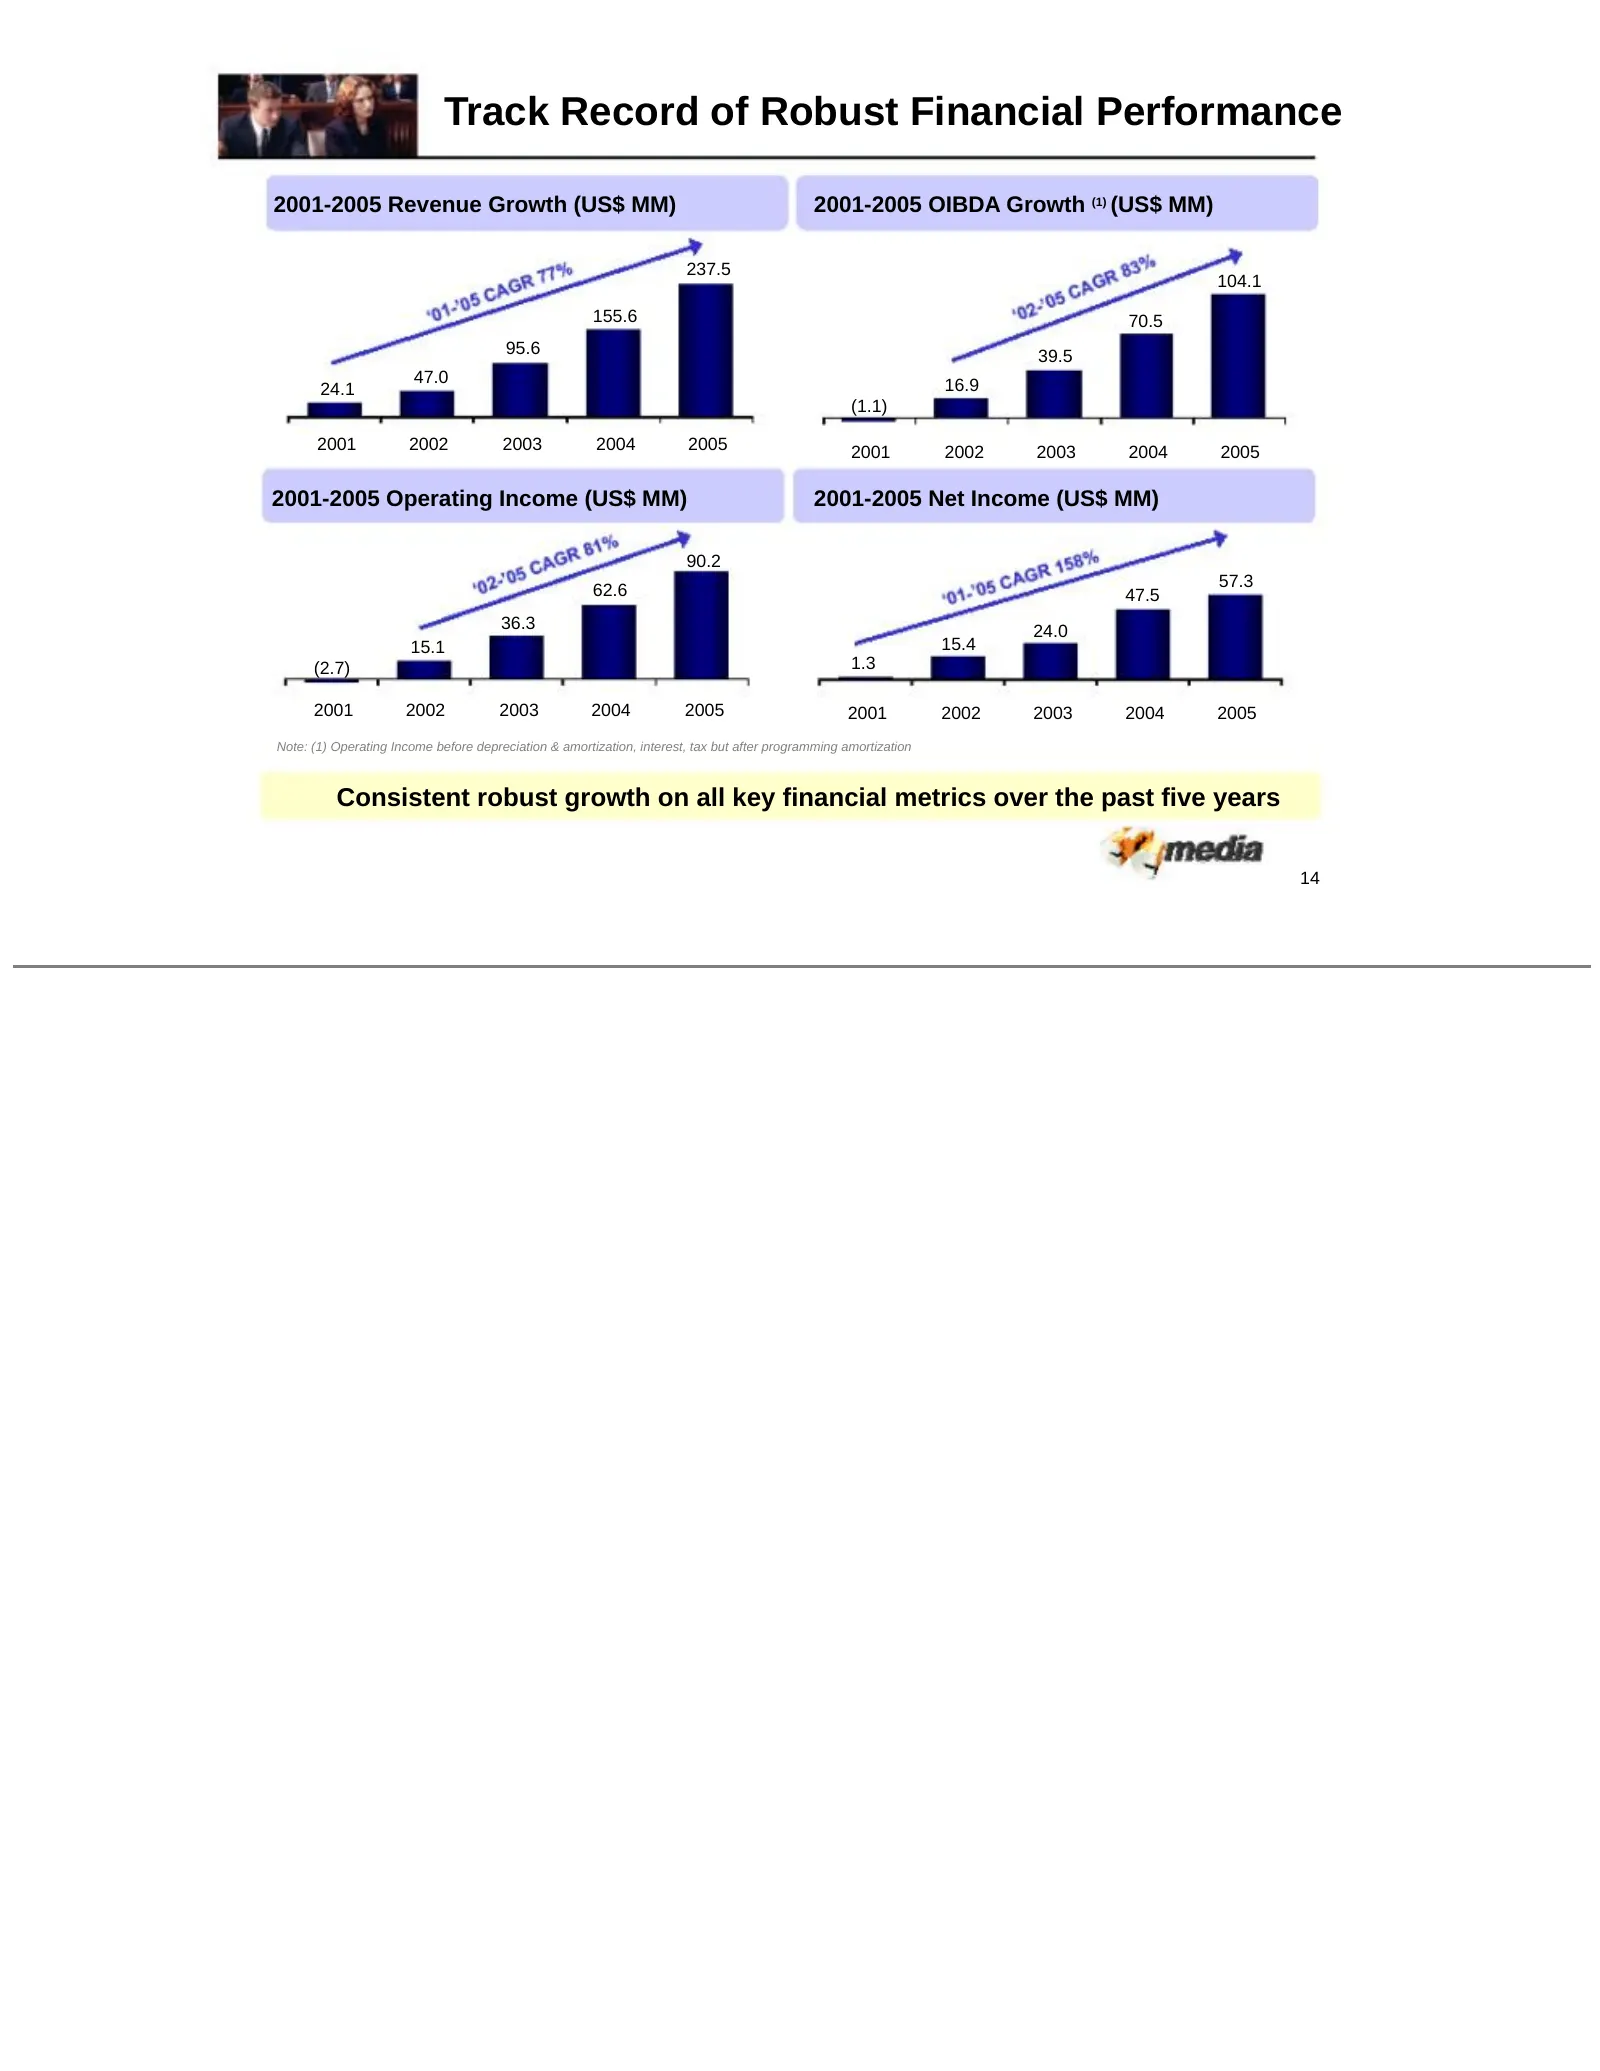
Track Record of Robust Financial Performance 2001-2005 Revenue Growth (US$ MM) 2001-2005 OIBDA Growth (1) (US$ MM) 237.5 104.1 155.6 70.5 95.6 39.5 47.0 16.9 24.1 (1.1) 2001 2002 2003 2004 2005 2001 2002 2003 2004 2005 2001-2005 Operating Income (US$ MM) 2001-2005 Net Income (US$ MM) 90.2 57.3 62.6
Slide 17: Cost Evolution
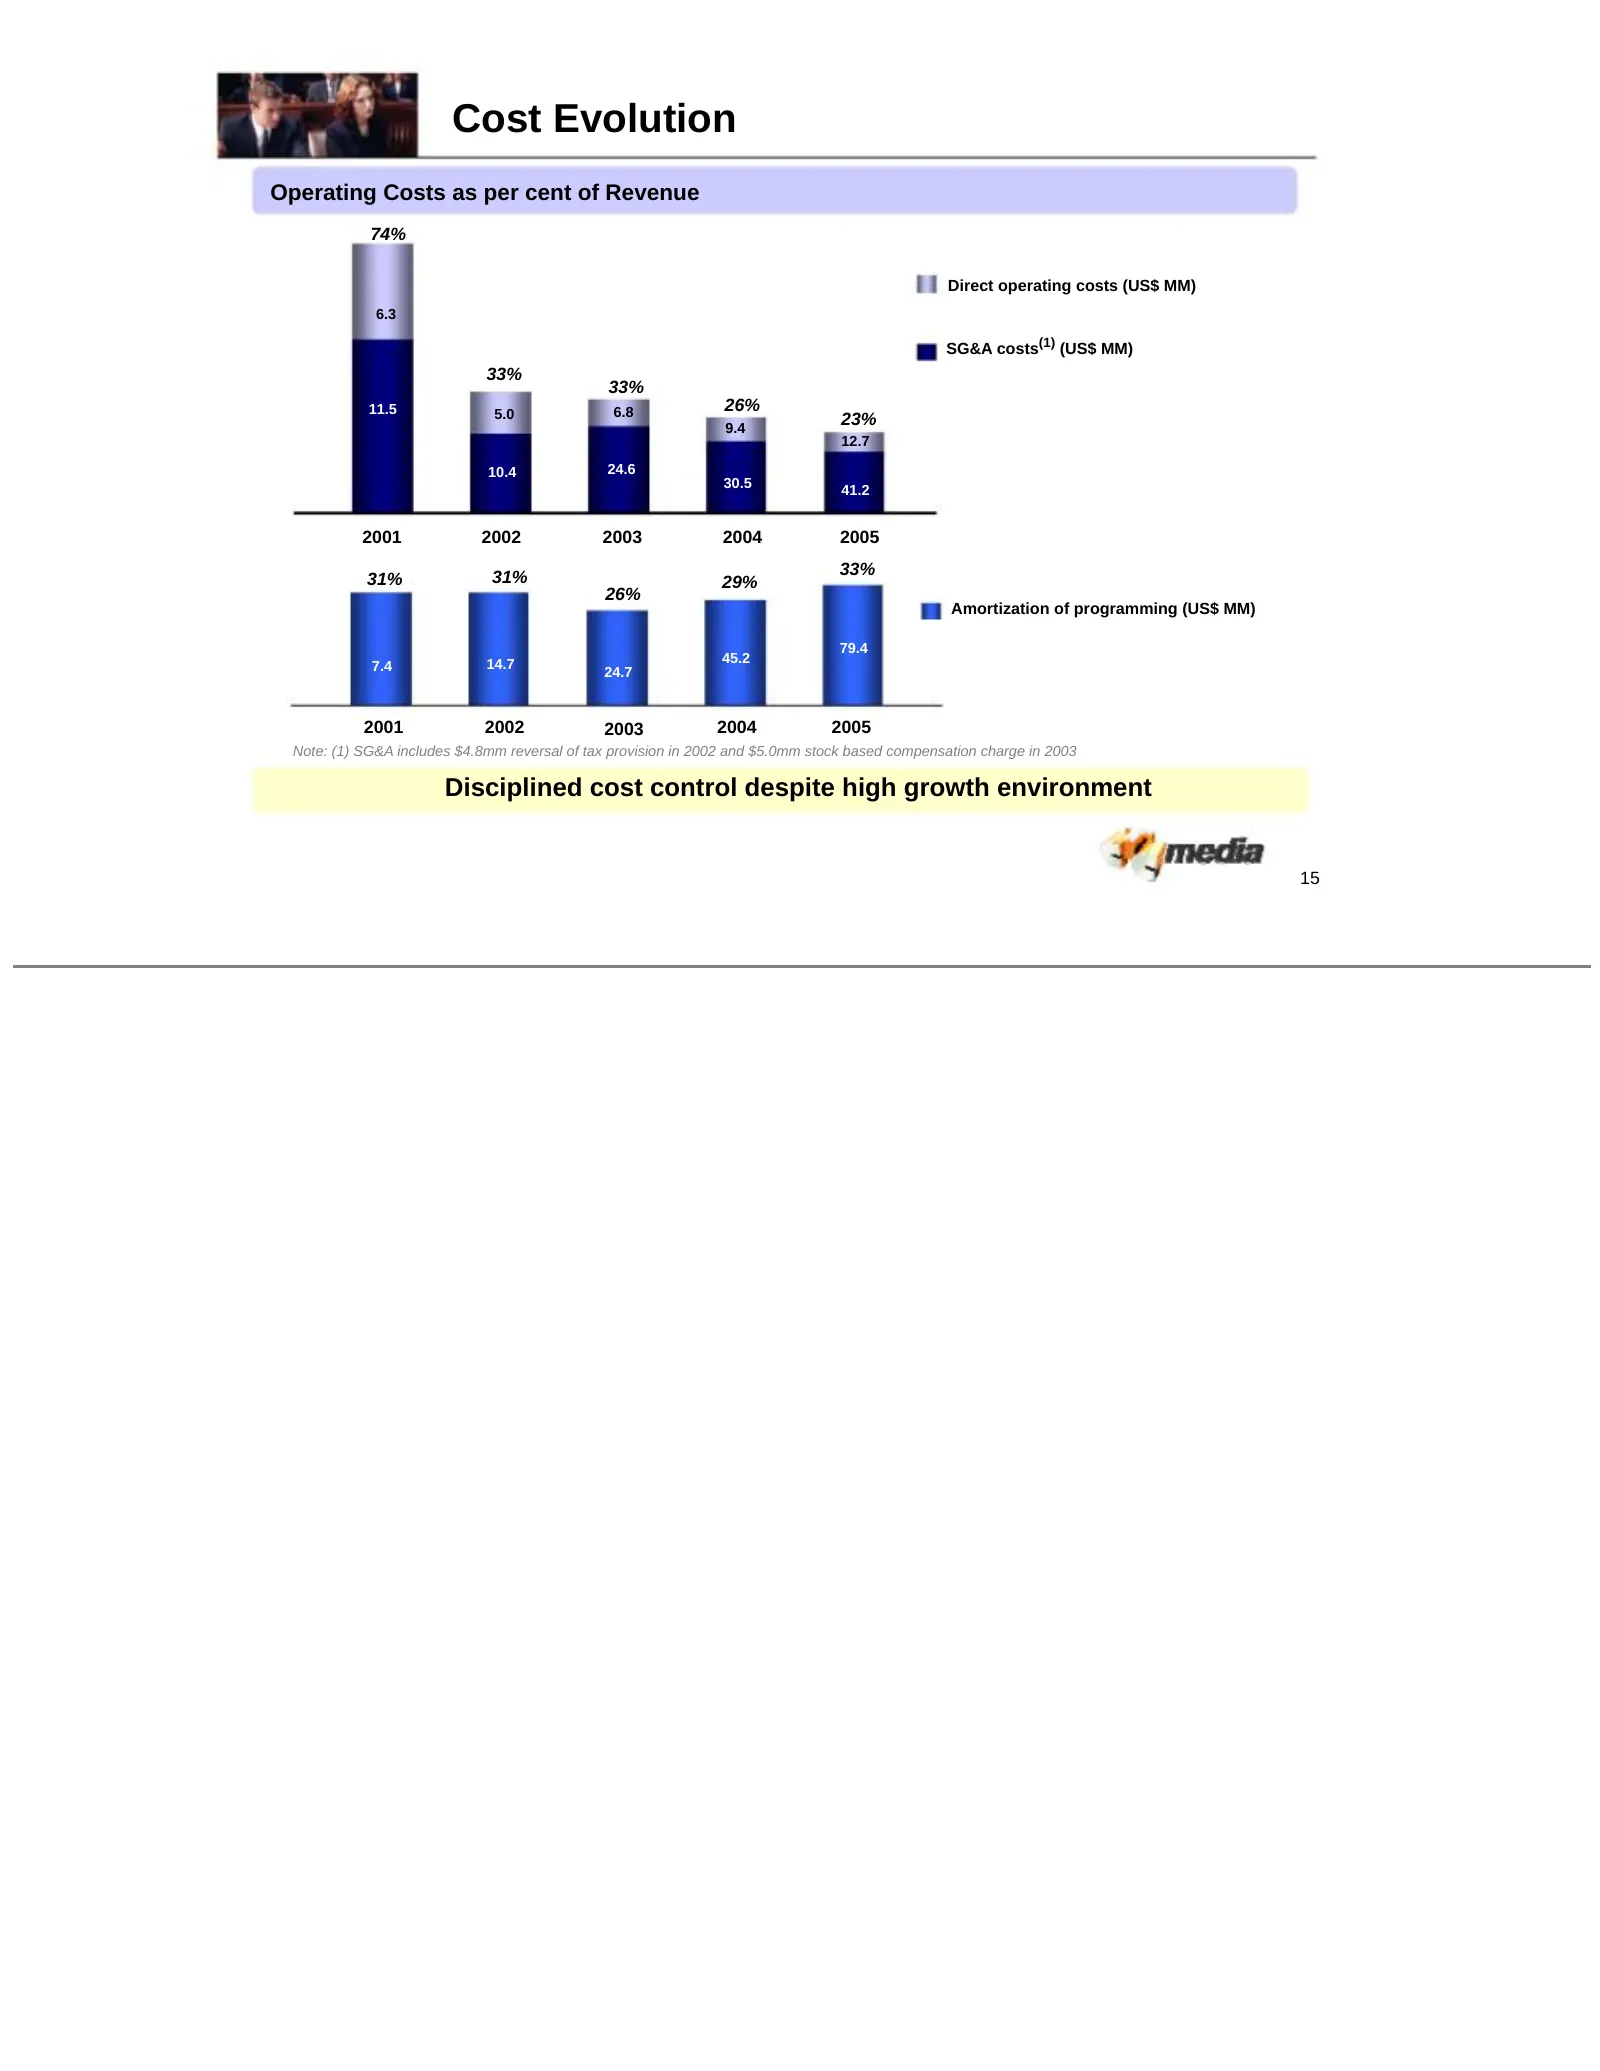
Cost Evolution Operating Costs as per cent of Revenue 74% Direct operating costs (US$ MM) 6.3 SG&A costs(1) (US$ MM) 33% 33% 11.5 5.0 6.8 26% 9.4 23% 12.7 10.4 24.6 30.5 41.2 2001 2002 2003 2004 2005 31% 33% 31% 29% 26% Amortization of programming (US$ MM) 79.4 14.7 45.2 7.4 24.7 2001 2002 2003 2004
Slide 18: Strong OIBDA Growth Track Record
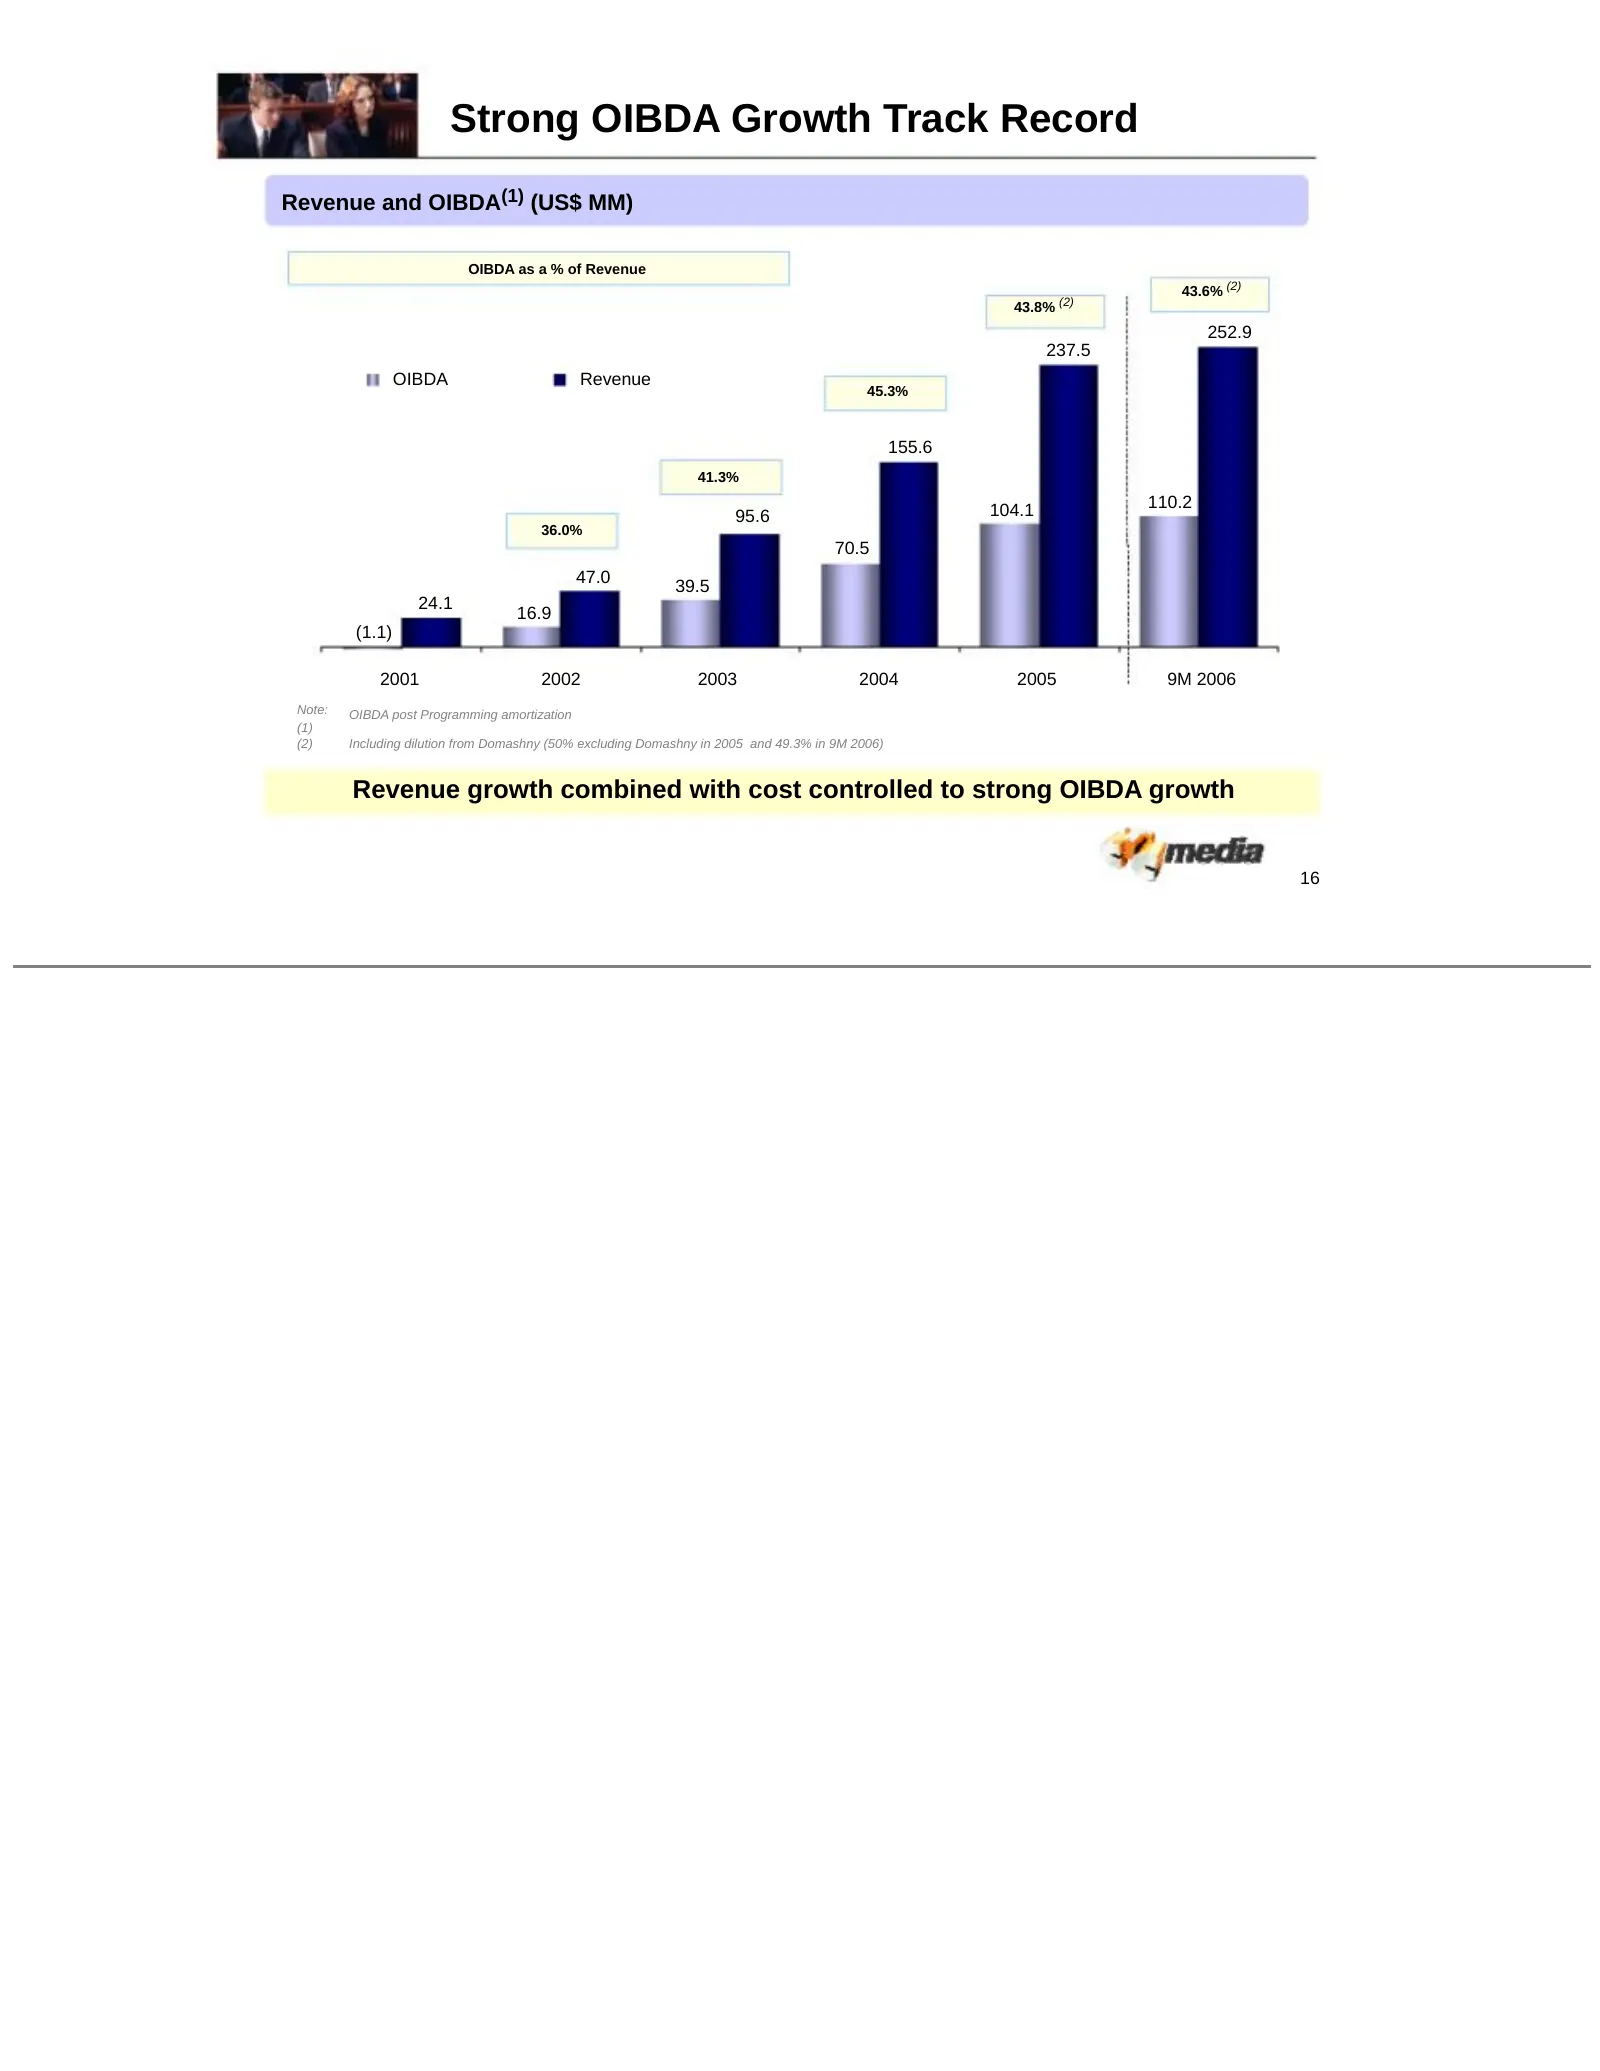
Strong OIBDA Growth Track Record Revenue and OIBDA(1) (US$ MM) OIBDA as a % of Revenue 43.6% (2) 43.8% (2) 252.9 237.5 OIBDA Revenue 45.3% 155.6 41.3% 104.1 110.2 95.6 36.0% 70.5 47.0 39.5 24.1 16.9 (1.1) 2001 2002 2003 2004 2005 9M 2006 Note: OIBDA post Programming amortization (1) (2) Including di
Slide 19: Summary Financial Highlights
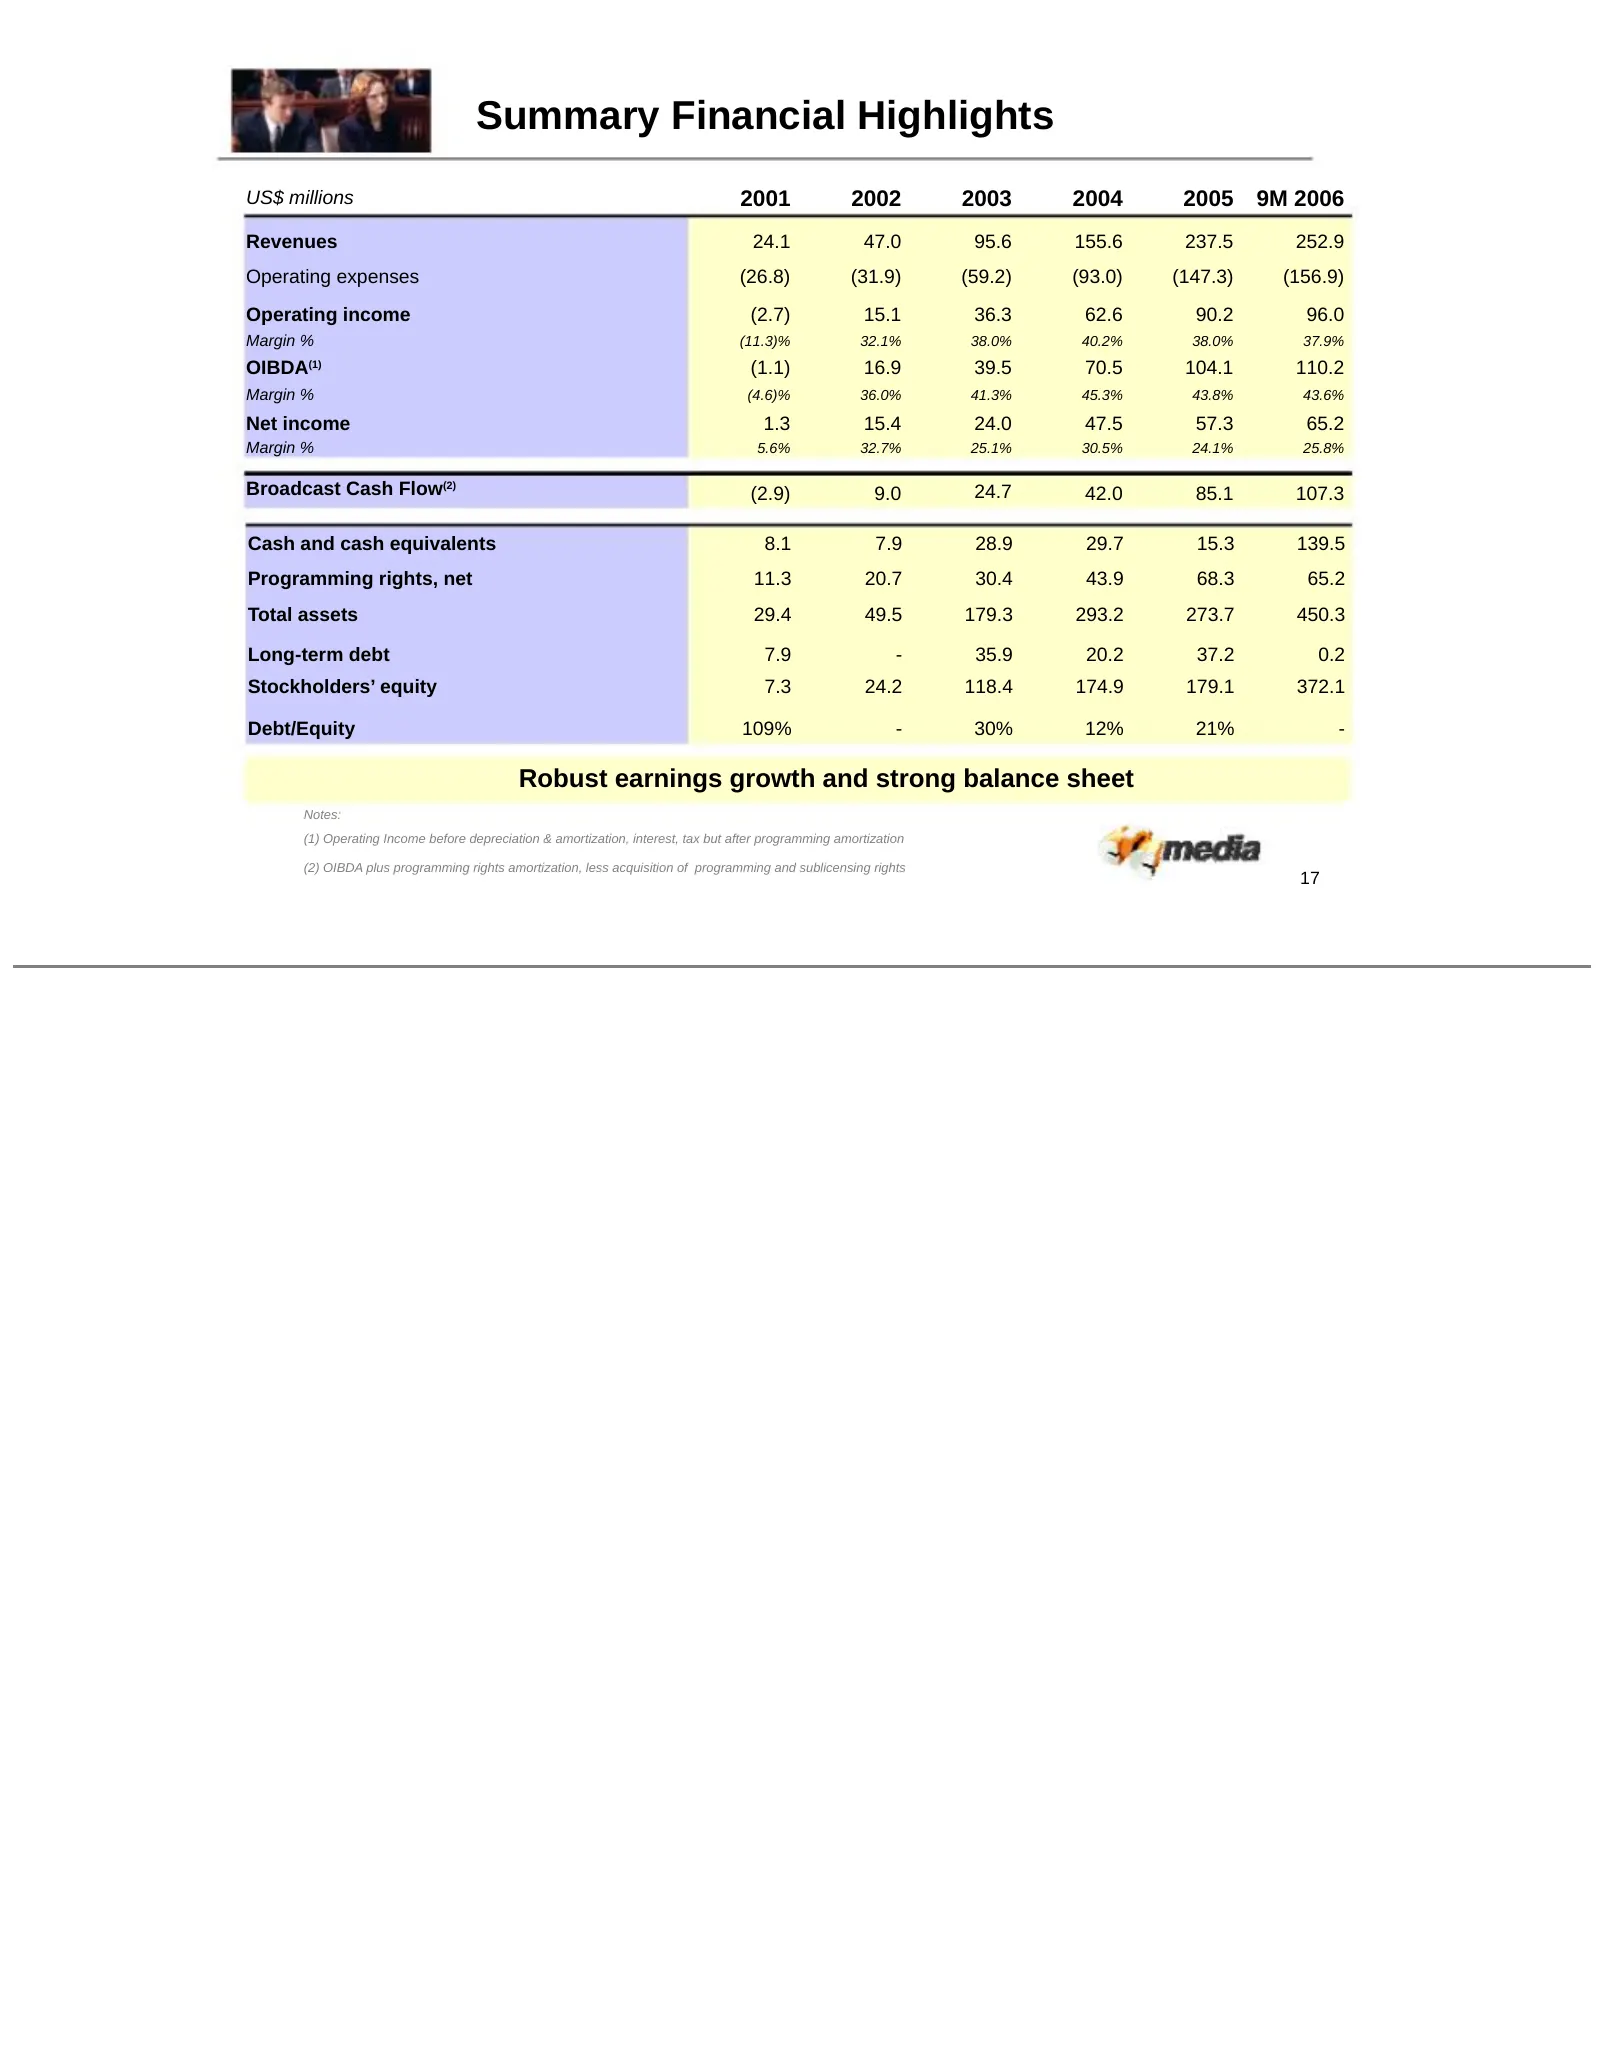
Summary Financial Highlights US$ millions 2001 2002 2003 2004 2005 9M 2006 Revenues 24.1 47.0 95.6 155.6 237.5 252.9 Operating expenses (26.8) (31.9) (59.2) (93.0) (147.3) (156.9) Operating income (2.7) 15.1 36.3 62.6 90.2 96.0 Margin % (11.3)% 32.1% 38.0% 40.2% 38.0% 37.9% OIBDA(1) (1.1) 16.9 39.5
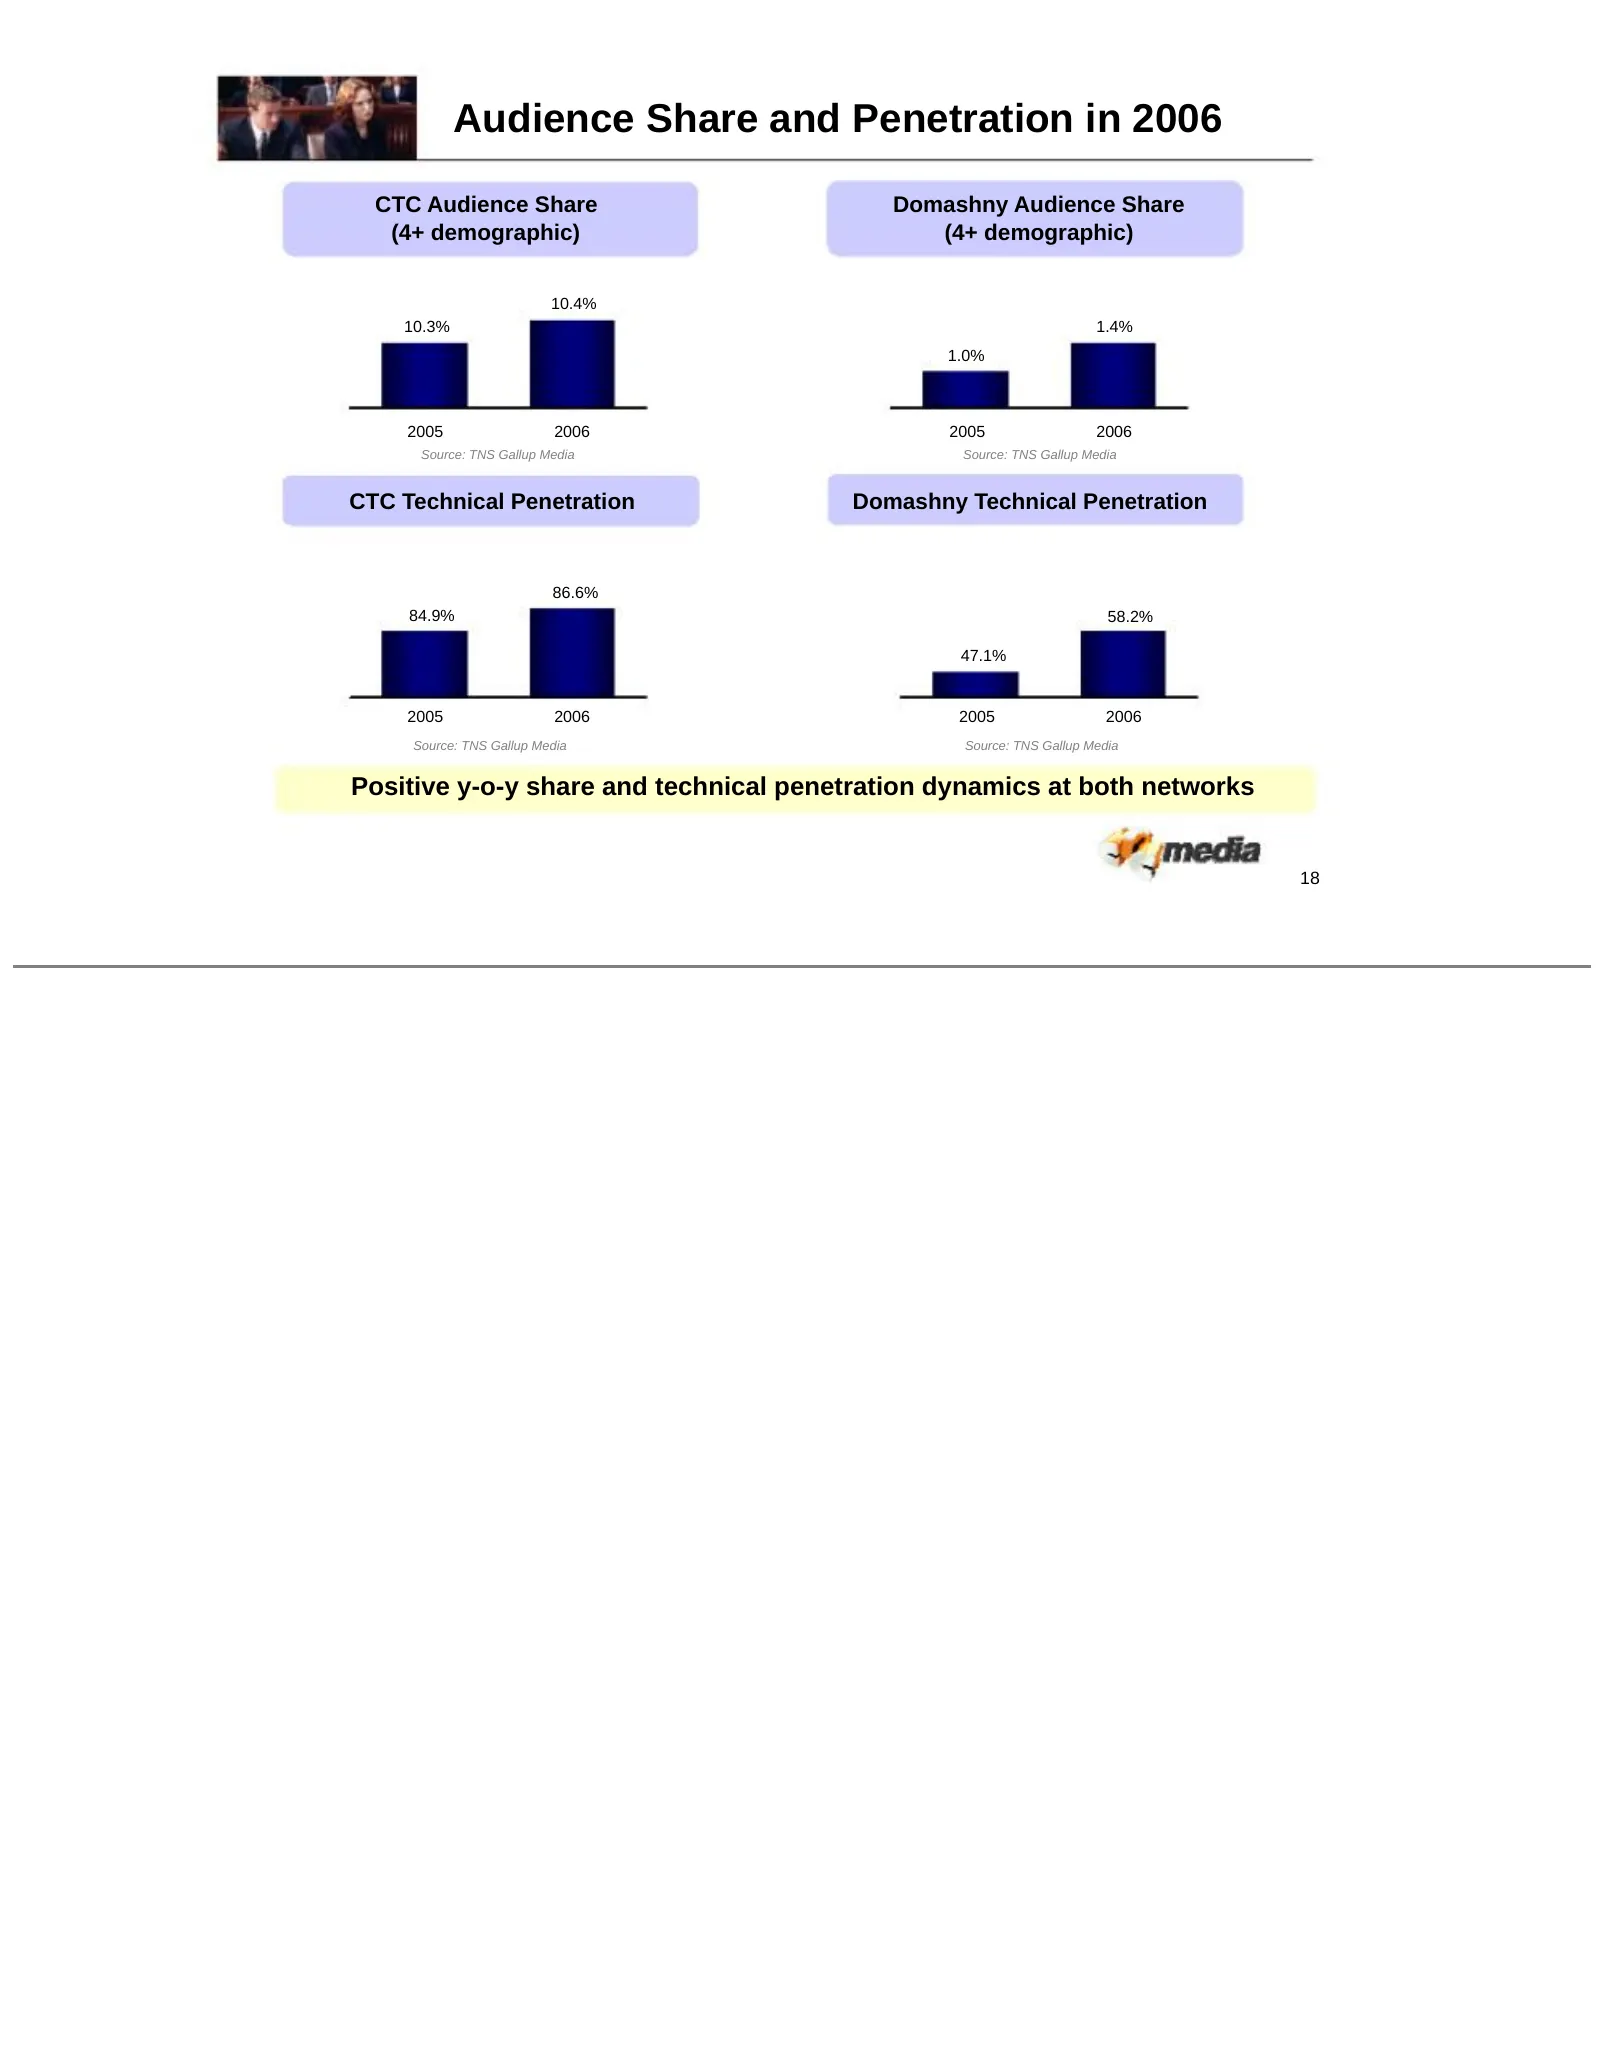
Slide 20: Audience Share and Penetration in 2006
Audience Share and Penetration in 2006 CTC Audience Share Domashny Audience Share (4+ demographic) (4+ demographic) 10.4% 10.3% 1.4% 1.0% 2005 2006 2005 2006 Source: TNS Gallup Media Source: TNS Gallup Media CTC Technical Penetration Domashny Technical Penetration 86.6% 84.9% 58.2% 47.1% 2005 2006 2
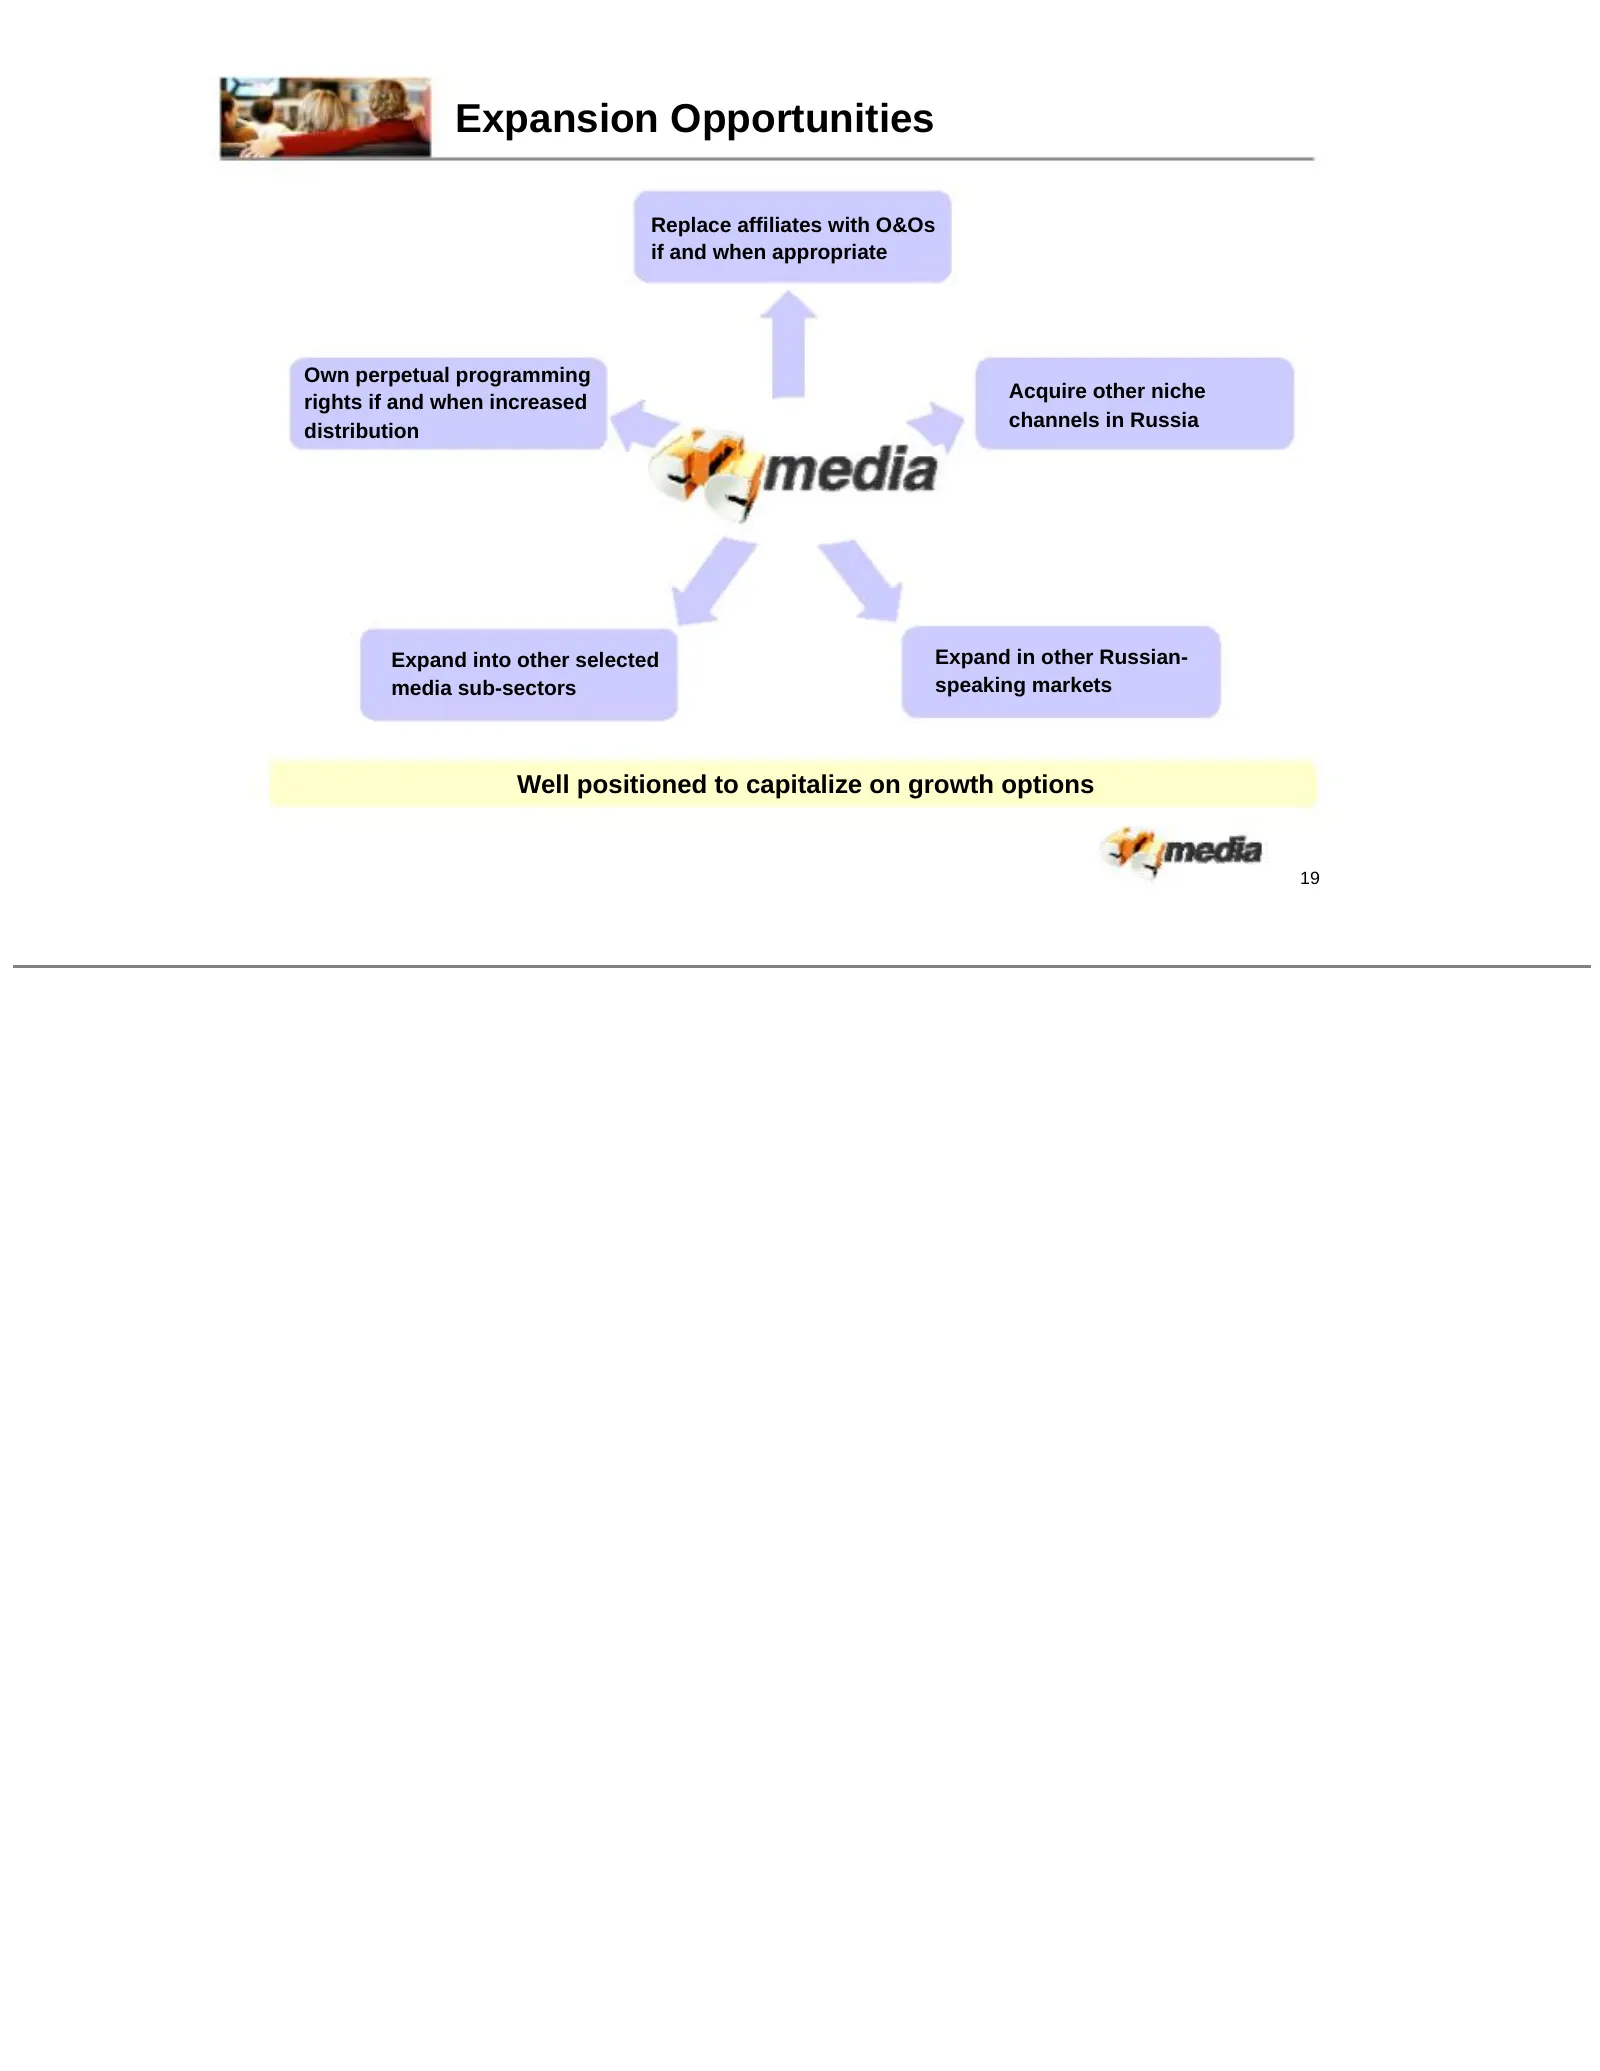
Slide 21: Expansion Opportunities
Expansion Opportunities Replace affiliates with O&Os if and when appropriate Own perpetual programming Acquire other niche rights if and when increased channels in Russia distribution Expand into other selected Expand in other Russian- media sub-sectors speaking markets Well positioned to capitalize
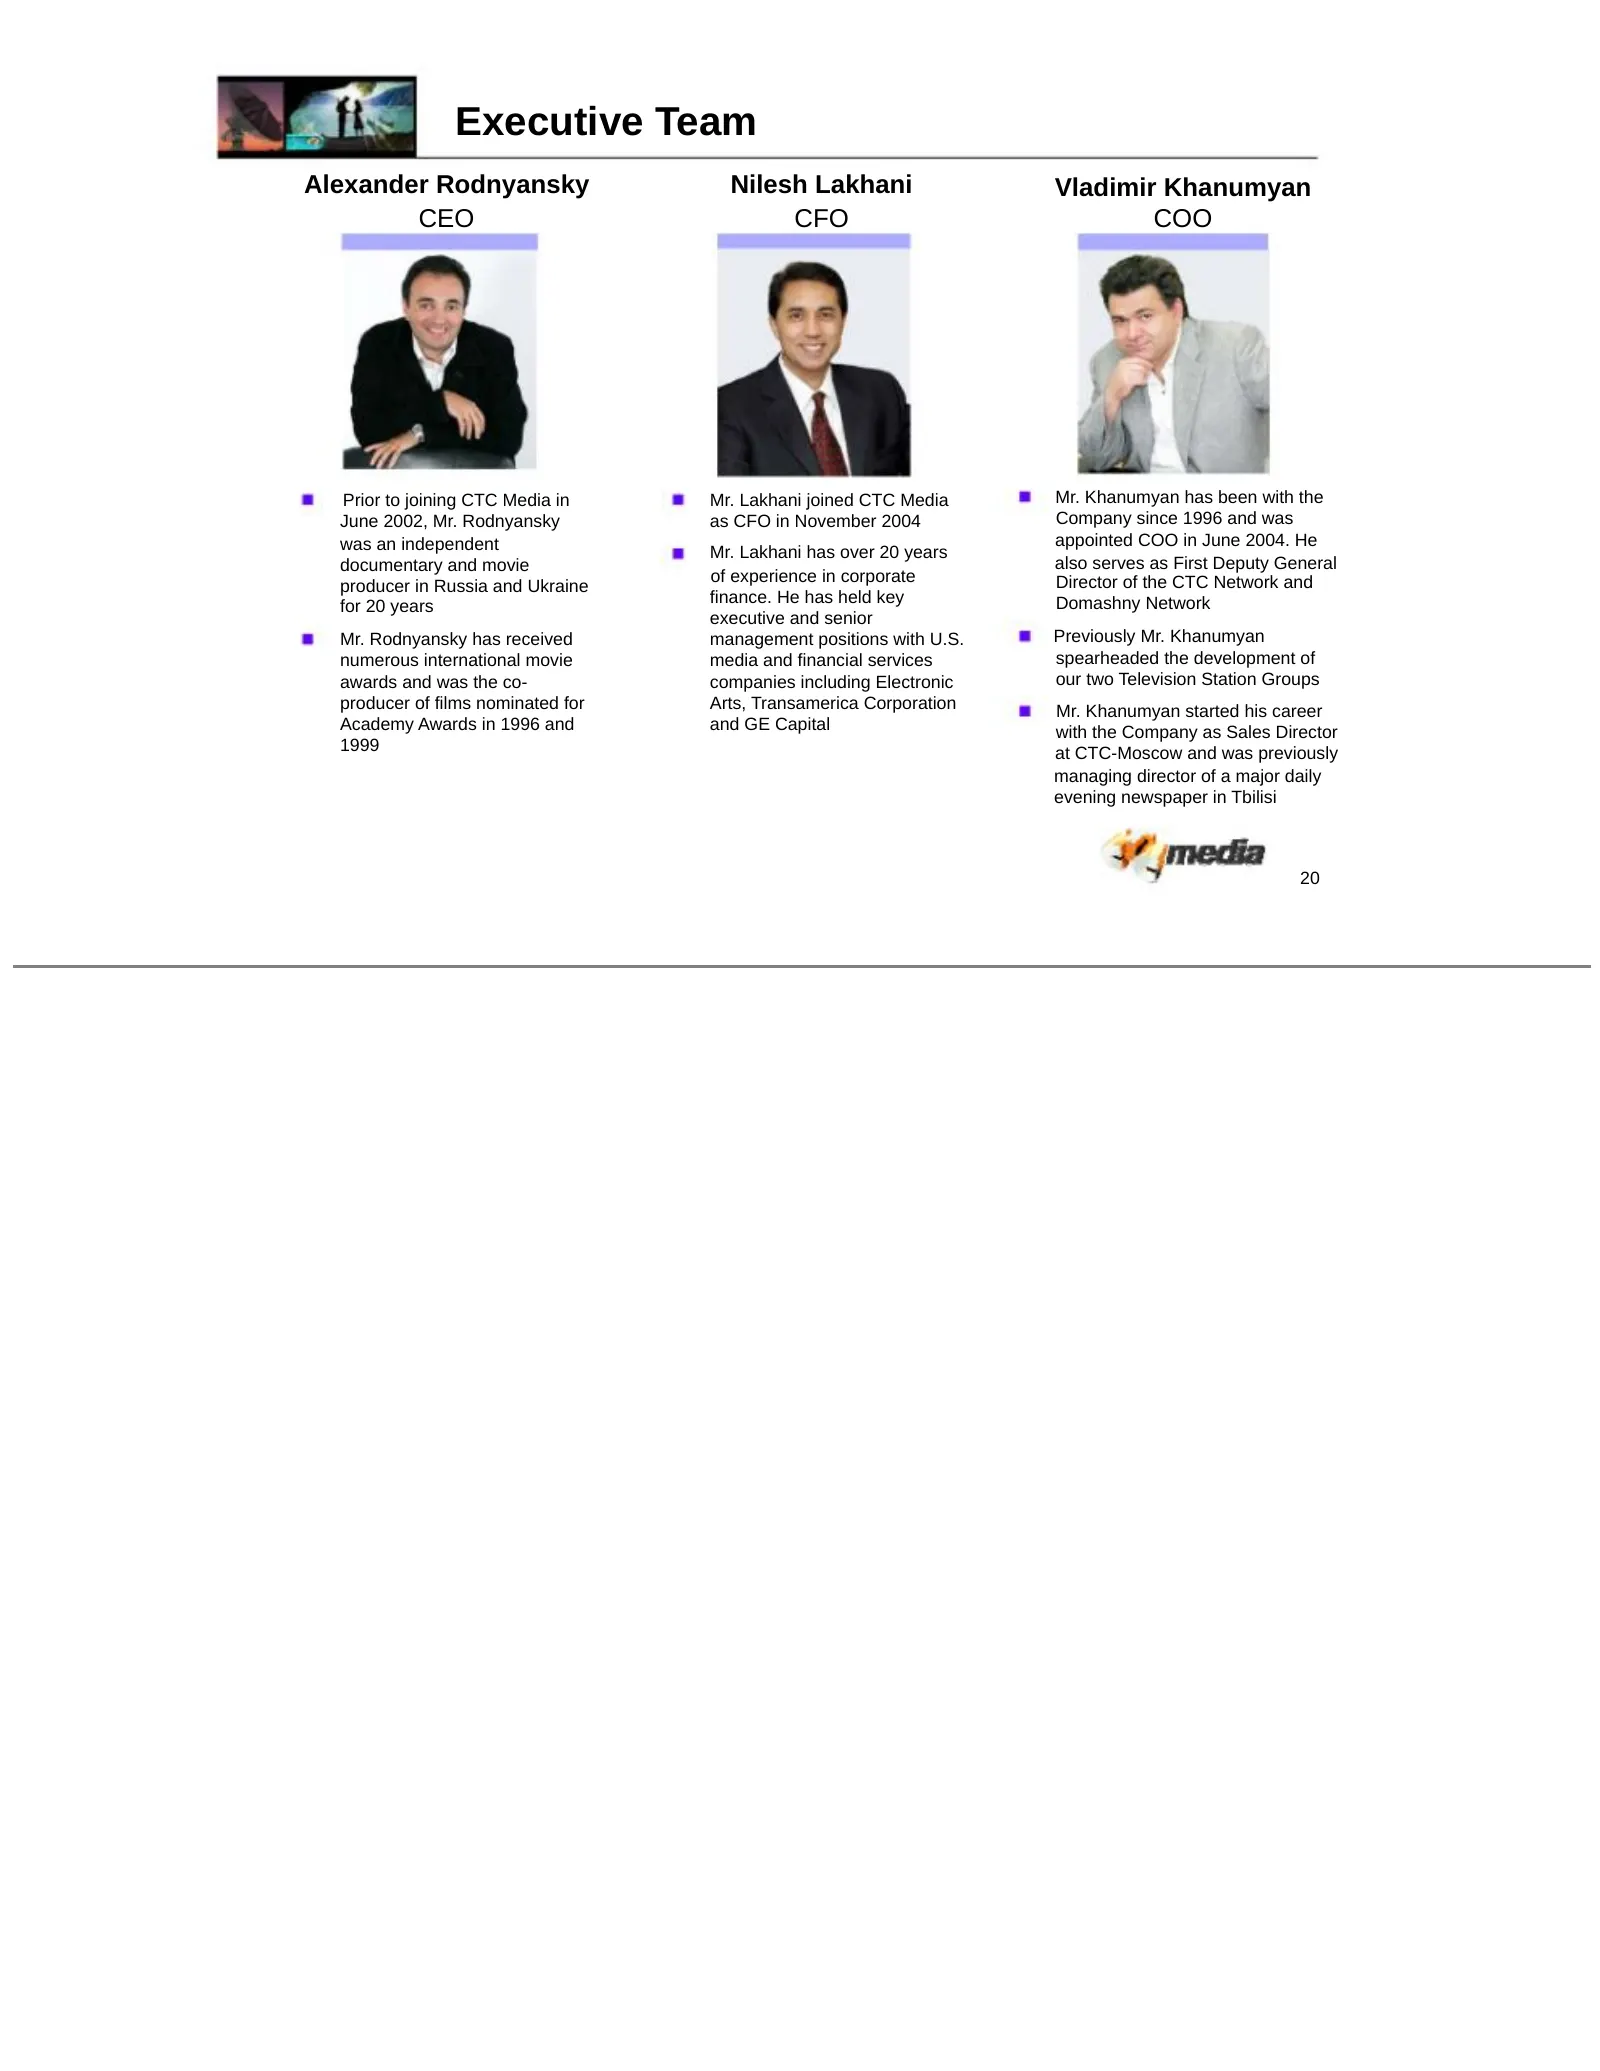
Slide 22: Executive Team
Executive Team Alexander Rodnyansky Nilesh Lakhani Vladimir Khanumyan CEO CFO COO Prior to joining CTC Media in Mr. Lakhani joined CTC Media Mr. Khanumyan has been with the June 2002, Mr. Rodnyansky as CFO in November 2004 Company since 1996 and was was an independent appointed COO in June 2004. He
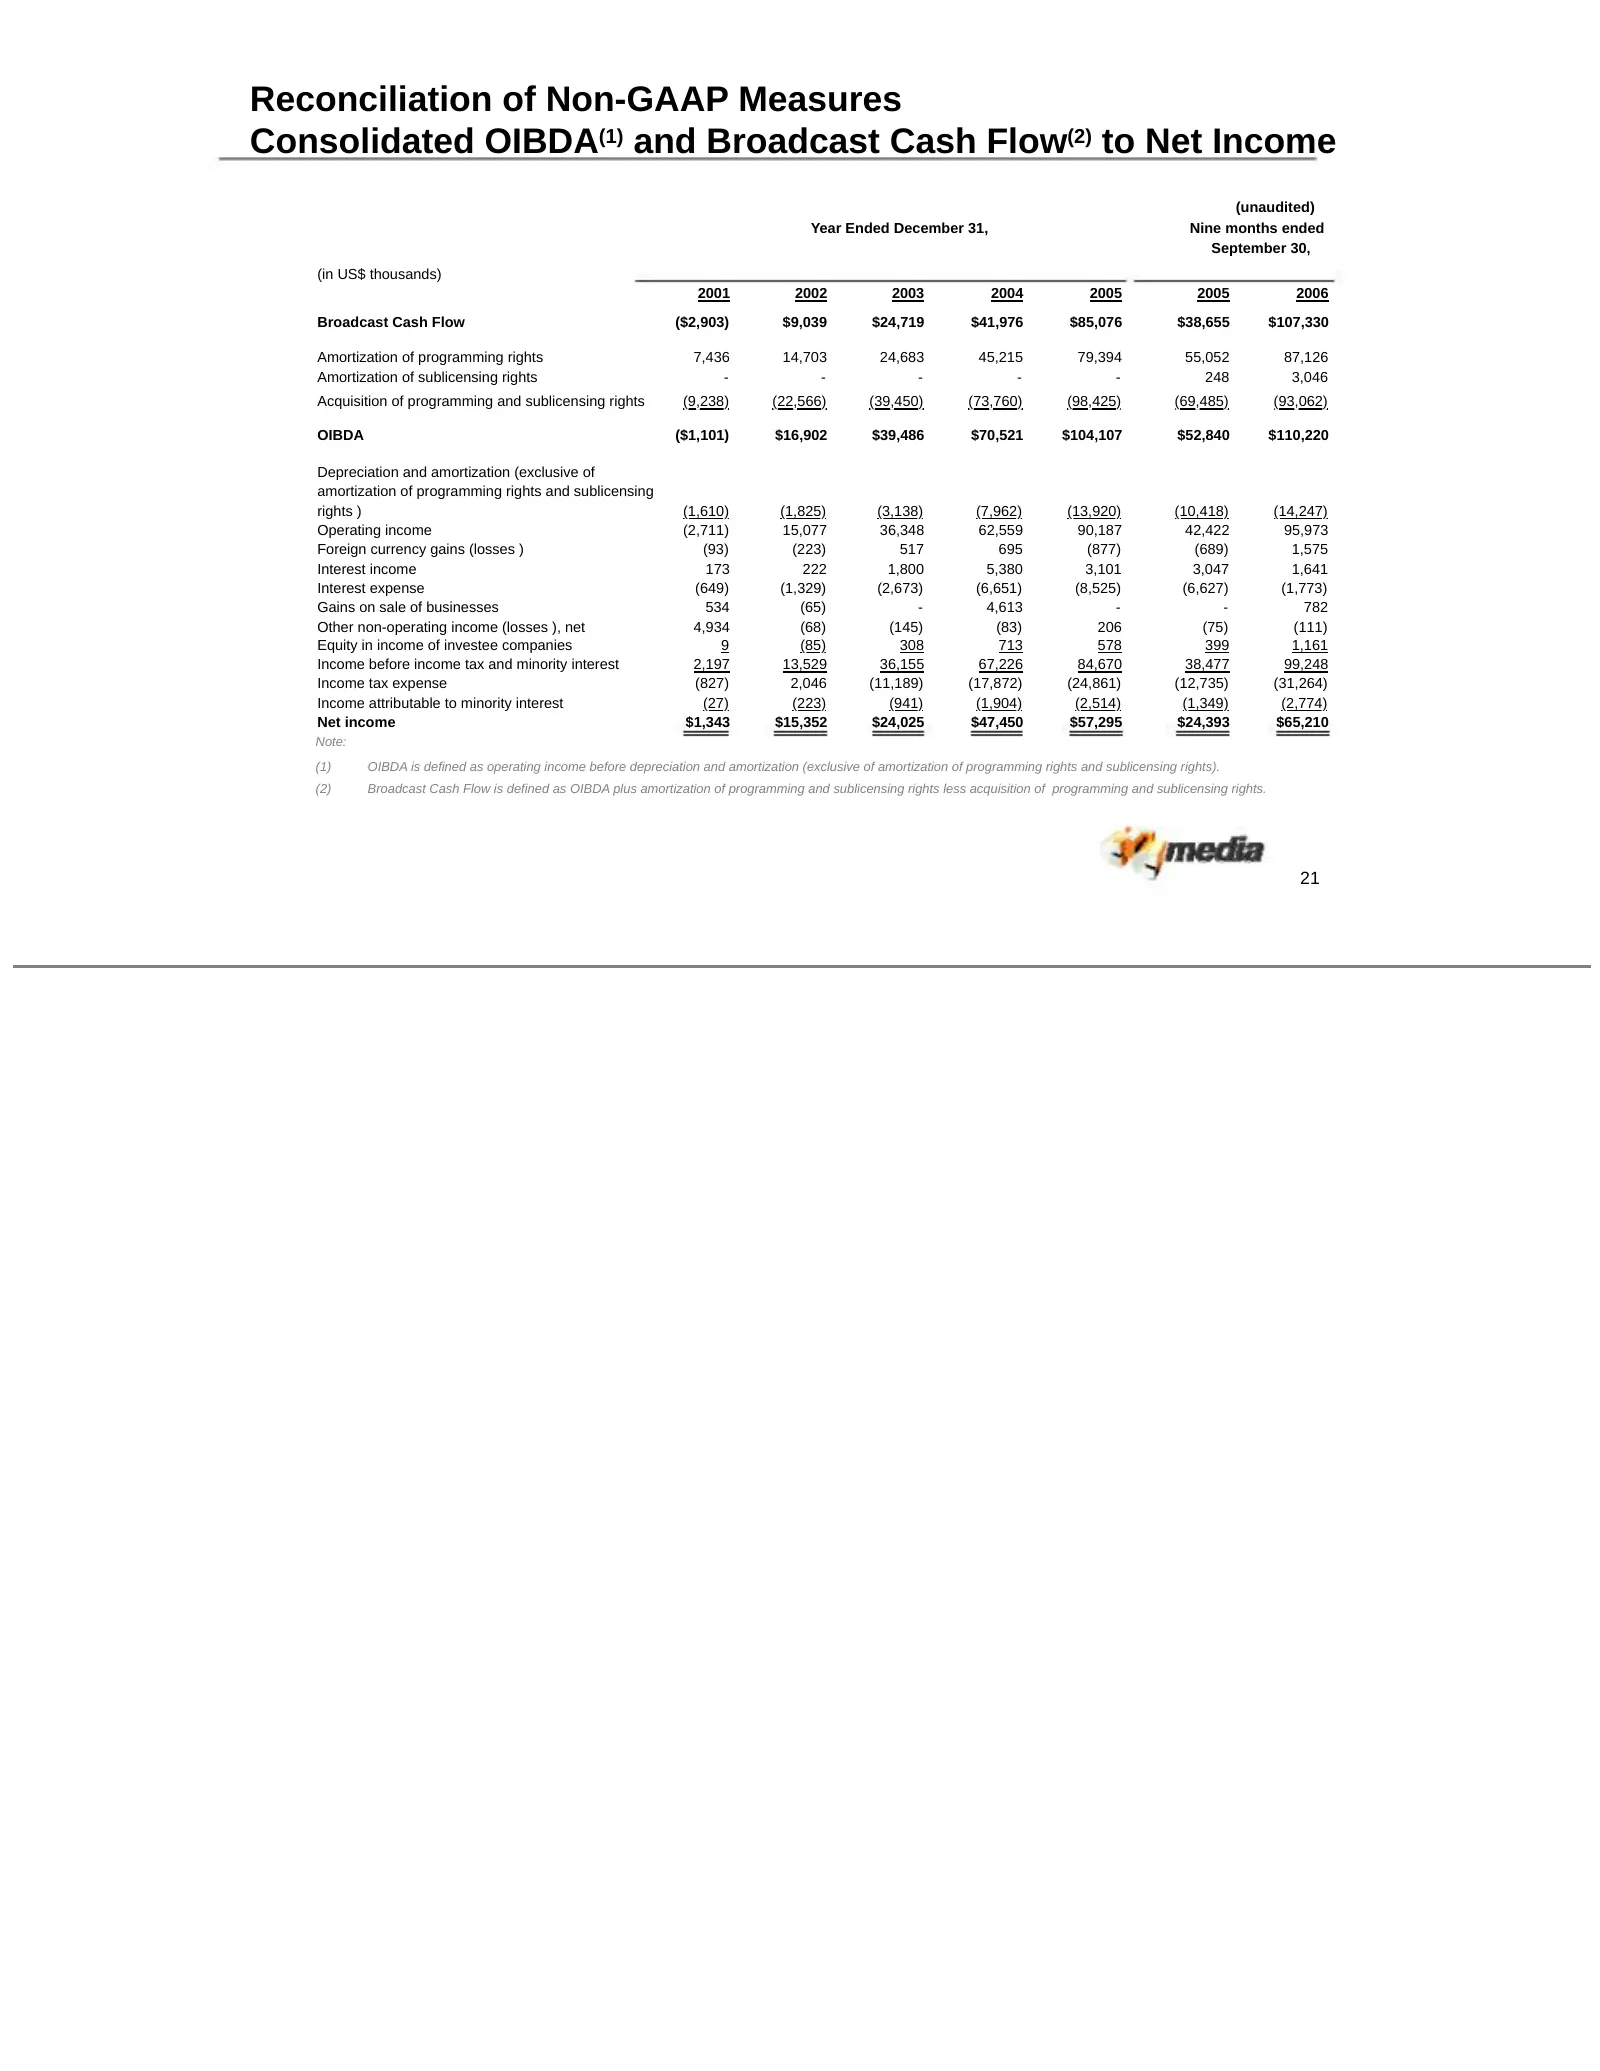
Slide 23: Reconciliation of Non-GAAP Measures Consolidated OIBDA and Broadcast Cash Flow to Net Income
Reconciliation of Non-GAAP Measures Consolidated OIBDA(1) and Broadcast Cash Flow(2) to Net Income (unaudited) Year Ended December 31, Nine months ended September 30, (in US$ thousands) 2001 2002 2003 2004 2005 2005 2006 Broadcast Cash Flow ($2,903) $9,039 $24,719 $41,976 $85,076 $38,655 $107,330 Am
Source: SEC EDGAR · 8-K filed Jan 25, 2007