Cresud SA · BCBA:CRES
Cresud SA — Santander's 23rd Annual Latin America Conference (January 2019)
49 slides from Cresud SA's conference presentation, Jan 29, 2019

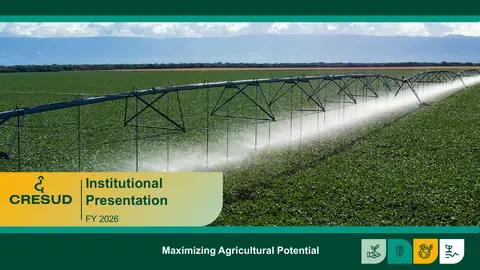
Slide 1: Institutional Presentation
Institutional Presentation Santander’s 23rd Annual Latin America Conference Cancún - January 29, 2019
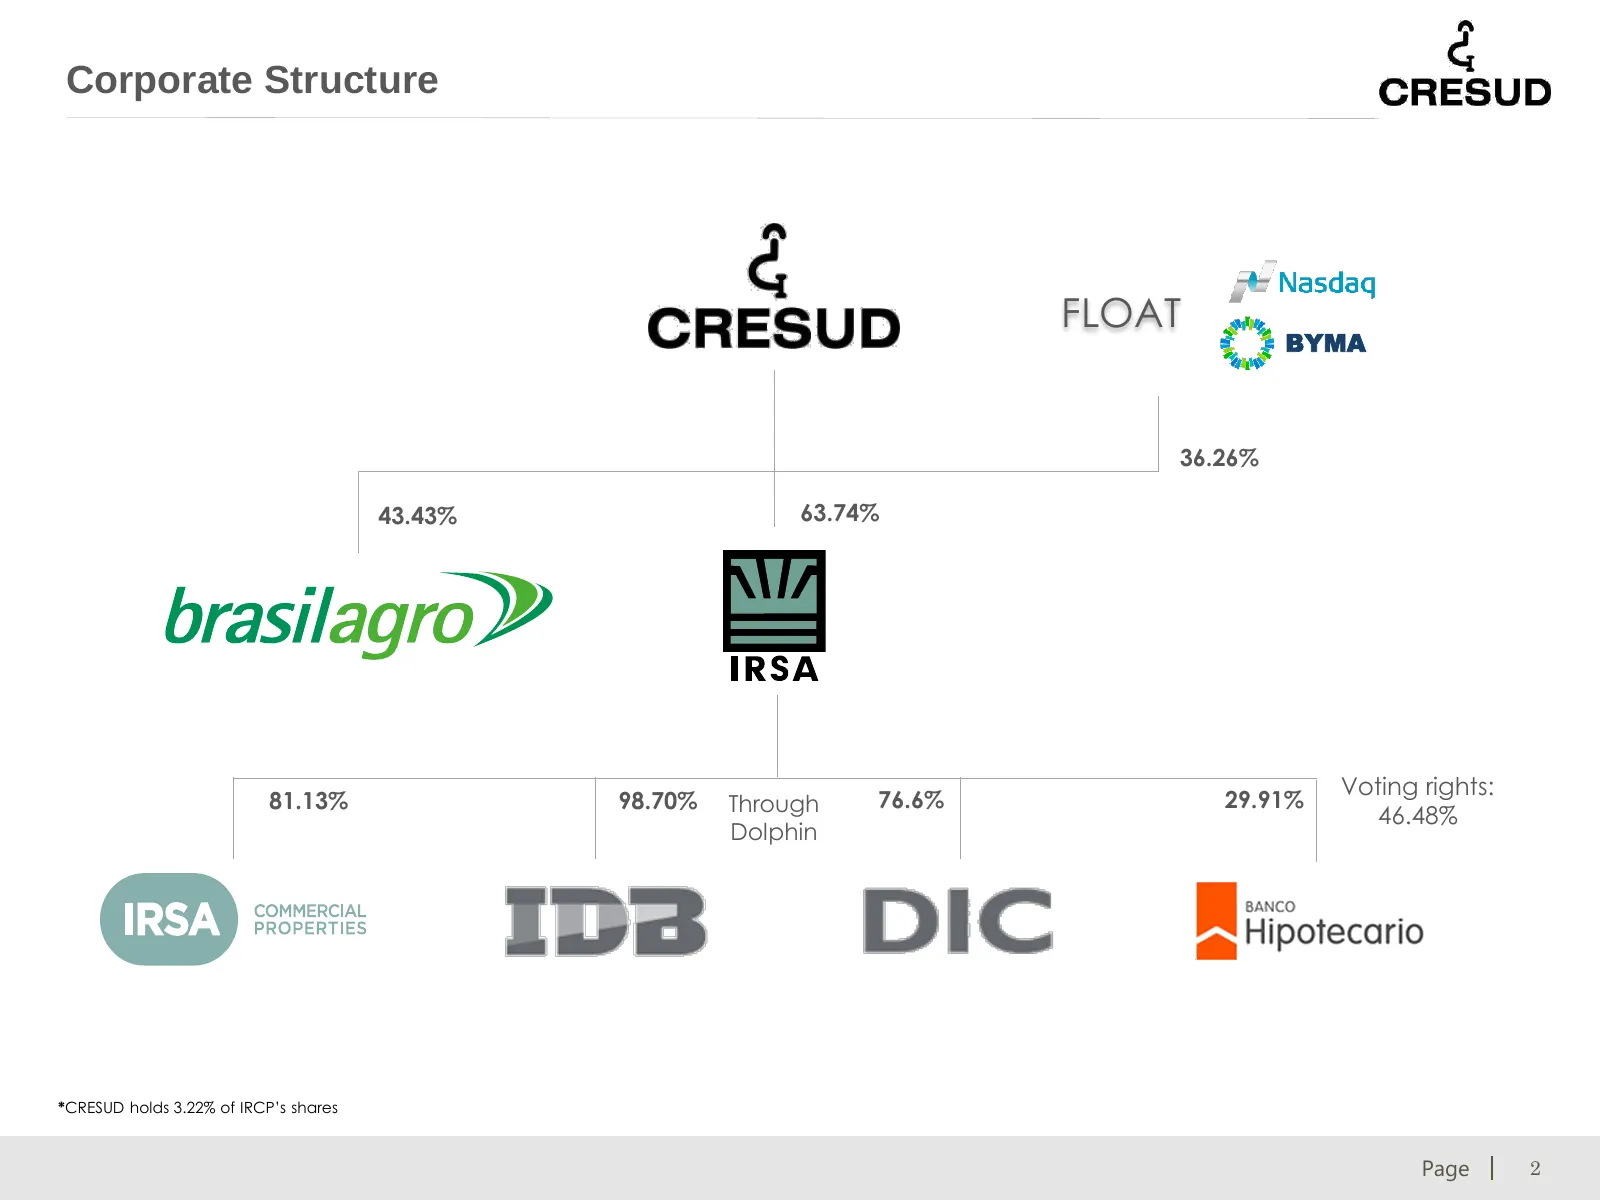
Slide 2: Corporate Structure
Corporate Structure FLOAT BYMA 36.26% 43.43% 63.74% Voting rights: 81.13% 98.70% Through 76.6% 29.91% 46.48% Dolphin *CRESUD holds 3.22% of IRCP’s shares © 2017 CRESUD. All rights reserved. Page 2
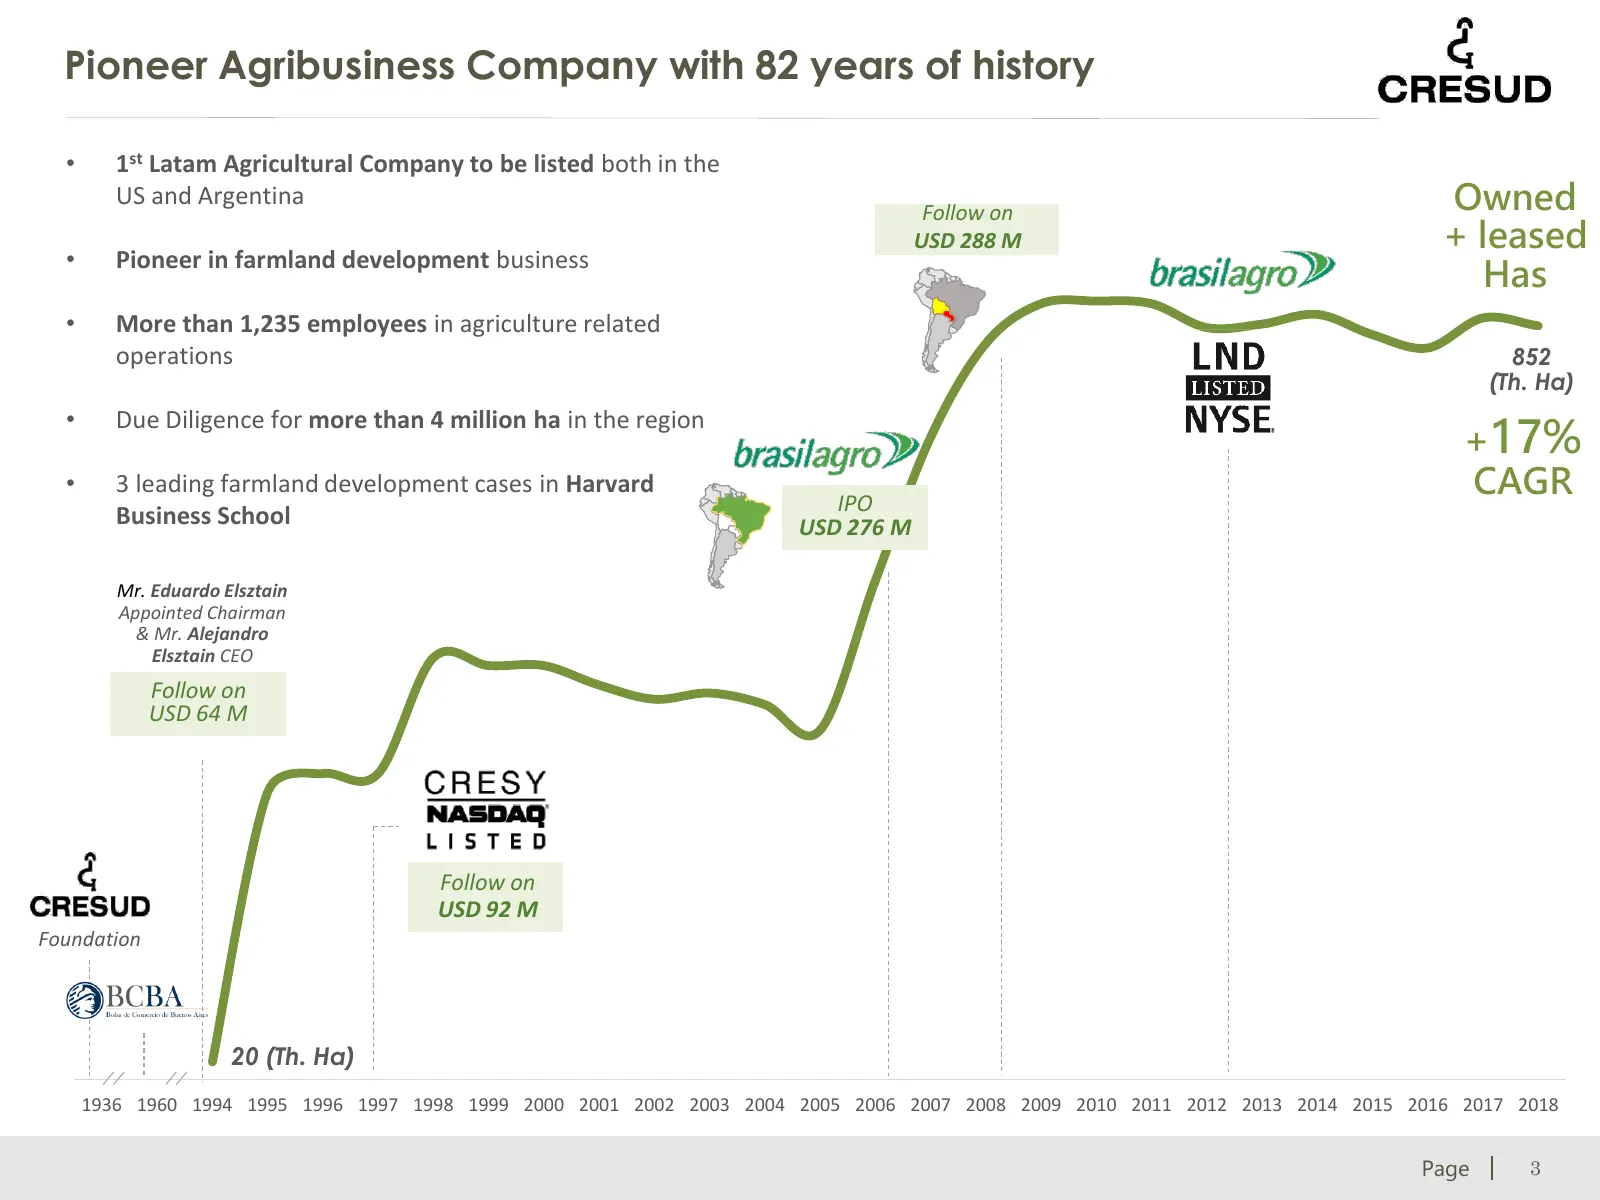
Slide 3: Pioneer Agribusiness Company with 82 years of history
Pioneer Agribusiness Company with 82 years of history • 1st Latam Agricultural Company to be listed both in the US and Argentina Follow on Owned USD 288 M + leased • Pioneer in farmland development business Has • More than 1,235 employees in agriculture related operations 852 (Th. Ha) • +17% Due Dil
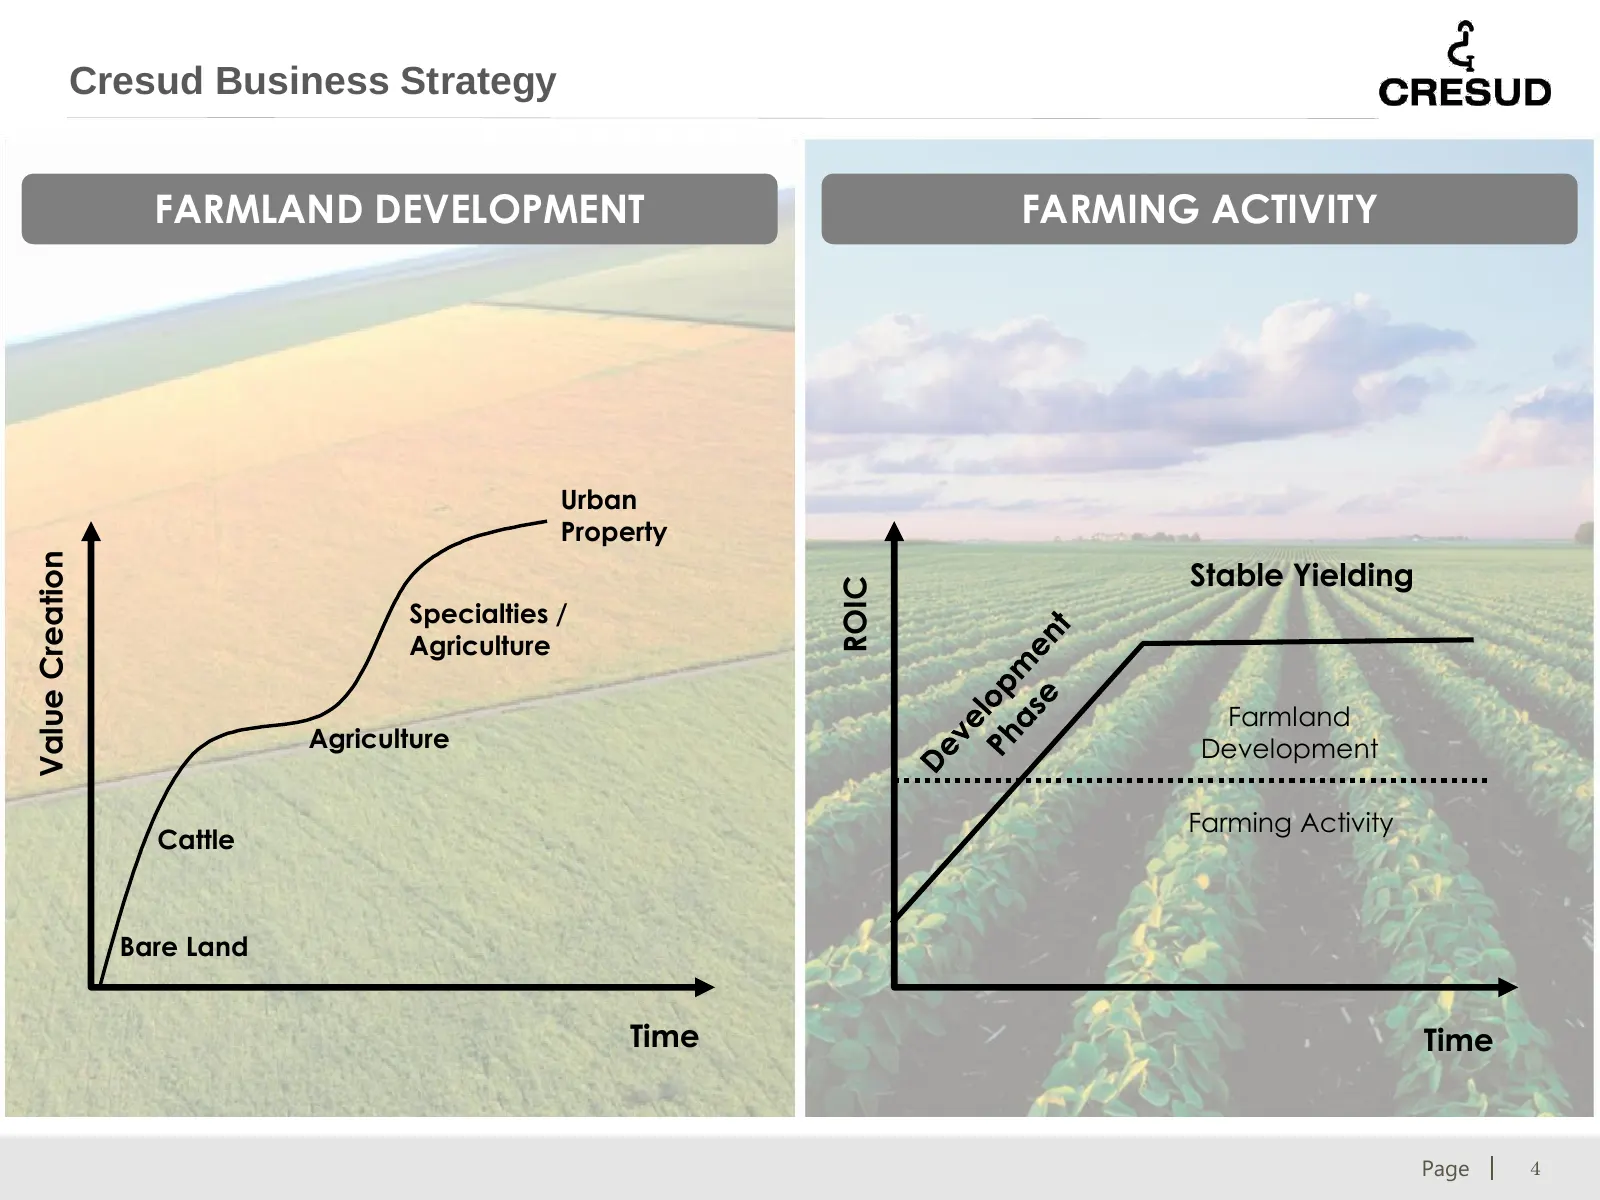
Slide 4: Cresud Business Strategy
Cresud Business Strategy FARMLAND DEVELOPMENT FARMING ACTIVITY Urban Property Value Creation Stable Yielding ROIC Specialties / Agriculture Farmland Agriculture Development Farming Activity Cattle Bare Land Time Time © 2017 CRESUD. All rights reserved. Page 4
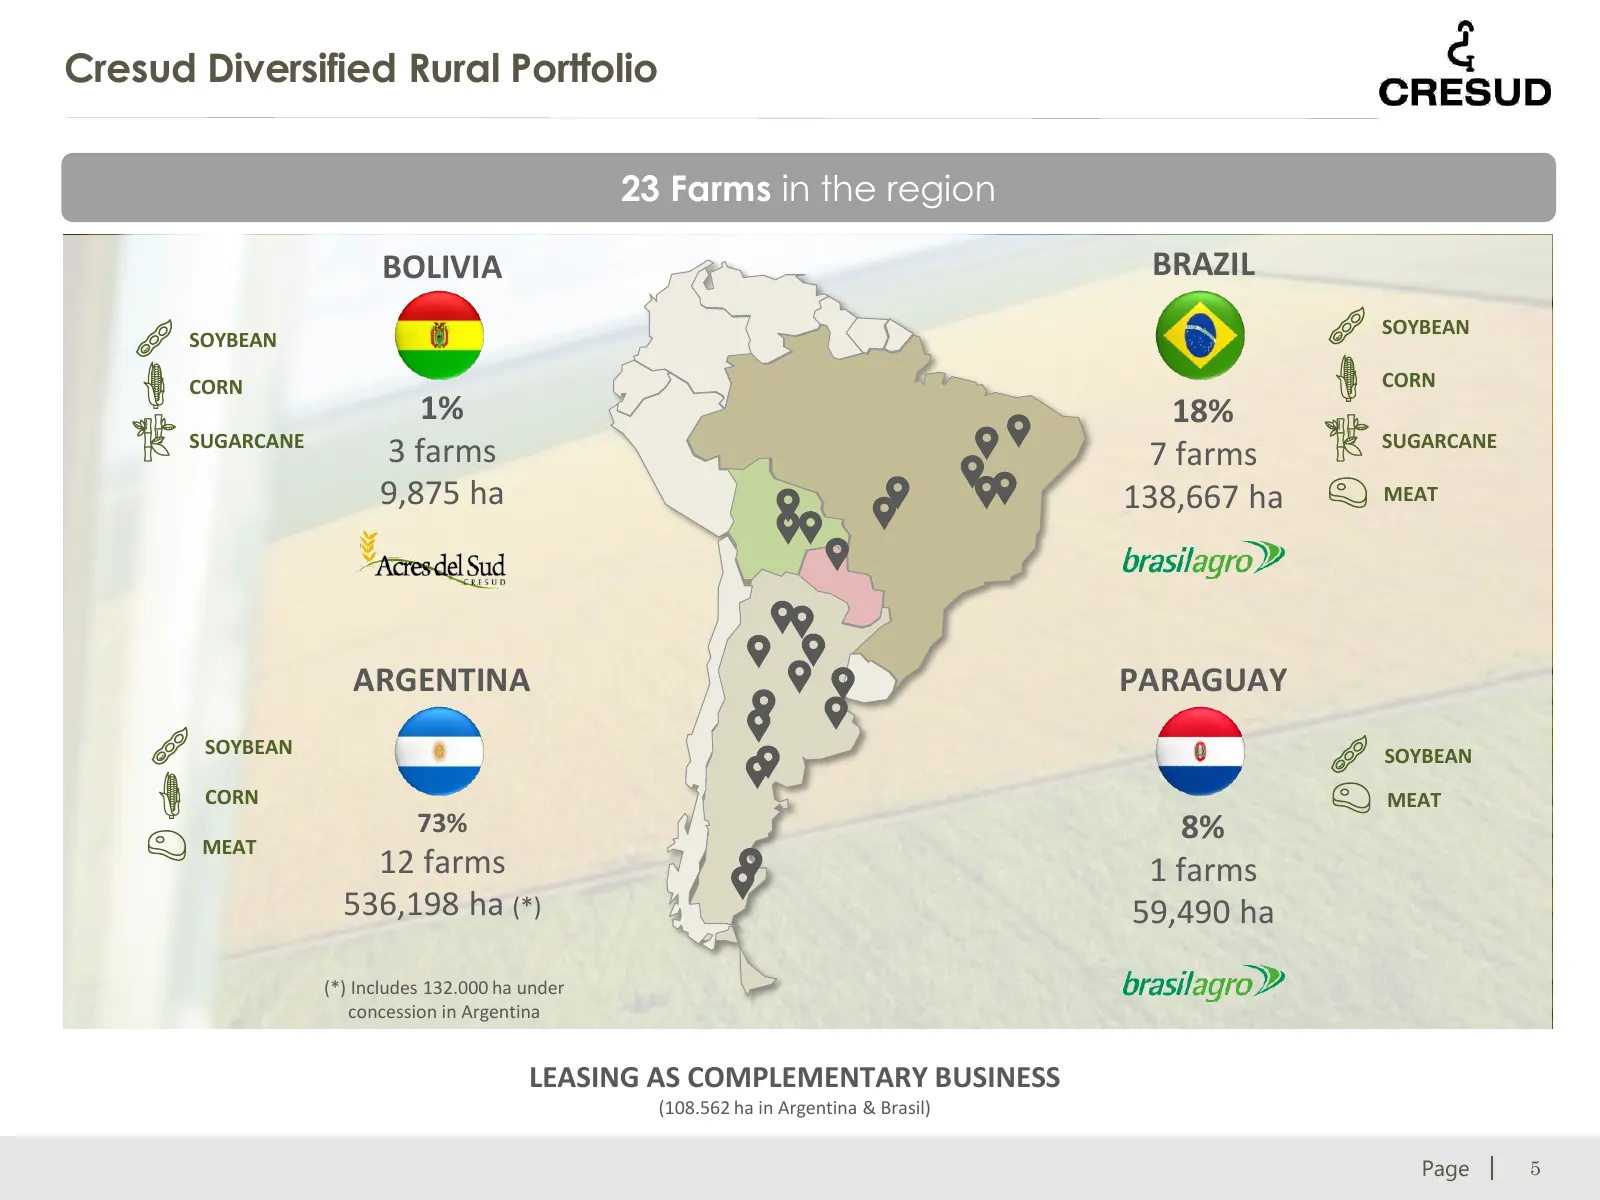
Slide 5: Cresud Diversified Rural Portfolio
Cresud Diversified Rural Portfolio 23 Farms in the region BOLIVIA BRAZIL SOYBEAN SOYBEAN CORN CORN 1% 18% SUGARCANE SUGARCANE 3 farms 7 farms 9,875 ha 138,667 ha MEAT ARGENTINA PARAGUAY SOYBEAN SOYBEAN CORN MEAT 73% 8% MEAT 12 farms 1 farms 536,198 ha (*) 59,490 ha (*) Includes 132.000 ha under conc
Slide 6: Agricultural Portfolio independent appraisal
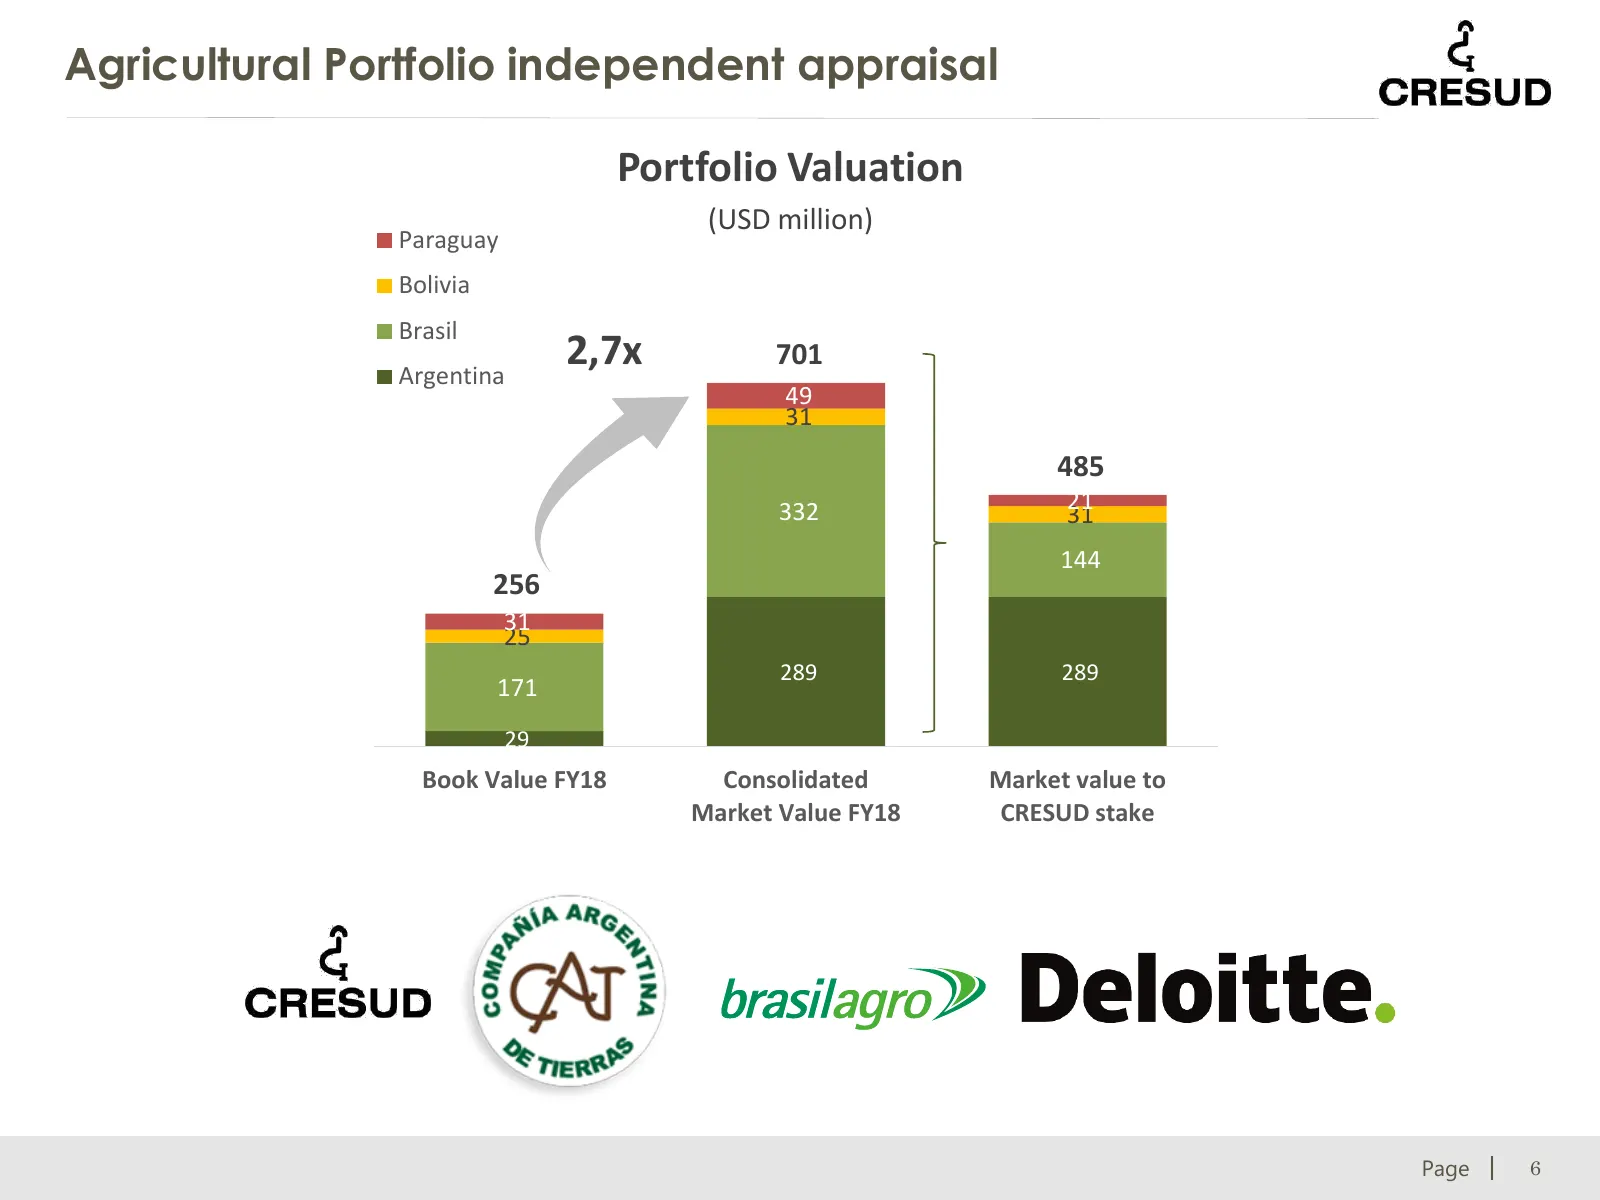
Agricultural Portfolio independent appraisal Portfolio Valuation (USD million) Paraguay Bolivia Brasil Argentina 2,7x 701 49 31 485 332 21 31 144 256 31 25 289 289 171 29 Book Value FY18 Consolidated Market value to Market Value FY18 CRESUD stake © 2017 CRESUD. All rights reserved. Page 6
Slide 7: Farming activity: Planted Area, Crop Production & Yields
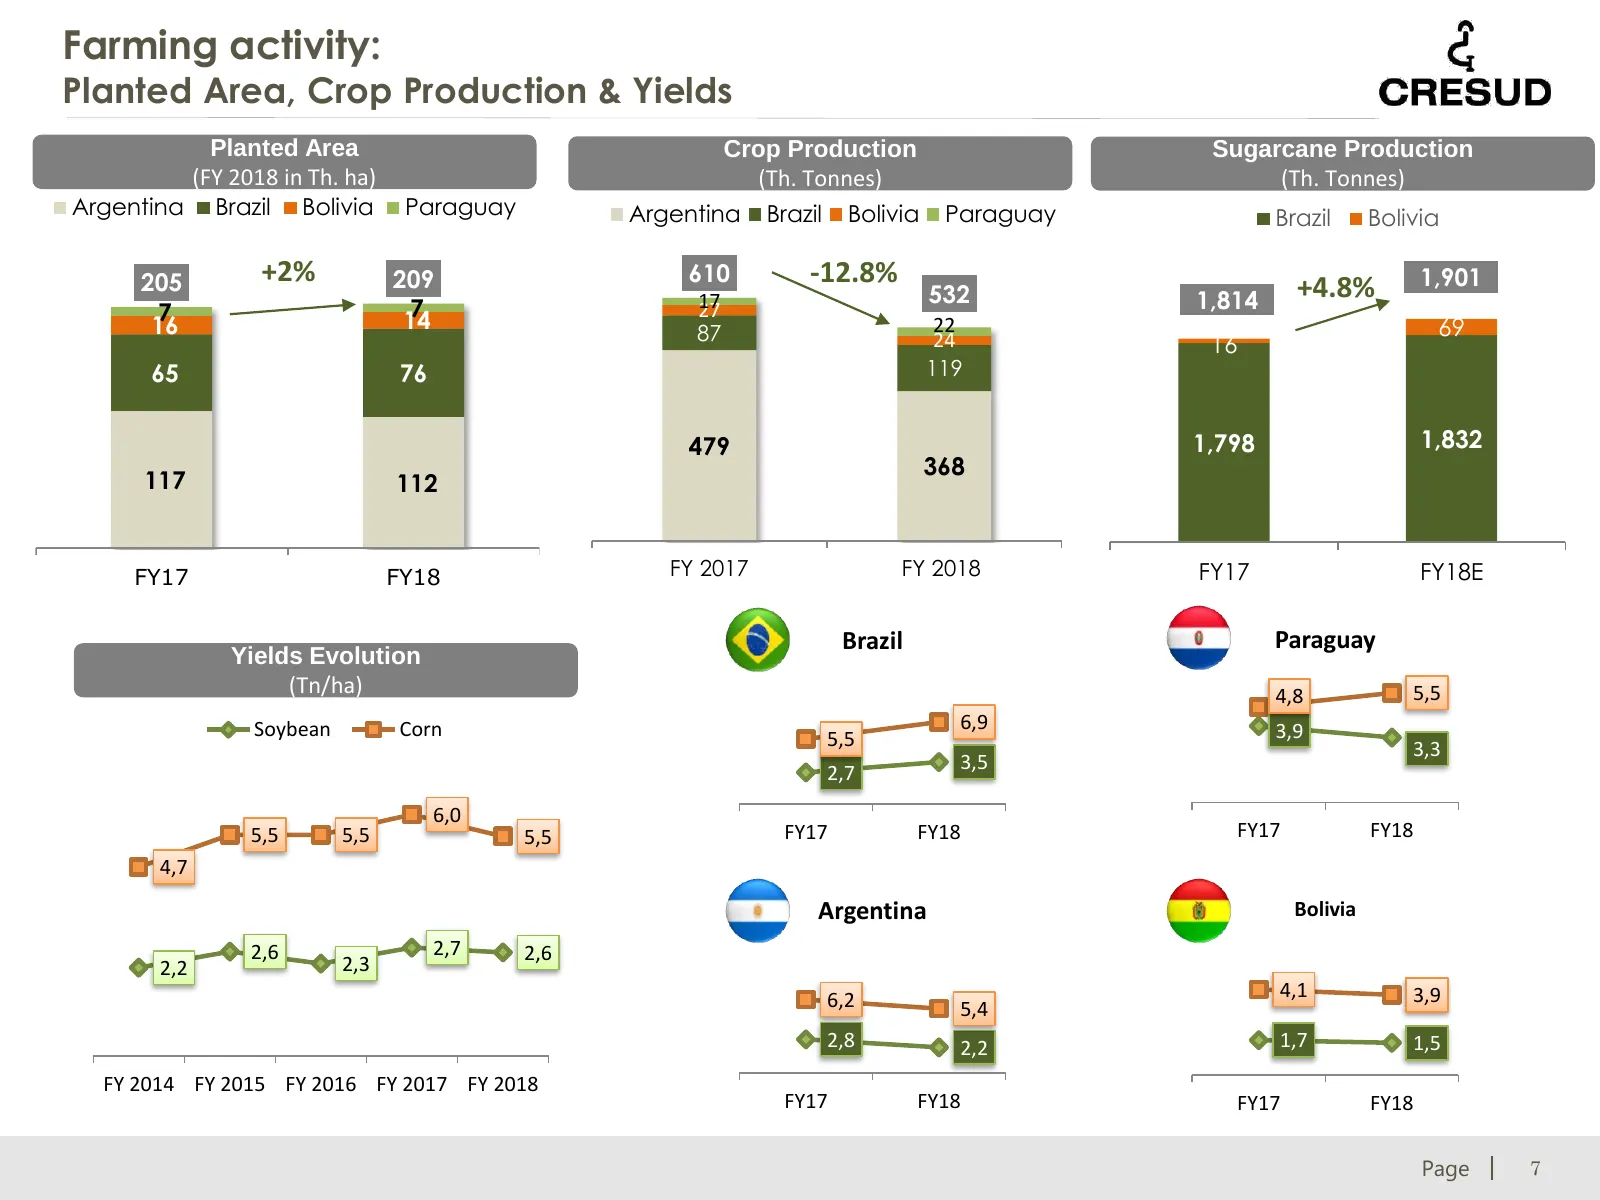
Farming activity: Planted Area, Crop Production & Yields Planted Area Crop Production Sugarcane Production (FY 2018 in Th. ha) (Th. Tonnes) (Th. Tonnes) Argentina Brazil Bolivia Paraguay Argentina Brazil Bolivia Paraguay Brazil Bolivia 205 +2% 209 610 -12.8% 1,901 17 532 1,814 +4.8% 7 7 27 16 14 87
Slide 8: Regional Farmland Sales & Development
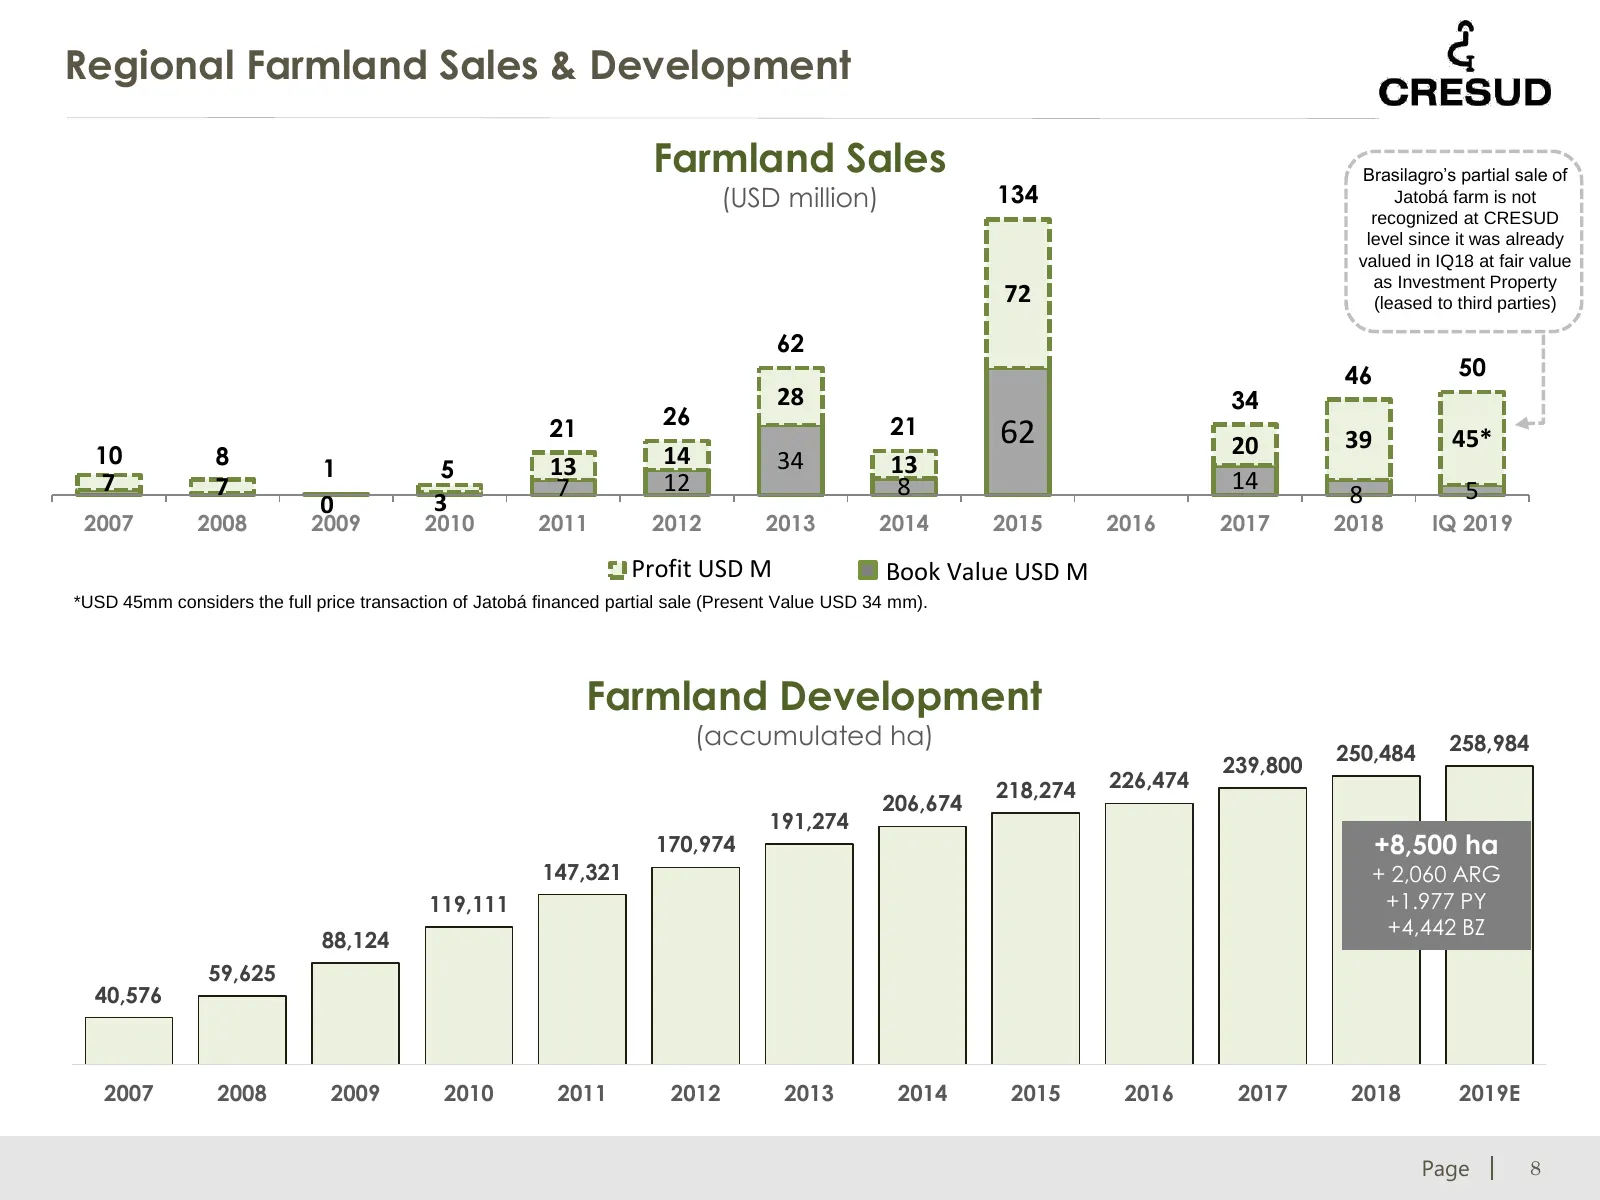
Regional Farmland Sales & Development Farmland Sales Brasilagro’s partial sale of (USD million) 134 Jatobá farm is not recognized at CRESUD level since it was already valued in IQ18 at fair value as Investment Property 72 (leased to third parties) 62 46 50 28 34 21 26 21 62 20 39 45* 10 8 14 34 1 5
Slide 9: Brasilagro's Partial Sale of Jatobá Farm – July 2018
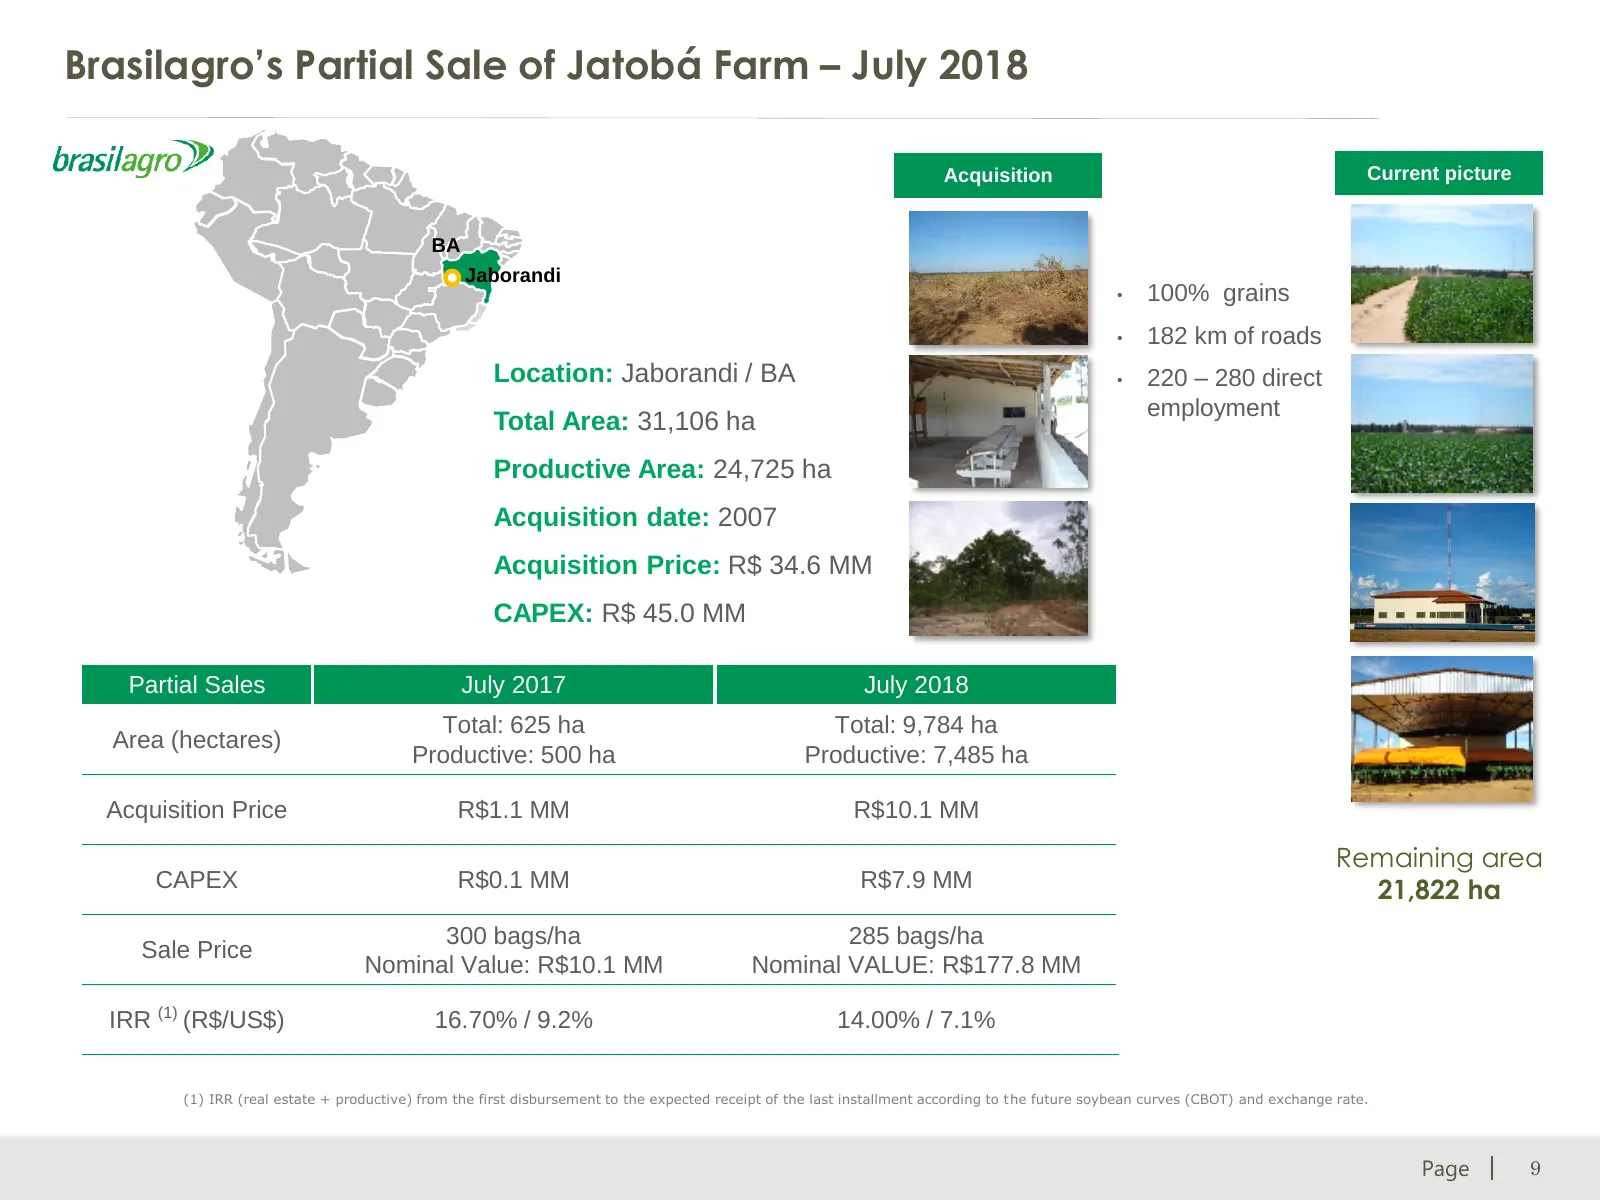
Brasilagro’s Partial Sale of Jatobá Farm – July 2018 Acquisition Current picture BA Jaborandi • 100% grains • 182 km of roads Location: Jaborandi / BA • 220 – 280 direct employment Total Area: 31,106 ha Productive Area: 24,725 ha Acquisition date: 2007 Acquisition Price: R$ 34.6 MM CAPEX: R$ 45.0 MM
Slide 10: Agribusiness Adjusted EBITDA
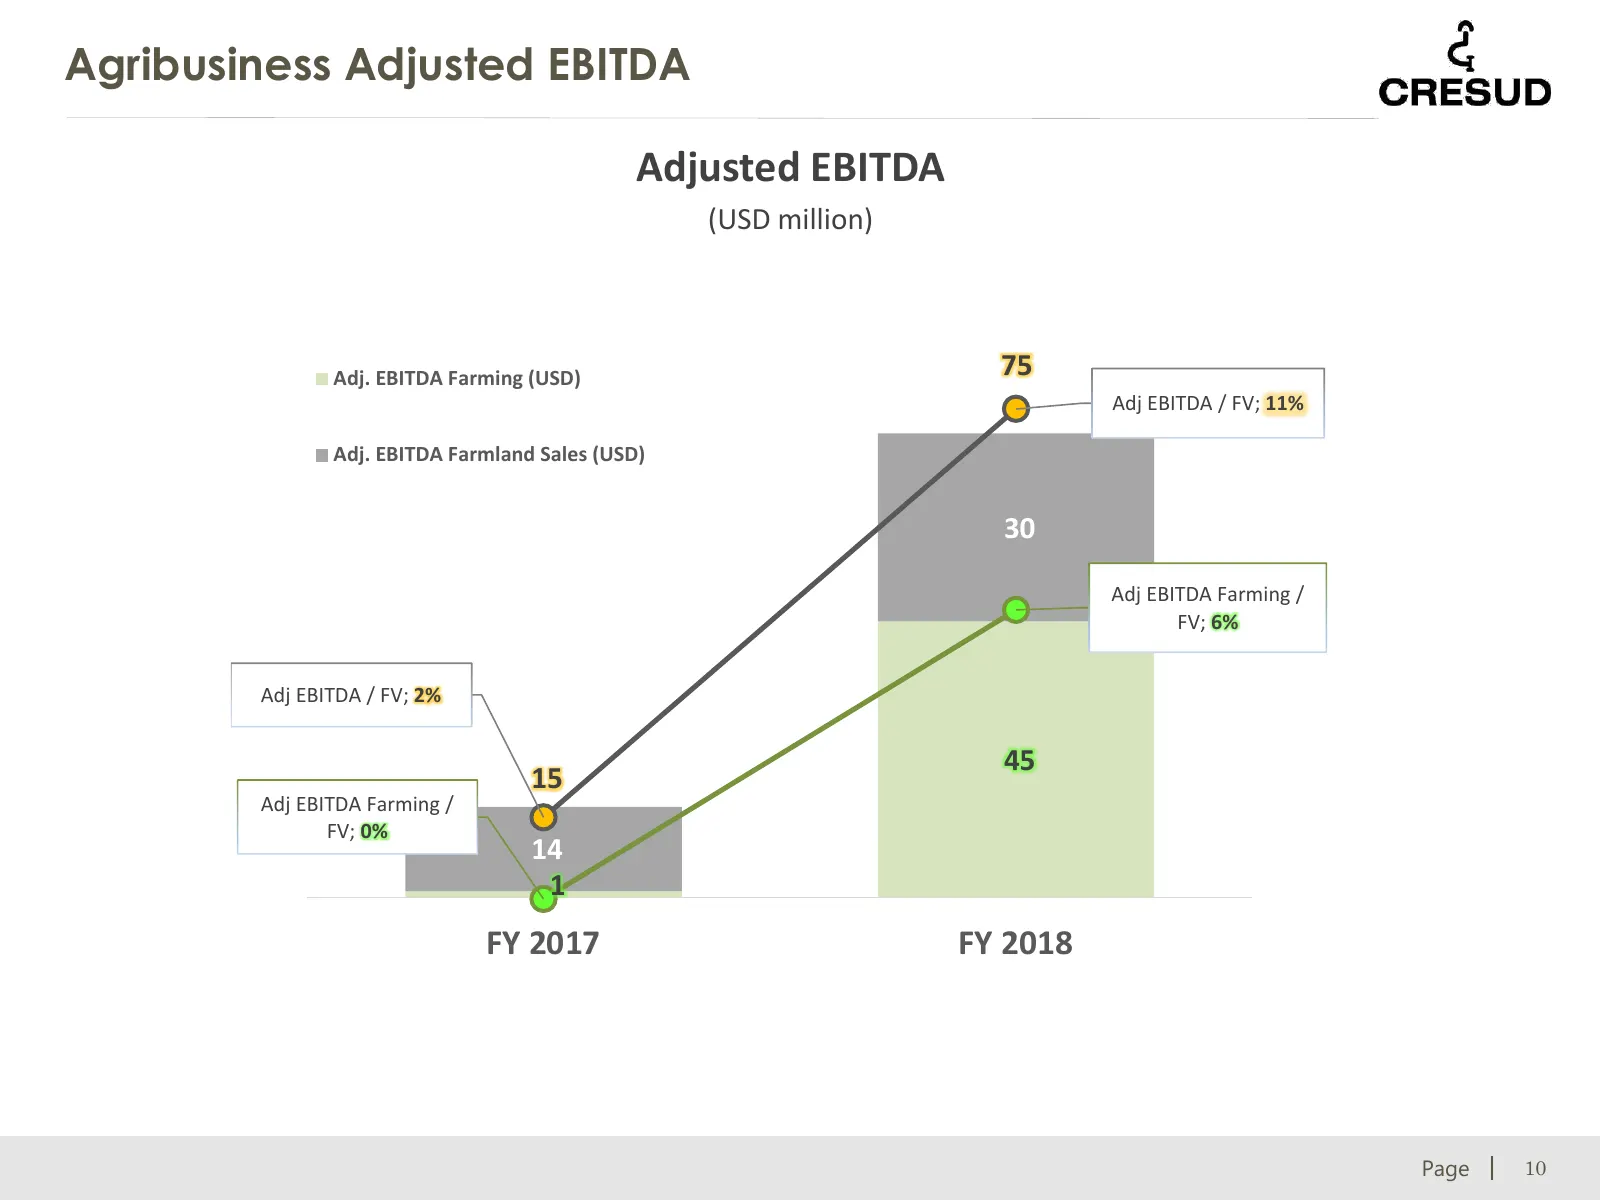
Agribusiness Adjusted EBITDA Adjusted EBITDA (USD million) Adj. EBITDA Farming (USD) 75 Adj EBITDA / FV; 11% Adj. EBITDA Farmland Sales (USD) 30 Adj EBITDA Farming / FV; 6% Adj EBITDA / FV; 2% 45 15 Adj EBITDA Farming / FV; 0% 14 1 FY 2017 FY 2018 © 2017 CRESUD. All rights reserved. Page 10
Slide 11: Good prospects for 2019 campaign in Argentina…
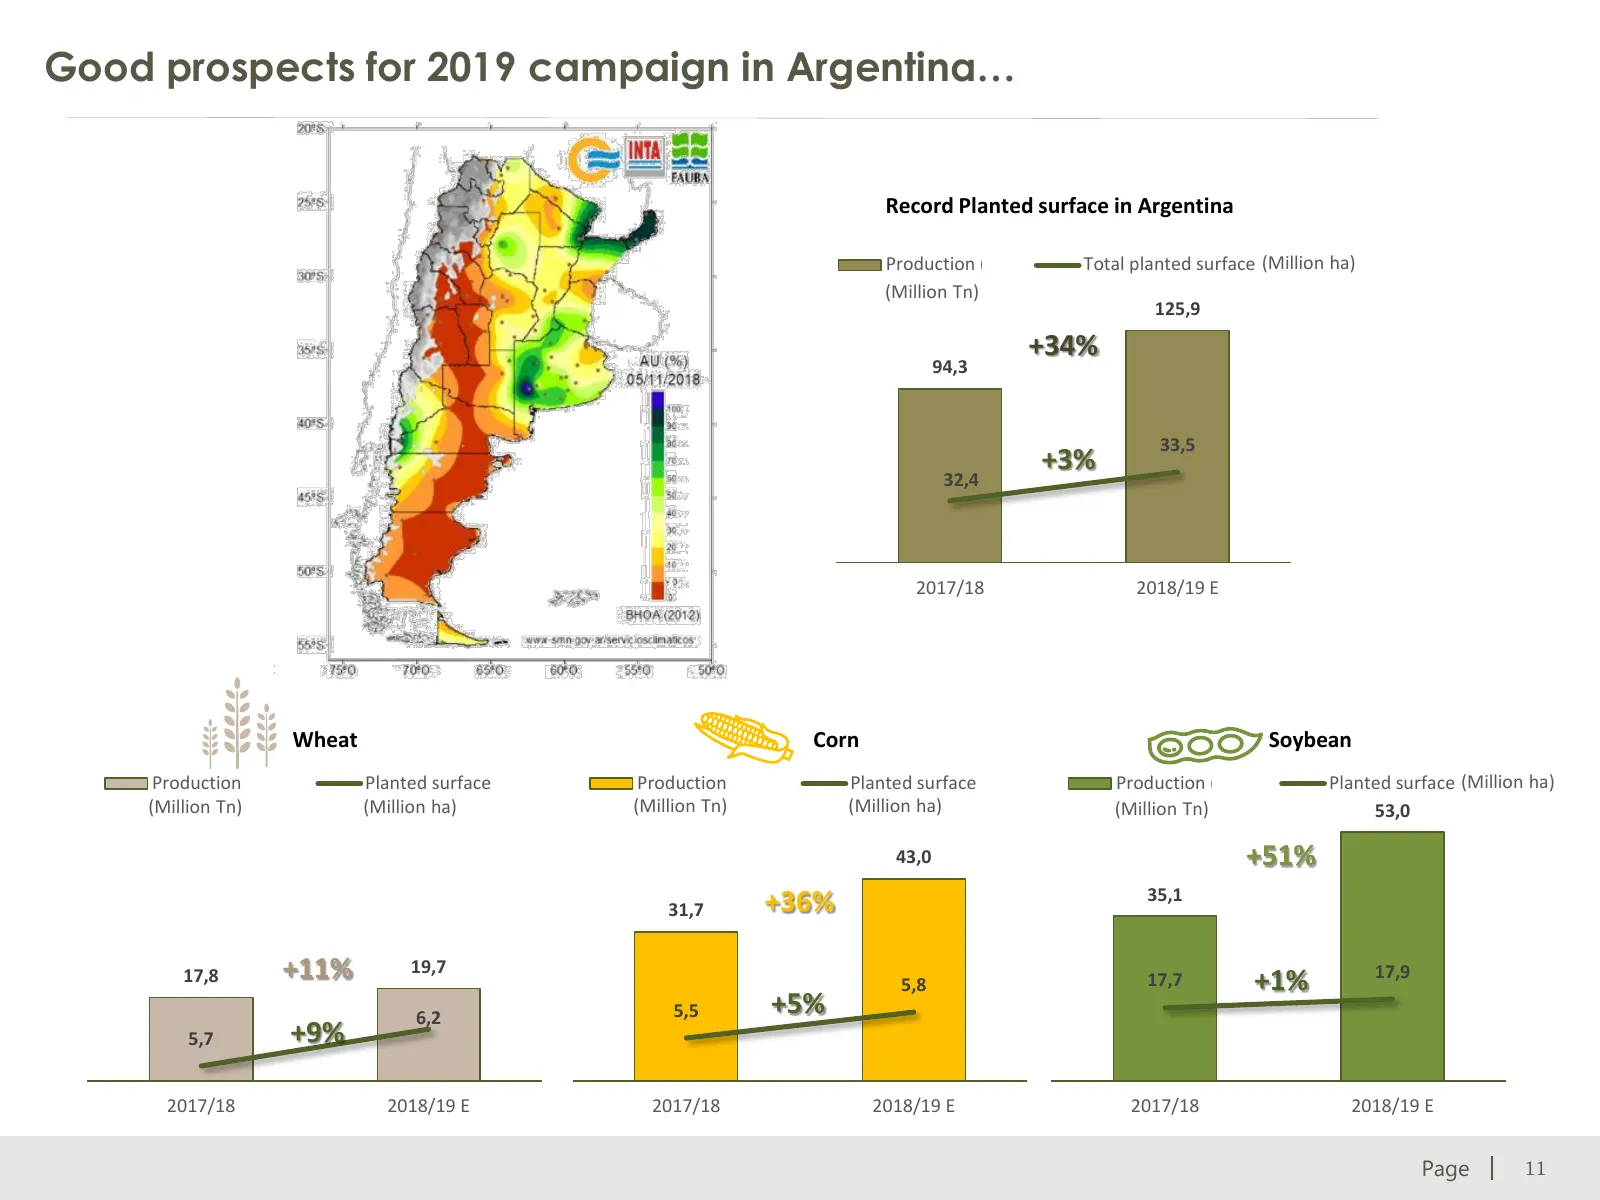
Good prospects for 2019 campaign in Argentina… Record Planted surface in Argentina Production (Tn) (Million ha) Total planted surface (ha) (Million Tn) 125,9 +34% 94,3 33,5 +3% 32,4 2017/18 2018/19 E Wheat Corn Soybean Production (Tn) Planted surface (ha) Production (Tn) Planted surface (ha) Product
Slide 12: …despite recent increase in tax exports
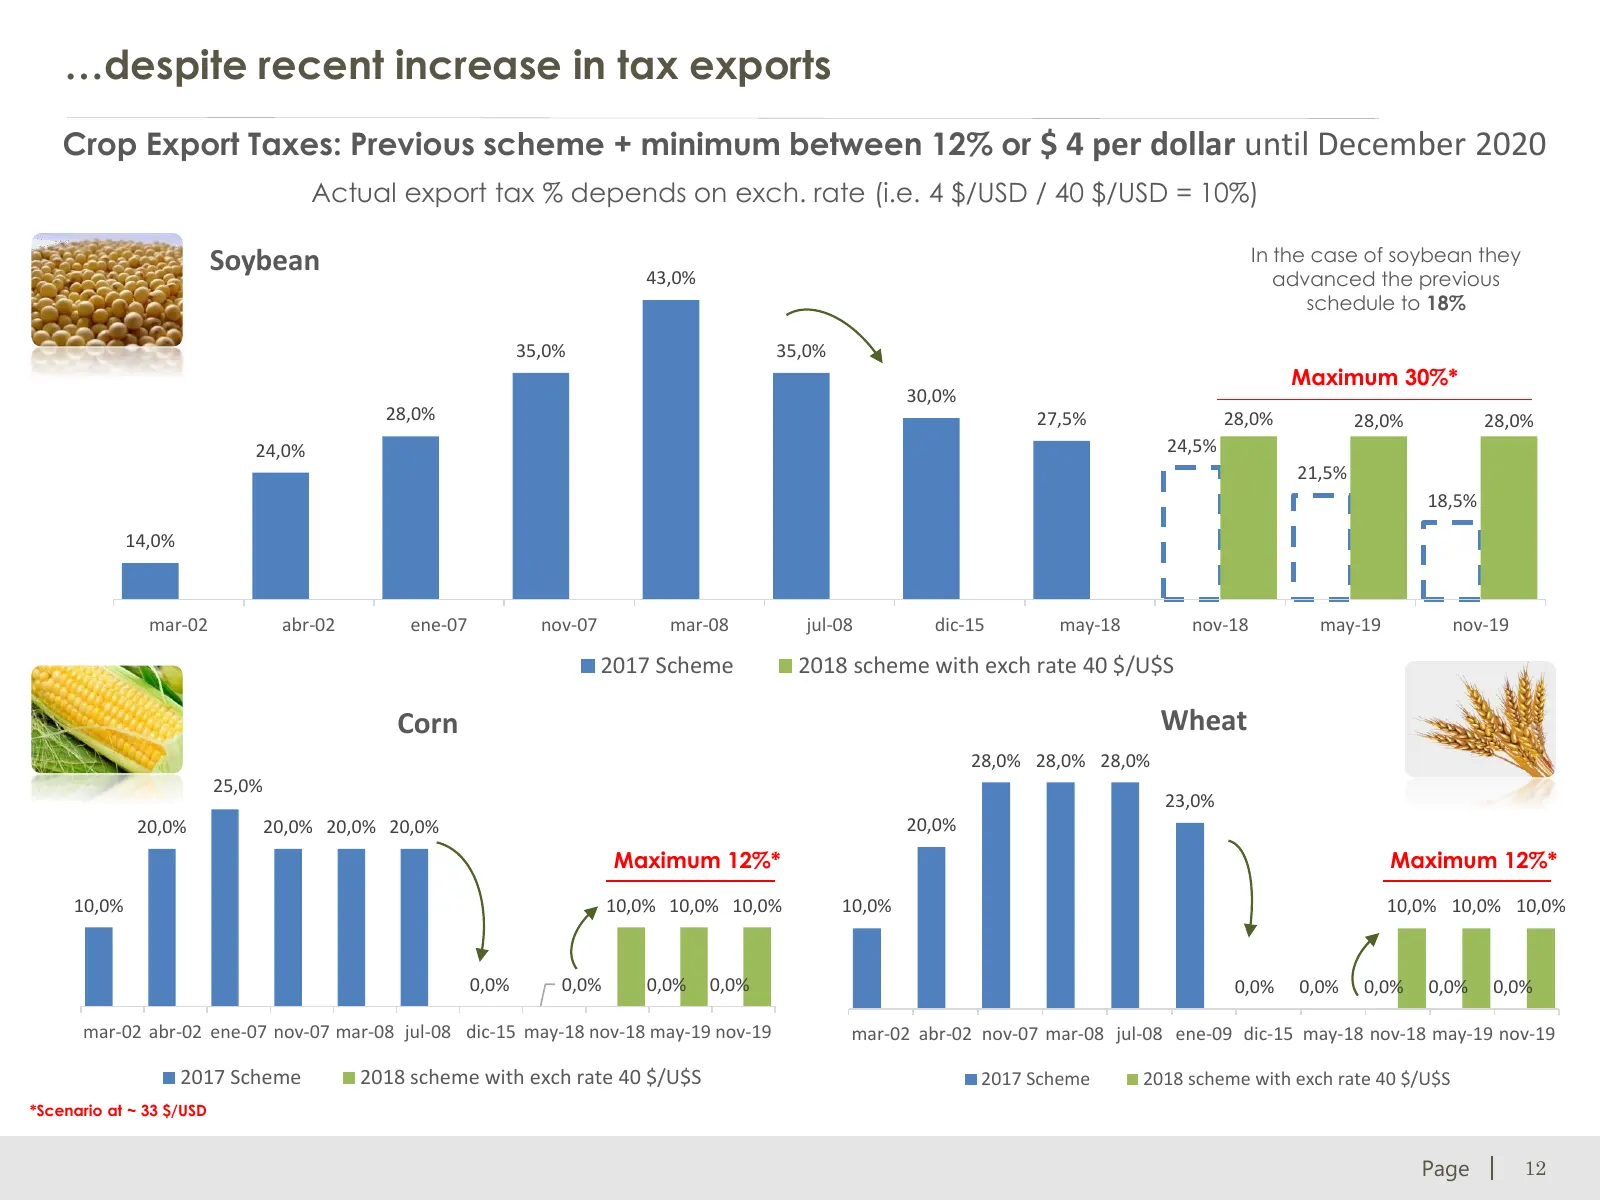
…despite recent increase in tax exports Crop Export Taxes: Previous scheme + minimum between 12% or $ 4 per dollar until December 2020 Actual export tax % depends on exch. rate (i.e. 4 $/USD / 40 $/USD = 10%) Soybean In the case of soybean they 43,0% advanced the previous schedule to 18% 35,0% 35,0%
Slide 13: Planted Area Evolution (in thousand Hectares)
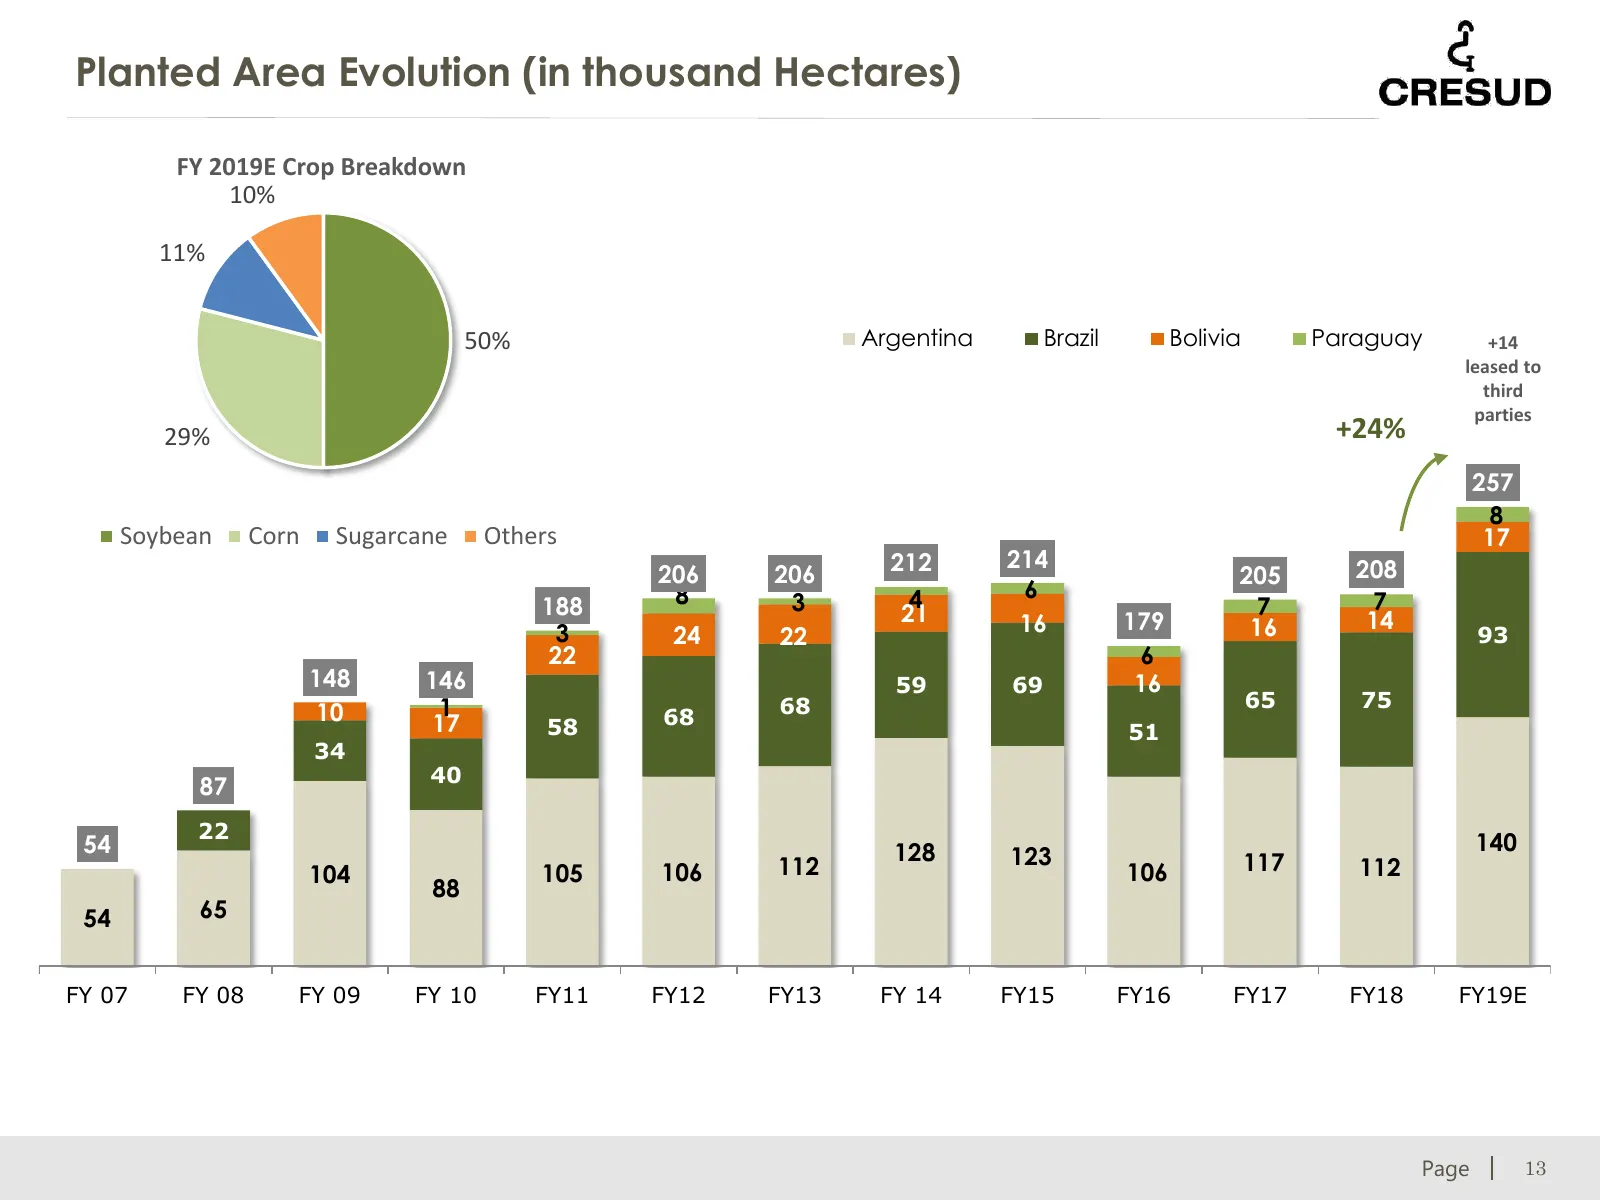
Planted Area Evolution (in thousand Hectares) FY 2019E Crop Breakdown 10% 11% 50% Argentina Brazil Bolivia Paraguay +14 leased to third parties 29% +24% 257 8 Soybean Corn Sugarcane Others 17 212 214 208 206 206 205 8 4 6 188 3 7 7 21 16 179 14 3 24 22 16 93 22 6 148 146 59 69 16 1 68 65 75 10 17 68
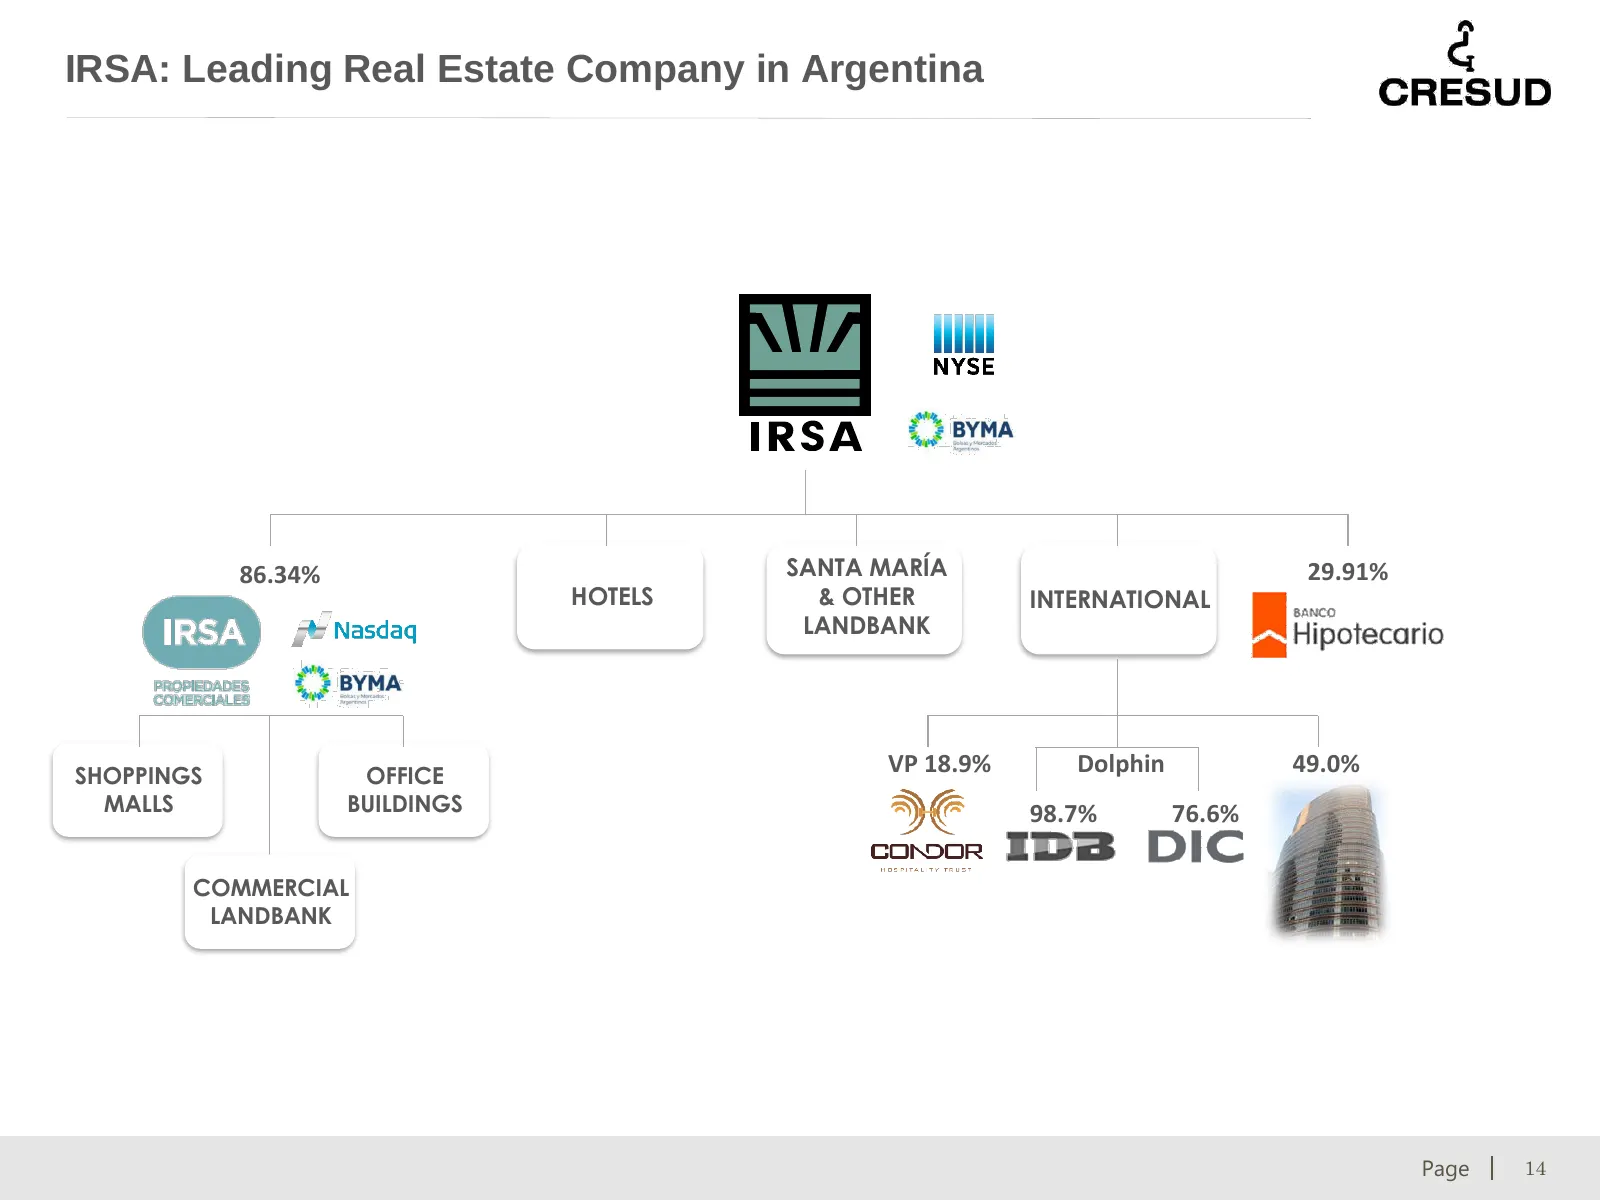
Slide 14: IRSA: Leading Real Estate Company in Argentina
IRSA: Leading Real Estate Company in Argentina 86.34% SANTA MARÍA 29.91% HOTELS & OTHER INTERNATIONAL LANDBANK SHOPPINGS OFFICE VP 18.9% Dolphin 49.0% MALLS BUILDINGS 98.7% 76.6% COMMERCIAL LANDBANK © 2017 CRESUD. All rights reserved. Page 14
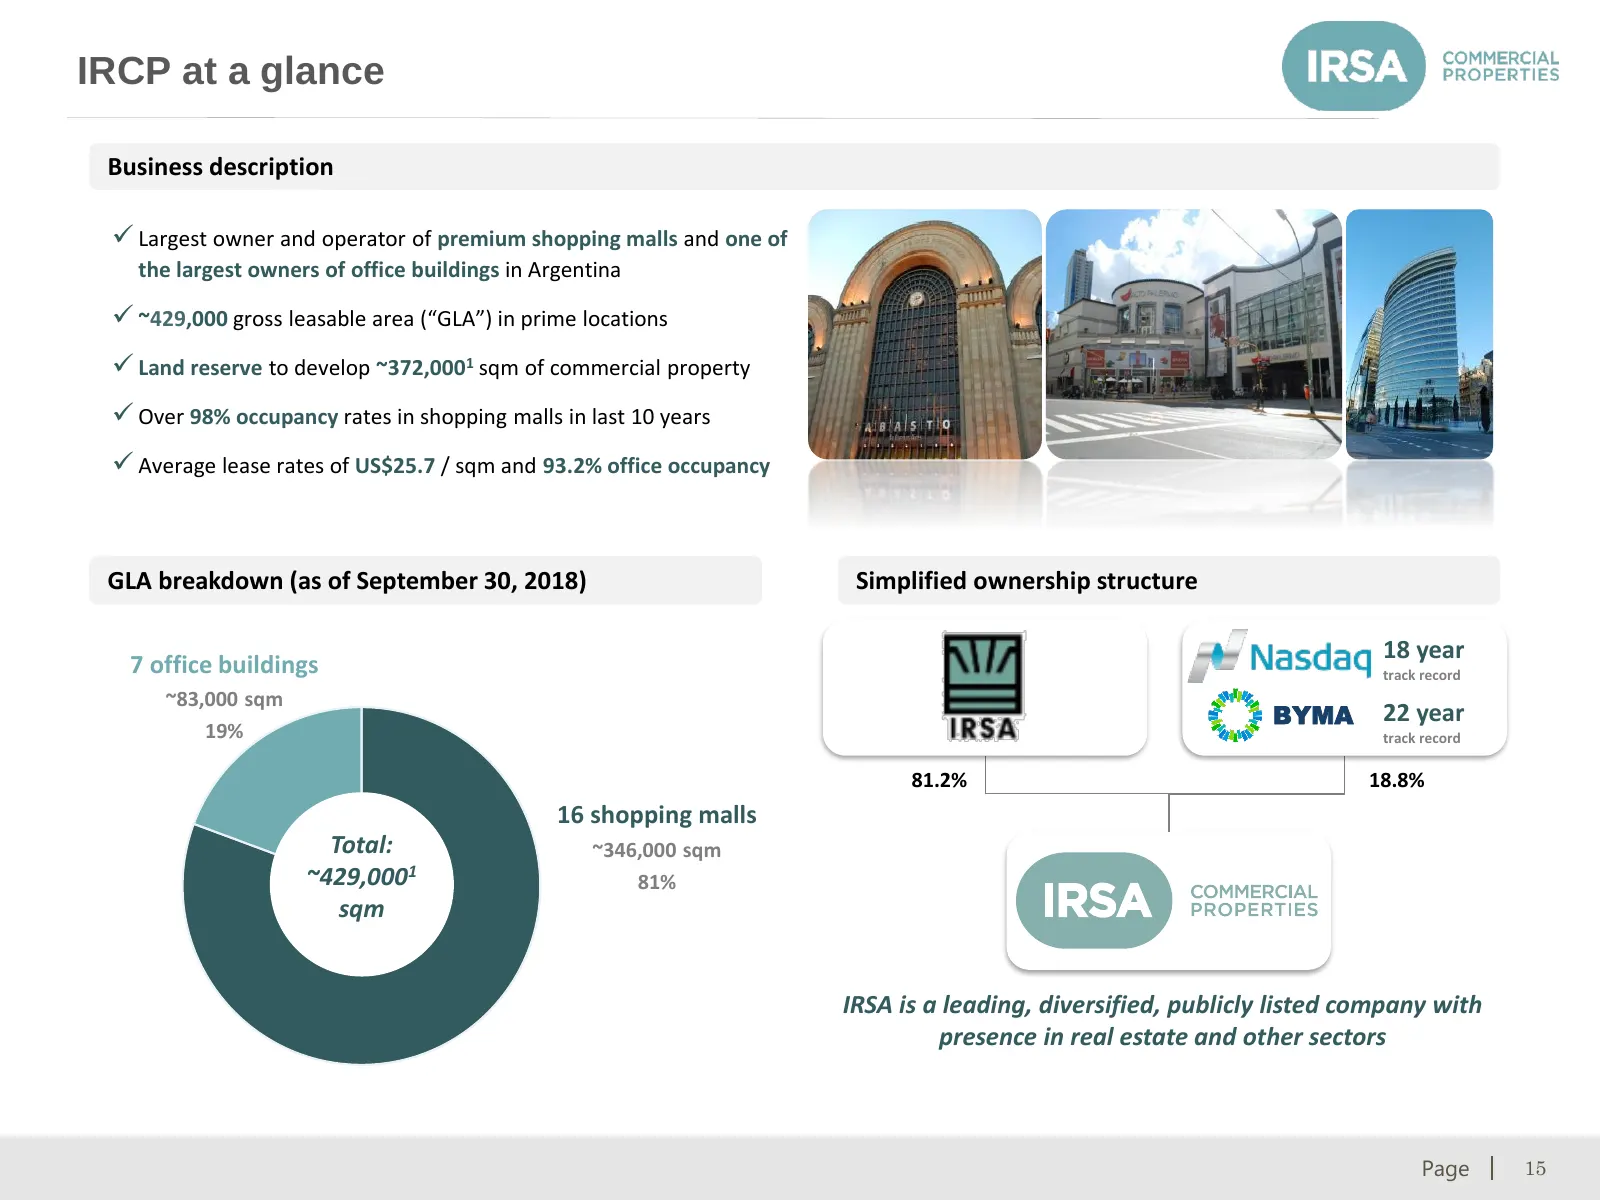
Slide 15: IRCP at a glance
IRCP at a glance Business description Largest owner and operator of premium shopping malls and one of the largest owners of office buildings in Argentina ~429,000 gross leasable area (“GLA”) in prime locations Land reserve to develop ~372,0001 sqm of commercial property Over 98% occupancy ra
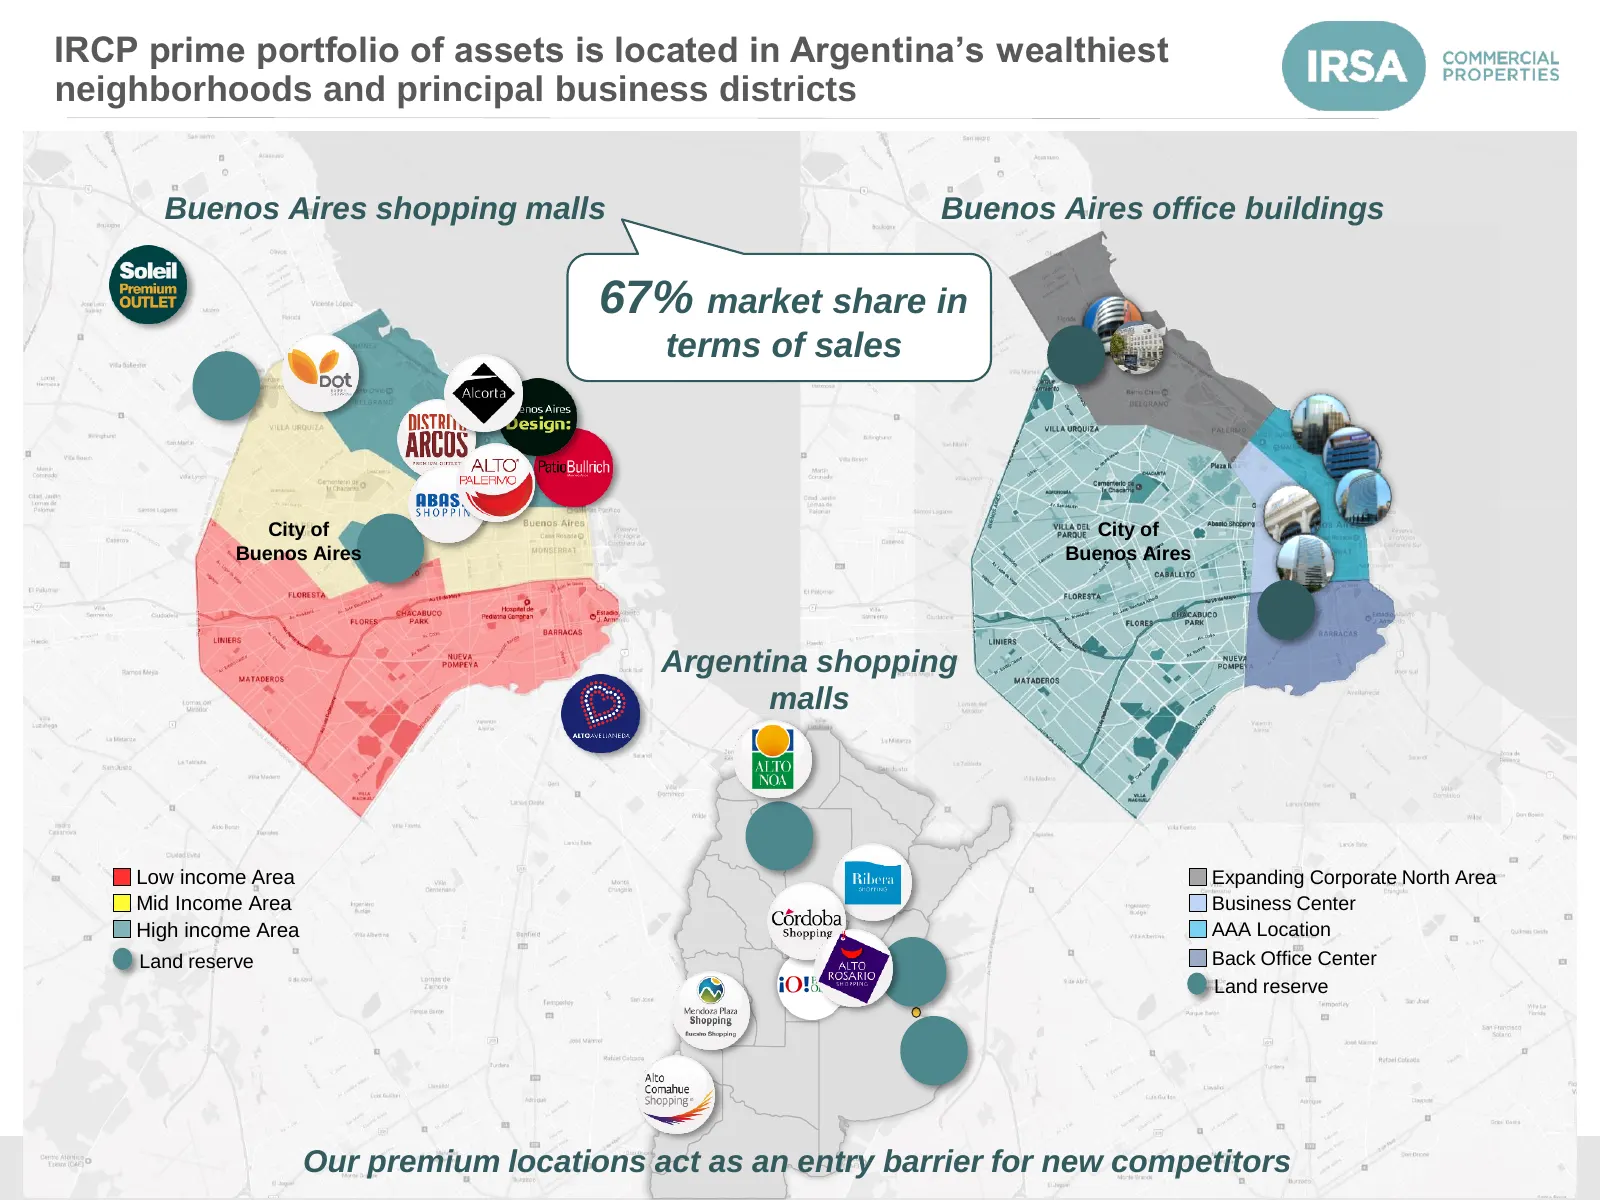
Slide 16: IRCP prime portfolio located in Argentina's wealthiest neighborhoods
IRCP prime portfolio of assets is located in Argentina’s wealthiest neighborhoods and principal business districts Buenos Aires shopping malls Buenos Aires office buildings 67% market share in terms of sales City of City of Buenos Aires Buenos Aires Argentina shopping malls Low income Area Expanding
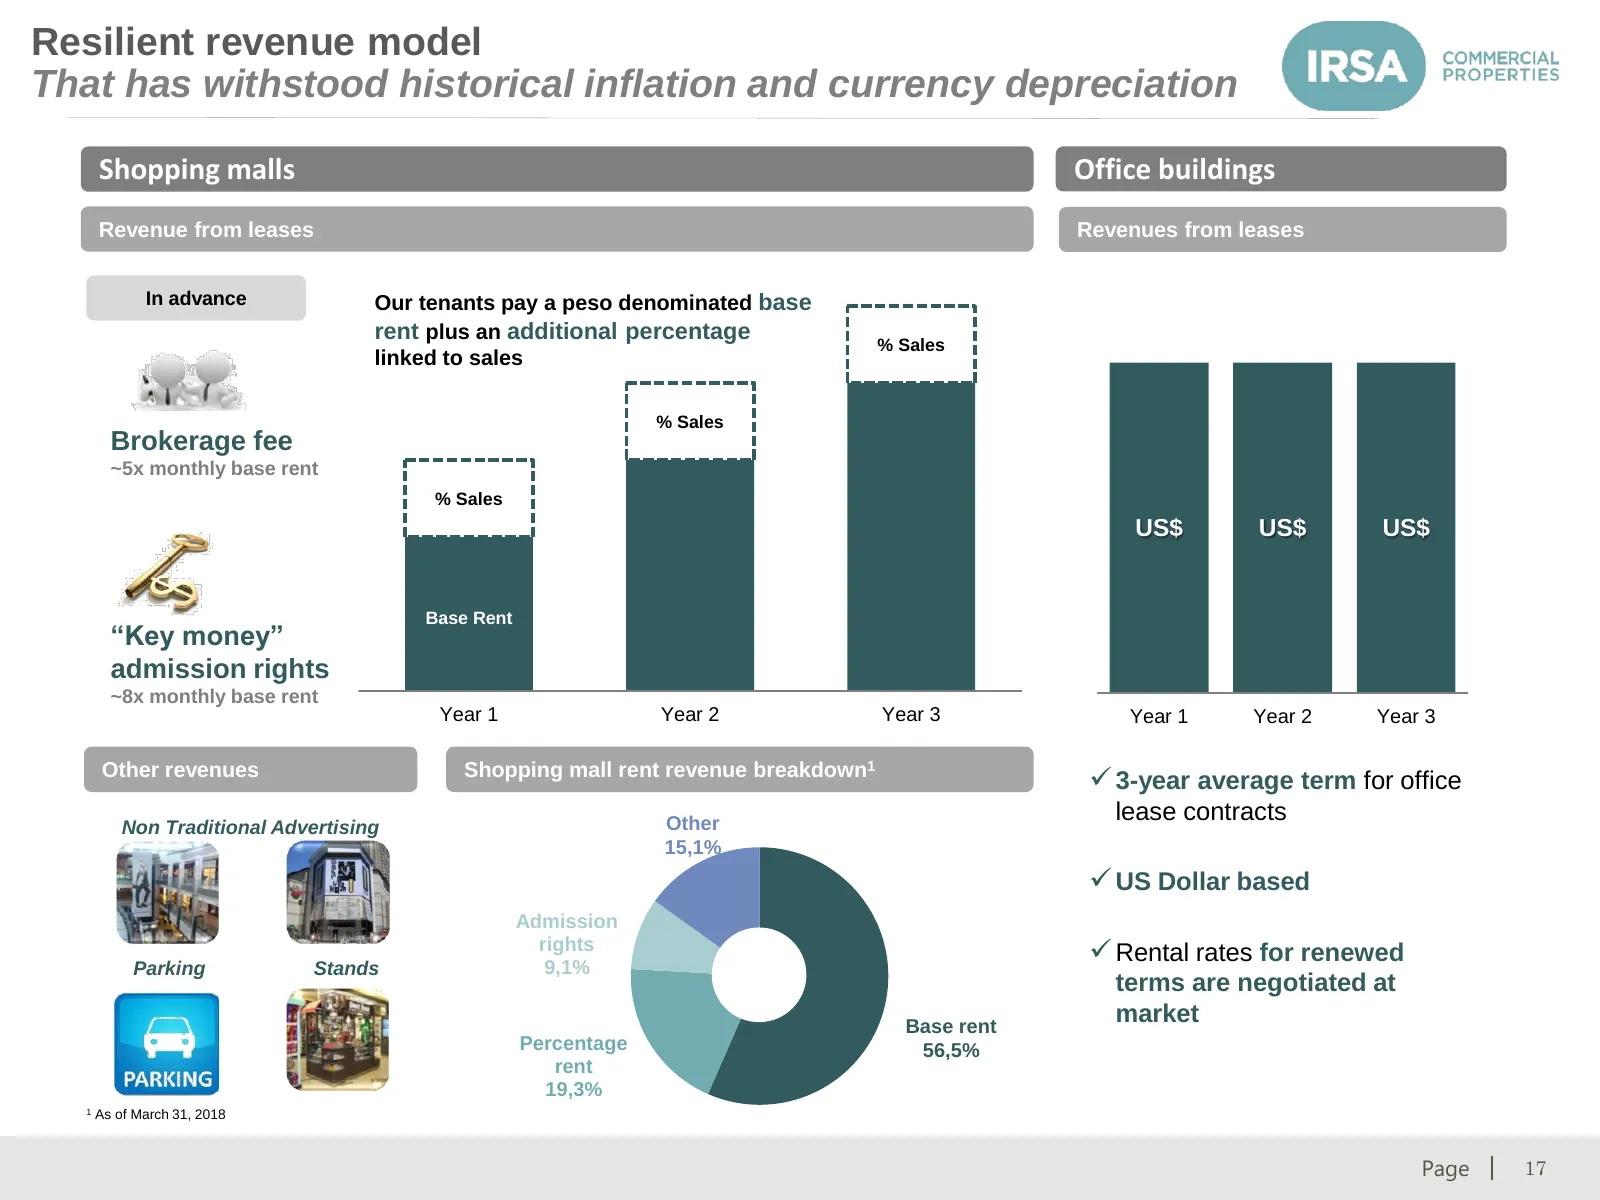
Slide 17: Resilient revenue model
Resilient revenue model That has withstood historical inflation and currency depreciation Shopping malls Office buildings Revenue from leases Revenues from leases In advance Our tenants pay a peso denominated base rent plus an additional percentage % Sales linked to sales % Sales Brokerage fee ~5x m
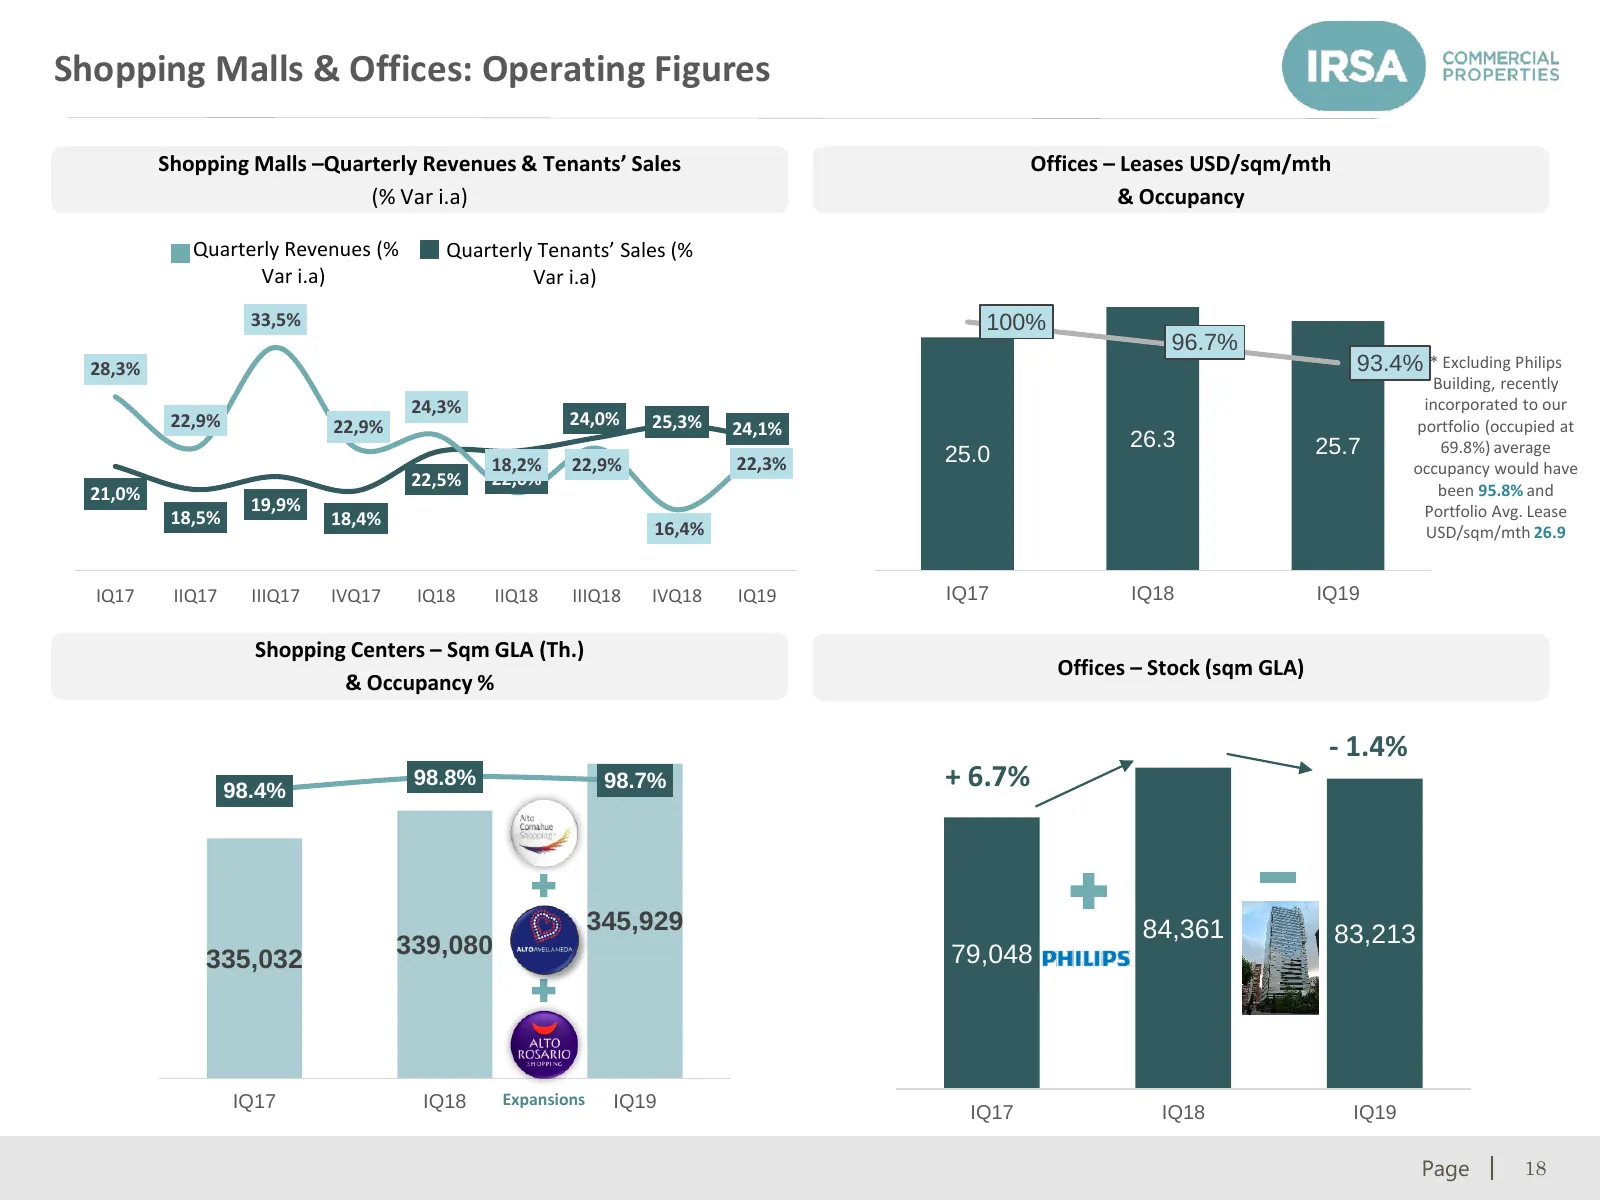
Slide 18: Shopping Malls & Offices: Operating Figures
Shopping Malls & Offices: Operating Figures Shopping Malls –Quarterly Revenues & Tenants’ Sales Offices – Leases USD/sqm/mth (% Var i.a) & Occupancy Quarterly Revenues (% Quarterly Tenants’ Sales (% Var i.a) Var i.a) 33,5% 100% 96.7% 28,3% 93.4% * Excluding Philips Building, recently 24,3% incorpora
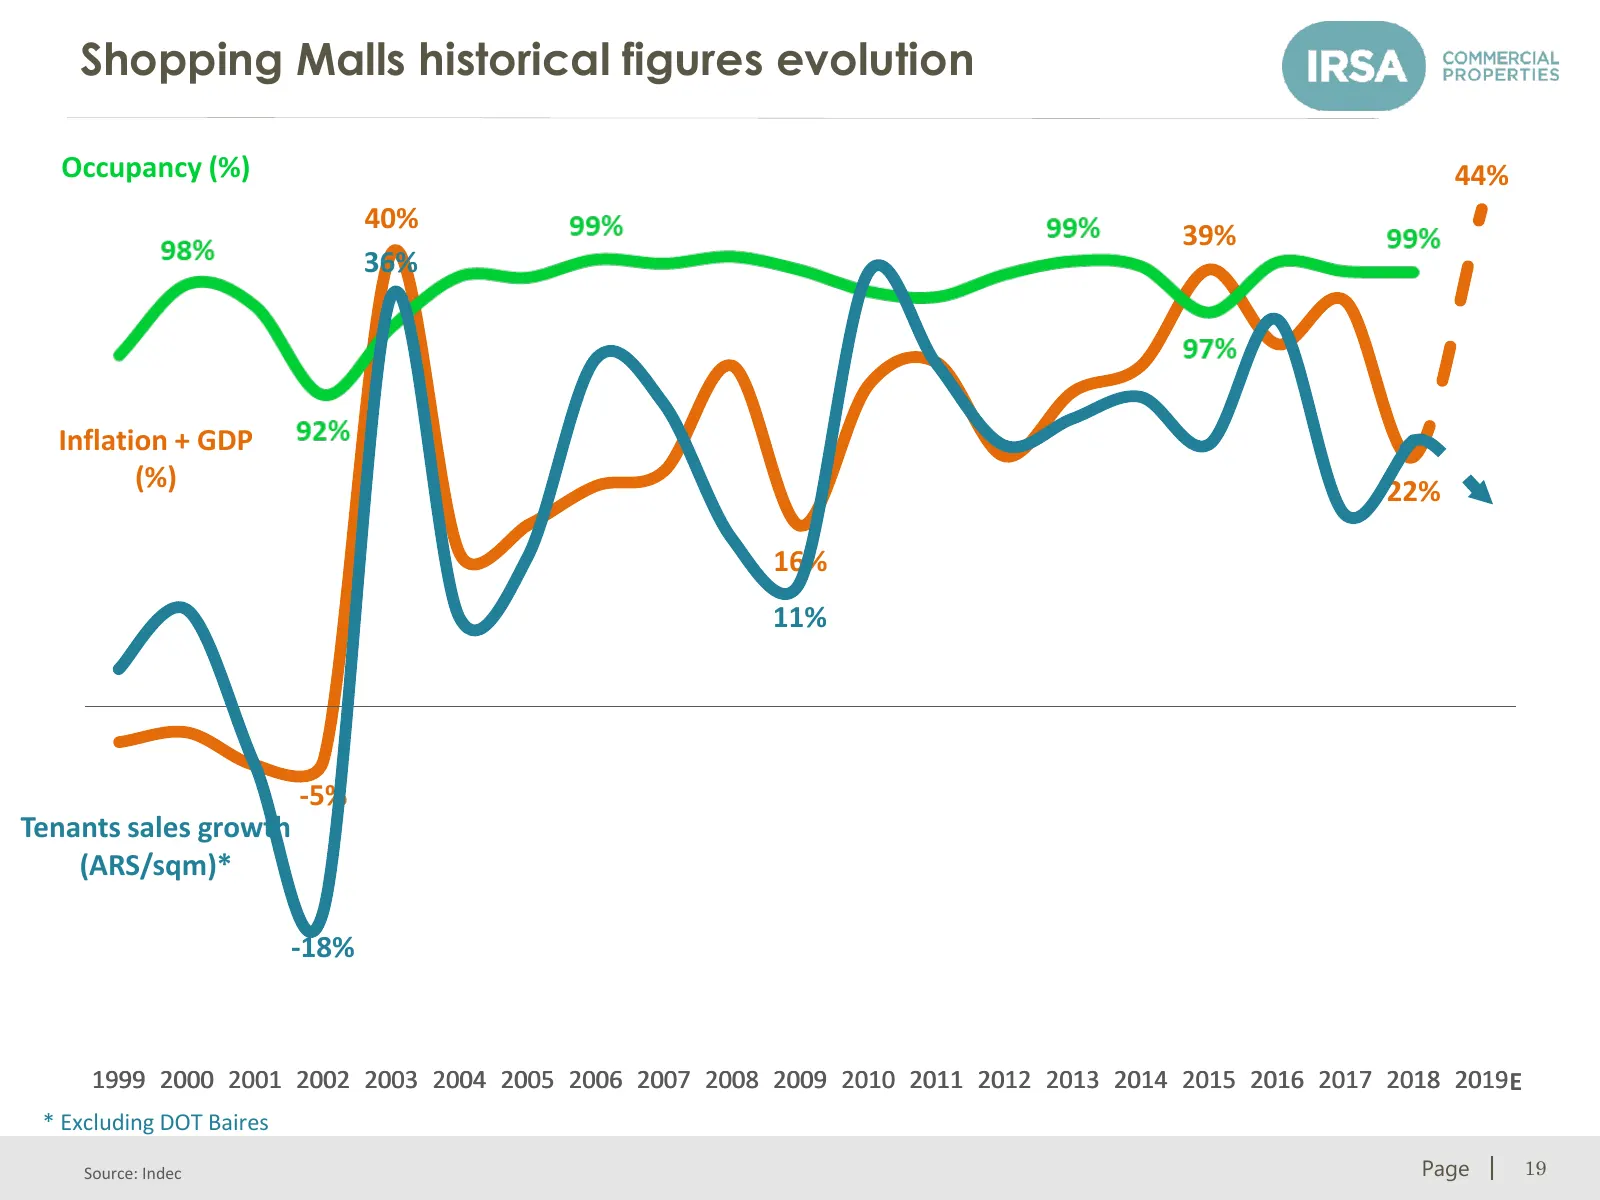
Slide 19: Shopping Malls historical figures evolution
Shopping Malls historical figures evolution Occupancy (%) 44% 40% 39% 36% Inflation + GDP (%) 22% 16% 11% -5% Tenants sales growth (ARS/sqm)* -18% 1999 2000 2001 2002 2003 2004 2005 2006 2007 2008 2009 2010 2011 2012 2013 2014 2015 2016 2017 2018 2019 E * Excluding DOT Baires © 2017 CRESUD. Source:
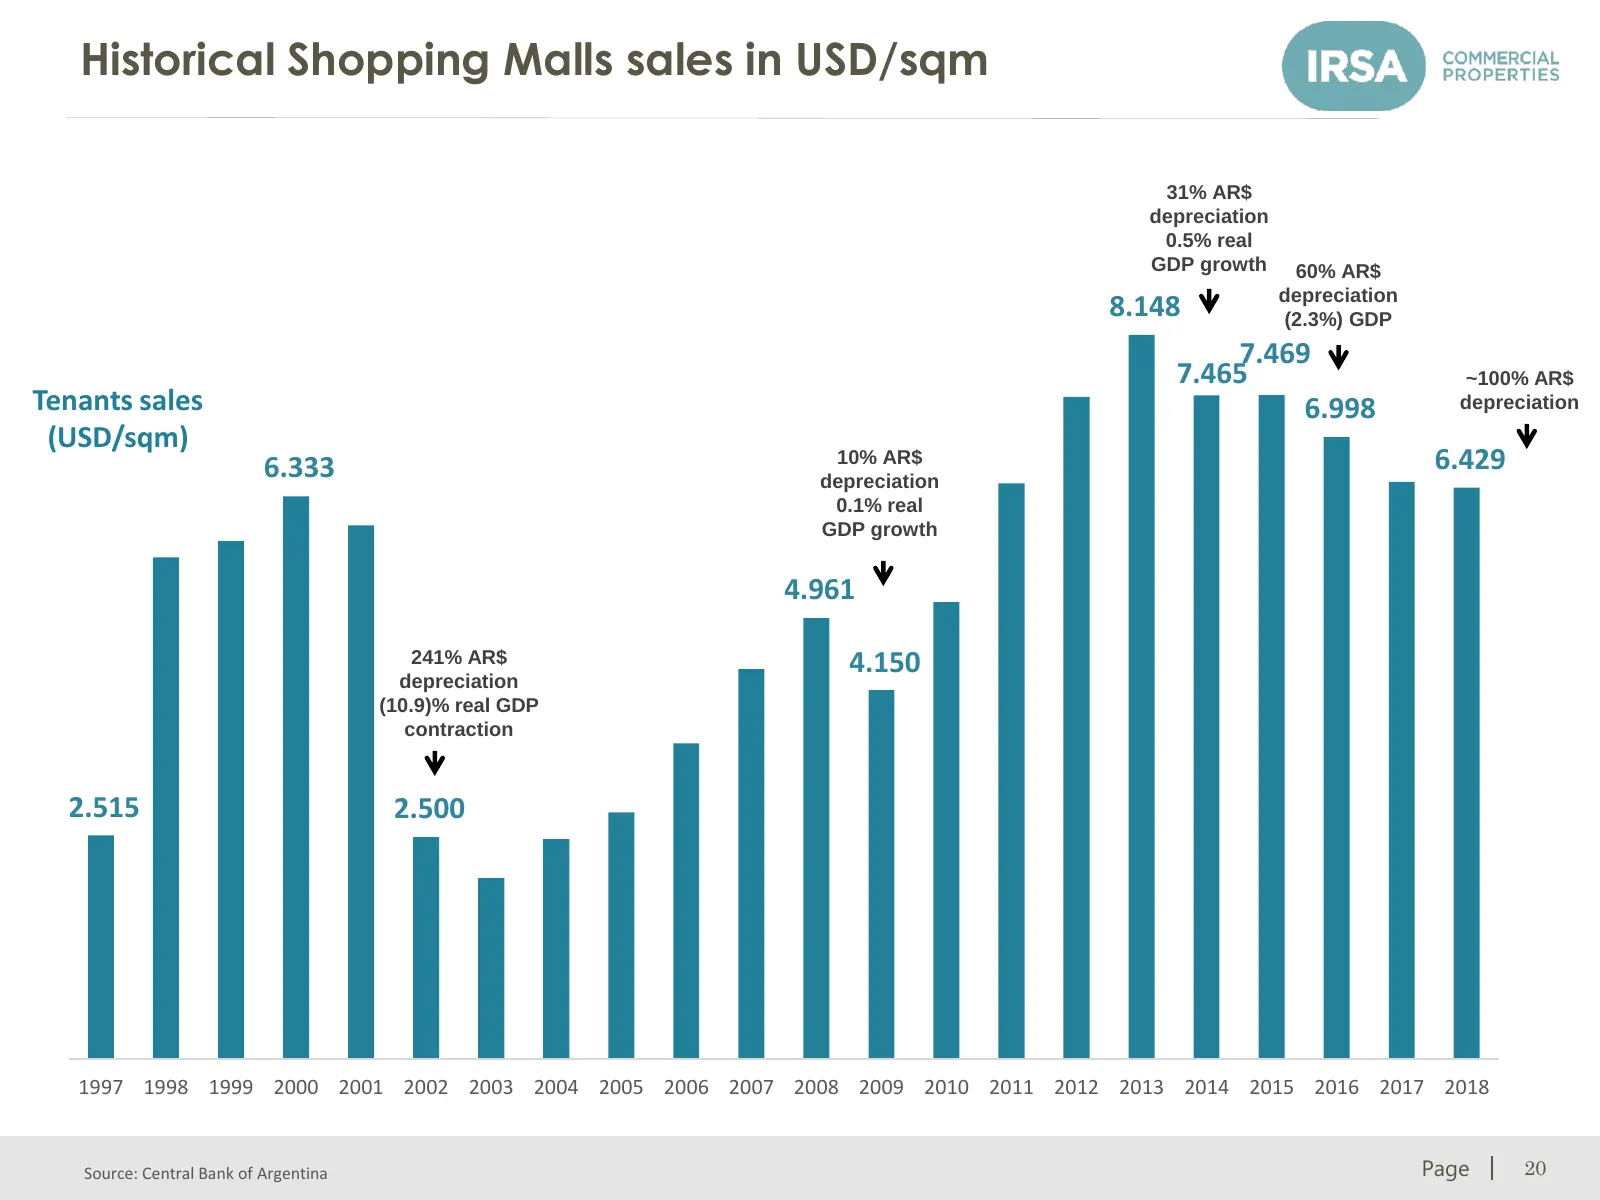
Slide 20: Historical Shopping Malls sales in USD/sqm
Historical Shopping Malls sales in USD/sqm 31% AR$ depreciation 0.5% real GDP growth 60% AR$ depreciation 8.148 (2.3%) GDP 7.469 7.465 ~100% AR$ Tenants sales 6.998 depreciation (USD/sqm) 6.333 10% AR$ 6.429 depreciation 0.1% real GDP growth 4.961 241% AR$ 4.150 depreciation (10.9)% real GDP contrac
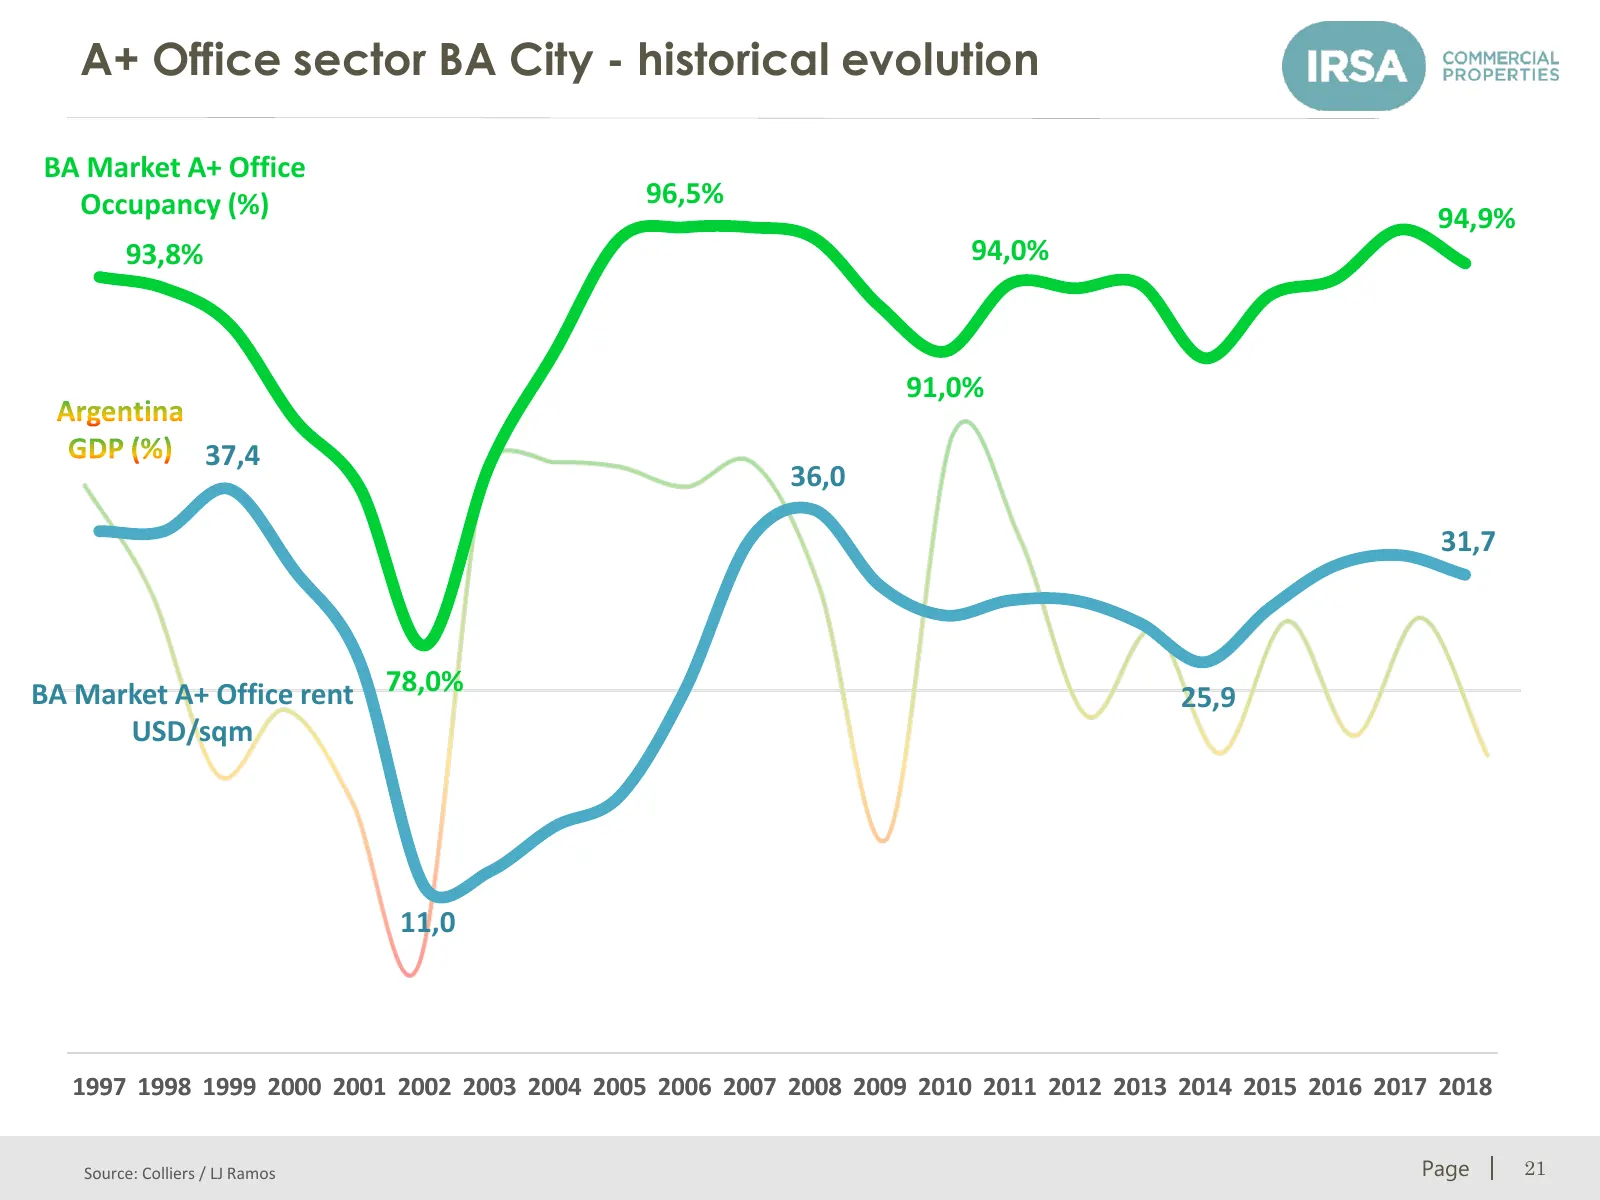
Slide 21: A+ Office sector BA City - historical evolution
A+ Office sector BA City - historical evolution BA Market A+ Office Occupancy (%) 96,5% 94,9% 93,8% 94,0% 91,0% 37,4 36,0 31,7 BA Market A+ Office rent 78,0% 25,9 USD/sqm 11,0 1997 1998 1999 2000 2001 2002 2003 2004 2005 2006 2007 2008 2009 2010 2011 2012 2013 2014 2015 2016 2017 2018 © 2017 CRESUD.
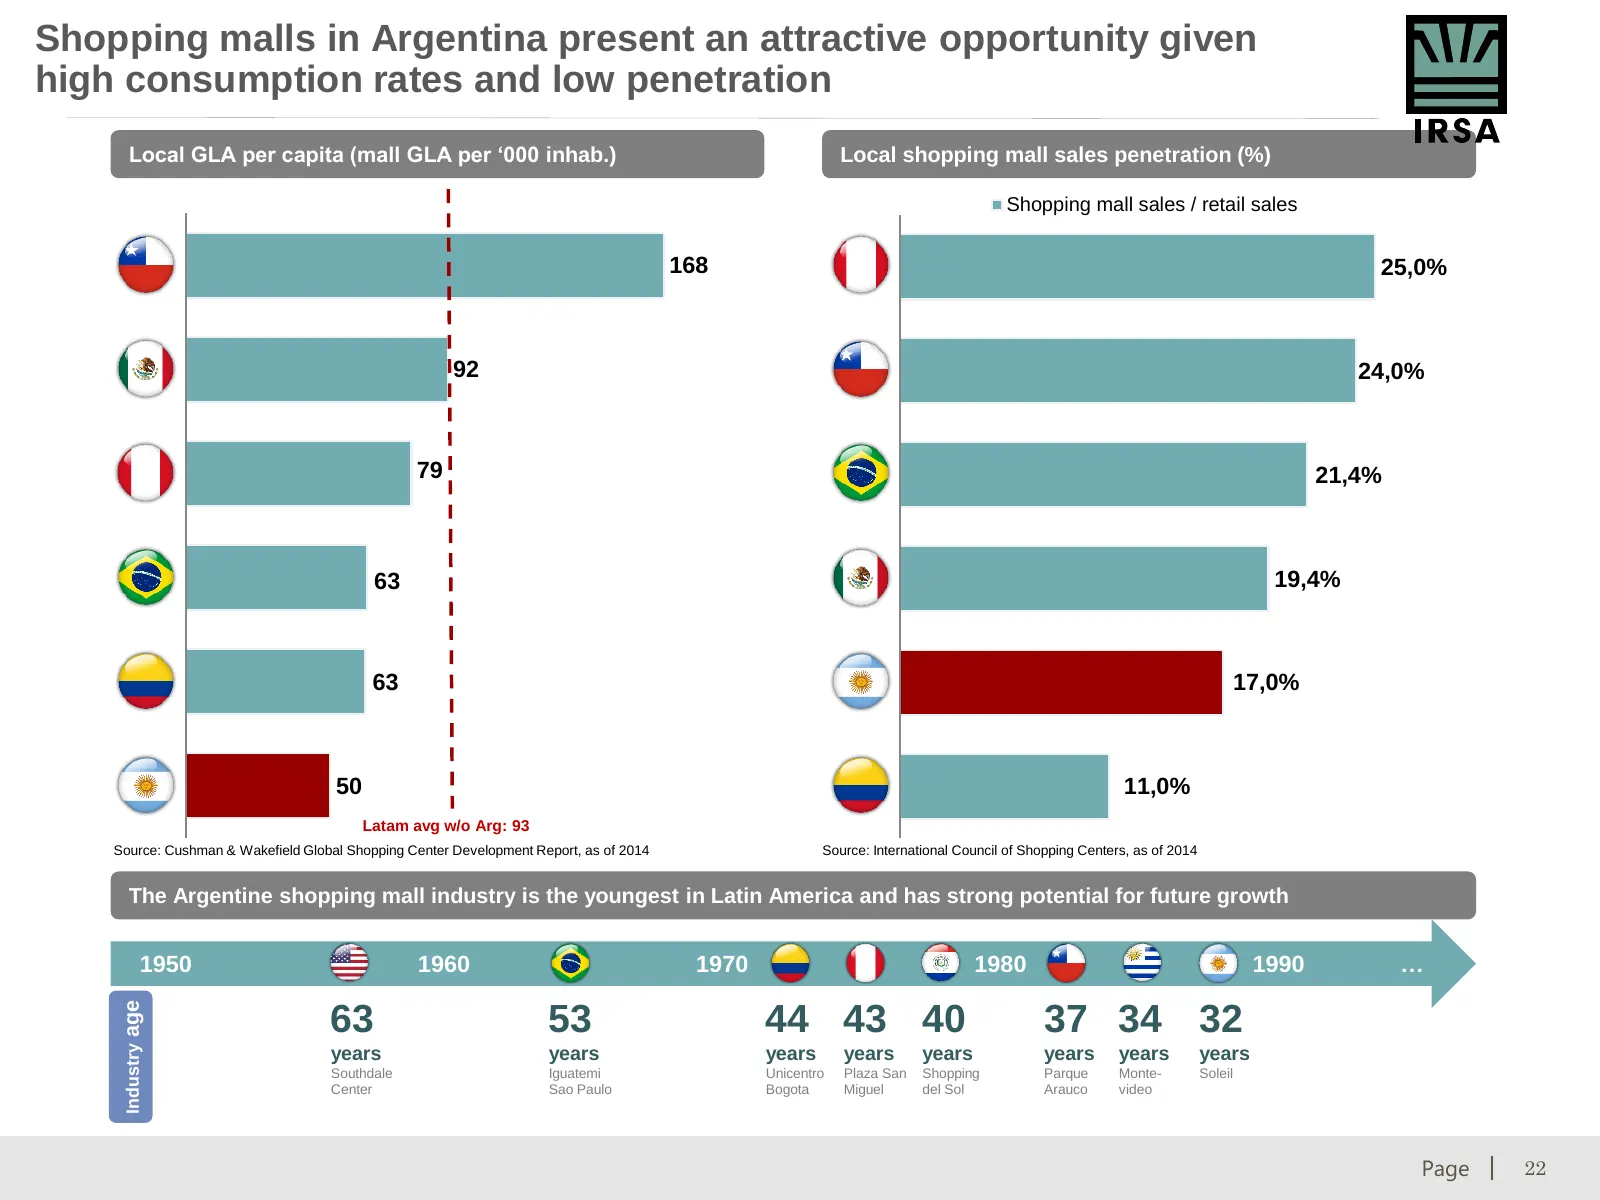
Slide 22: Shopping malls in Argentina present an attractive opportunity
Shopping malls in Argentina present an attractive opportunity given high consumption rates and low penetration Local GLA per capita (mall GLA per ‘000 inhab.) Local shopping mall sales penetration (%) Shopping mall sales / retail sales 168 25,0% 92 24,0% 79 21,4% 63 19,4% 63 17,0% 50 11,0% Latam avg
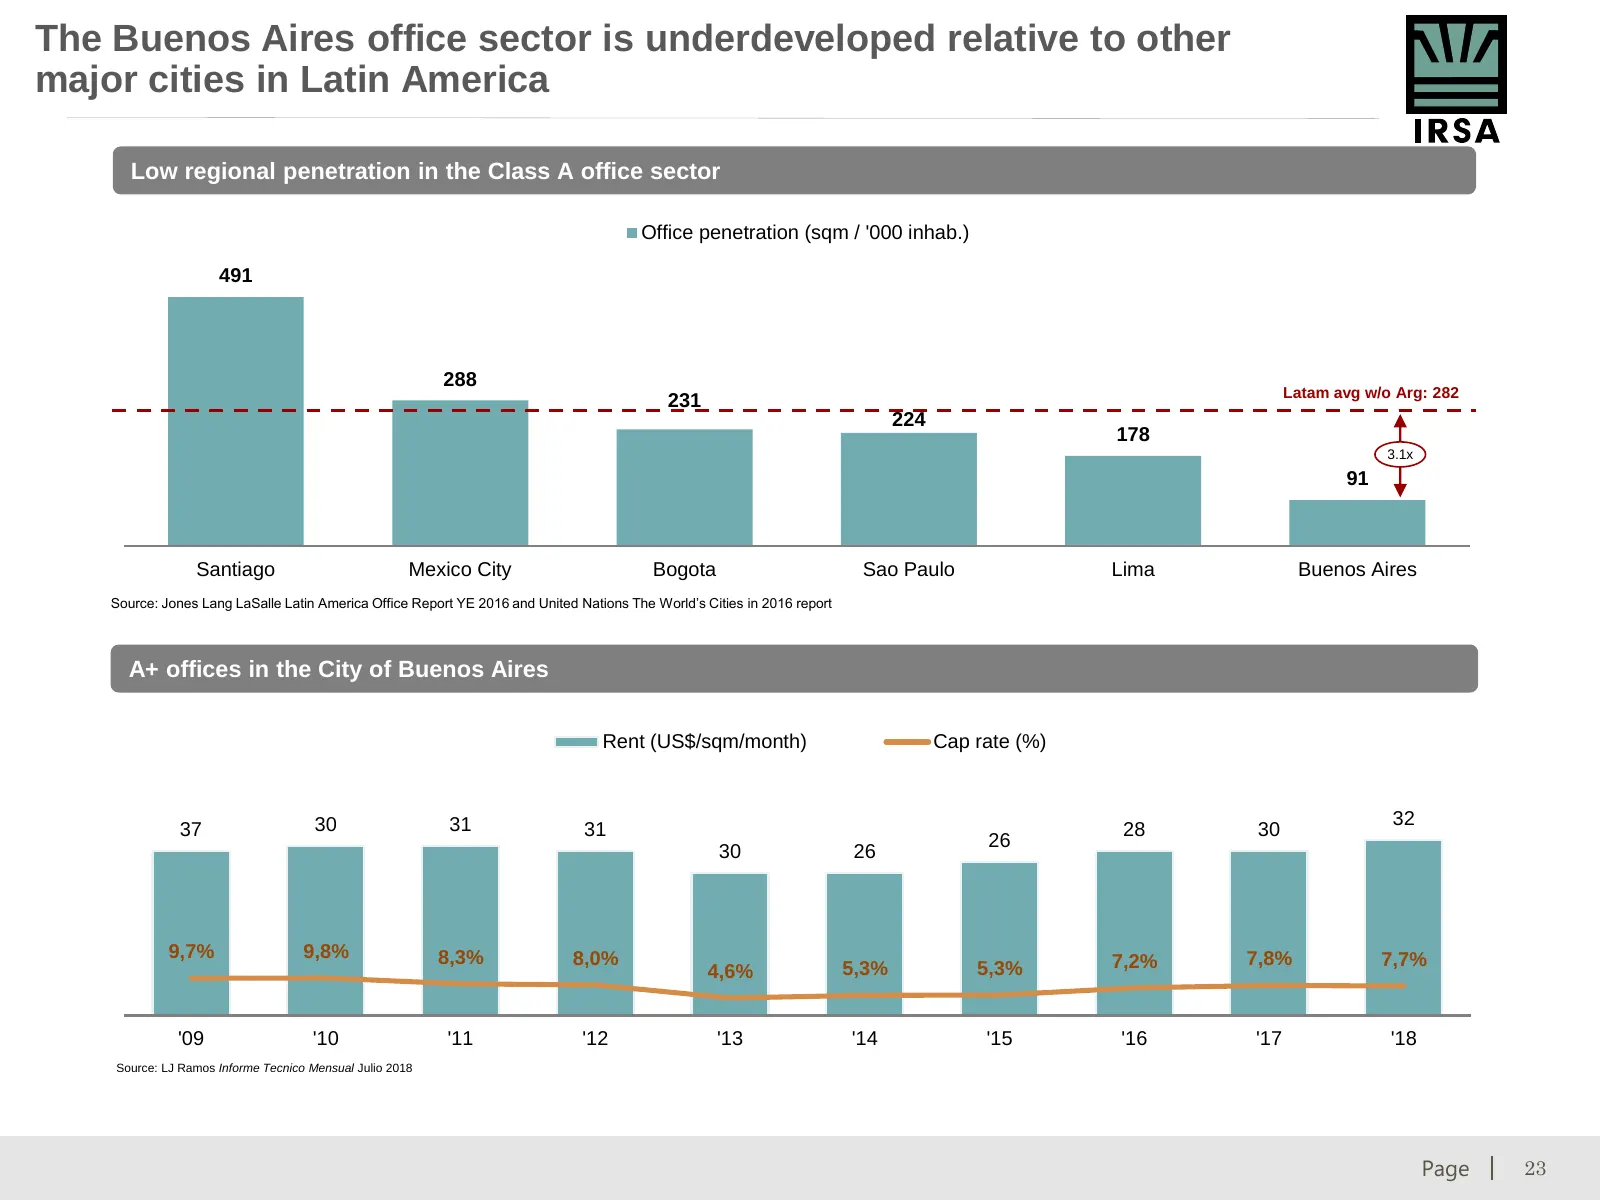
Slide 23: The Buenos Aires office sector is underdeveloped
The Buenos Aires office sector is underdeveloped relative to other major cities in Latin America Low regional penetration in the Class A office sector Office penetration (sqm / '000 inhab.) 491 288 Latam avg w/o Arg: 282 231 224 178 3.1x 91 Santiago Mexico City Bogota Sao Paulo Lima Buenos Aires Sou
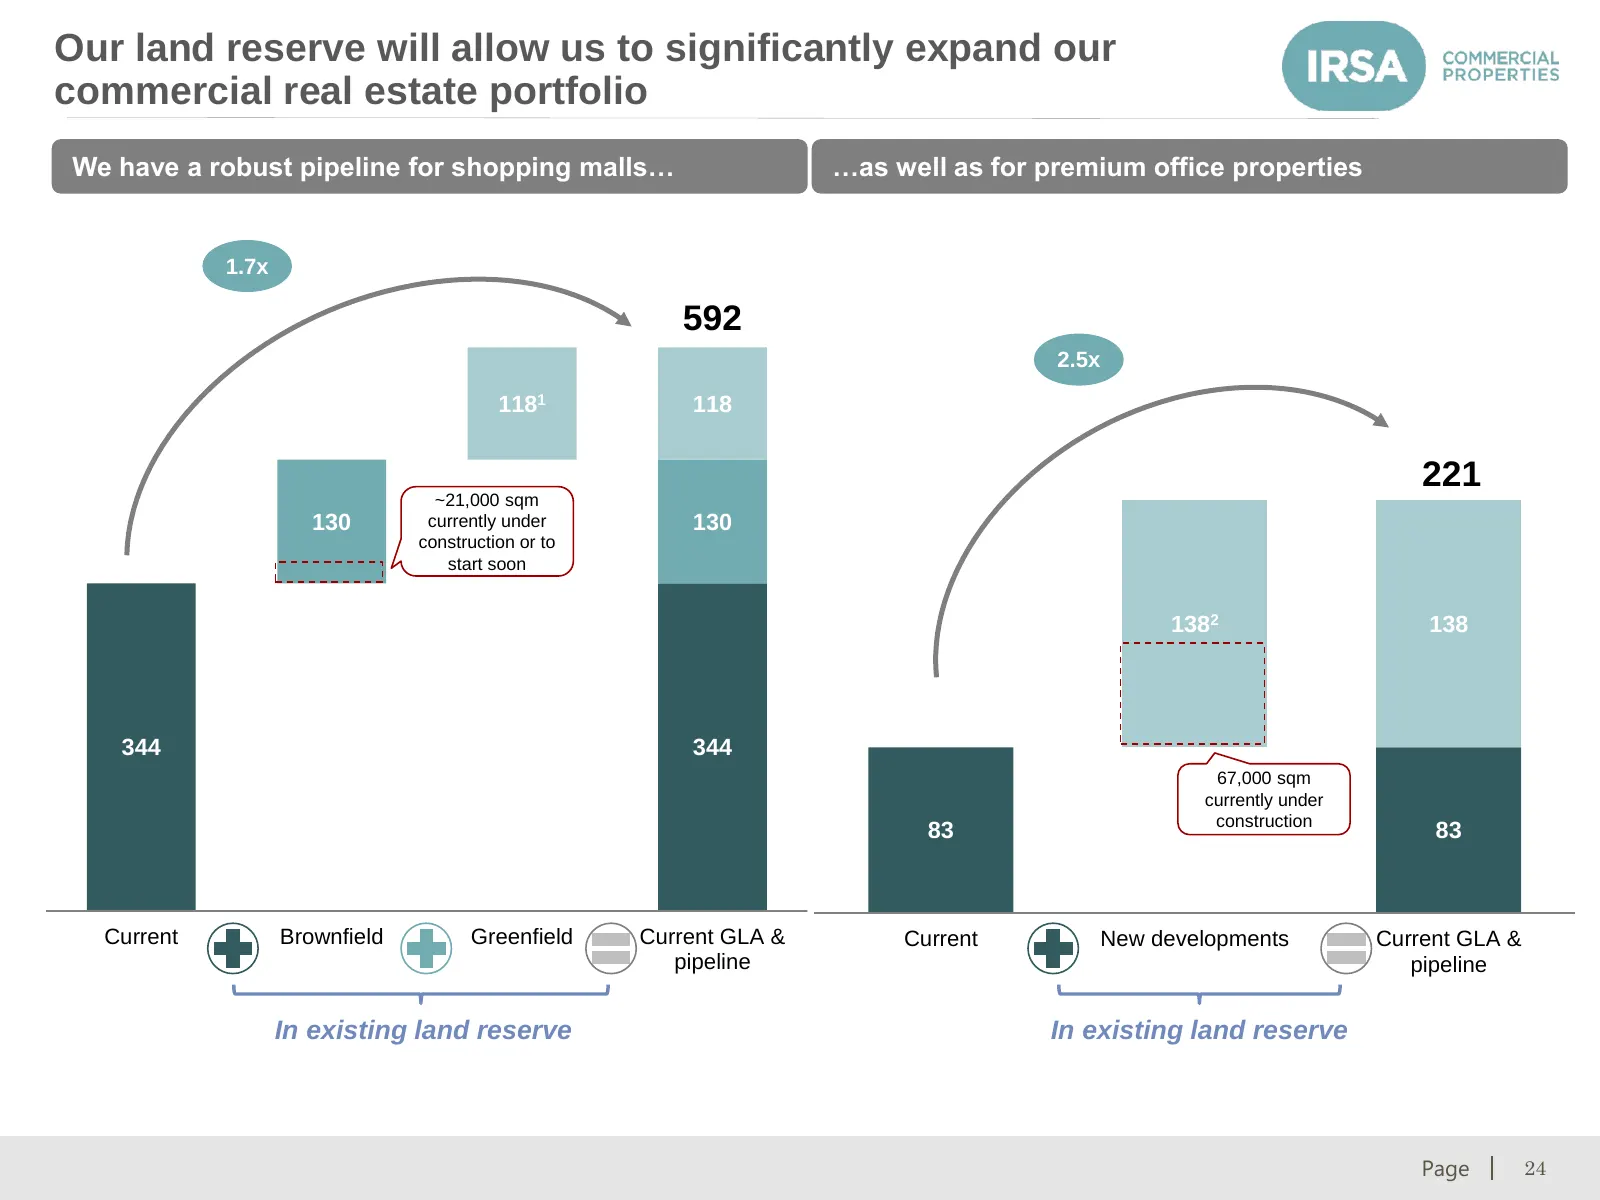
Slide 24: Our land reserve will allow us to expand our portfolio
Our land reserve will allow us to significantly expand our commercial real estate portfolio We have a robust pipeline for shopping malls… …as well as for premium office properties 1.7x 592 2.5x 1181 118 221 ~21,000 sqm 130 130 currently under 130 construction or to start soon 1382 138 344 344 67,000
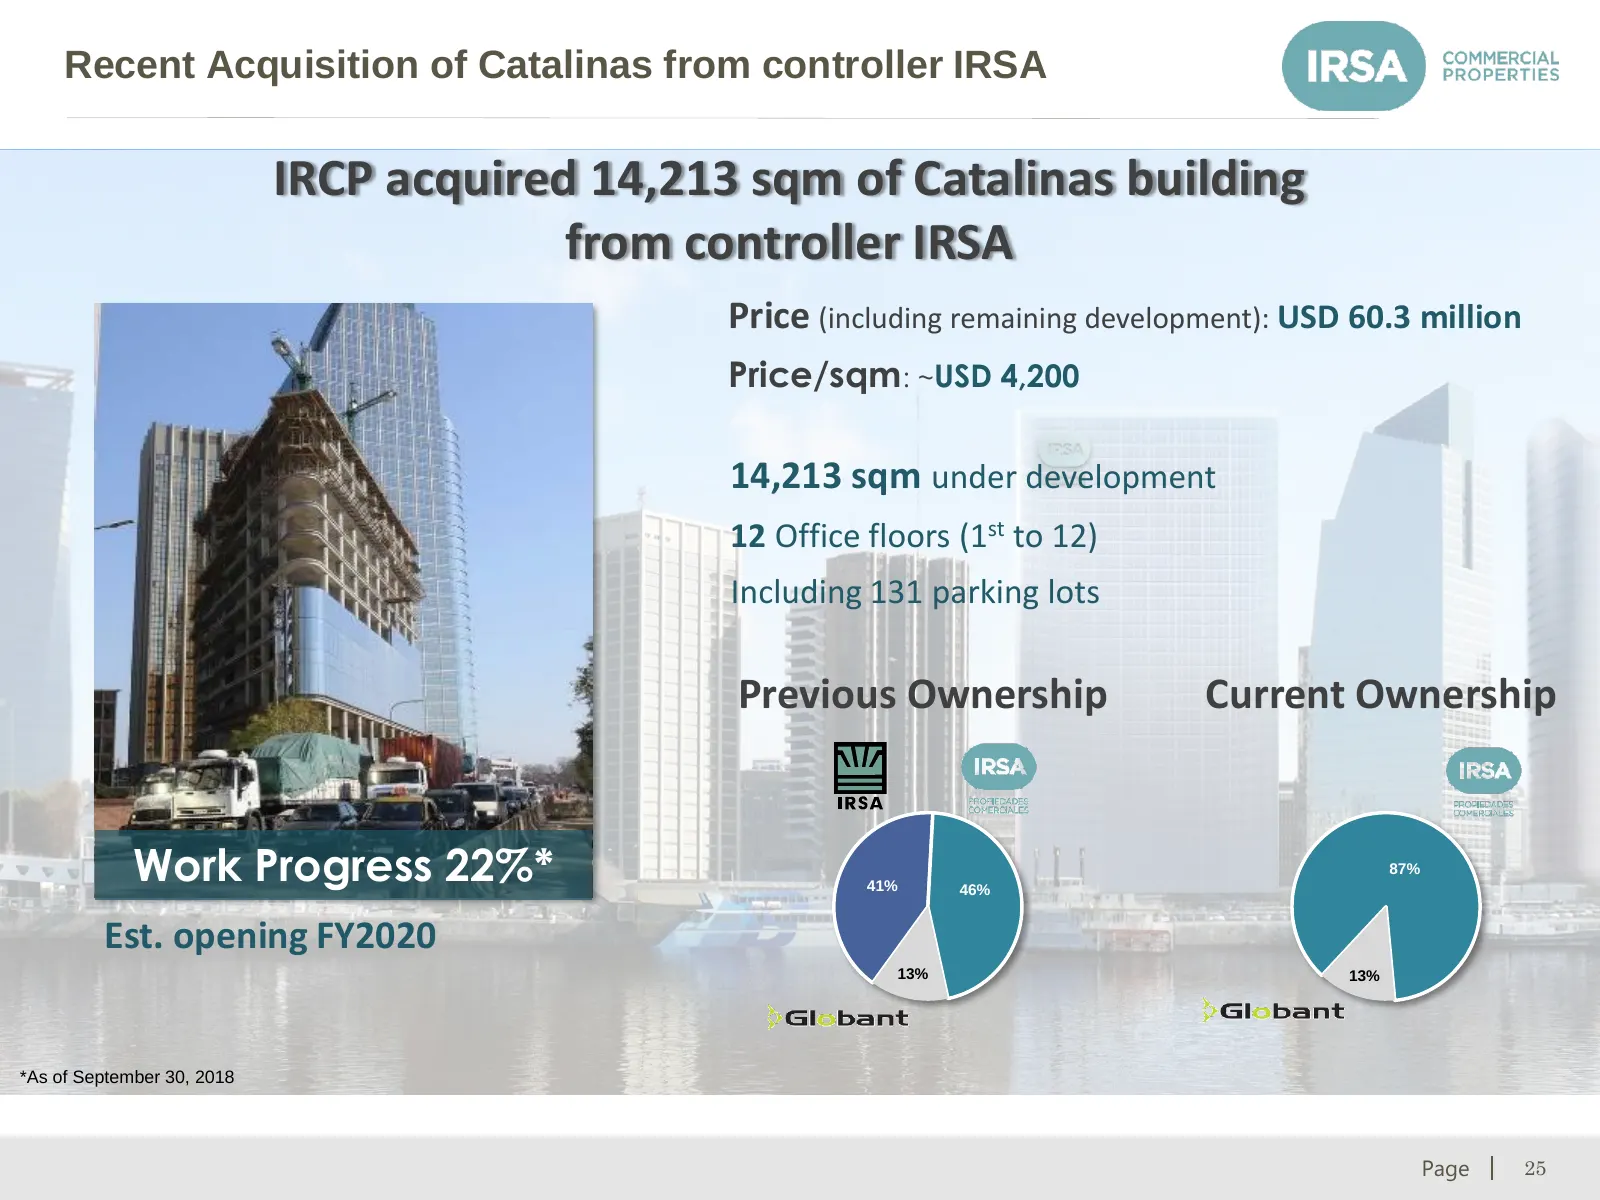
Slide 25: Recent Acquisition of Catalinas from controller IRSA
Recent Acquisition of Catalinas from controller IRSA IRCP acquired 14,213 sqm of Catalinas building from controller IRSA Price (including remaining development): USD 60.3 million Price/sqm: ~USD 4,200 14,213 sqm under development 12 Office floors (1st to 12) Including 131 parking lots Previous Owner
Slide 26: Our current projects under development
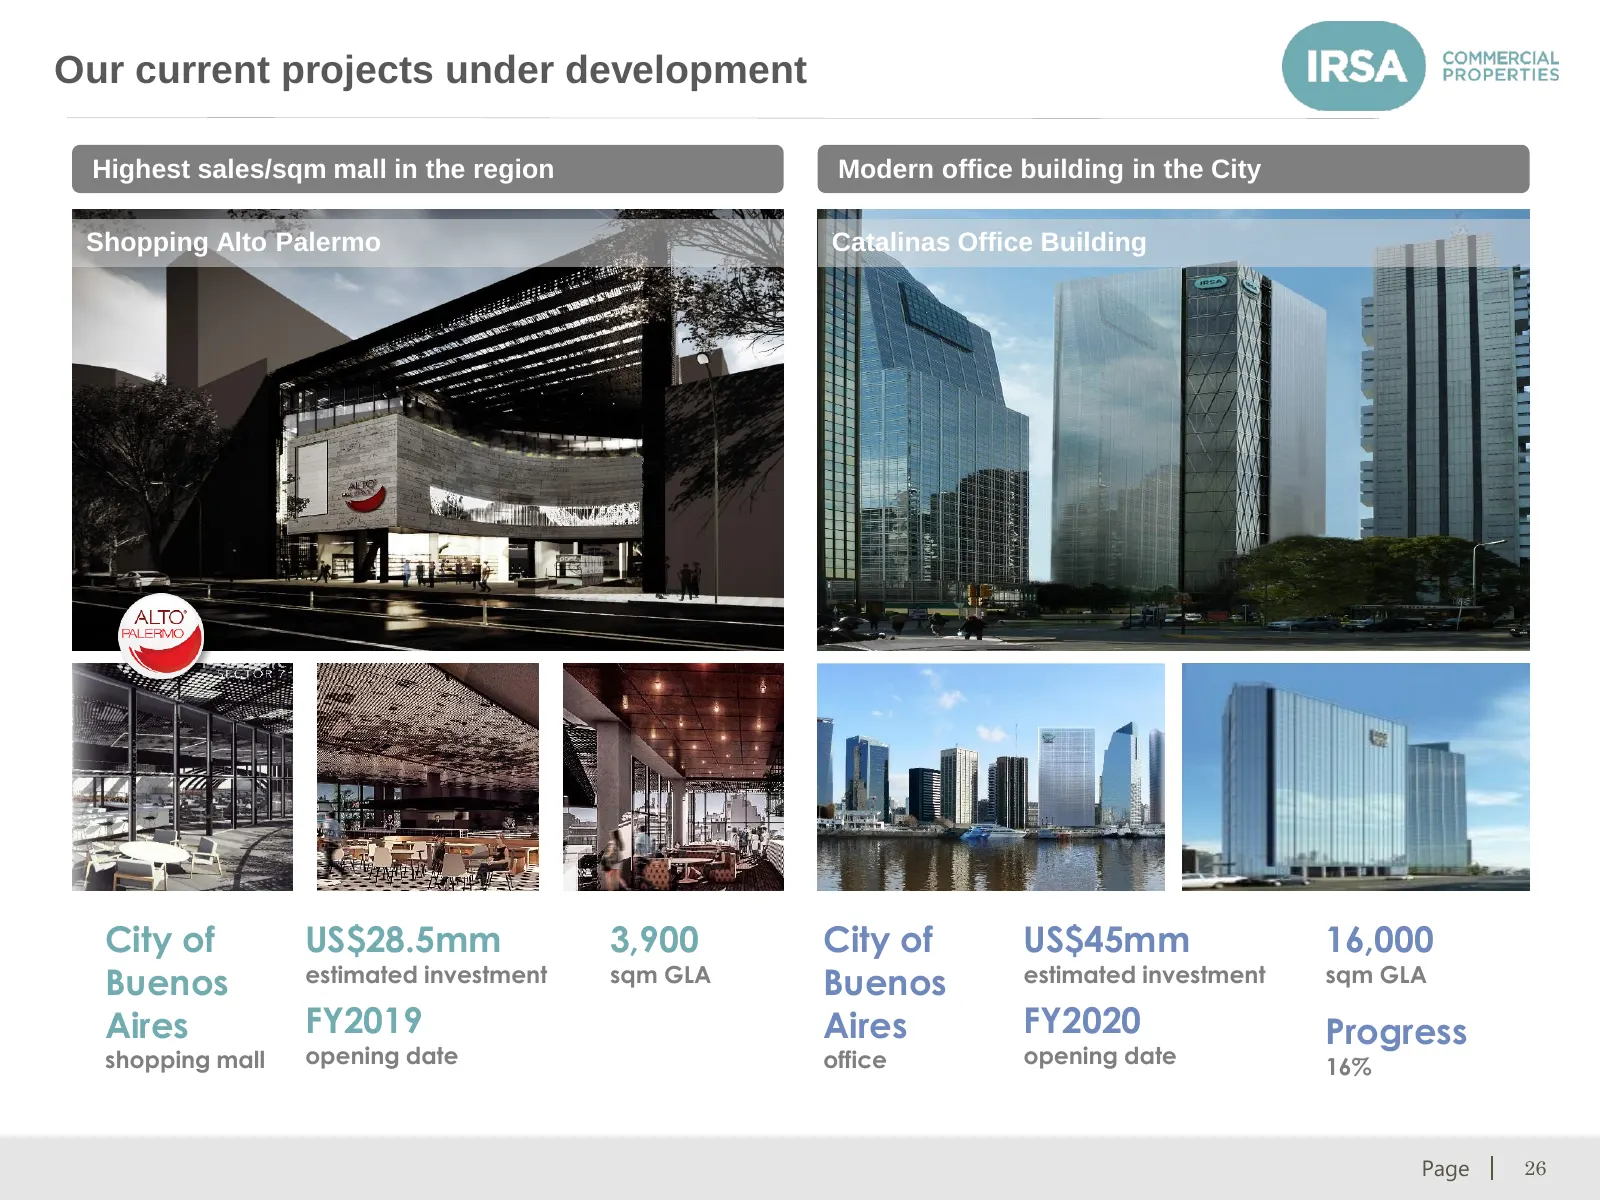
Our current projects under development Highest sales/sqm mall in the region Modern office building in the City Shopping Alto Palermo Catalinas Office Building City of US$28.5mm 3,900 City of US$45mm 16,000 Buenos estimated investment sqm GLA Buenos estimated investment sqm GLA Aires FY2019 Aires FY2
Slide 27: Polo Dot Full Project
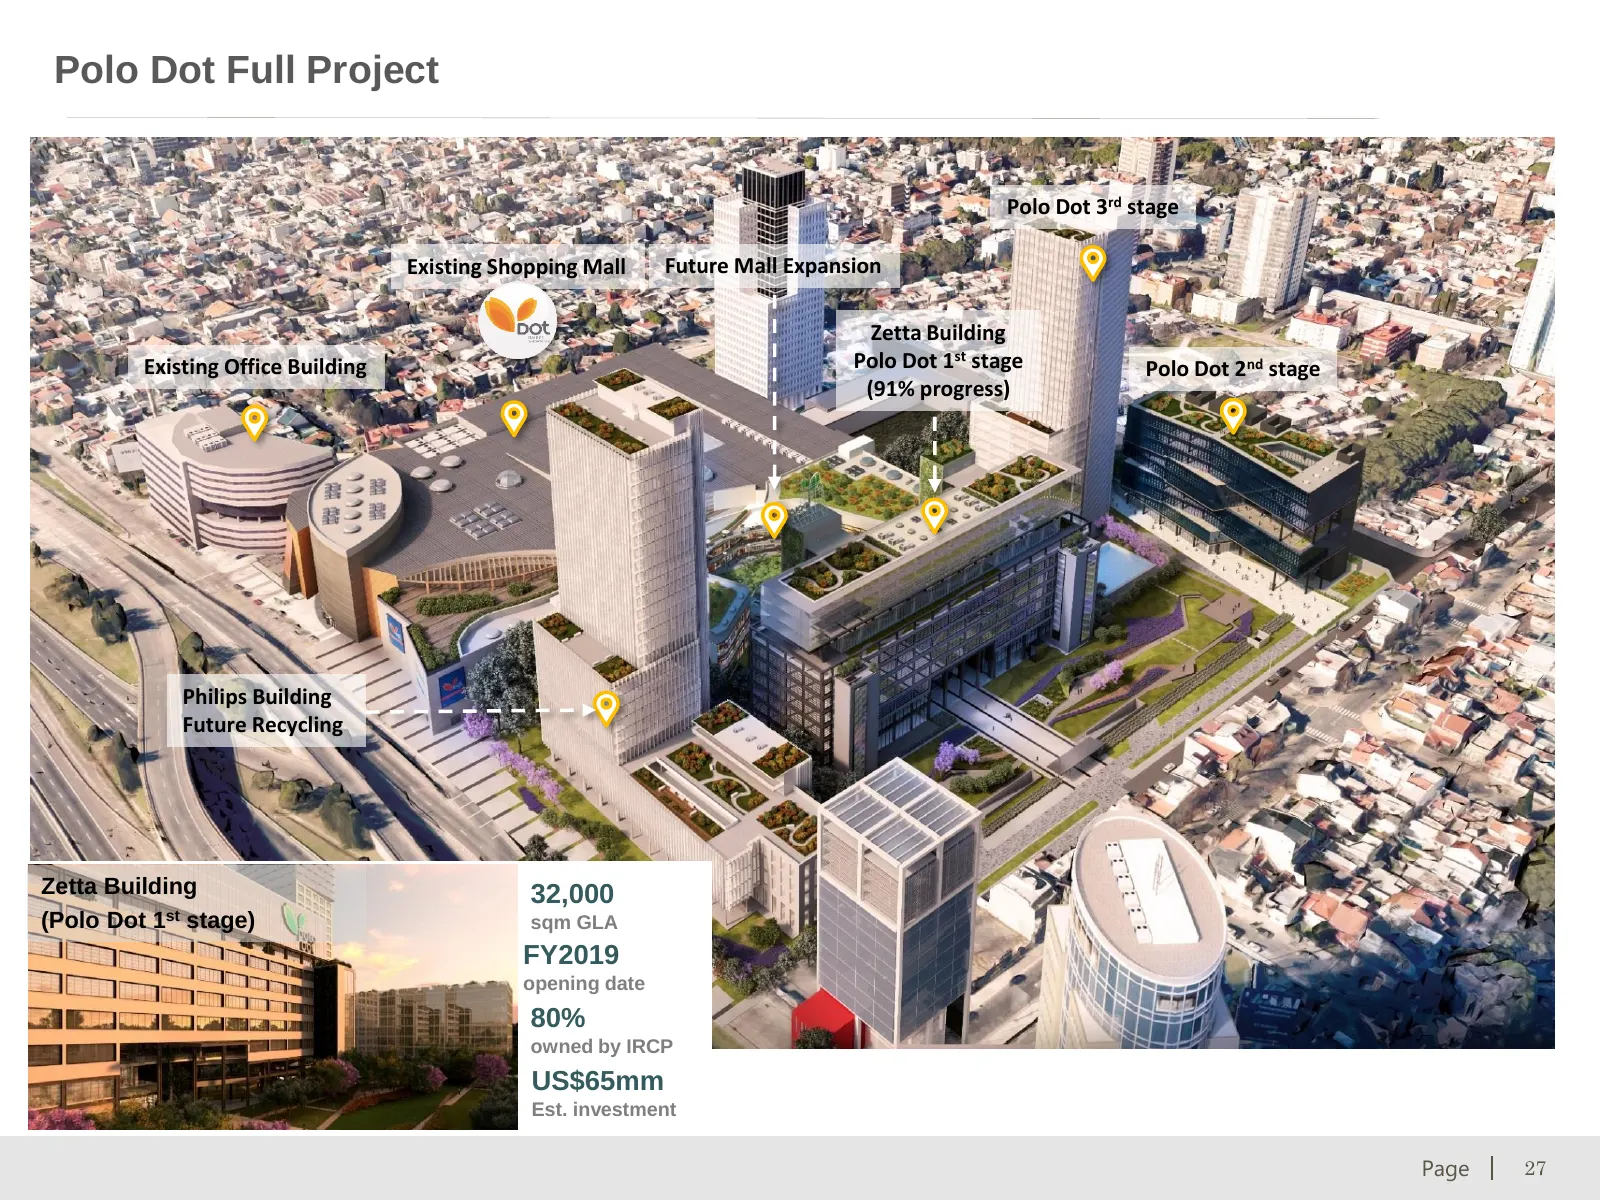
Polo Dot Full Project Polo Dot 3rd stage Existing Shopping Mall Future Mall Expansion Zetta Building Existing Office Building Polo Dot 1st stage Polo Dot 2nd stage (91% progress) Philips Building Future Recycling Zetta Building 32,000 (Polo Dot 1st stage) sqm GLA FY2019 opening date 80% owned by IRC
Slide 28: Recent acquisition: La Plata Mixed-use Project
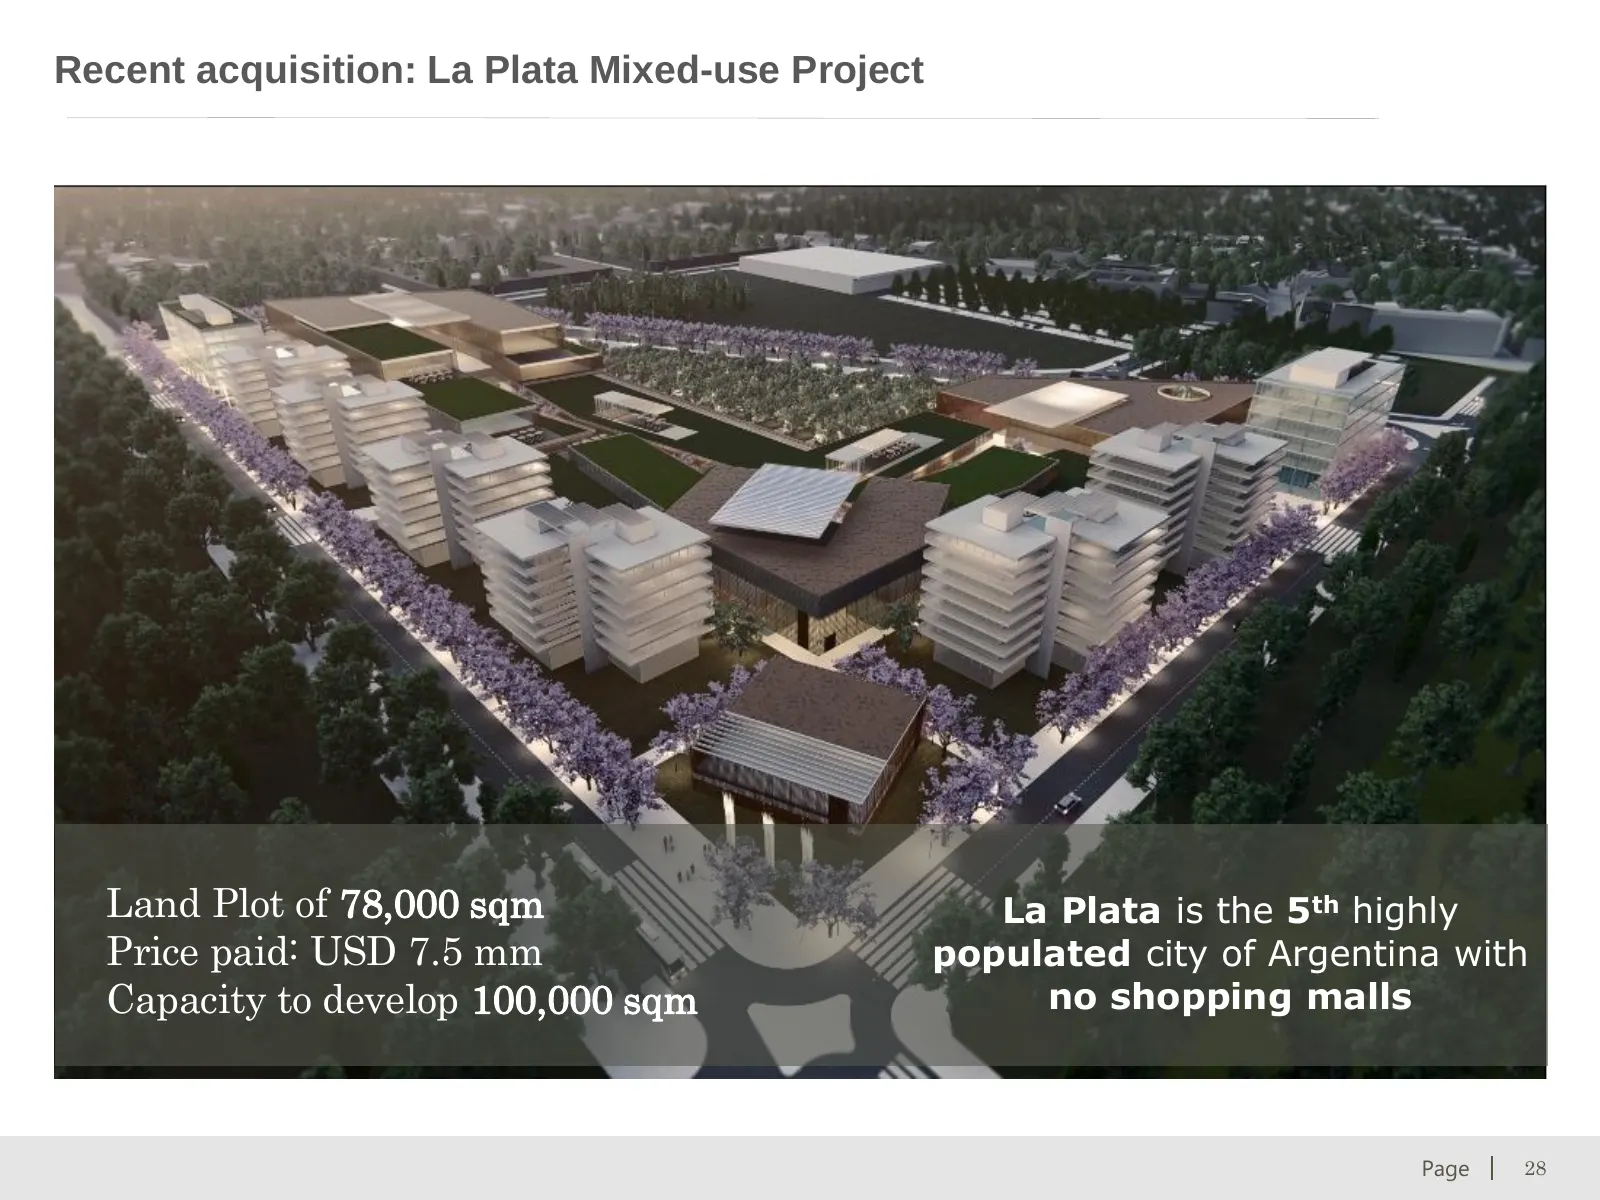
Recent acquisition: La Plata Mixed-use Project Land Plot of 78,000 sqm La Plata is the 5th highly Price paid: USD 7.5 mm populated city of Argentina with Capacity to develop 100,000 sqm no shopping malls © 2017 CRESUD. All rights reserved. Page 28
Slide 29: Recent acquisition - Maltería Hudson property
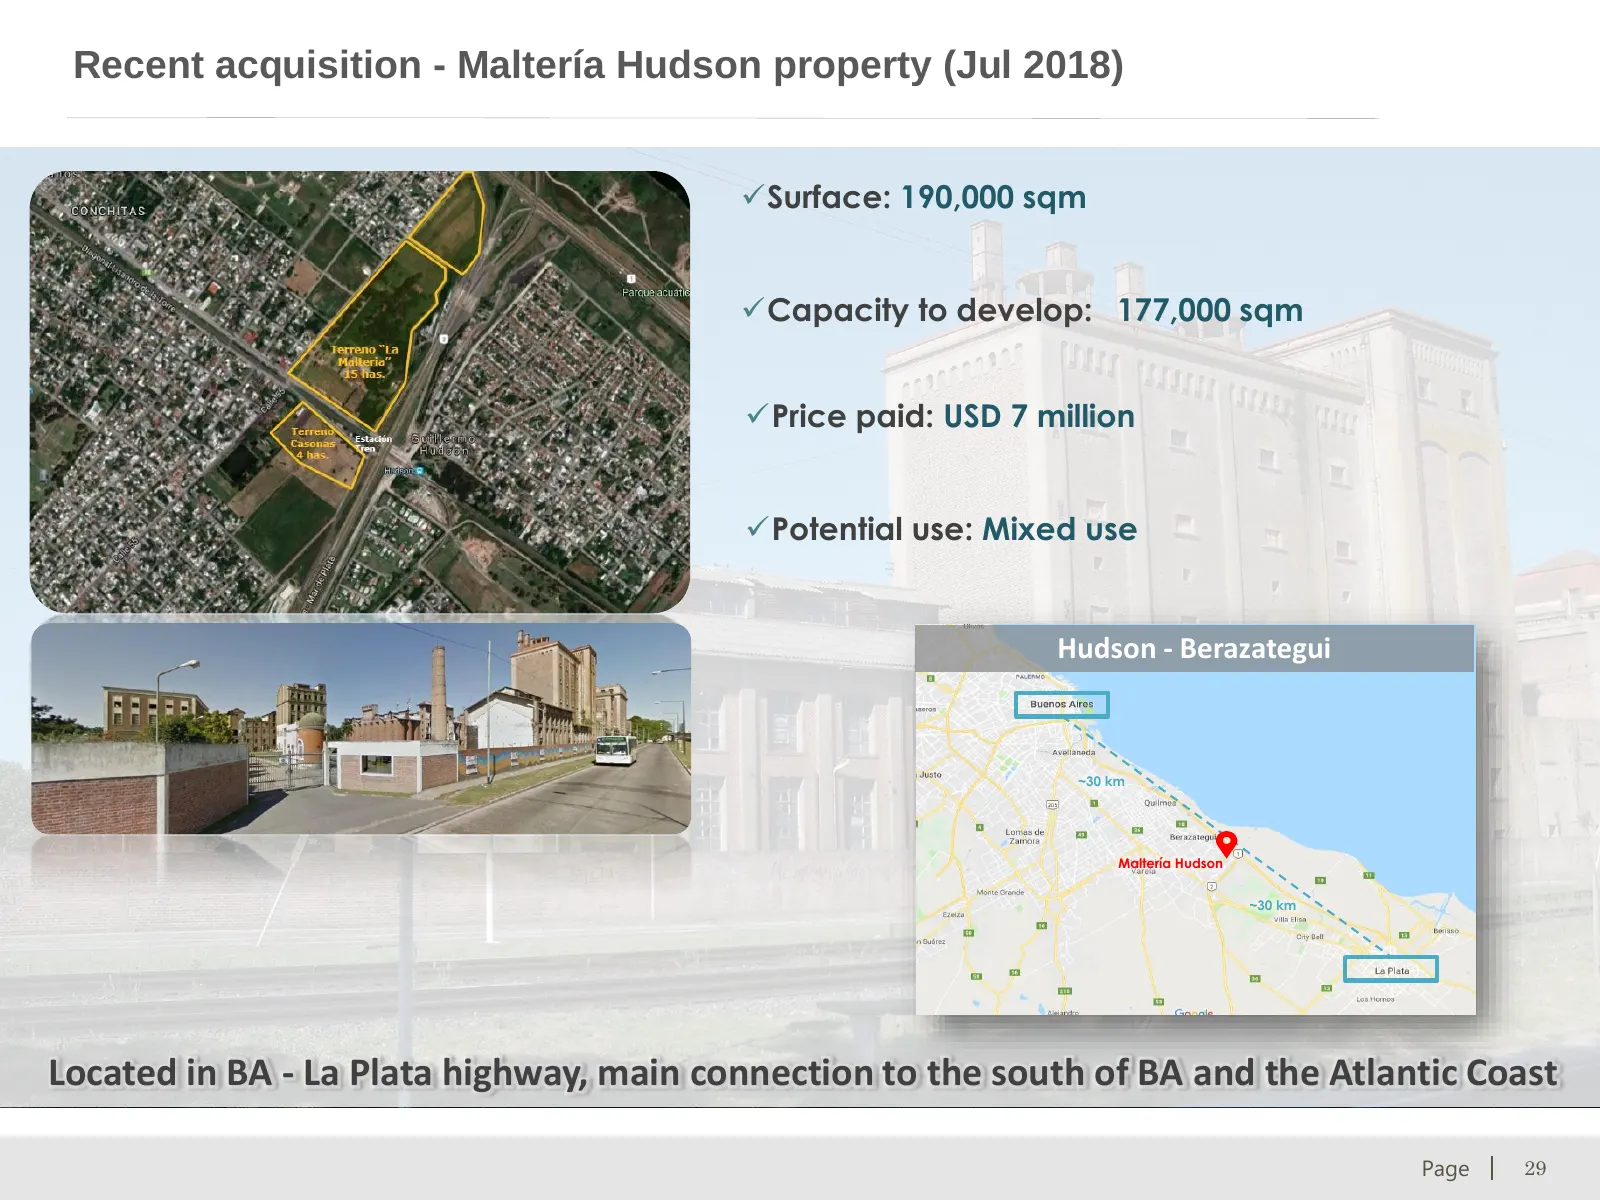
Recent acquisition - Maltería Hudson property (Jul 2018) Surface: 190,000 sqm Capacity to develop: 177,000 sqm Price paid: USD 7 million Potential use: Mixed use Hudson - Berazategui ~30 km Maltería Hudson ~30 km Located in BA - La Plata highway, main connection to the south of BA and the Atlant
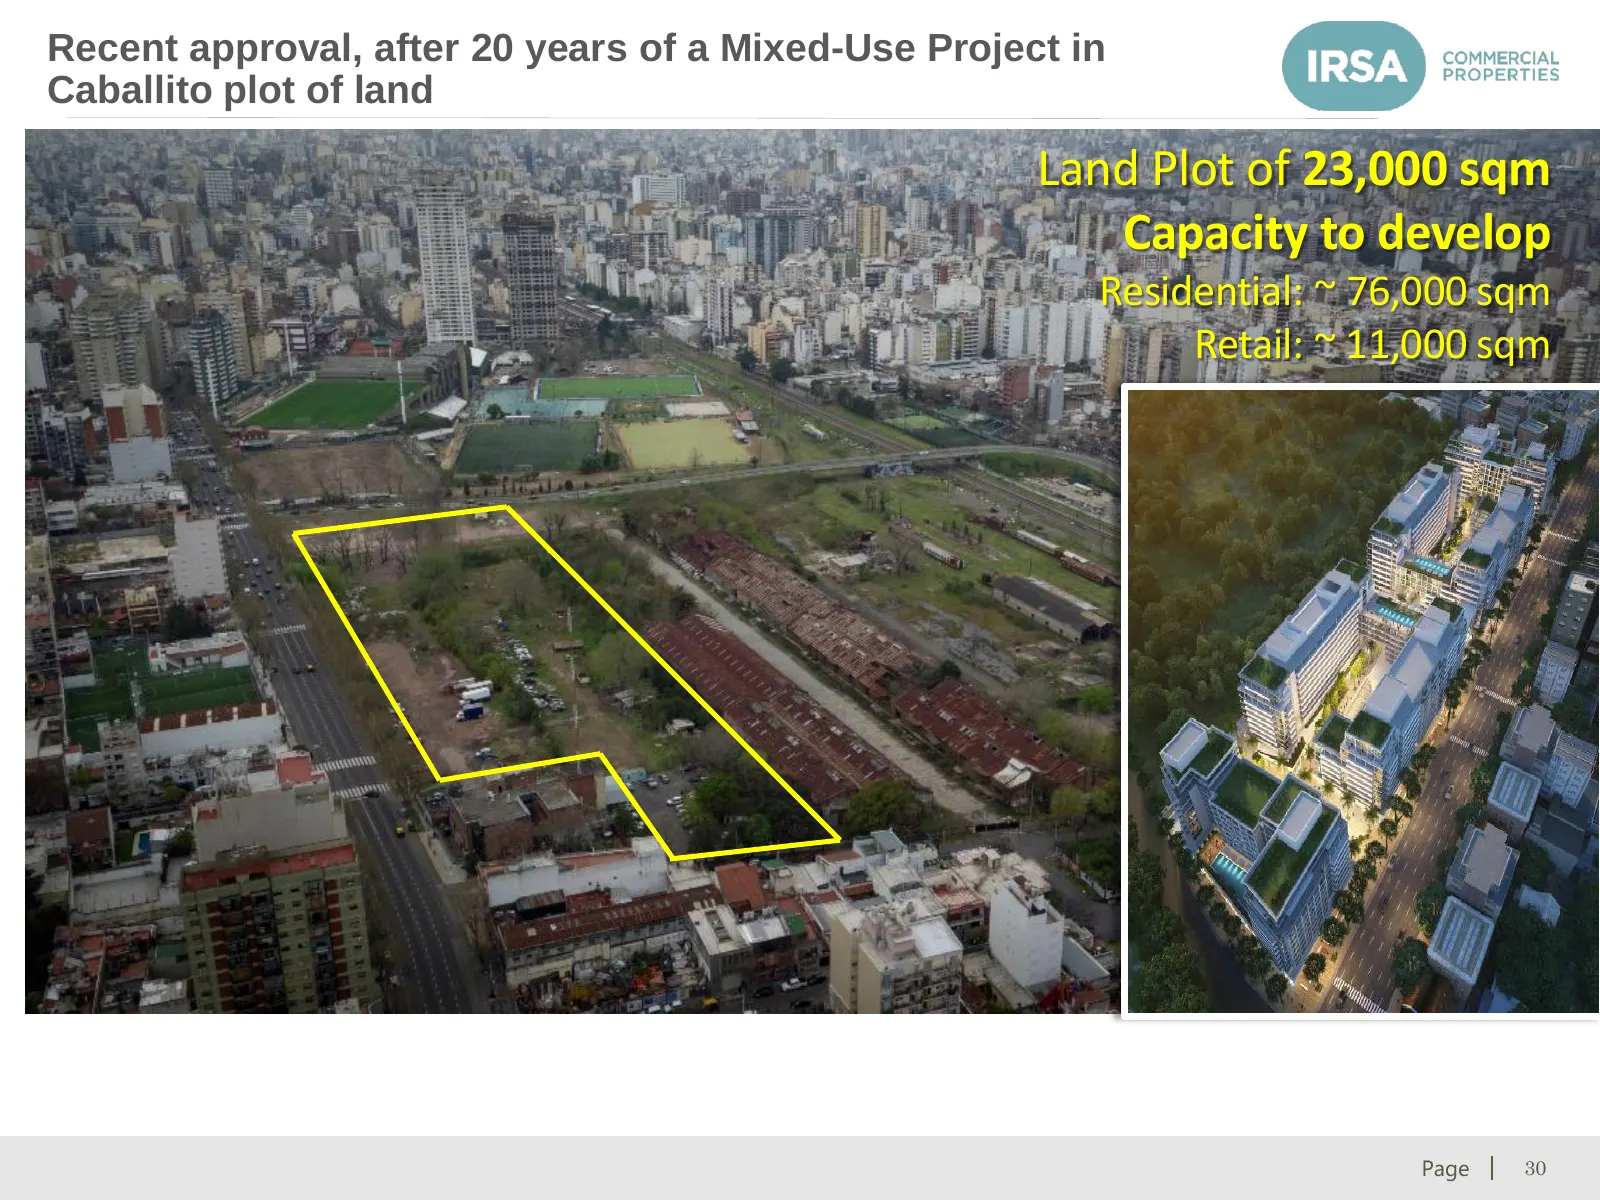
Slide 30: Recent approval: Caballito Mixed-Use Project
Recent approval, after 20 years of a Mixed-Use Project in Caballito plot of land Land Plot of 23,000 sqm Capacity to develop Residential: ~ 76,000 sqm Retail: ~ 11,000 sqm © 2017 CRESUD. All rights reserved. Page 30
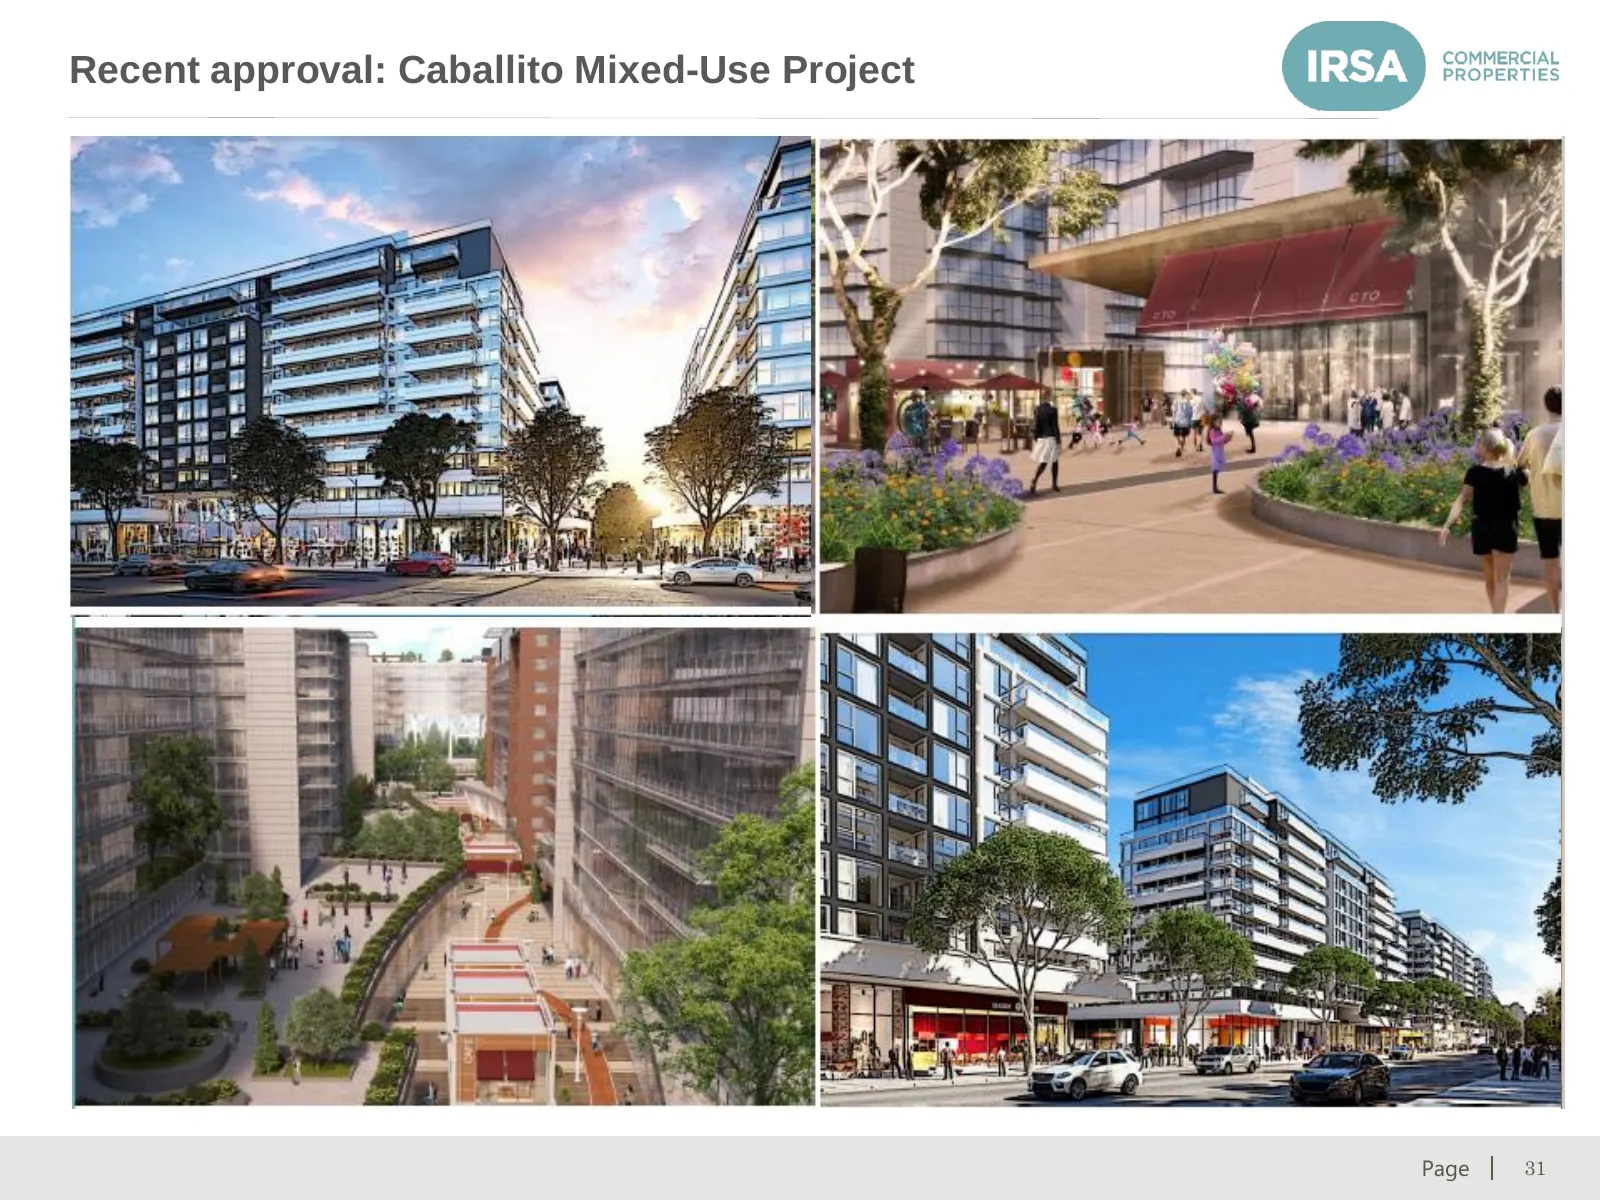
Slide 31: Recent approval: Caballito Mixed-Use Project
Recent approval: Caballito Mixed-Use Project © 2017 CRESUD. All rights reserved. Page 31
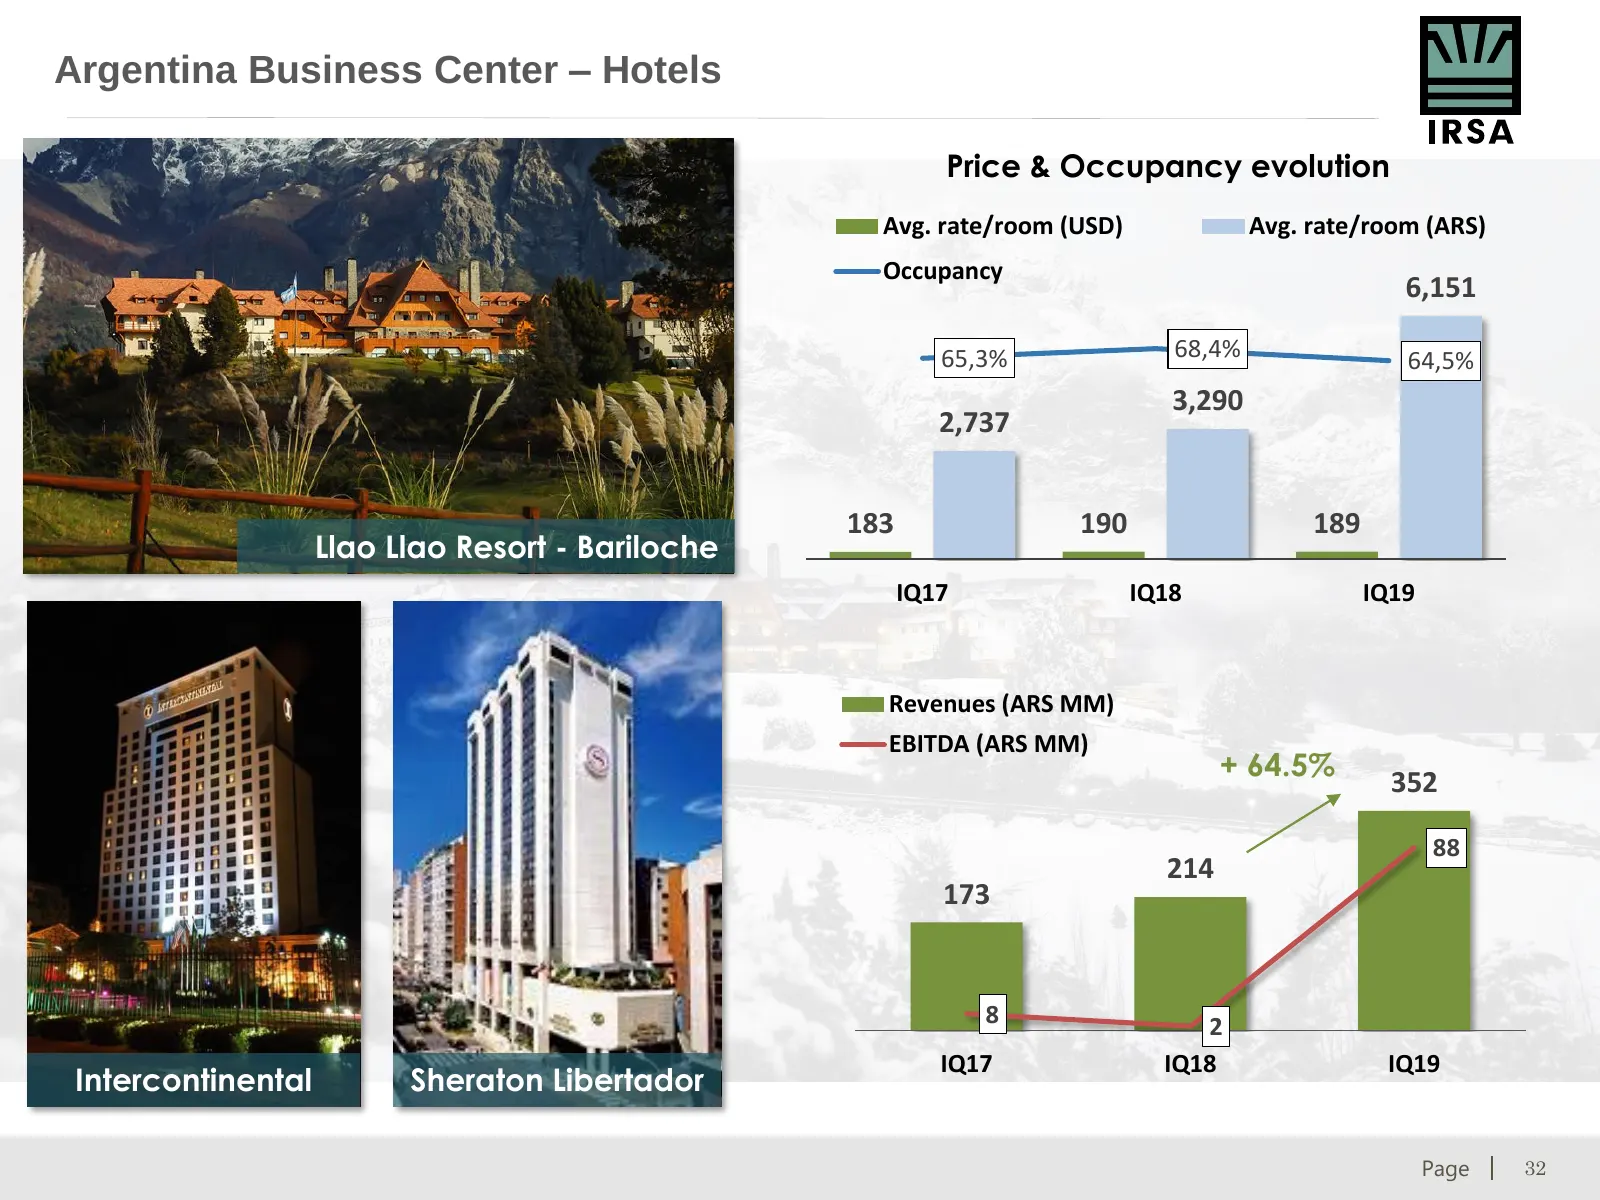
Slide 32: Argentina Business Center – Hotels
Argentina Business Center – Hotels Price & Occupancy evolution Avg. rate/room (USD) Avg. rate/room (ARS) Occupancy 6,151 65,3% 68,4% 64,5% 3,290 2,737 183 190 189 Llao Llao Resort - Bariloche IQ17 IQ18 IQ19 Revenues (ARS MM) EBITDA (ARS MM) + 64.5% 352 88 214 173 8 2 IQ17 IQ18 IQ19 Intercontinental
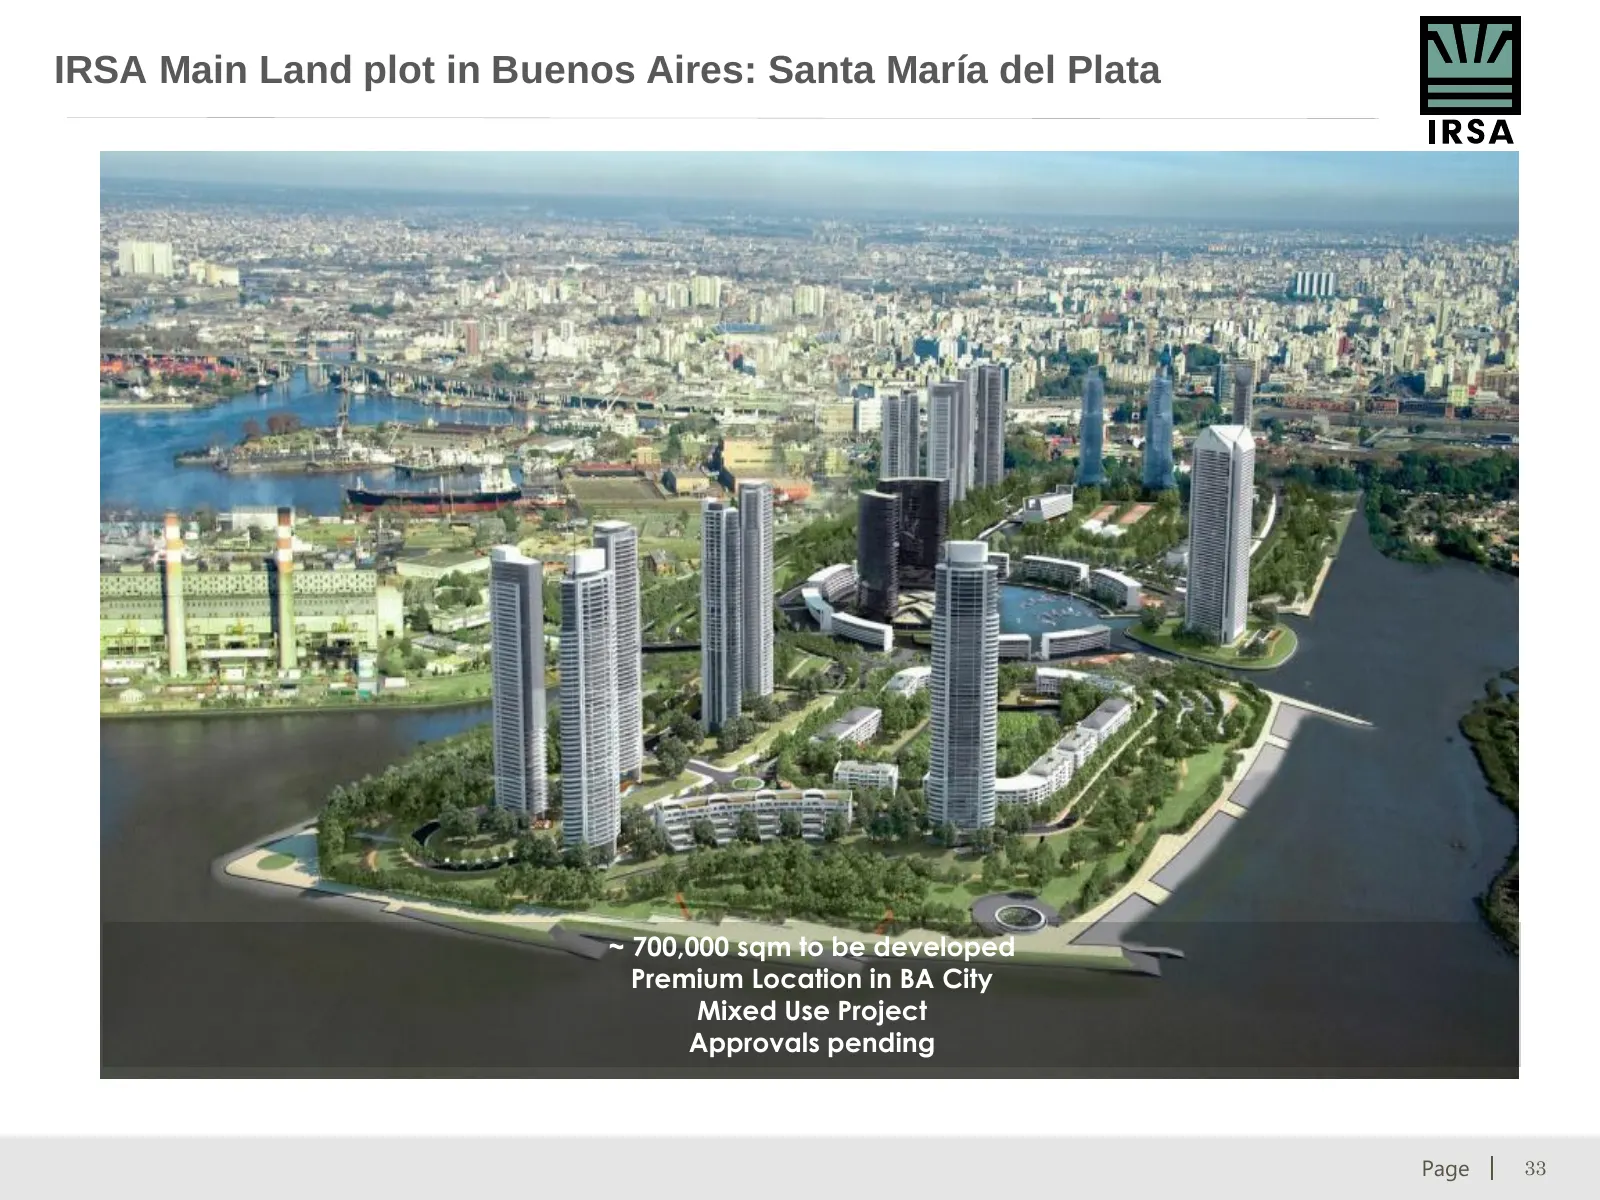
Slide 33: IRSA Main Land plot in Buenos Aires: Santa María del Plata
IRSA Main Land plot in Buenos Aires: Santa María del Plata ~ 700,000 sqm to be developed Premium Location in BA City Mixed Use Project Approvals pending © 2017 CRESUD. All rights reserved. Page 33
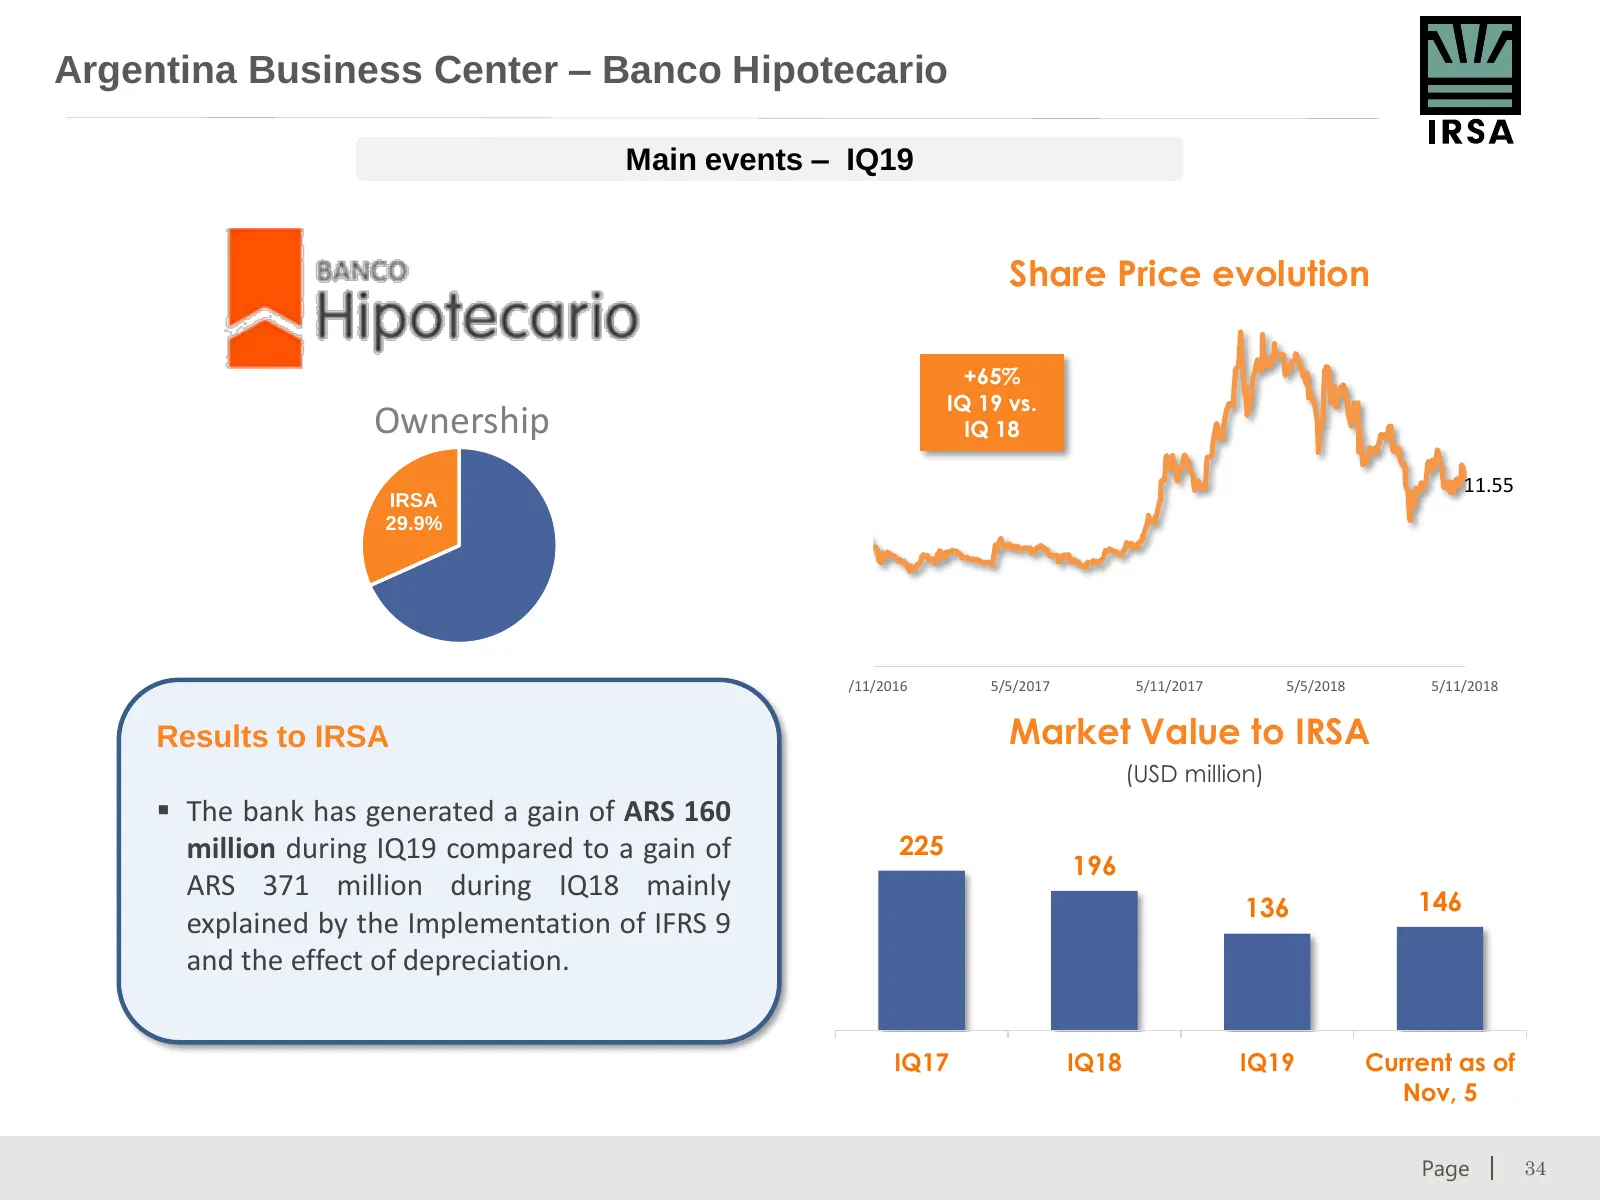
Slide 34: Argentina Business Center – Banco Hipotecario
Argentina Business Center – Banco Hipotecario Main events – IQ19 Share Price evolution +65% IQ 19 vs. Ownership IQ 18 11.55 IRSA 29.9% 5/11/2016 5/5/2017 5/11/2017 5/5/2018 5/11/2018 Results to IRSA Market Value to IRSA (USD million) The bank has generated a gain of ARS 160 million during IQ19 com
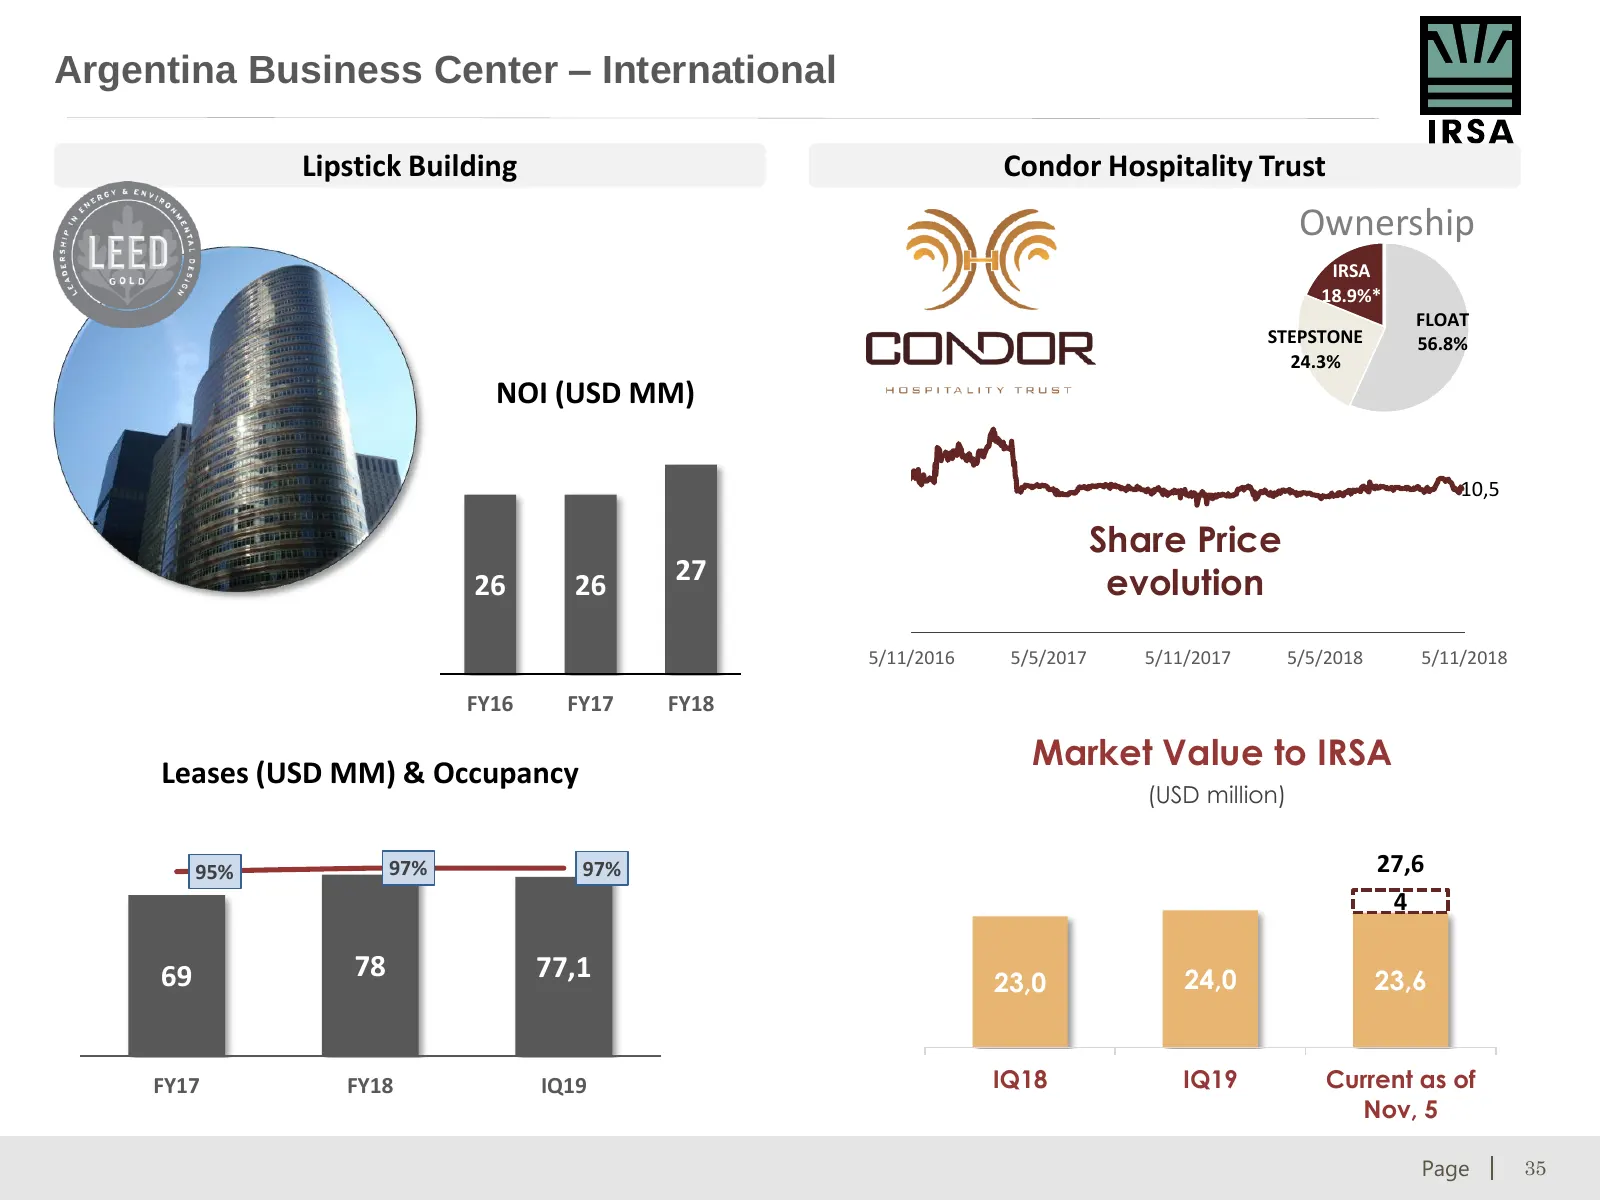
Slide 35: Argentina Business Center – International
Argentina Business Center – International Lipstick Building Condor Hospitality Trust Ownership IRSA 18.9%* FLOAT STEPSTONE 56.8% 24.3% NOI (USD MM) 10,5 Share Price 26 26 27 evolution 5/11/2016 5/5/2017 5/11/2017 5/5/2018 5/11/2018 FY16 FY17 FY18 Market Value to IRSA Leases (USD MM) & Occupancy (USD
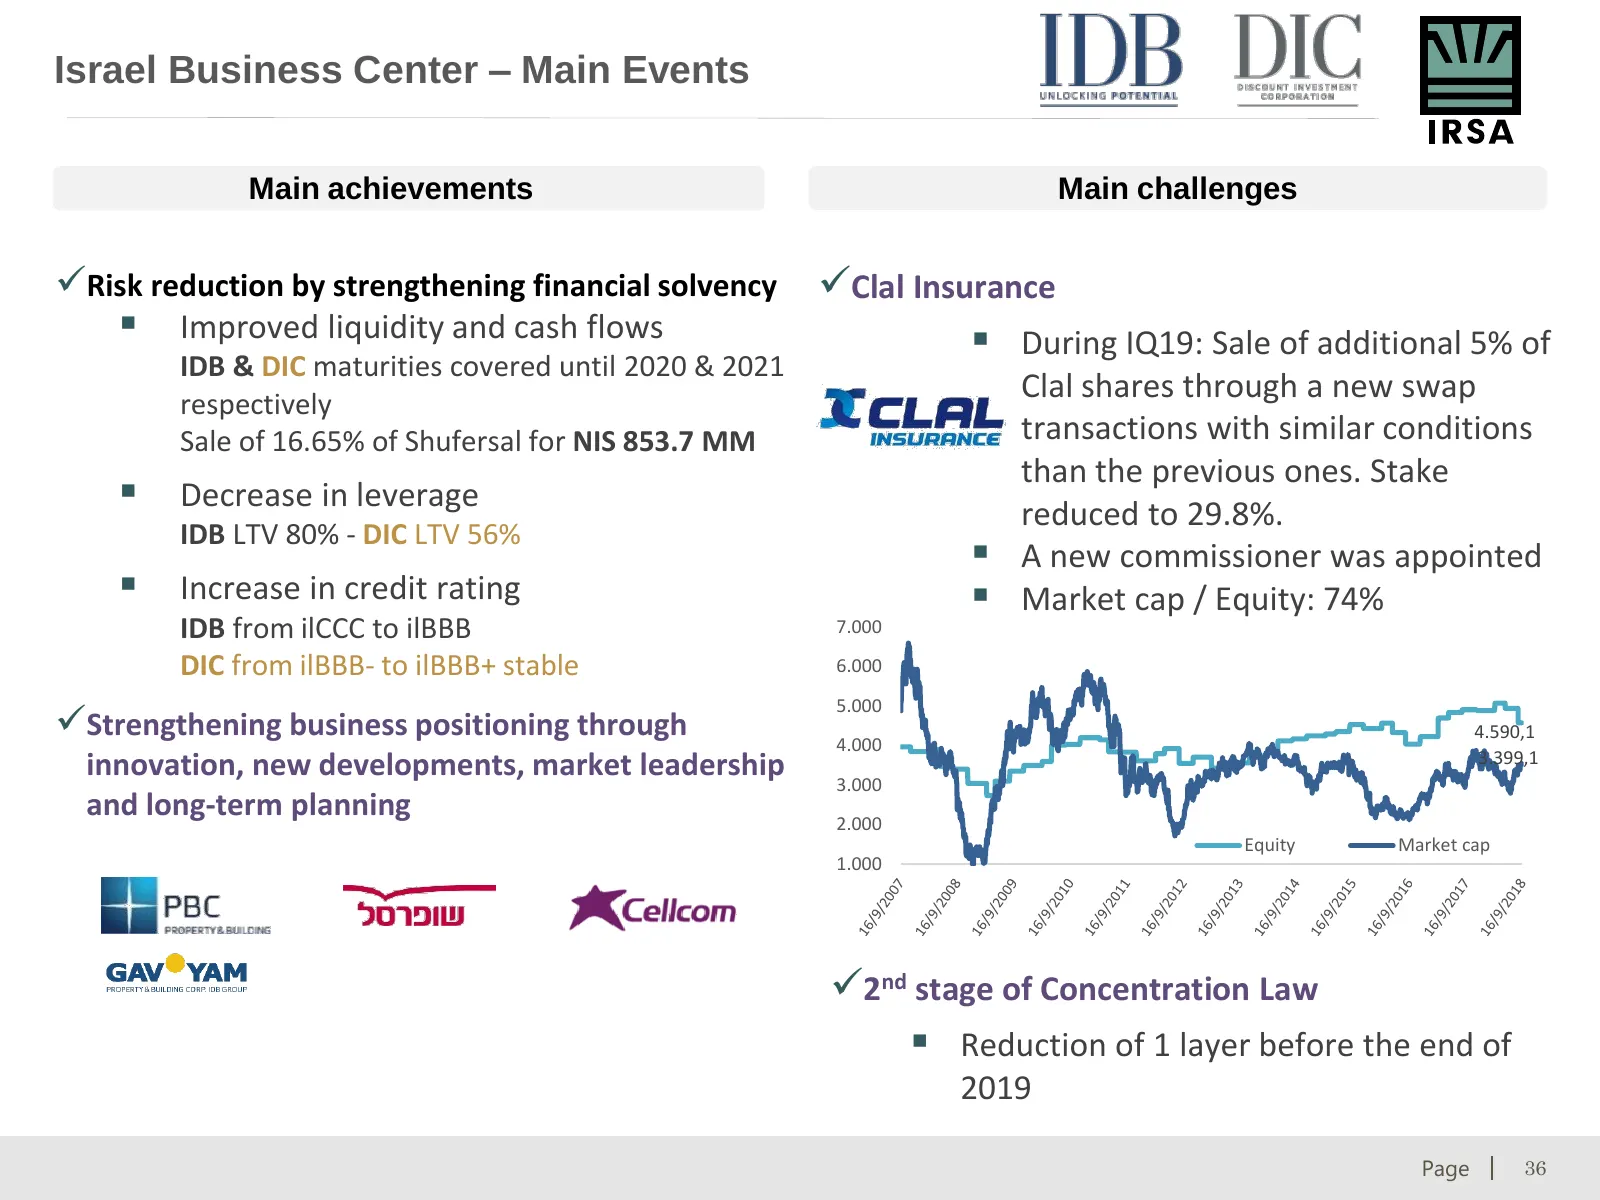
Slide 36: Israel Business Center – Main Events
Israel Business Center – Main Events Main achievements Main challenges Risk reduction by strengthening financial solvency Clal Insurance Improved liquidity and cash flows During IQ19: Sale of additional 5% of IDB & DIC maturities covered until 2020 & 2021 respectively Clal shares through a new
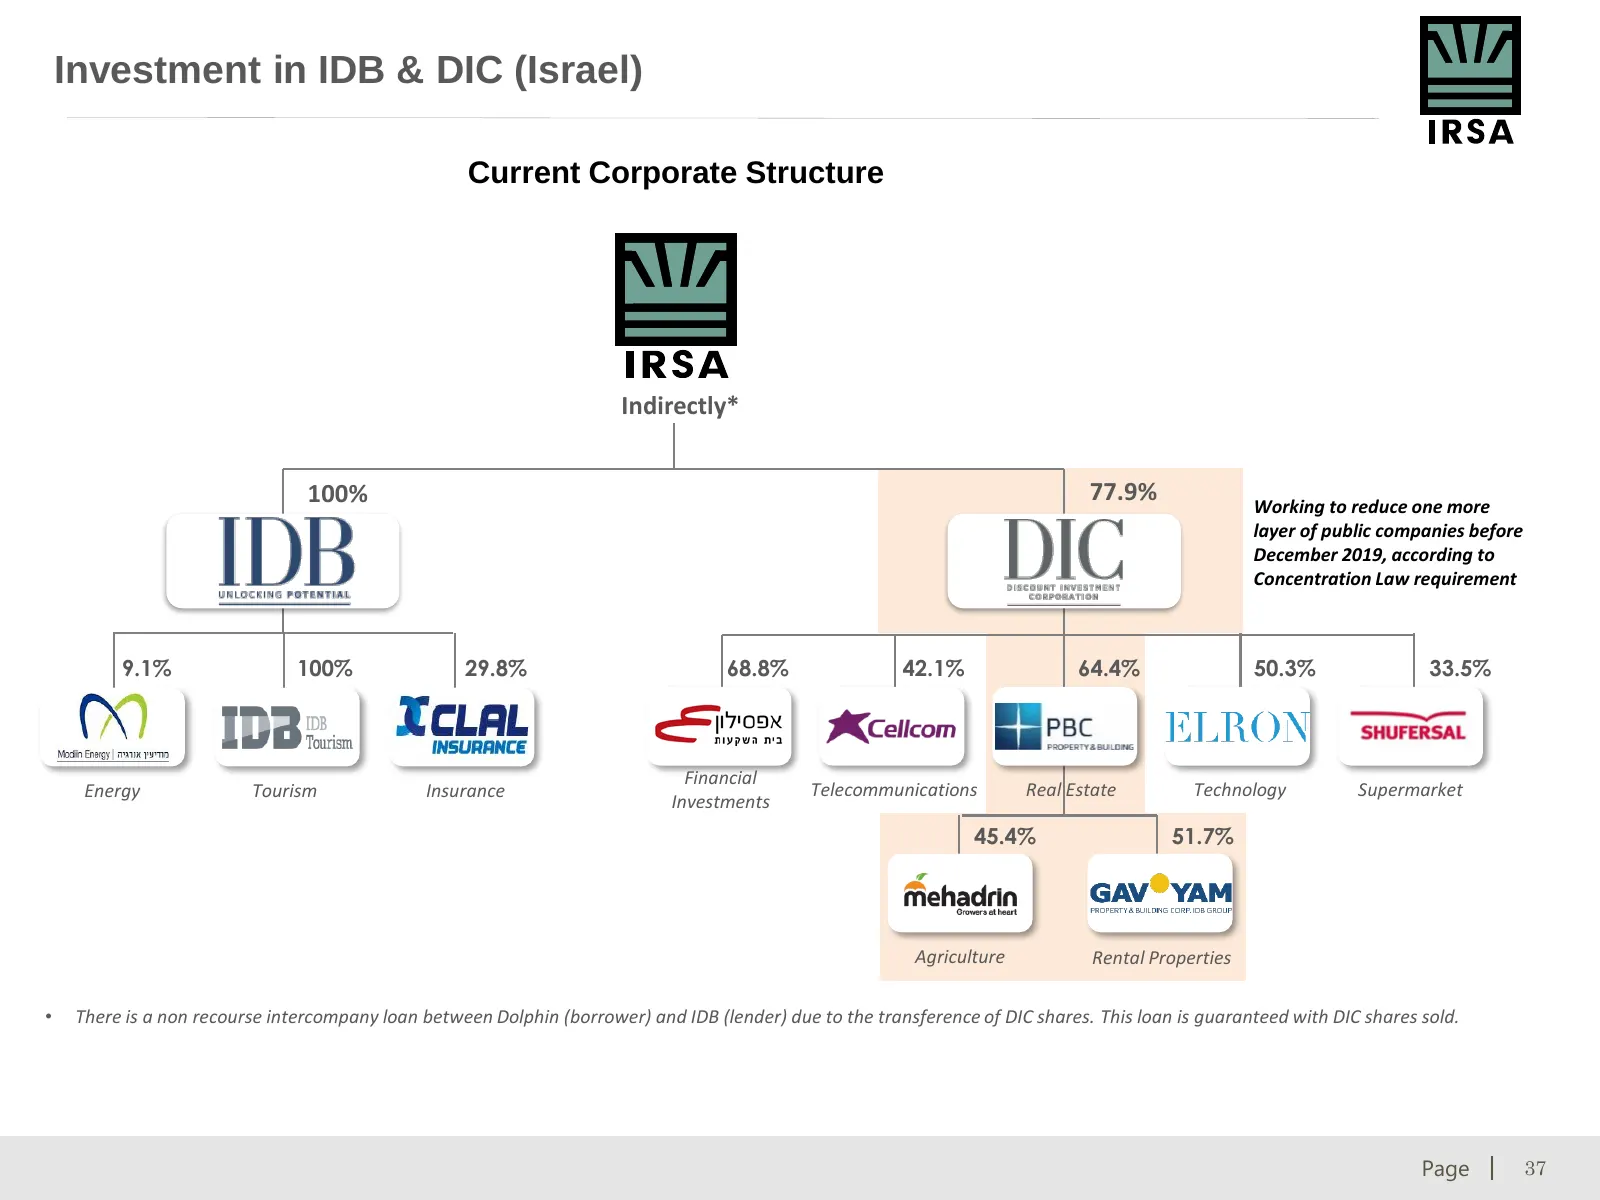
Slide 37: Investment in IDB & DIC (Israel)
Investment in IDB & DIC (Israel) Current Corporate Structure Indirectly* 100% 77.9% Working to reduce one more layer of public companies before December 2019, according to Concentration Law requirement 9.1% 100% 29.8% 68.8% 42.1% 64.4% 50.3% 33.5% Financial Energy Tourism Insurance Telecommunication
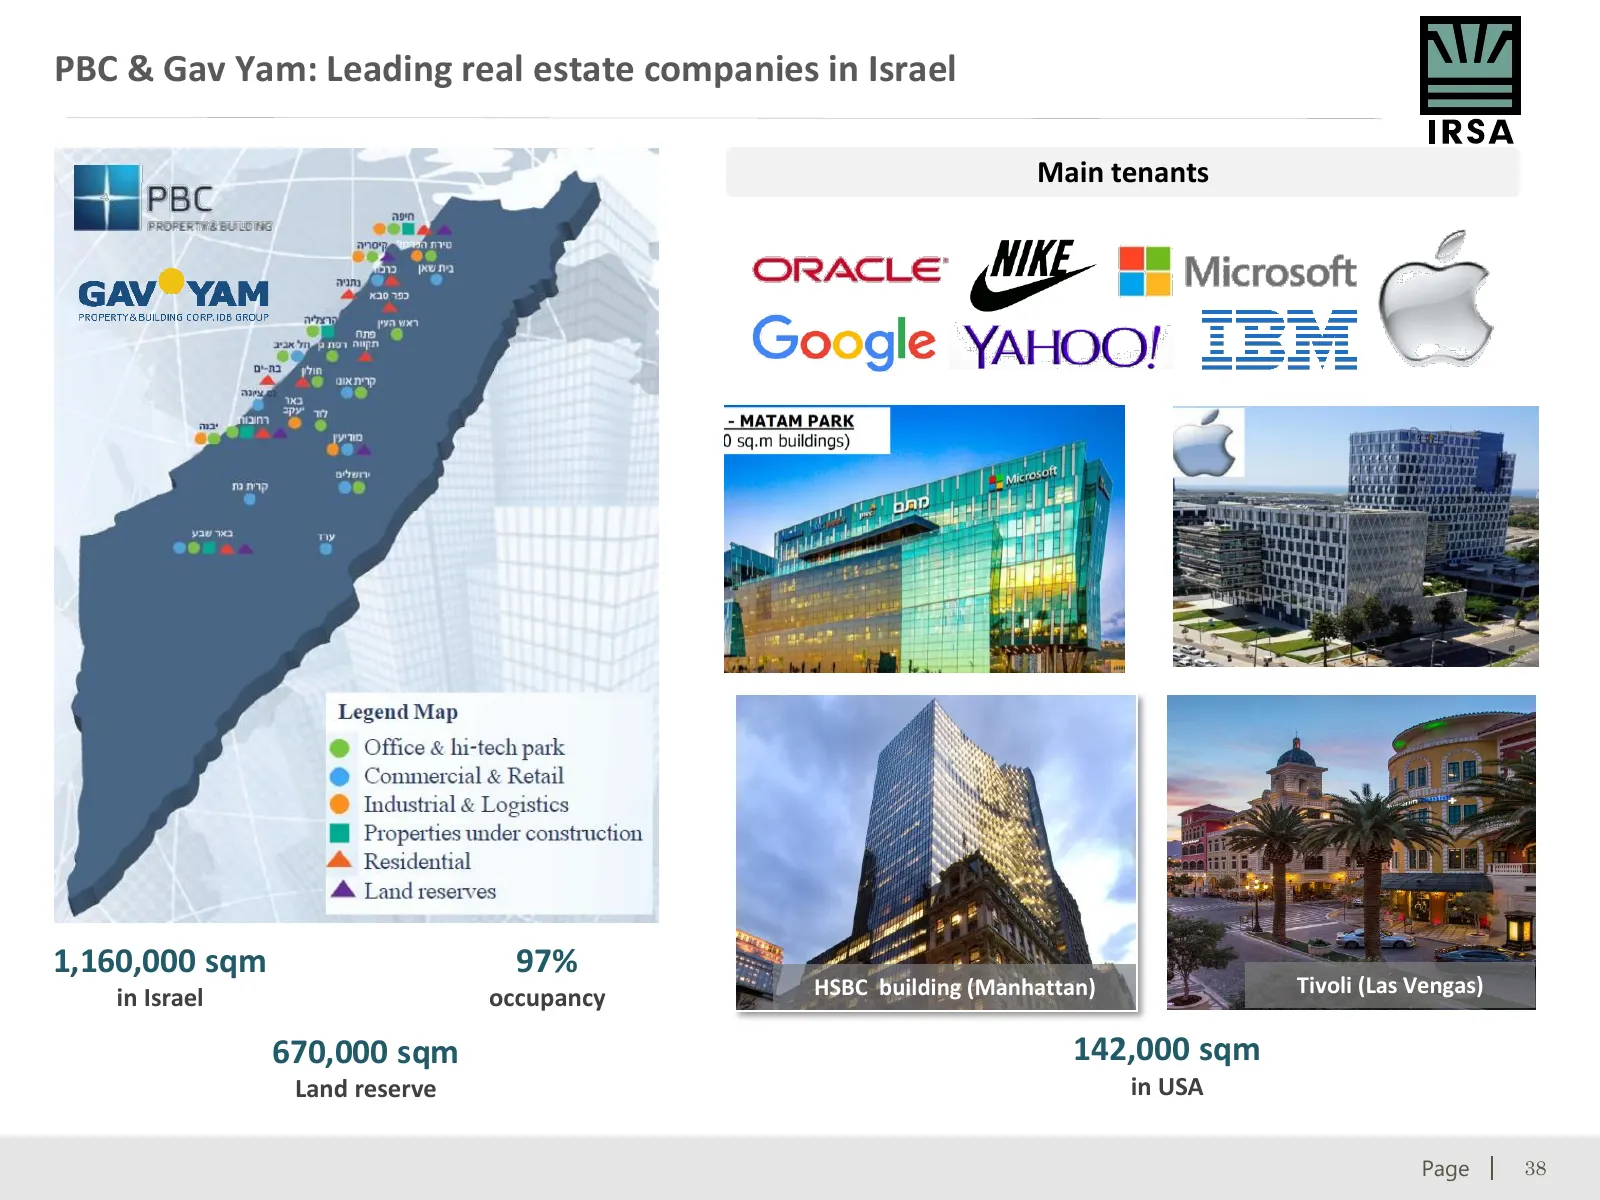
Slide 38: PBC & Gav Yam: Leading real estate companies in Israel
PBC & Gav Yam: Leading real estate companies in Israel Main tenants 1,160,000 sqm 97% HSBC building (Manhattan) Tivoli (Las Vengas) in Israel occupancy 670,000 sqm 142,000 sqm Land reserve in USA © 2017 CRESUD. All rights reserved. Page 38
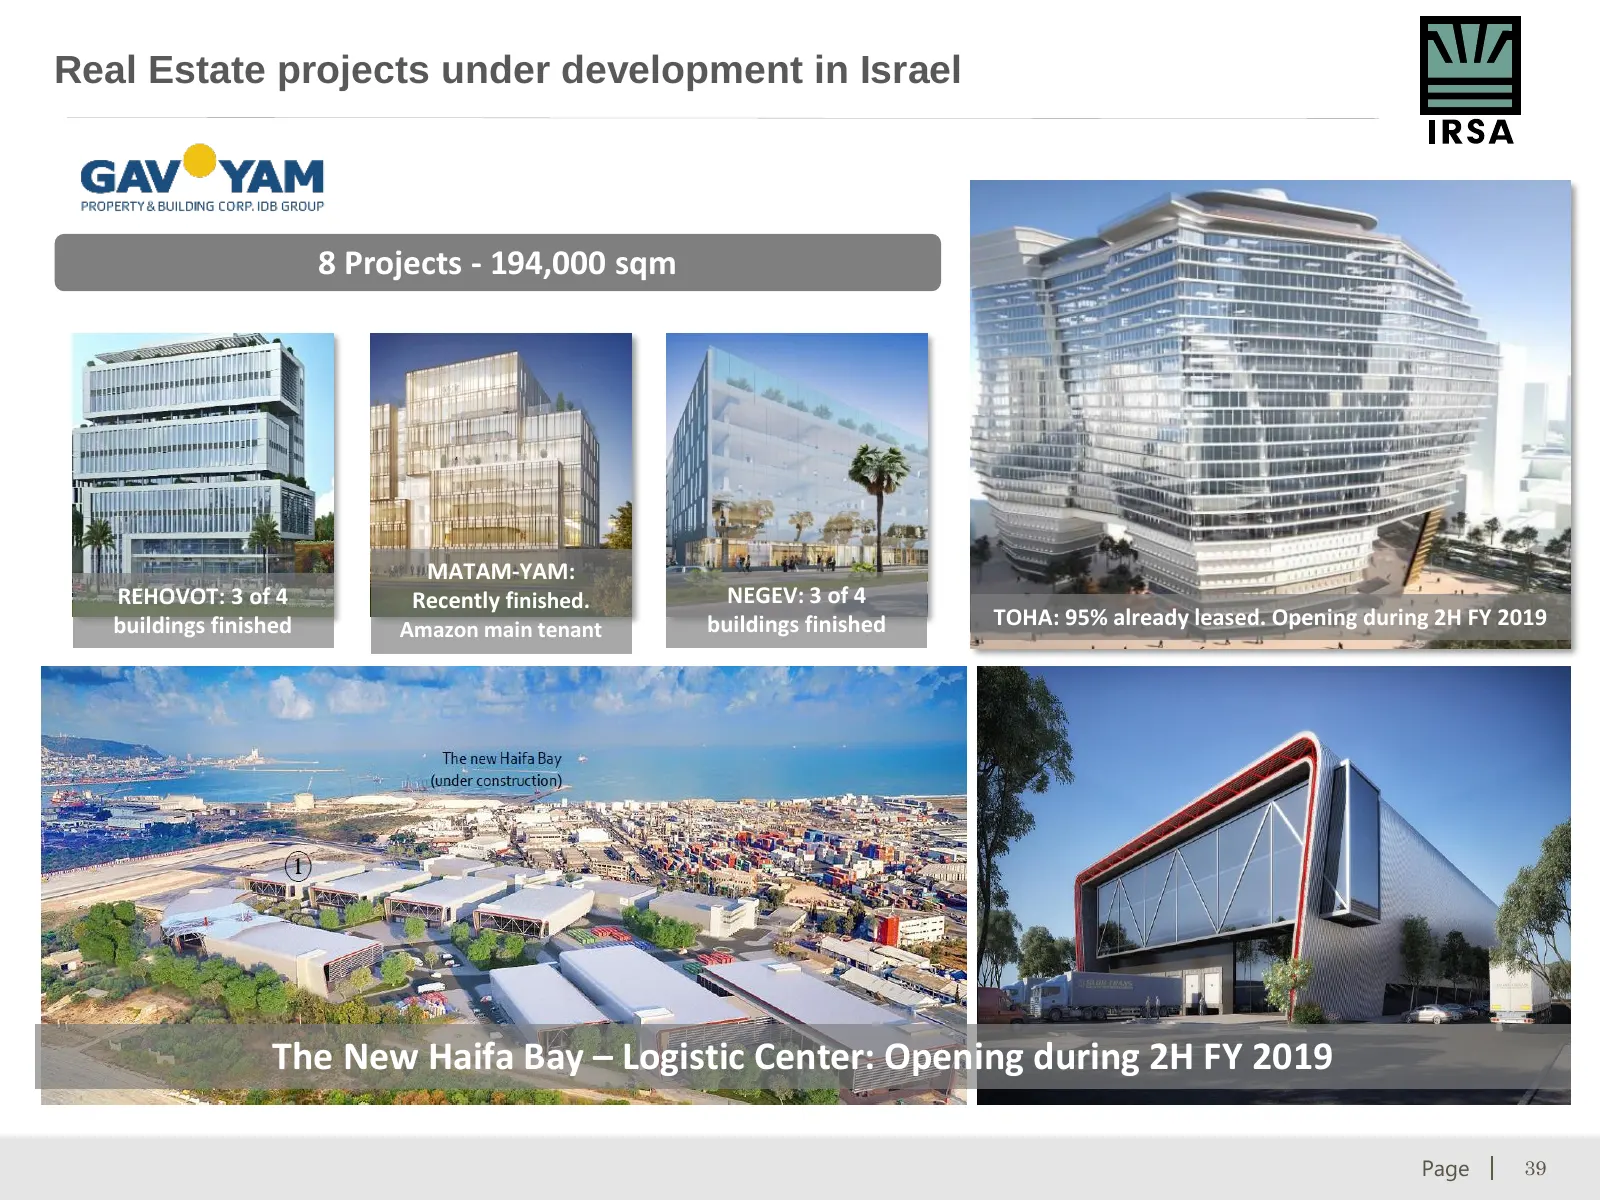
Slide 39: Real Estate projects under development in Israel
Real Estate projects under development in Israel 8 Projects - 194,000 sqm MATAM-YAM: REHOVOT: 3 of 4 Recently finished. NEGEV: 3 of 4 buildings finished Amazon main tenant buildings finished TOHA: 95% already leased. Opening during 2H FY 2019 The New Haifa Bay – Logistic Center: Opening during 2H FY
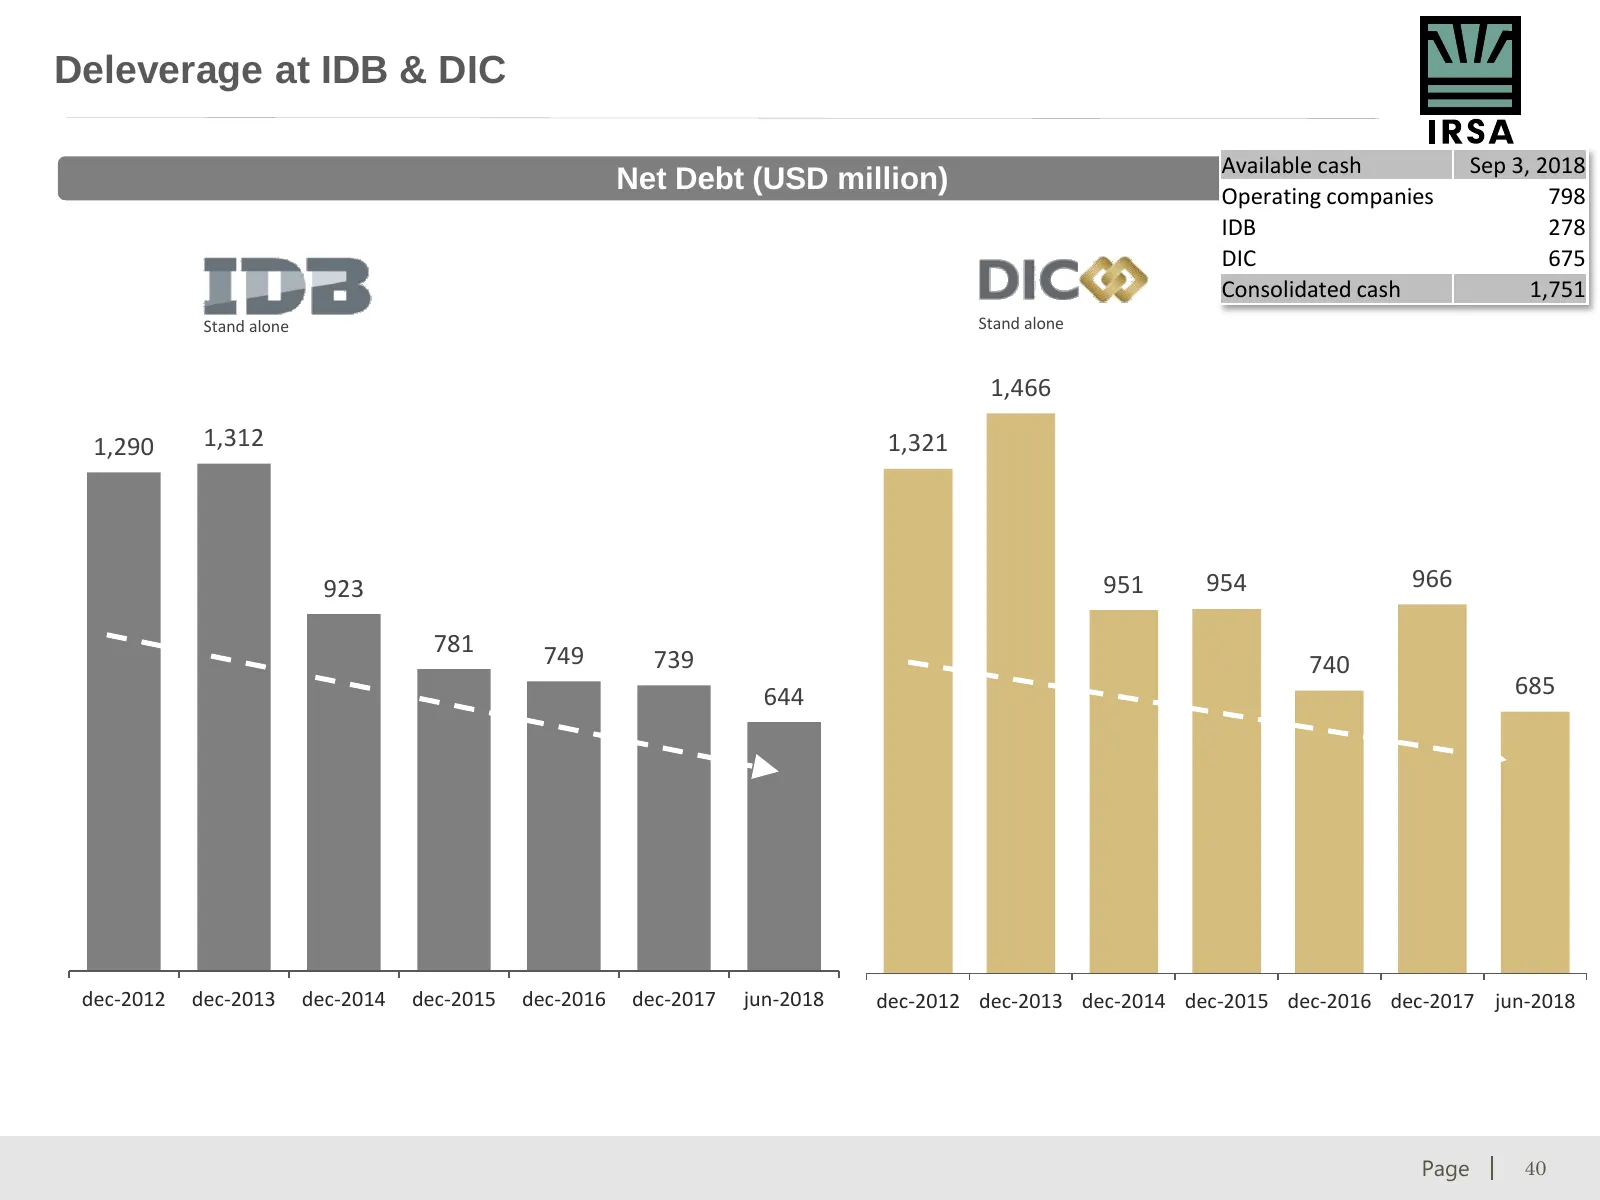
Slide 40: Deleverage at IDB & DIC
Deleverage at IDB & DIC Available cash Sep 3, 2018 Net Debt (USD million) Operating companies 798 IDB 278 DIC 675 Consolidated cash 1,751 Stand alone Stand alone 1,466 1,290 1,312 1,321 923 951 954 966 781 749 739 740 644 685 dec-2012 dec-2013 dec-2014 dec-2015 dec-2016 dec-2017 jun-2018 dec-2012 de

Slide 41: Financials
Financials © 2017 CRESUD. All rights reserved. Page 41
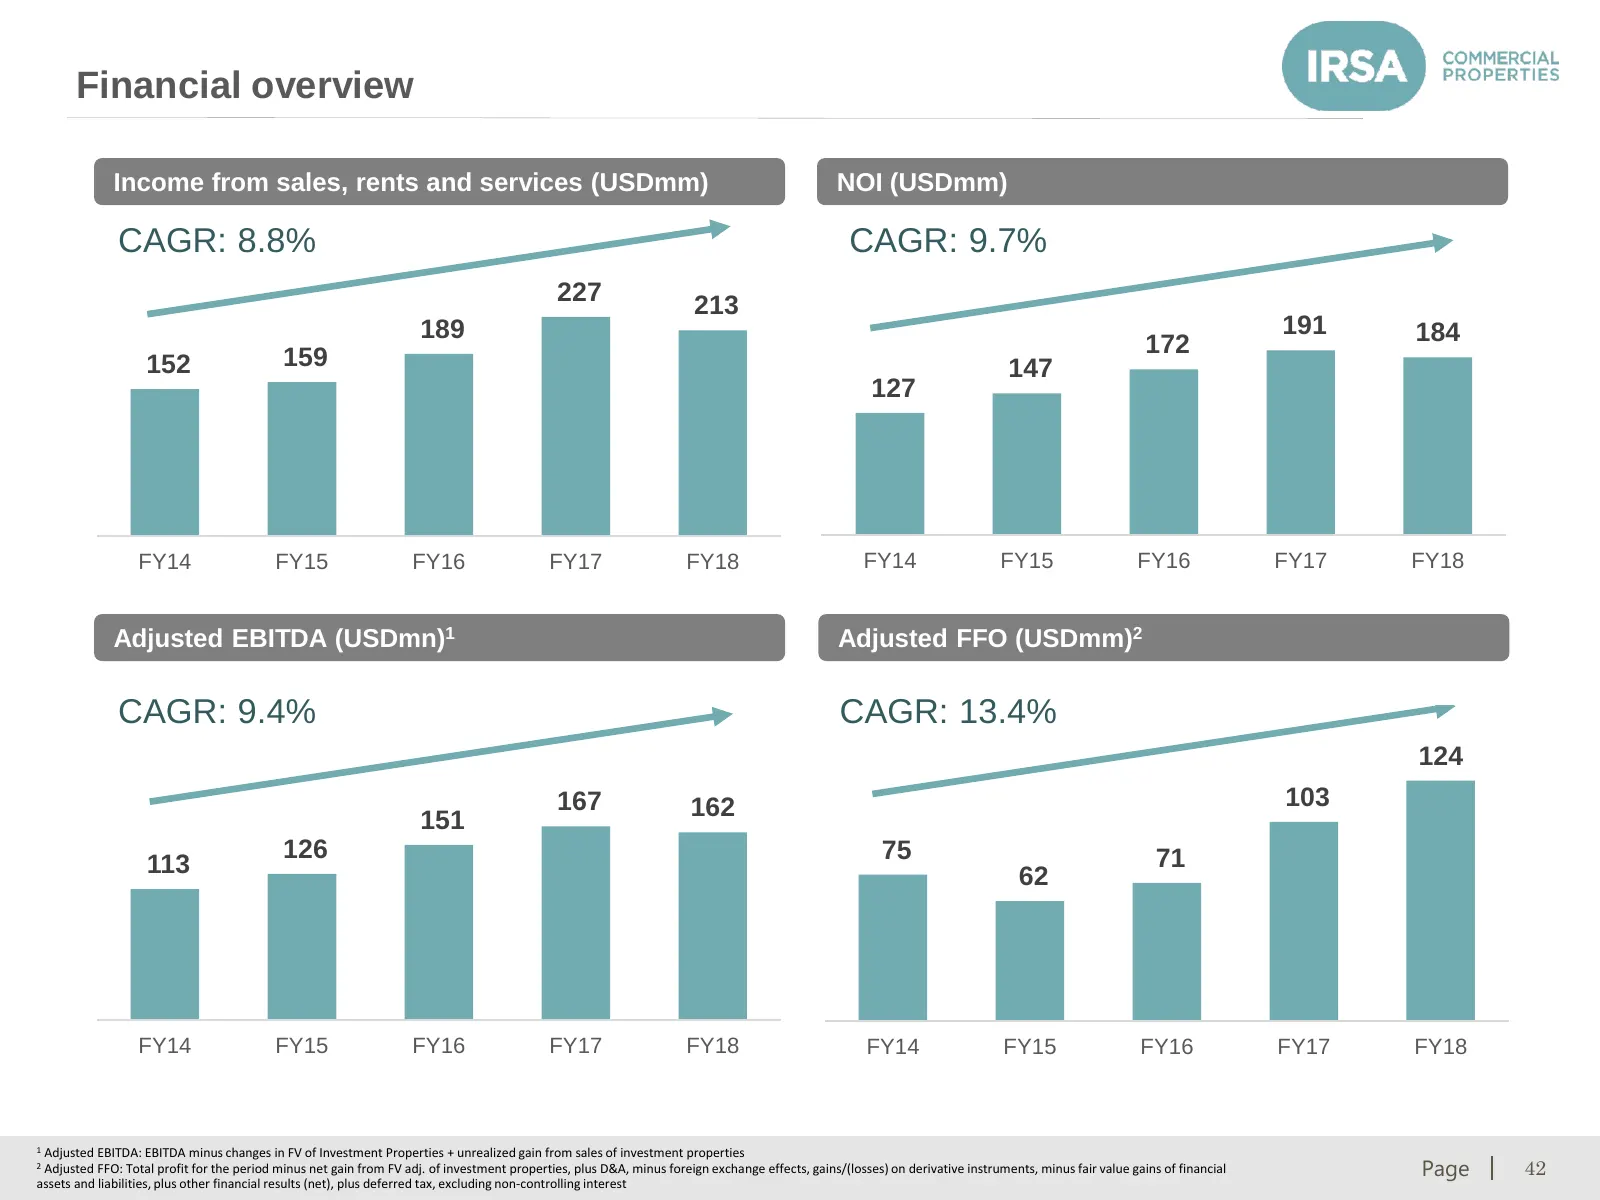
Slide 42: Financial overview
Financial overview Income from sales, rents and services (USDmm) NOI (USDmm) CAGR: 8.8% CAGR: 9.7% 227 213 189 191 184 159 172 152 147 127 FY14 FY15 FY16 FY17 FY18 FY14 FY15 FY16 FY17 FY18 Adjusted EBITDA (USDmn)1 Adjusted FFO (USDmm)2 CAGR: 9.4% CAGR: 13.4% 124 167 162 103 151 126 75 71 113 62 FY14
Slide 43: Financial overview
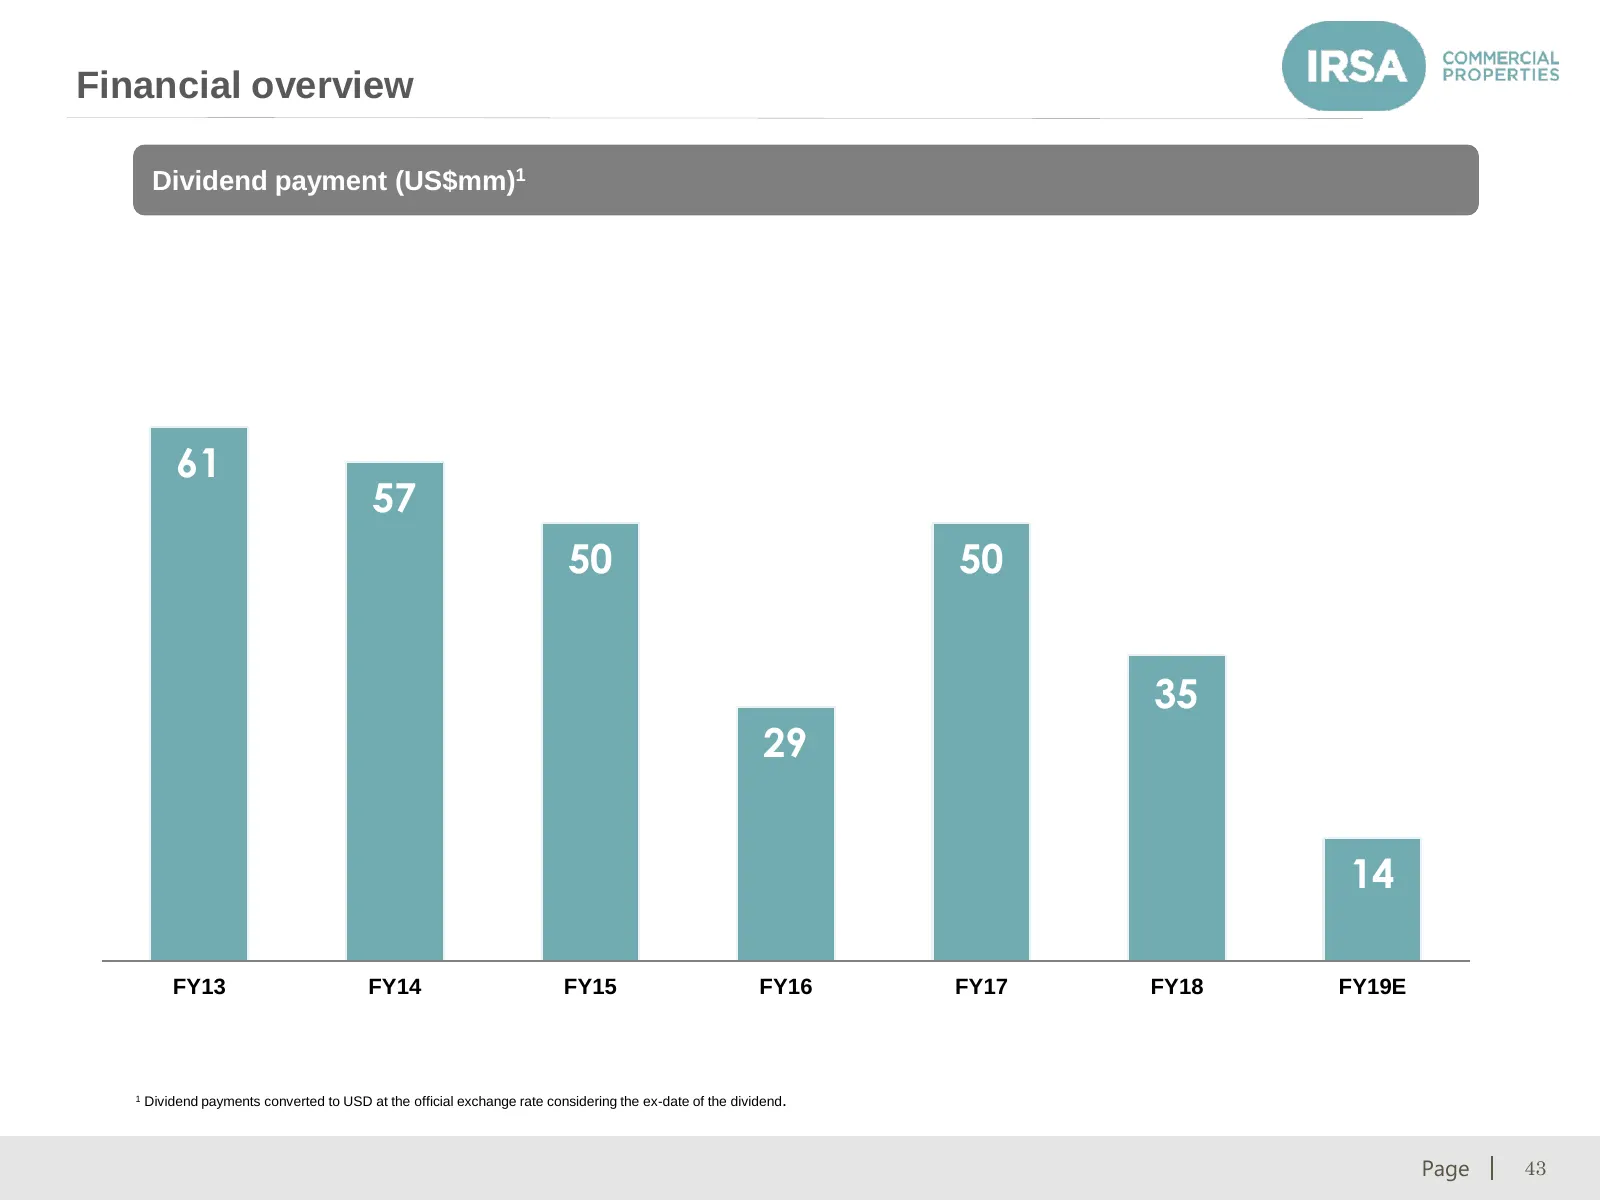
Financial overview Dividend payment (US$mm)1 61 57 50 50 35 29 14 FY13 FY14 FY15 FY16 FY17 FY18 FY19E 1 Dividend payments converted to USD at the official exchange rate considering the ex-date of the dividend . © 2017 CRESUD. All rights reserved. Page 43
Slide 44: Net Asset Value as of September 30, 2018
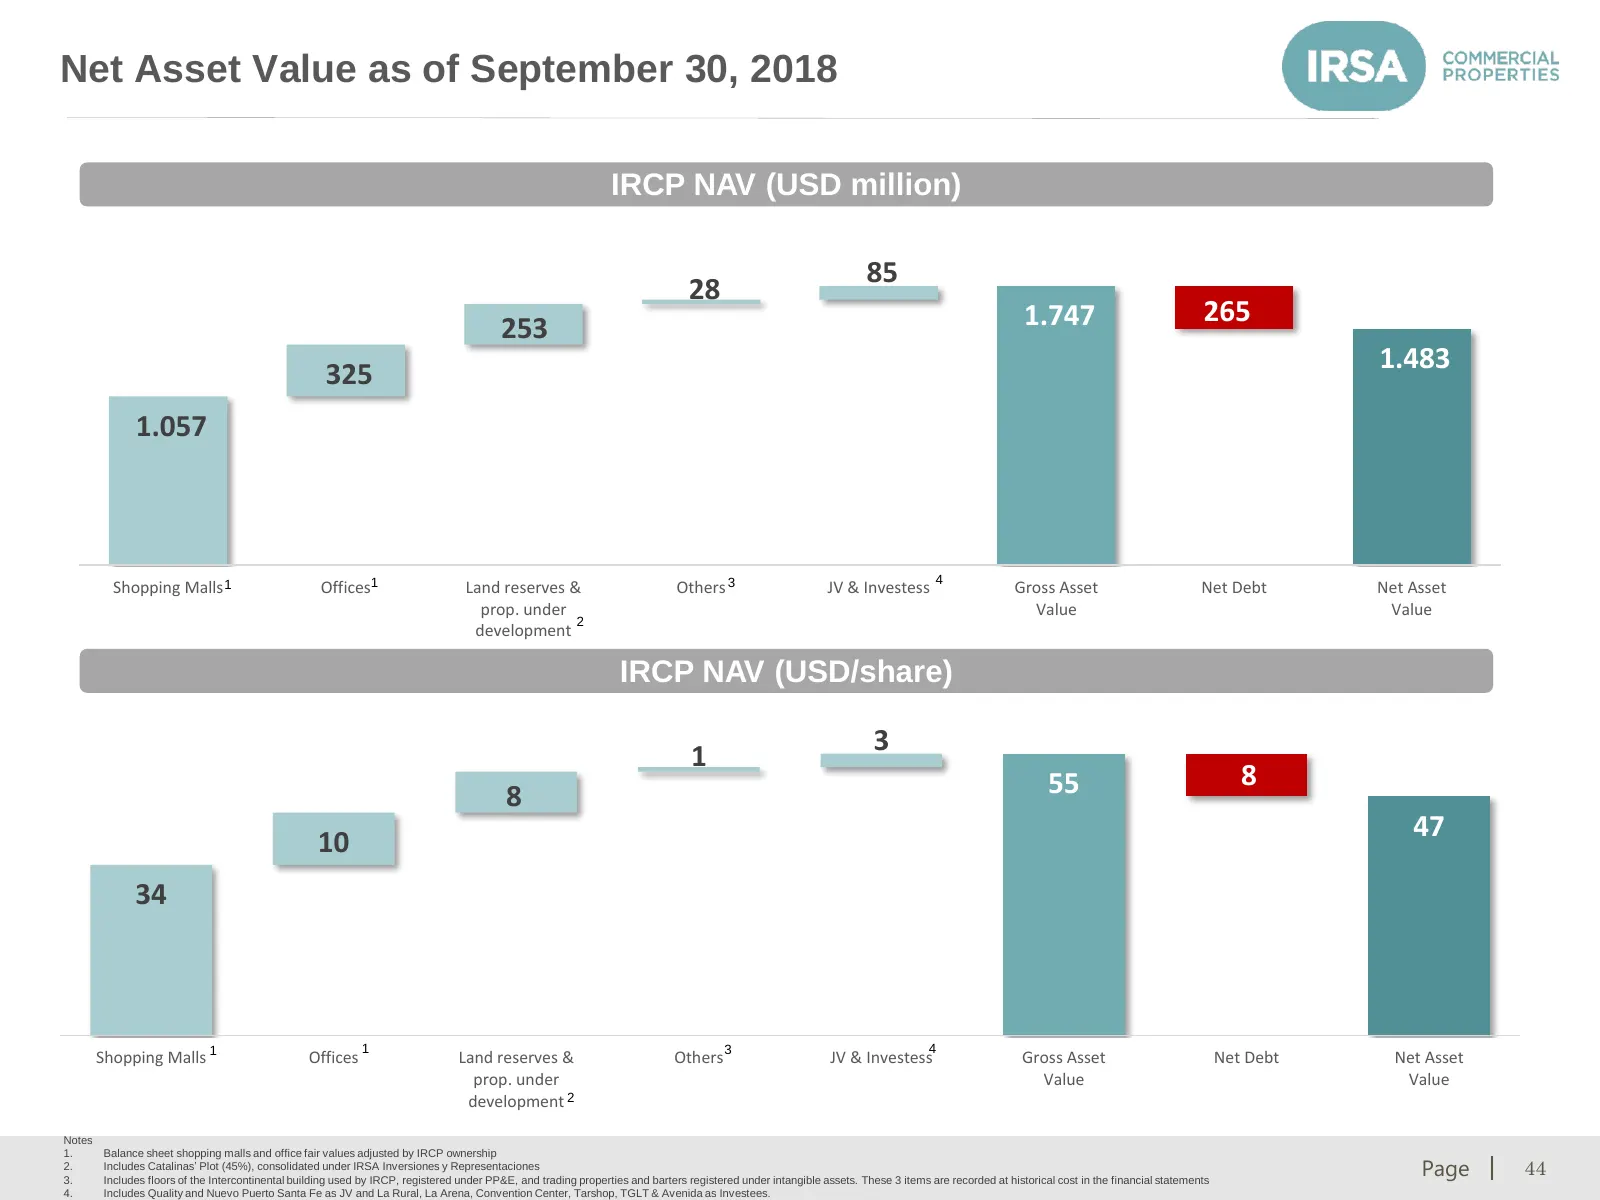
Net Asset Value as of September 30, 2018 IRCP NAV (USD million) 85 28 1.747 265 253 1.483 325 1.057 4 Shopping Malls 1 Offices1 Land reserves & Others 3 JV & Investess Gross Asset Net Debt Net Asset prop. under Value Value 2 development IRCP NAV (USD/share) 3 1 55 8 8 47 10 34 1 3 4 Shopping Malls 1
Slide 45: Main Financial Metrics
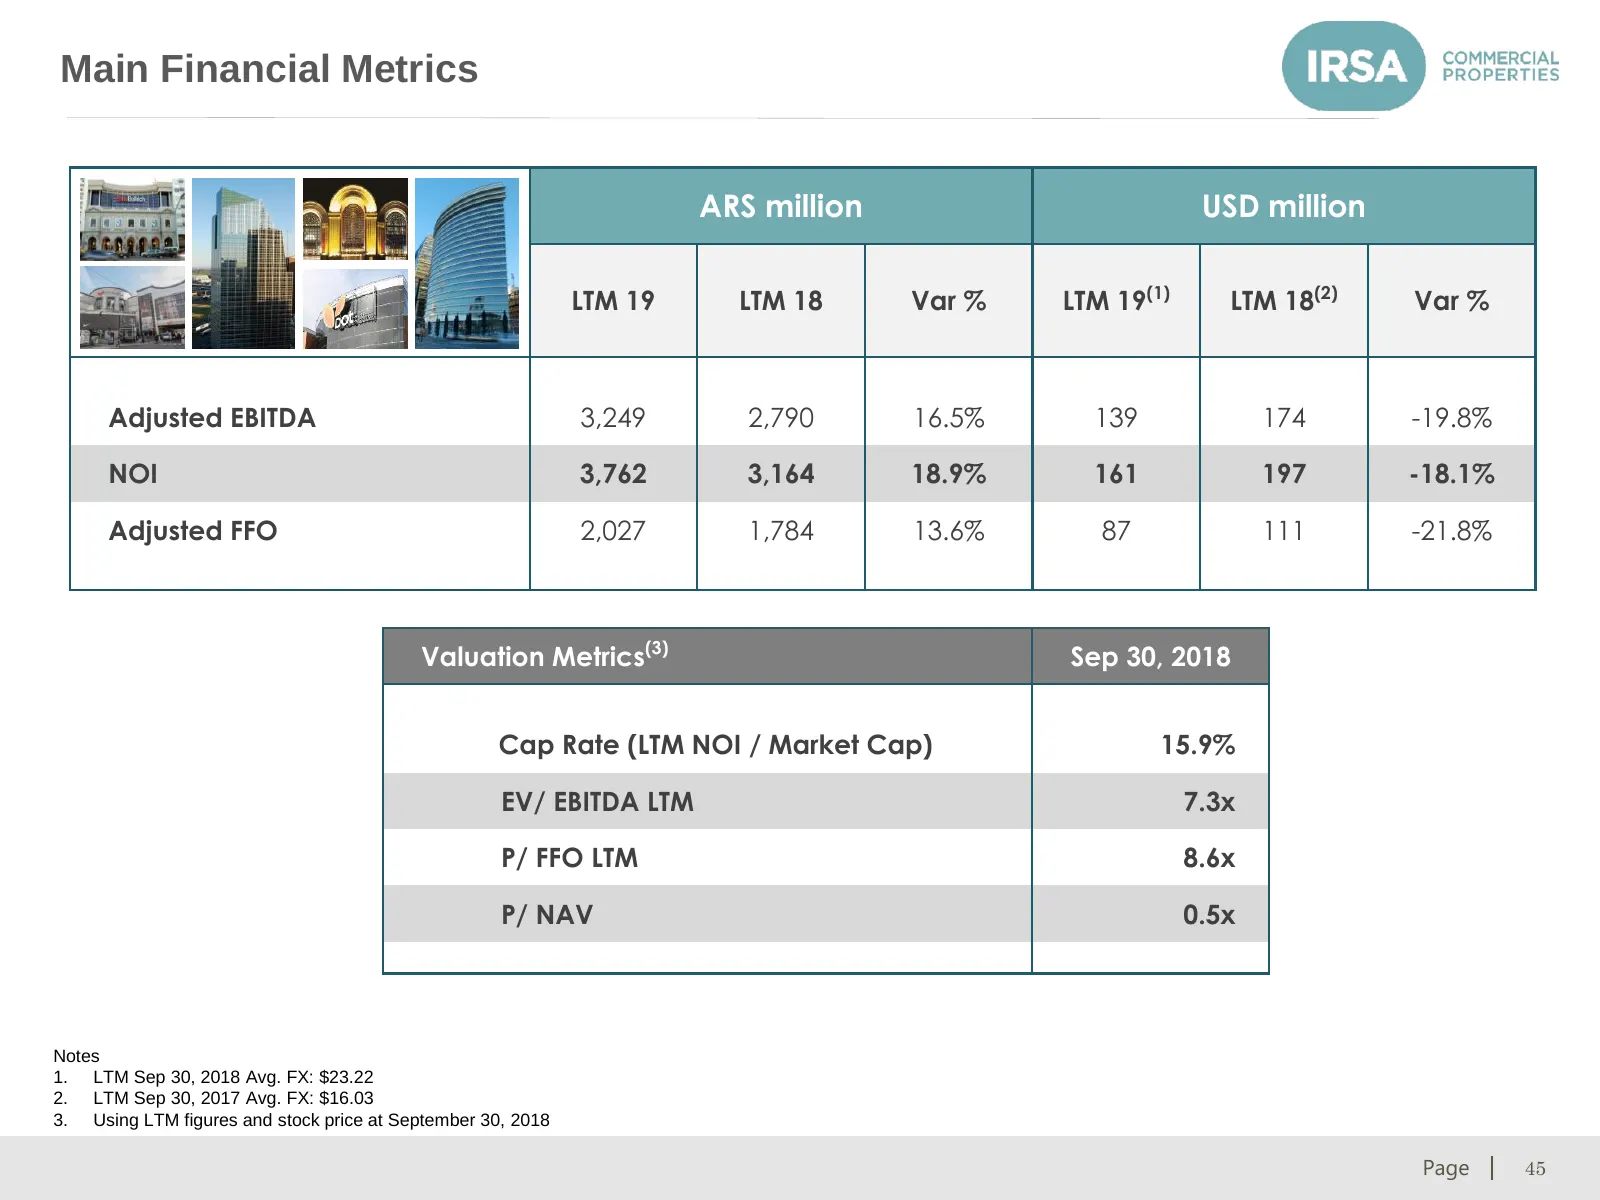
Main Financial Metrics ARS million USD million LTM 19 LTM 18 Var % LTM 19(1) LTM 18(2) Var % Adjusted EBITDA 3,249 2,790 16.5% 139 174 -19.8% NOI 3,762 3,164 18.9% 161 197 -18.1% Adjusted FFO 2,027 1,784 13.6% 87 111 -21.8% Valuation Metrics(3) Sep 30, 2018 Cap Rate (LTM NOI / Market Cap) 15.9% EV/
Slide 46: Consolidated Debt as of September 30, 2018
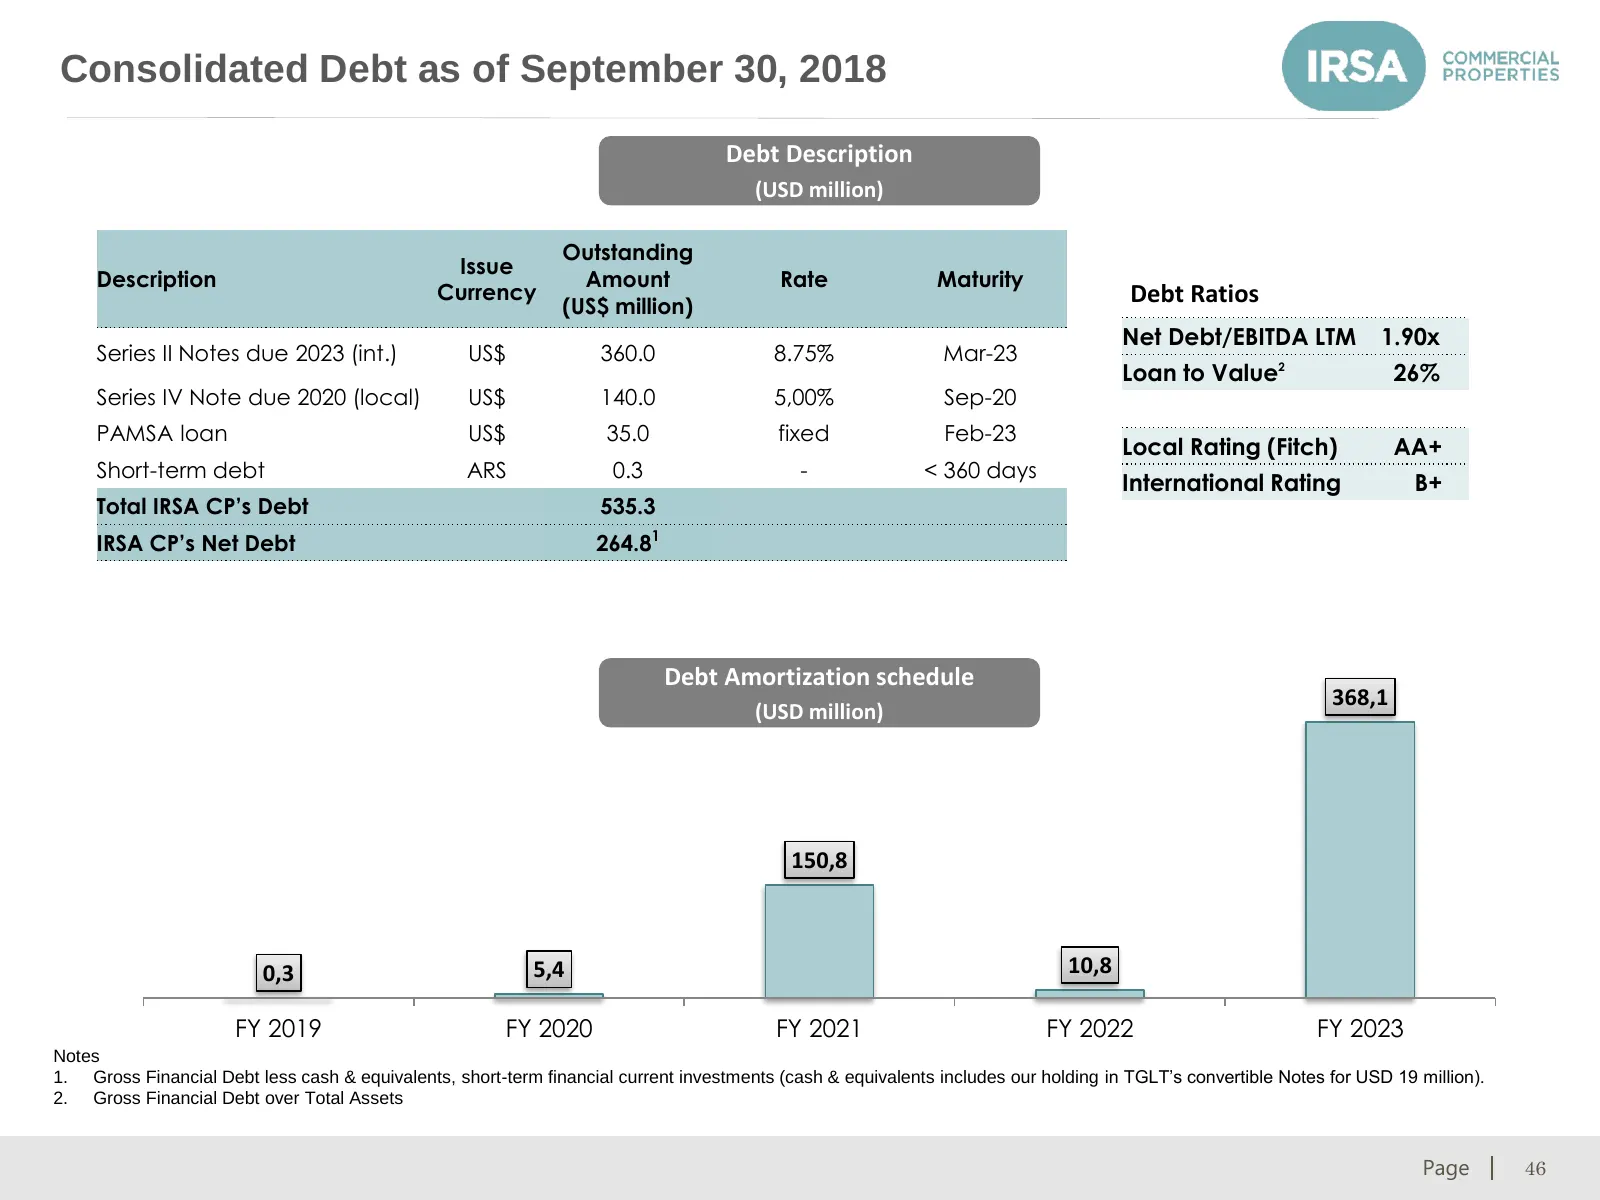
Consolidated Debt as of September 30, 2018 Debt Description (USD million) Outstanding Issue Description Amount Rate Maturity Currency Debt Ratios (US$ million) Net Debt/EBITDA LTM 1.90x Series II Notes due 2023 (int.) US$ 360.0 8.75% Mar-23 Loan to Value 2 26% Series IV Note due 2020 (local) US$ 140
Slide 47: IRSA Debt as of September 30, 2018
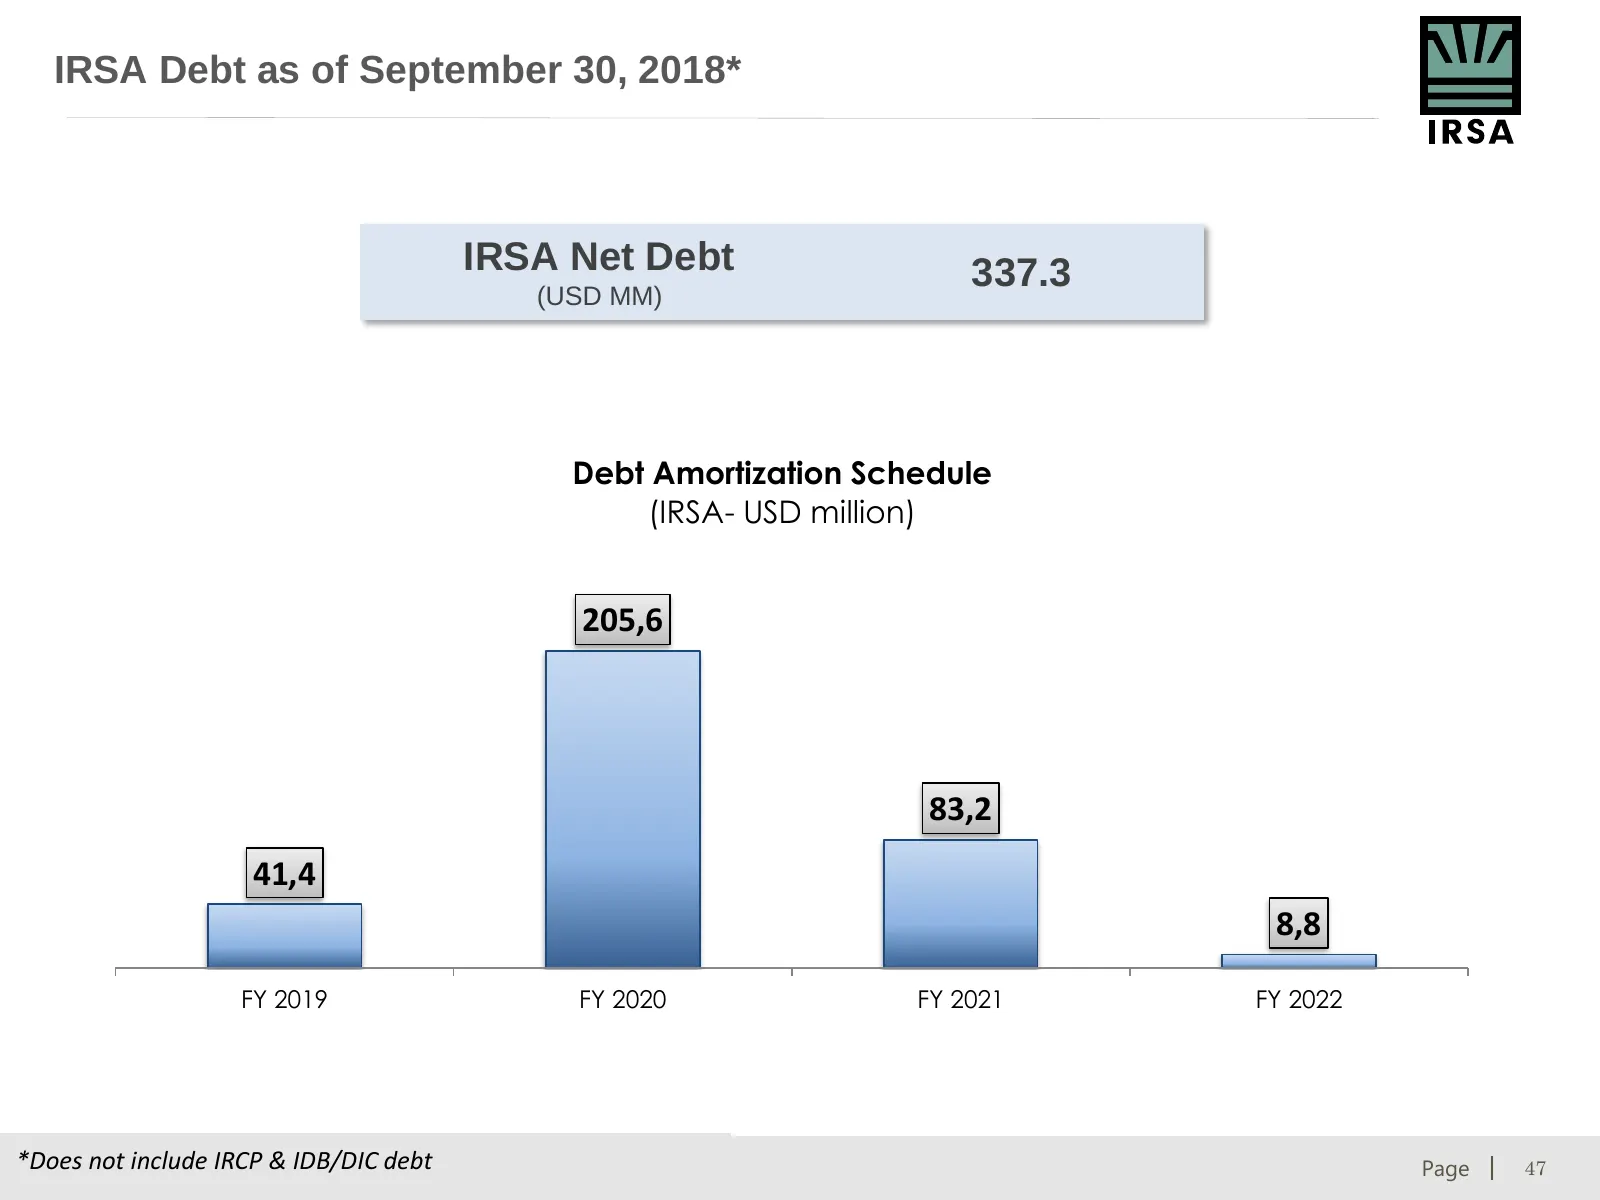
IRSA Debt as of September 30, 2018* IRSA Net Debt 337.3 (USD MM) Debt Amortization Schedule (IRSA- USD million) 205,6 83,2 41,4 8,8 FY 2019 FY 2020 FY 2021 FY 2022 *Does not © 2017 include IRCP CRESUD. & IDB/DIC All rights debt reserved. Page 47
Slide 48: CRESUD Stand Alone Debt as of September 30, 2018
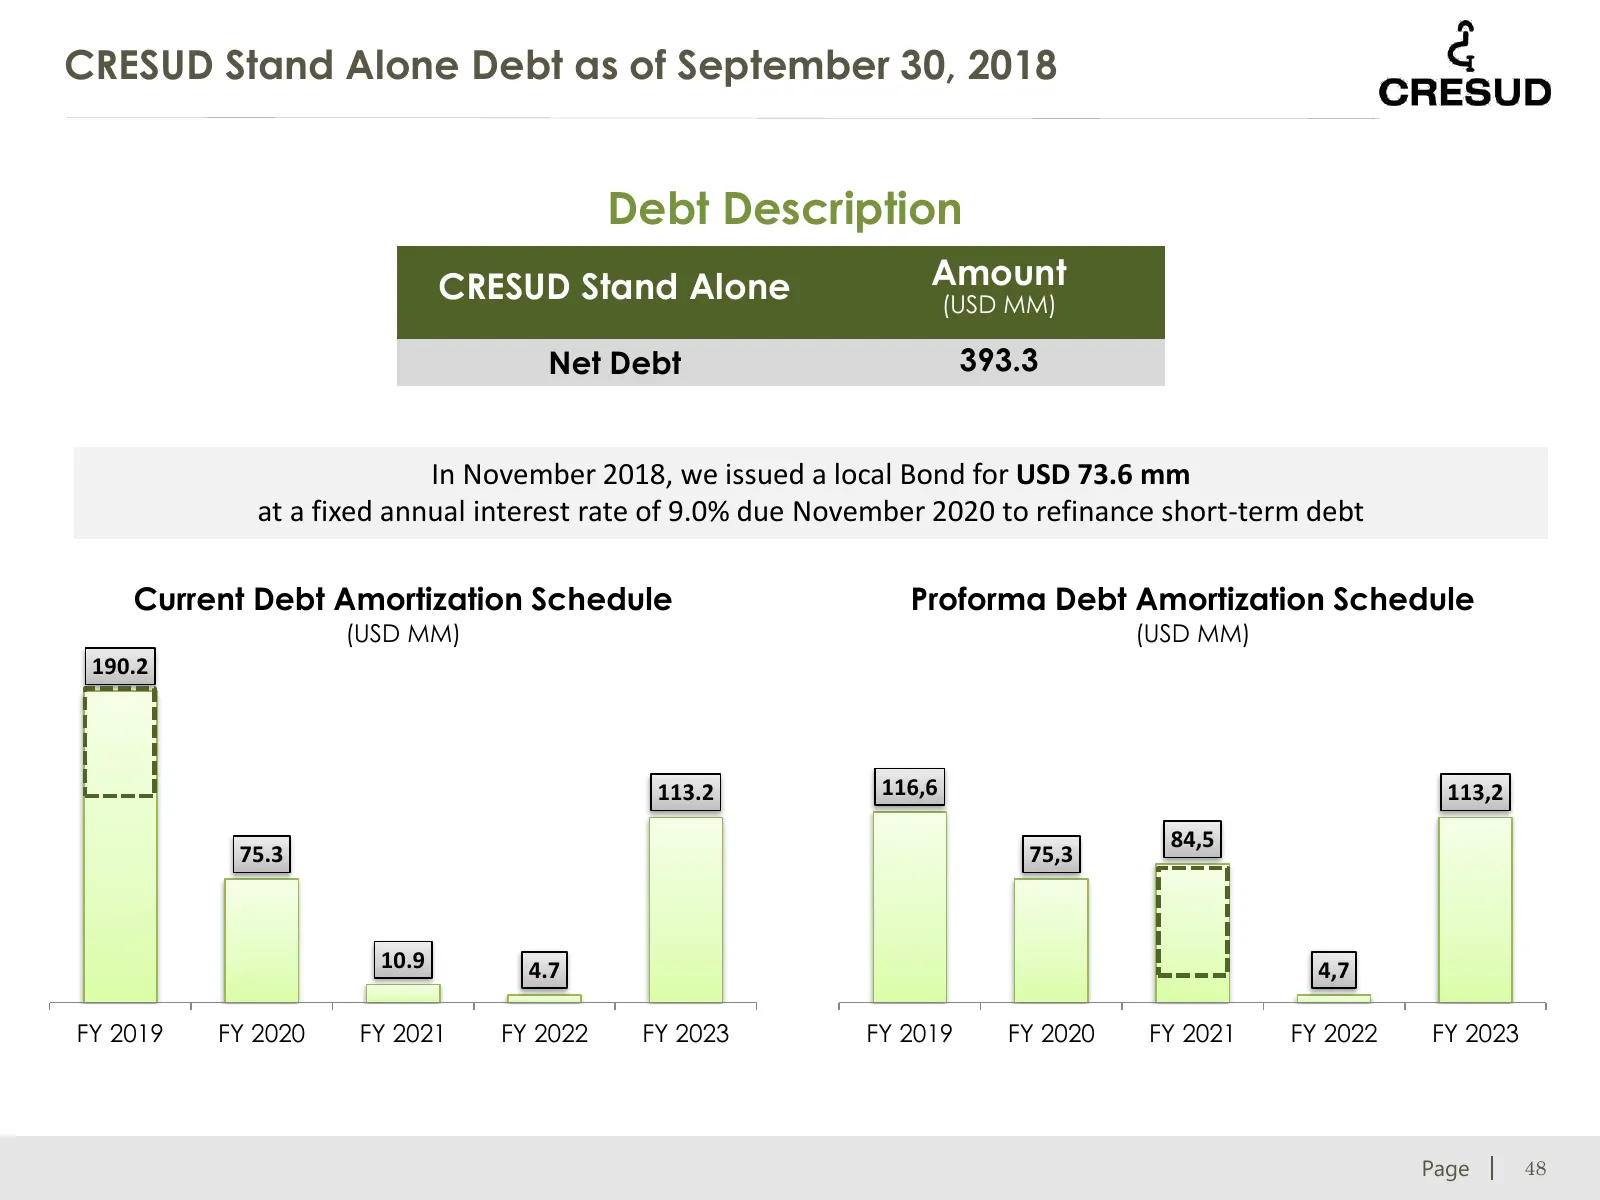
CRESUD Stand Alone Debt as of September 30, 2018 Debt Description CRESUD Stand Alone Amount (USD MM) Net Debt 393.3 In November 2018, we issued a local Bond for USD 73.6 mm at a fixed annual interest rate of 9.0% due November 2020 to refinance short-term debt Current Debt Amortization Schedule Profo

Slide 49: Thanks!
Thanks! © 2017 CRESUD. All rights reserved. Page 49
Source: Internet Archive copy of irsa.com.ar
More decks from Cresud SA
 Cresud S.A.C.I.F. y A. — Q1 2027 Earnings Presentation17 slides · Nov 13, 2026
 Investor Presentation (November 2026)25 slides · November 2026
 FY2026 Earnings Presentation22 slides · Sep 8, 2026
 Cresud S.A.C.I.F. y A. — Q3 2026 Earnings Presentation16 slides · May 8, 2026
 Investor Presentation (2026)21 slides · 2026
 Investor Presentation (2026)26 slides · 2026