Aegion — Oppenheimer 8th Annual Industrial Growth Summit (May 2013)
26 slides from Aegion's conference presentation, May 15, 2013
Slide 1: Oppenheimer 8th Annual Industrial Growth Summit
if AEGION We protect pipe. Oppenheimer 8th Annual Industrial Growth Summit May 15, 2013
Slide 2: Safe Harbor
Safe Harbor The Private Securities Litigation Reform Act of 1995 provides a “safe harbor” for forward looking statements. The Company makes forward-looking statements in this Investor Presentation that represent the Company’s beliefs or expectations about future events or financial performance. Thes
Slide 3: At Aegion, We Protect Infrastructure — Primarily Pipelines
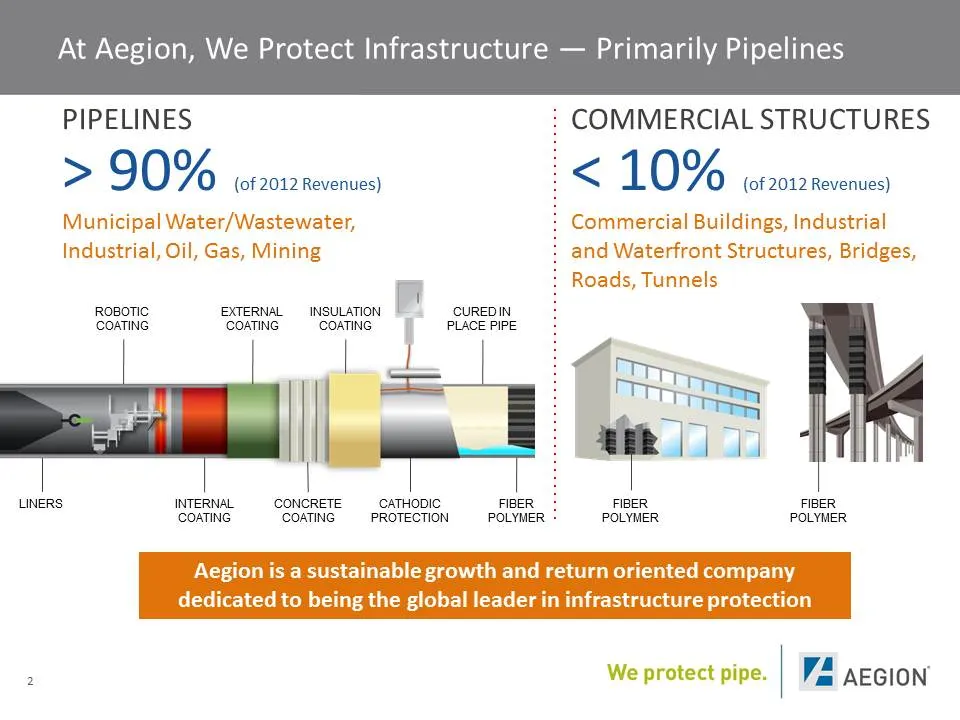
At Aegion, We Protect Infrastructure — Primarily Pipelines PIPELINES : COMMERCIAL STRUCTURES > 90% (of 2012 Revenues) < 10% (of 2012 Revenues) sea j zh ere ae pure a ROBOTIC EXTERNAL INSULATION | ‘CURED IN COATING ‘COATING ‘COATING PLACE PIPE cat LINERS INTERNAL coe CATHODIC FIBER! ‘COATING COATING
Slide 4: Aegion Participates in Key Global End Markets
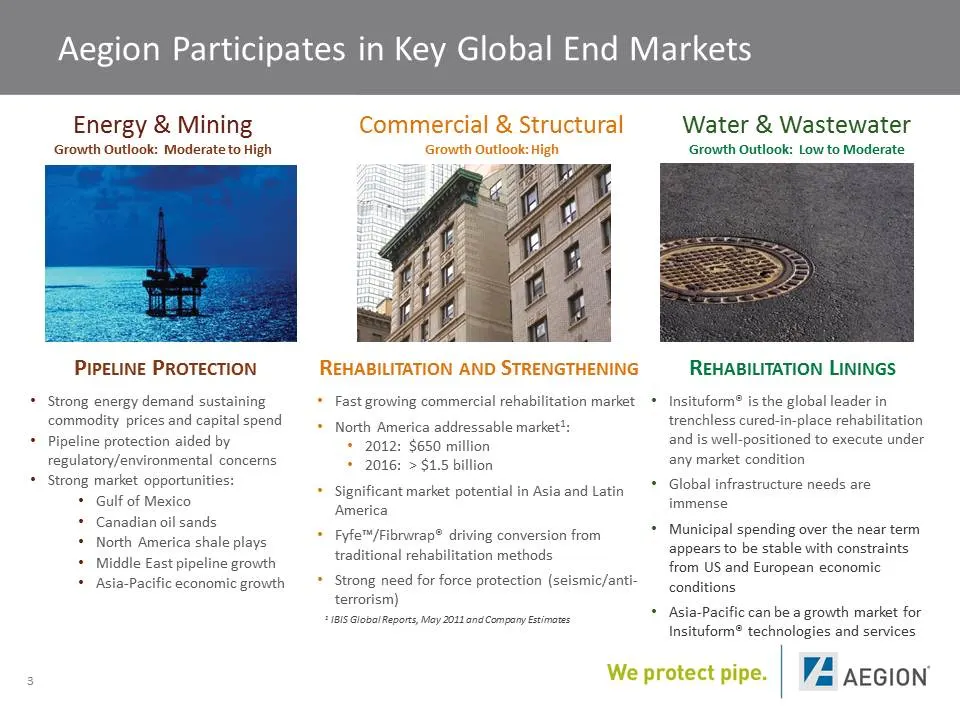
Aegion Participates in Key Global End Markets Energy & Mining Growth Outlook: Moderate to High PIPELINE PROTECTION Strong energy demand sustaining commodity prices and capital spend Pipeline protection aided by regulatory/environmental concerns Strong market opportuni * Gulf of Mexico * Canadian oll
Slide 5: What Is It We Do Well?
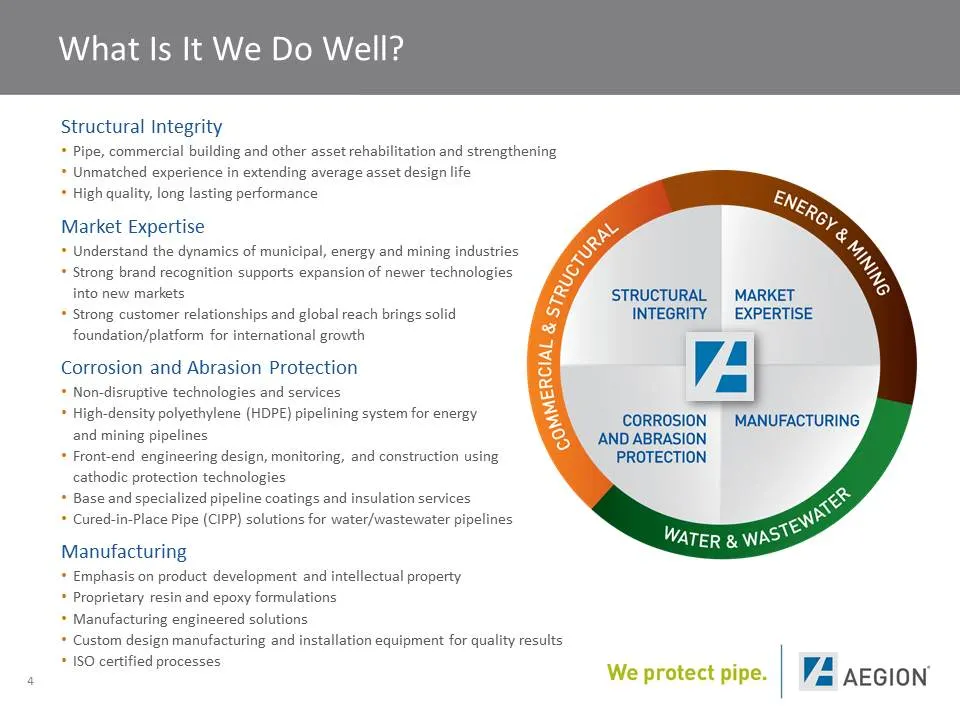
What Is It We Do Well? Structural Integrity * Pipe, commercial building and other asset rehabilitation and strengthening + Unmatched experience in extending average asset design life * High quality, long lasting performance Market Expertise * Understand the dynamics of municipal, energy and mining i
Slide 6: Diversification Strategy Provides Margin Expansion
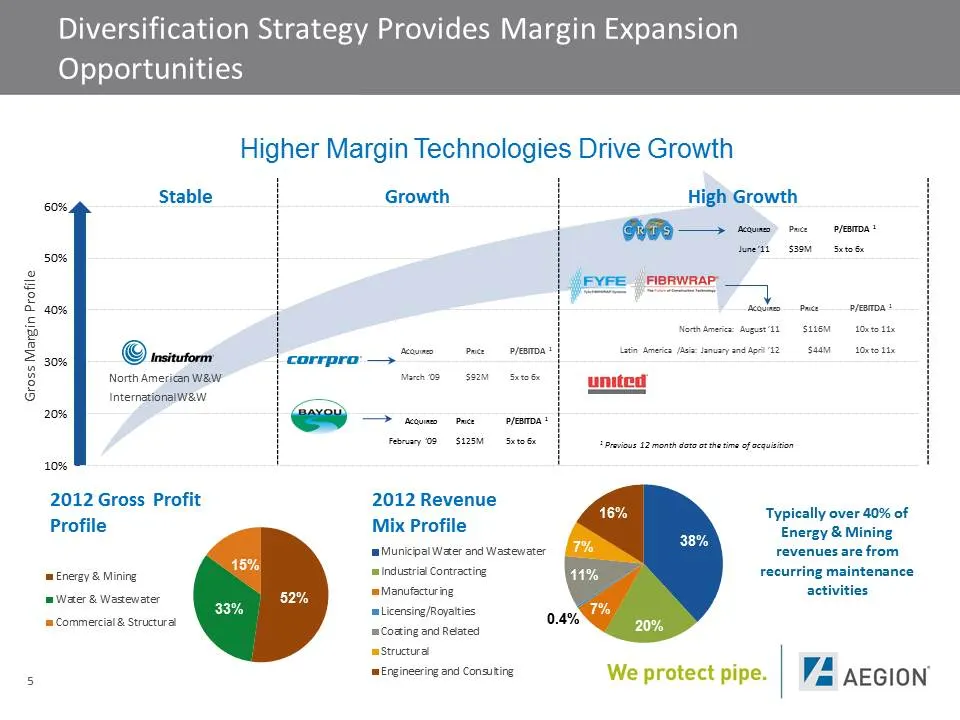
Diversification Strategy Provides Margin Expansion Opportunities Higher Margin Technologies Drive Growth i H H i — Stable : Growth : High Growth i i H ' t | | -_ i 50% H 7 = t ° H 7 H = H - t g i i | & 40% i i sealhe pace oramoa ——j S i i sue socette | £ i recumo Pree fea? | san sorsette = ae © sesi
Slide 7: Energy & Mining Has Powerful Pipe Protection Products
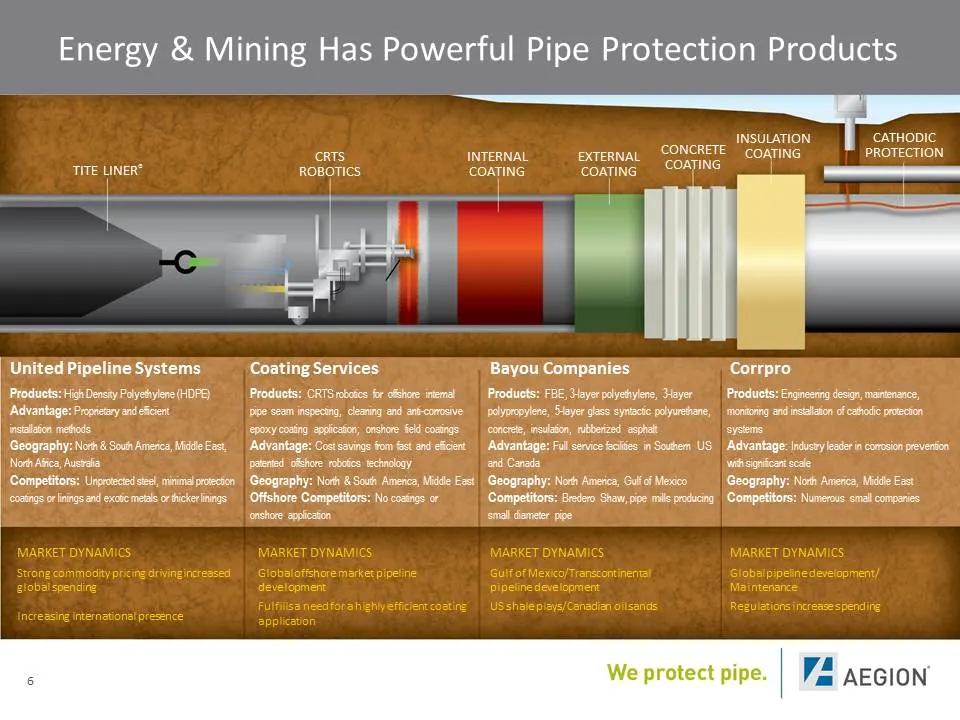
Energy & Mining Has Powerful Pipe Protection Products TITE LINER? United Pipeline Systems Products: High Densty Polyethylene (HOPE) Advantage: Prostetry and ecient insalaion mehods Geography: Norh & Souh America, Mile East, Noch fica, Ausra Competitors: Unprecte sec, mirimalpriecion casings or ings
Slide 8: Strong Demand for Energy Drives Expected Near Term Pipeline Spend
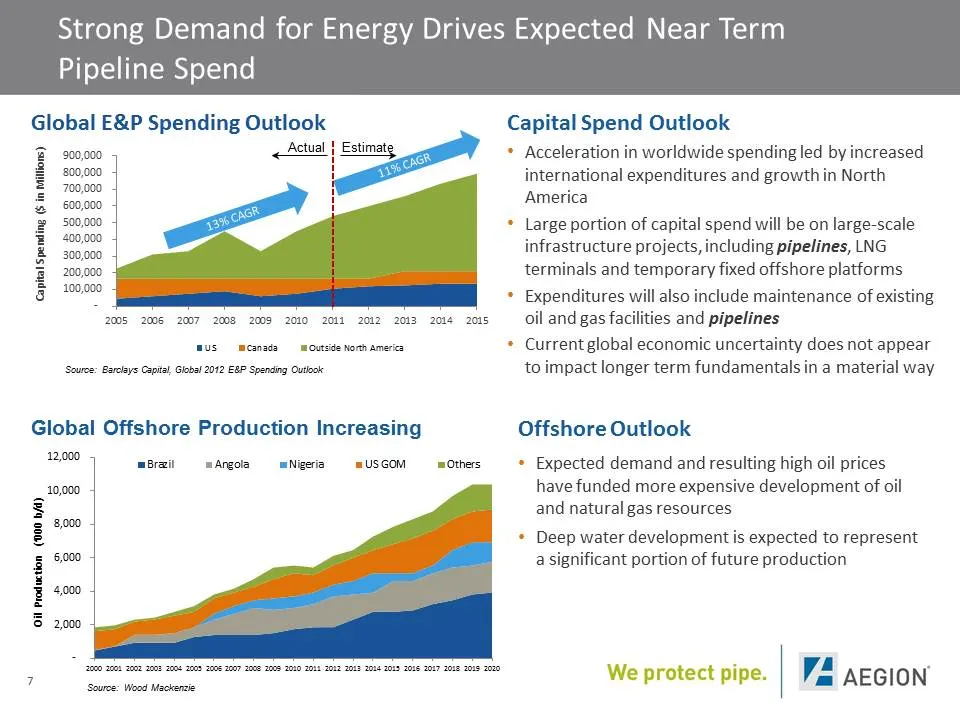
Strong Demand for Energy Drives Expected Near Term Pipeline Spend Global E&P Spending Outlook sania Actual | Estimate 800,000 700,000 600,000 500,000 400,000 300,000 200,000 100,000 Capital Spending ($ in millions) Ee 2005 2006 2007 208 2009 2010 2011 2012 2013 2014 2015 wus mcanads_mOutsde North am
Slide 9: Energy & Mining Technologies Help to Protect and Extend Pipeline Useful Life
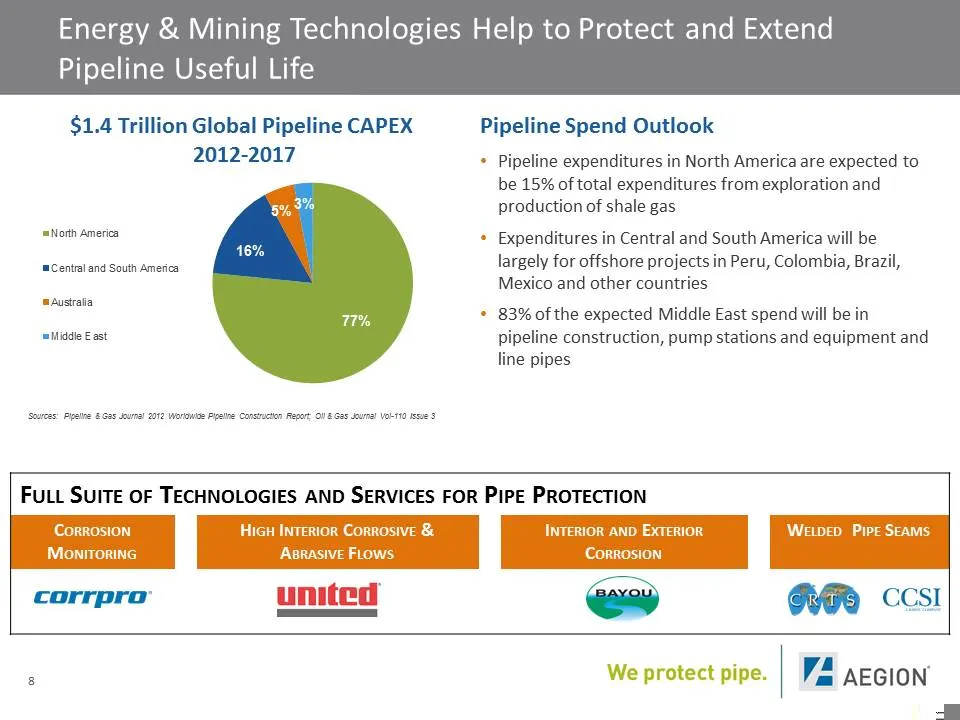
Energy & Mining Technologies Help to Protect and Extend Pipeline Useful Life $1.4 Trillion Global Pipeline CAPEX Pipeline Spend Outlook 2012-2017 * Pipeline expenditures in North America are expected to be 15% of total expenditures from exploration and production of shale gas ‘=North America * Expen
Slide 10: Energy & Mining Can Access Powerful Markets
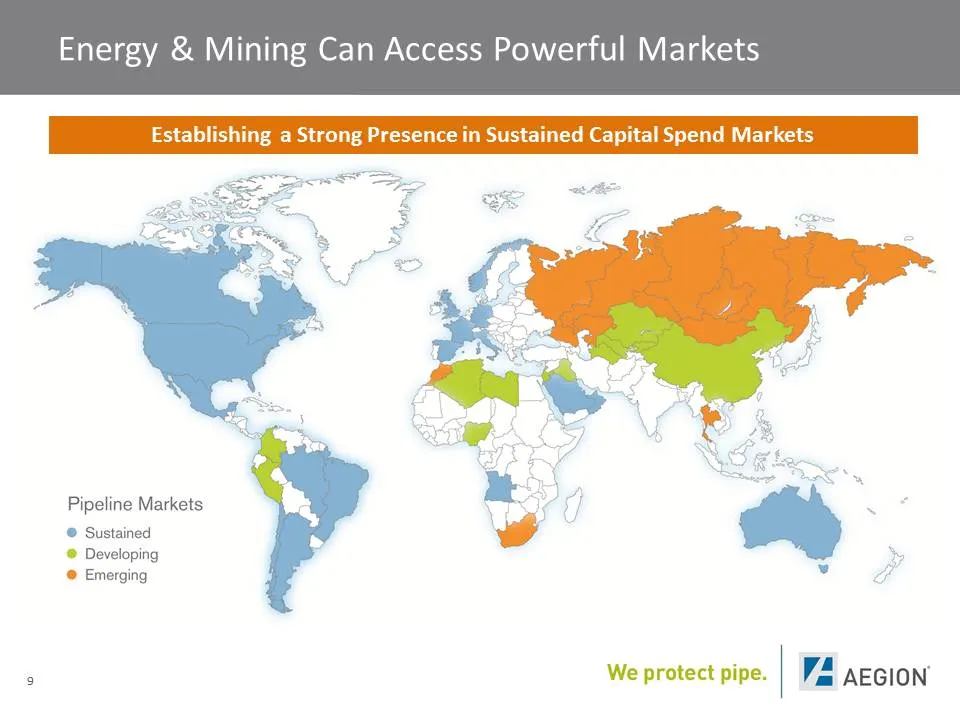
Energy & Mining Can Access Powerful Mar Establishing a Strong Presence in Sustained Capital Spend Markets Pipeline Markets © Sustained © Developing © Emerging VE AEGION 5 We protect pipe.
Slide 11: Fibrwrap® Redefining Standards for Structural Rehabilitation
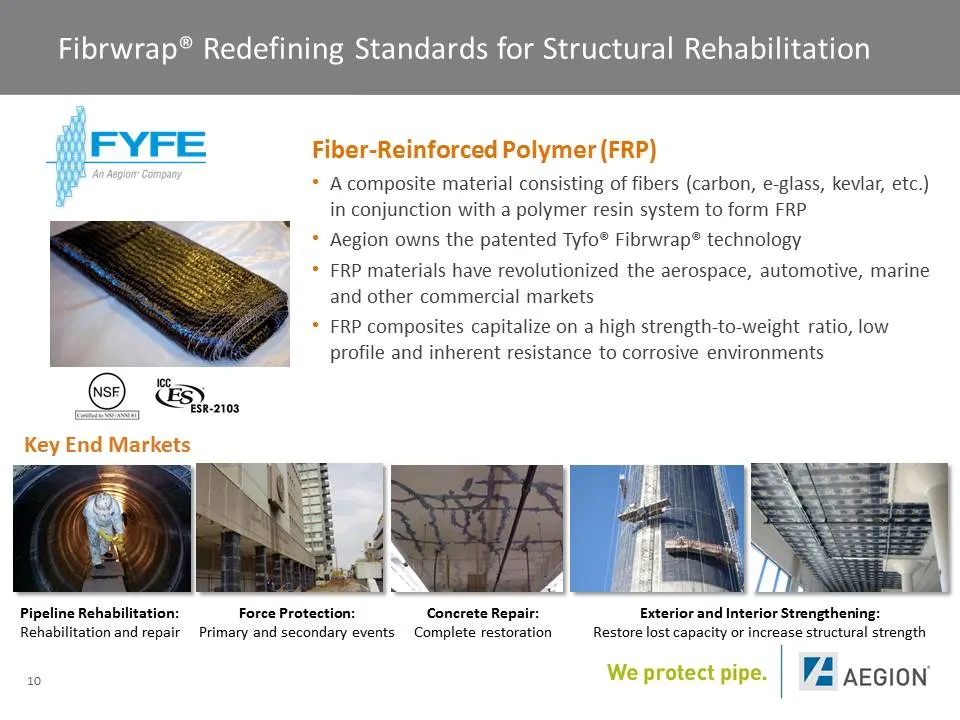
Fibrwrap® Redefining Standards for Structural Rehabilitation Fiber-Reinforced Polymer (FRP) * Acomposite material consisting of fibers (carbon, e-glass, kevlar, etc.) in conjunction with a polymer resin system to form FRP. * Aegion owns the patented Tyfo® Fibrwrap® technology J * FRP materials have
Slide 12: Annual $200+ Million North American Fiber-Reinforced Polymer Market
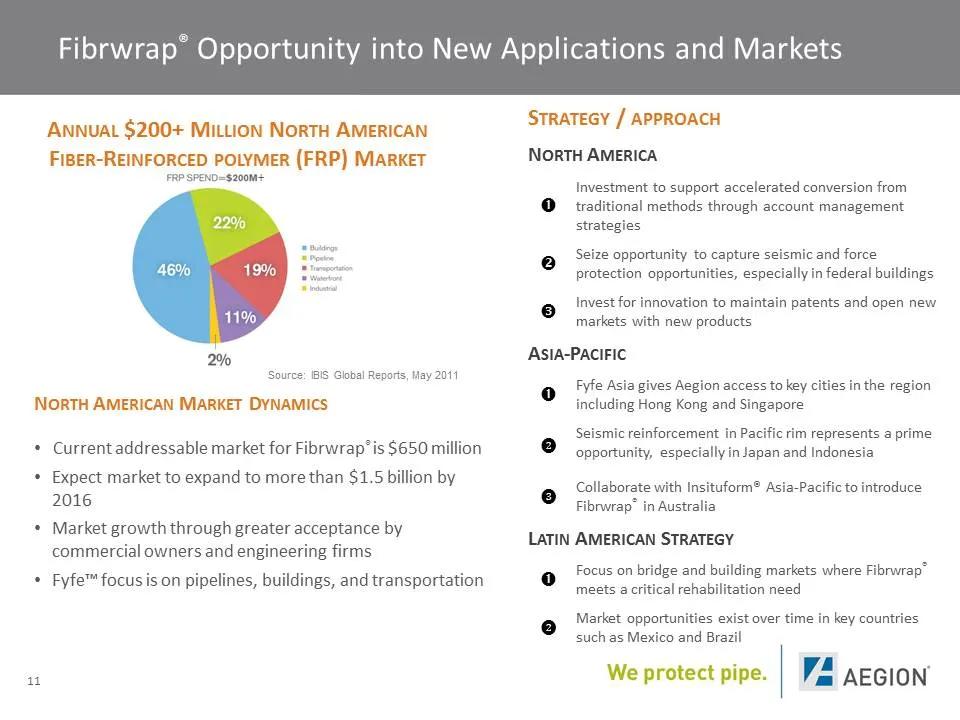
ANNUAL $200+ MILLION NoRTH AMERICAN FIBER-REINFORCED POLYMER (FRP) MARKET FRP SPEND=$200%+ 46% Source: IBIS Global Reports, May 2011 NorTH AMERICAN MARKET DYNAMICS * Current addressable market for Fibrwrap’ is $650 million * Expect market to expand to more than $1.5 billion by 2016 + Market growth t
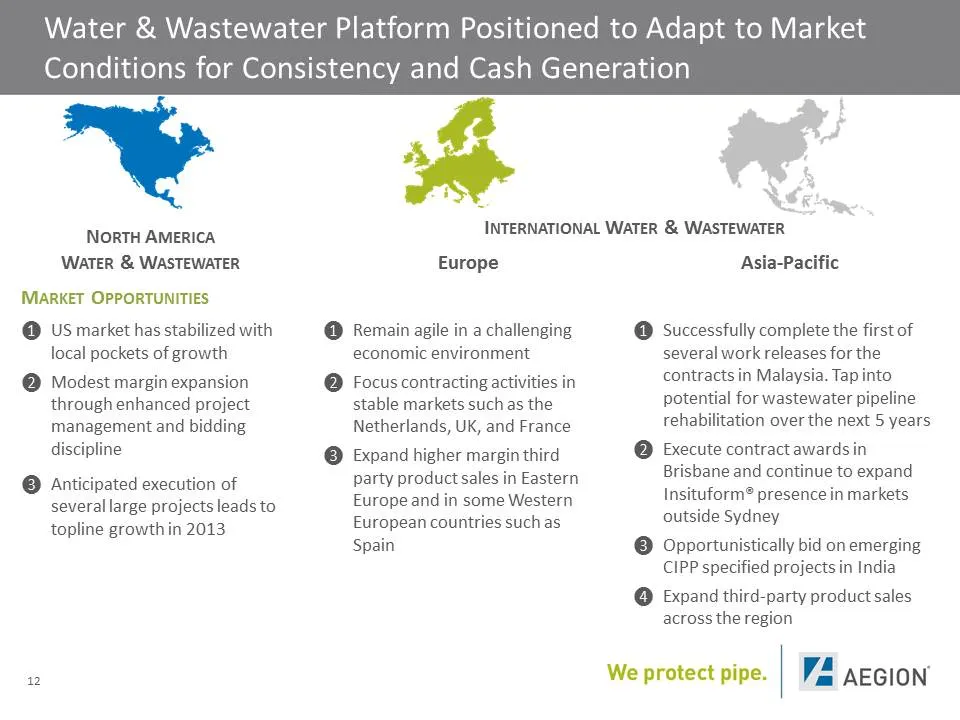
Slide 13: Water & Wastewater Platform Positioned to Adapt to Market Conditions
Water & Wastewater Platform Positioned to Adapt to Market Conditions for Consistency and Cash Generation NorTH AMERICA WATER & WASTEWATER MARKET OPPORTUNITIES @ US market has stabilized with local pockets of growth @ Modest margin expansion through enhanced project management and bidding discipline
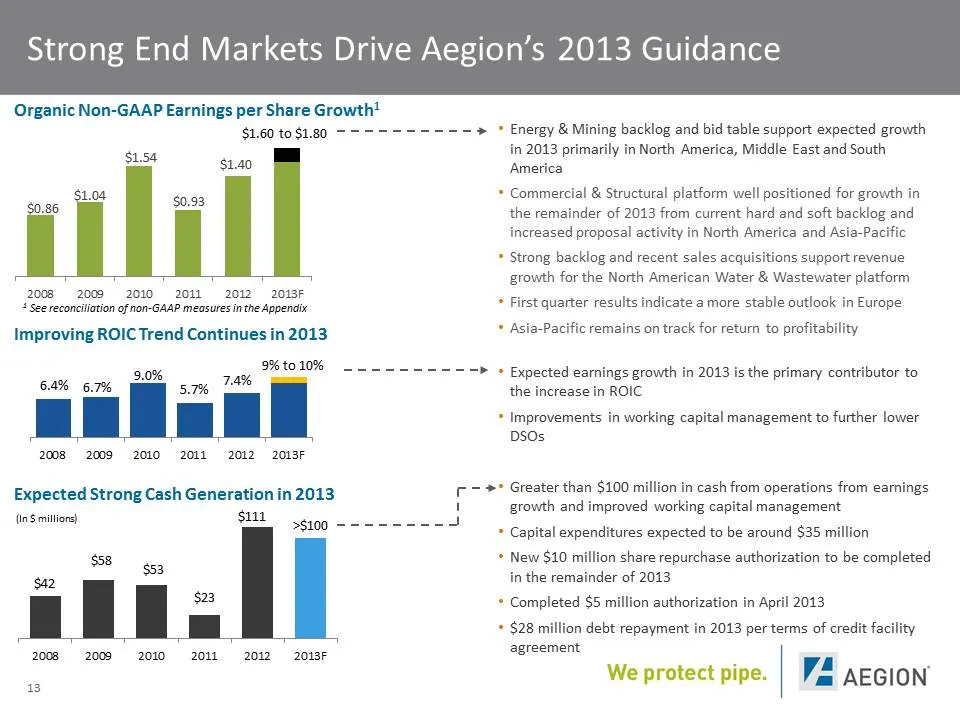
Slide 14: Strong End Markets Drive Aegion's 2013 Guidance
Strong End Markets Drive Aegion’s 2013 Guidance Organic Non-GAAP Earnings per Share Growth? $1.60 to $1.80 2008 + See reconciliation of non-GAAP measures in the Appendix Improving ROIC Trend Continues in 2013 2009-2010 2011 2012-2013F 9%to10% 9.0% 7.8% wae zoos 2009 2010 2011 2012 2013F Expected Str
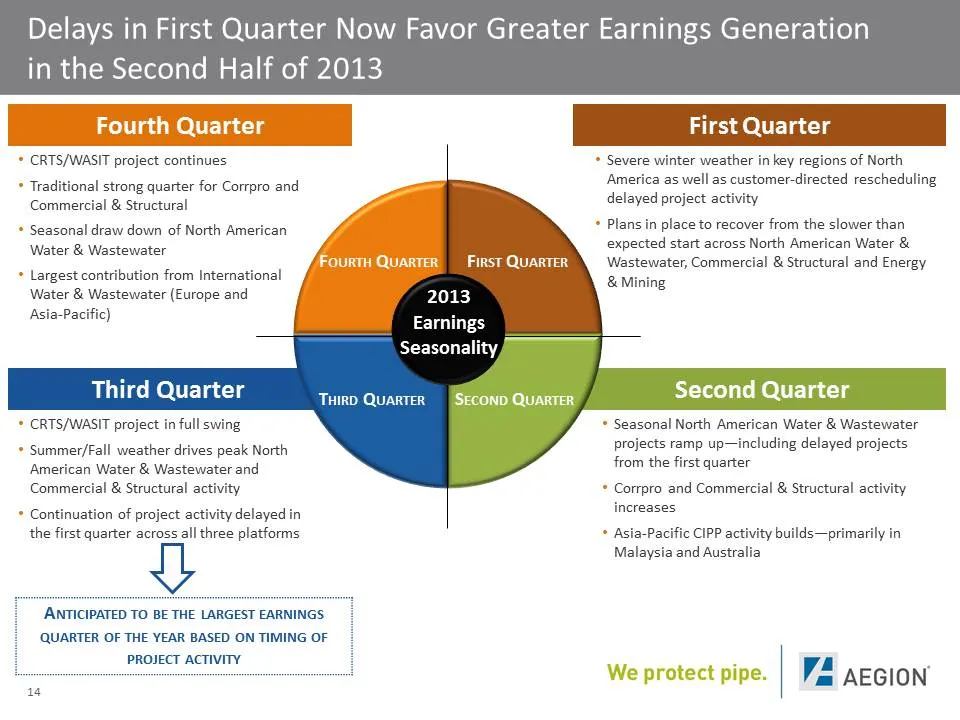
Slide 15: Delays in First Quarter Now Favor Greater Earnings Generation in Second Half of 2013
Delays in First Quarter Now Favor Greater Earnings Generation in the Second Half of 2013 Severe winter weather in key regions of North America as well as customer-directed rescheduling delayed project activity * CRTS/WASIT project continues + Traditional strong quarter for Corrpro and Commercial & S
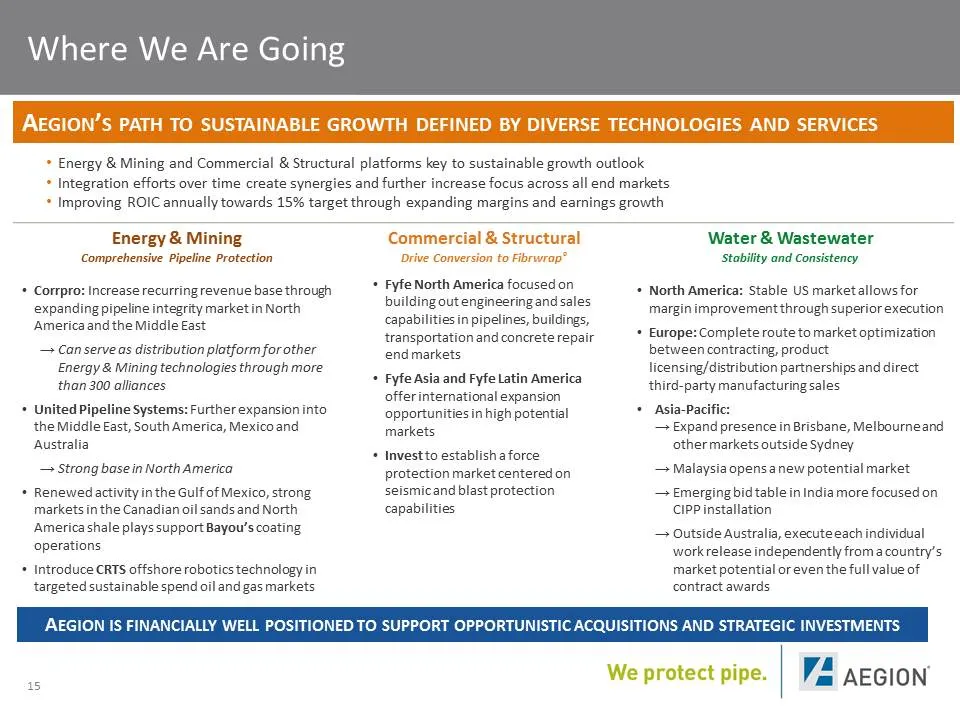
Slide 16: Where We Are Going
Where We Are Going Energy & Mining and Commercial & Structural platforms key to sustainable growth outlook + Integration efforts over time create synergies and further increase focus across all end markets * Improving ROIC annually towards 15% target through expan Energy & Mining Comprehensive Pipel
Slide 17: Appendix
Appendix We protect pipe. | Va AEGION’
Slide 18: Robust End Markets Drive Energy & Mining Growth in 2013
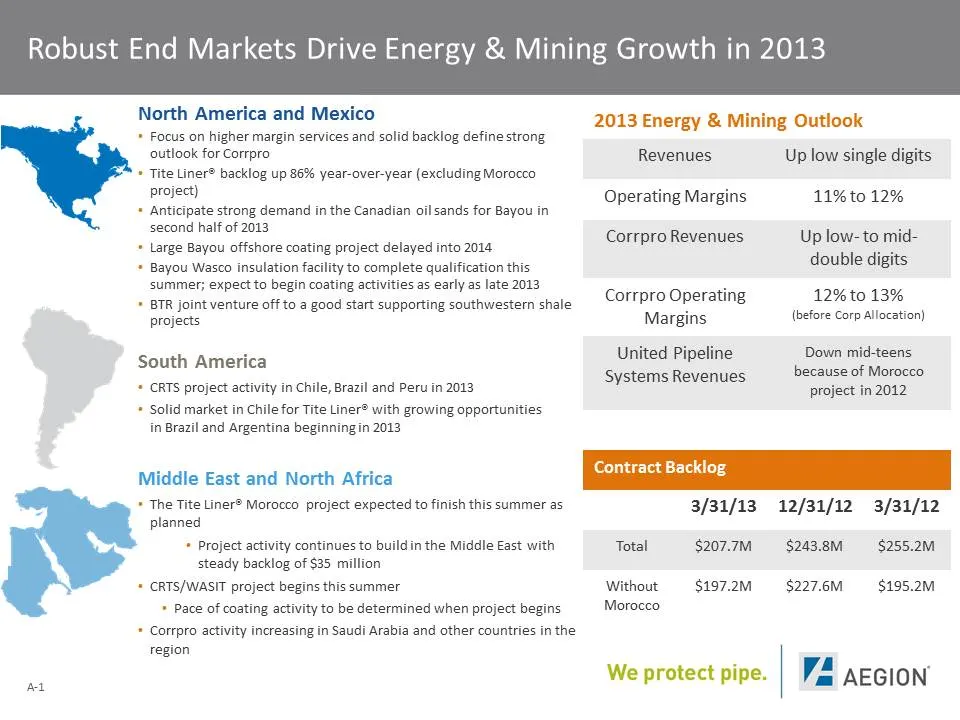
Robust End Markets Drive Energy & Mining Growth in 2013 North America and Mexico 2013 Energy & Mining Outlook + Focus on higher margin services and solid backlog define strong outlook for Corrpro Revenues Up low single digits + Tite Liner® backlog up 86% year-over-year (excluding Morocco project) Op
Slide 19: Stable End Markets Support Outlook for Higher Profits from Water & Wastewater Platform in 2013
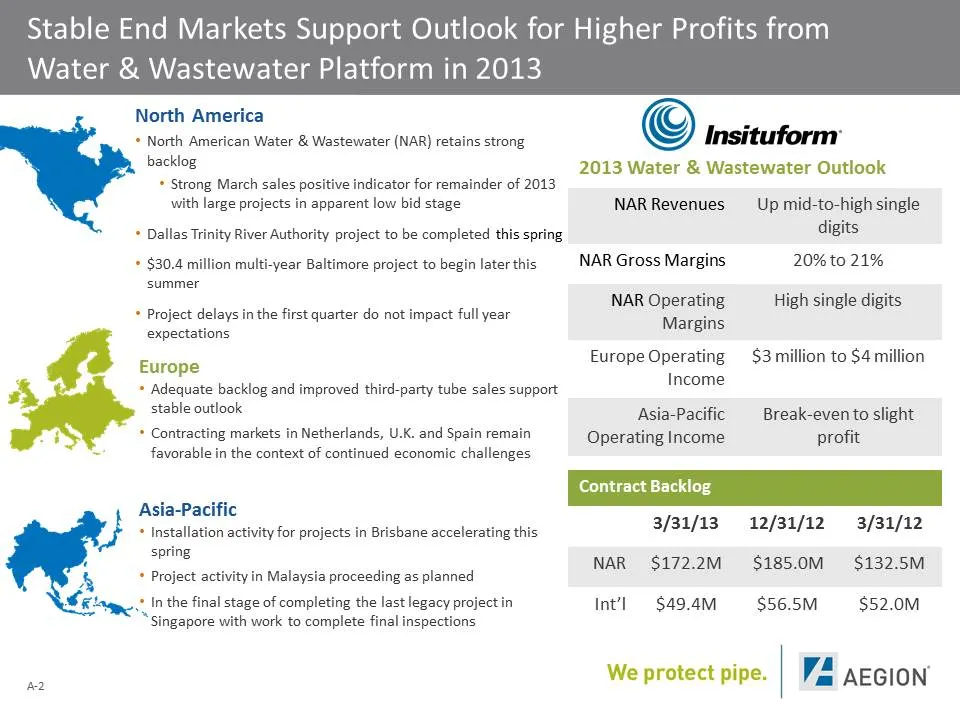
Stable End Markets Support Outlook for Higher Profits from Water & Wastewater Platform in 2013 North America . + North American Water & Wastewater (NAR) retains strong Insituform’ backlog 2013 Water & Wastewater Outlook + Strong March sales positive indicator for remainder of 2013 with large project
Slide 20: Delays in the First Quarter Do Not Alter Favorable Outlook in 2013 for Commercial & Structural
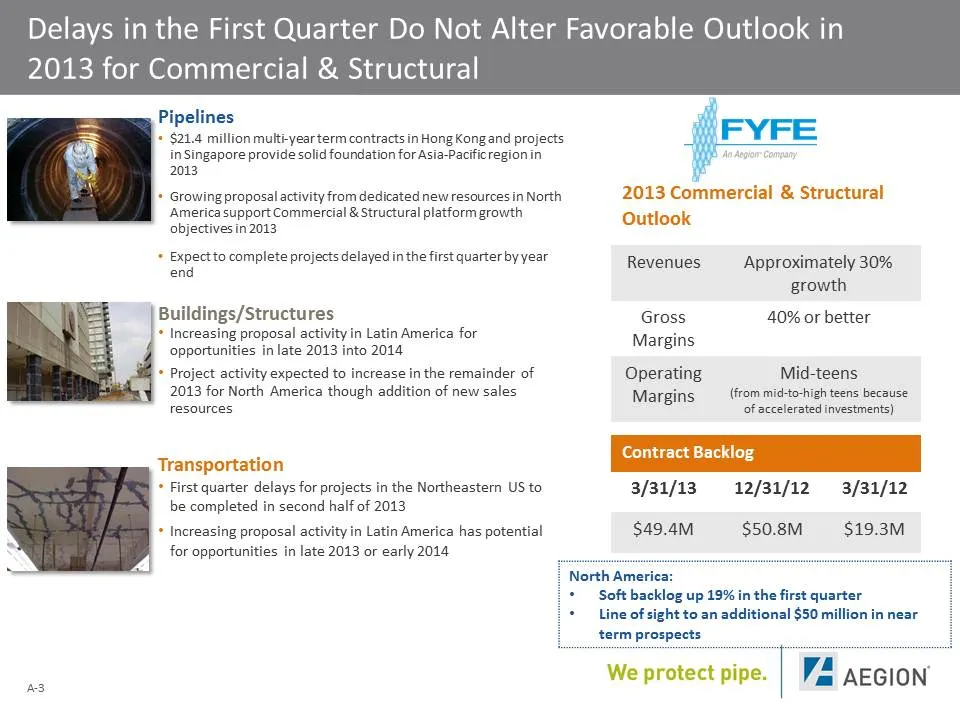
Delays in the First Quarter Do Not Alter Favorable Outlook in 2013 for Commercial & Structural Pipelines + $21.4 million multi-yearterm contractsin HongKong and projects in Singapore provide solid foundation for Asia-Pacificregion in 2013 Growing proposal activity from dedicated new resources in Nor
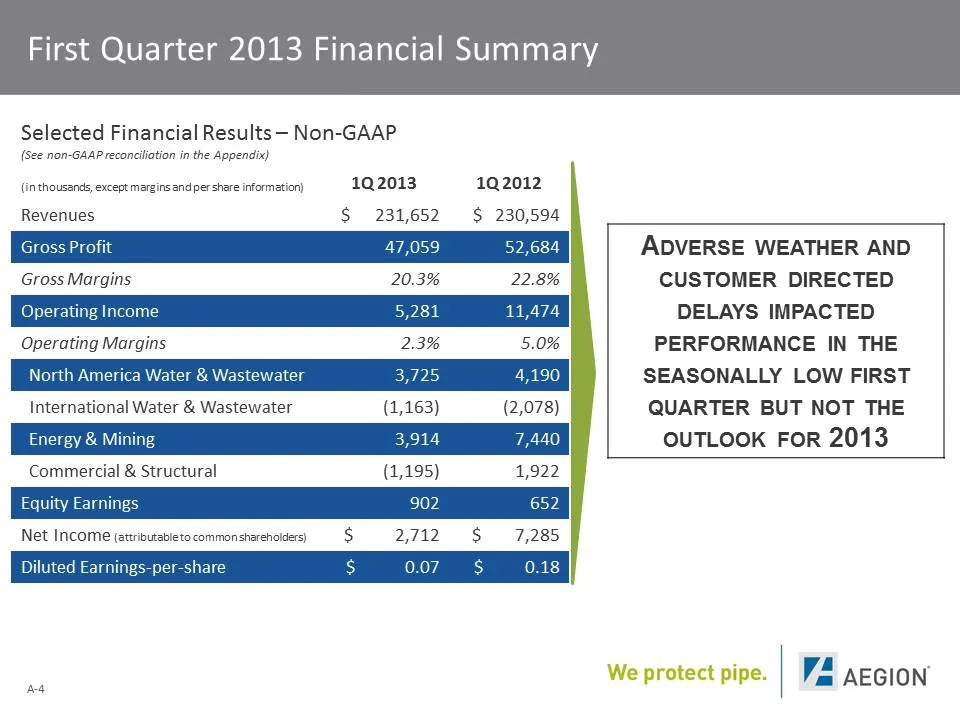
Slide 21: First Quarter 2013 Financial Summary
First Quarter 2013 Financial Summary Selected Financial Results— Non-GAAP (see non-GAAP reconciliation in the Appendix) {in thousands, except margins and per share information} 1Q2013 1Q2012 Revenues S$ 231,652 $ 230,594 Gross Profit 47,059 52,684 ADVERSE WEATHER AND Gross Margins 20.3% 22.8% CUSTOM
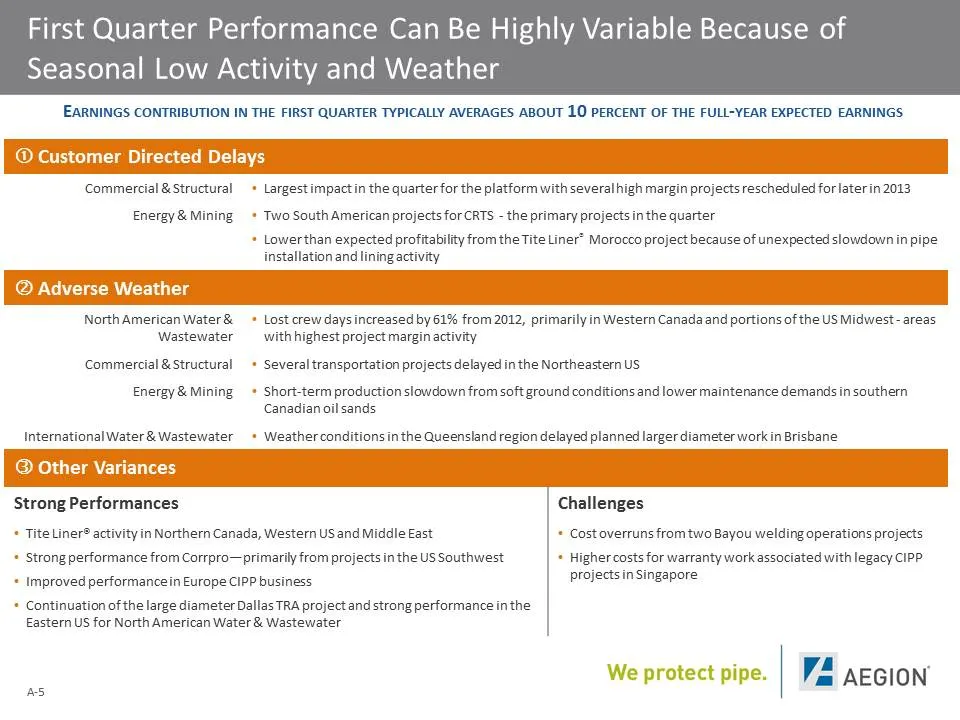
Slide 22: First Quarter Performance Can Be Highly Variable Because of Seasonal Low Activity and Weather
First Quarter Performance Can Be Highly Variable Because of Seasonal Low Activity and Weather EARNINGS CONTRIBUTION IN THE FIRST QUARTER TYPICALLY AVERAGES ABOUT 10 PERCENT OF THE FULL-YEAR EXPECTED EARNINGS Commercial &Structural + Largest impactin the quarter for the platform with several high mar
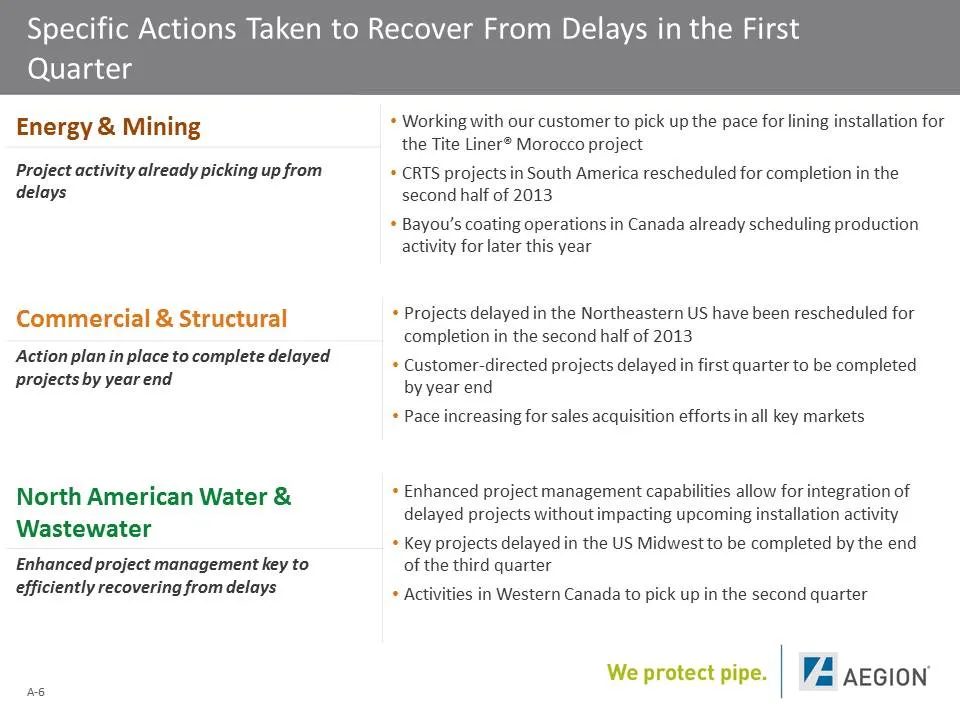
Slide 23: Specific Actions Taken to Recover From Delays in the First Quarter
Specific Actions Taken to Recover From Delays in the First Quarter Energy & Mining Project activity already picking up from delays Commercial & Structural Action plan in place to complete delayed projects by yearend North American Water & Wastewater Enhanced project management key to efficiently rec
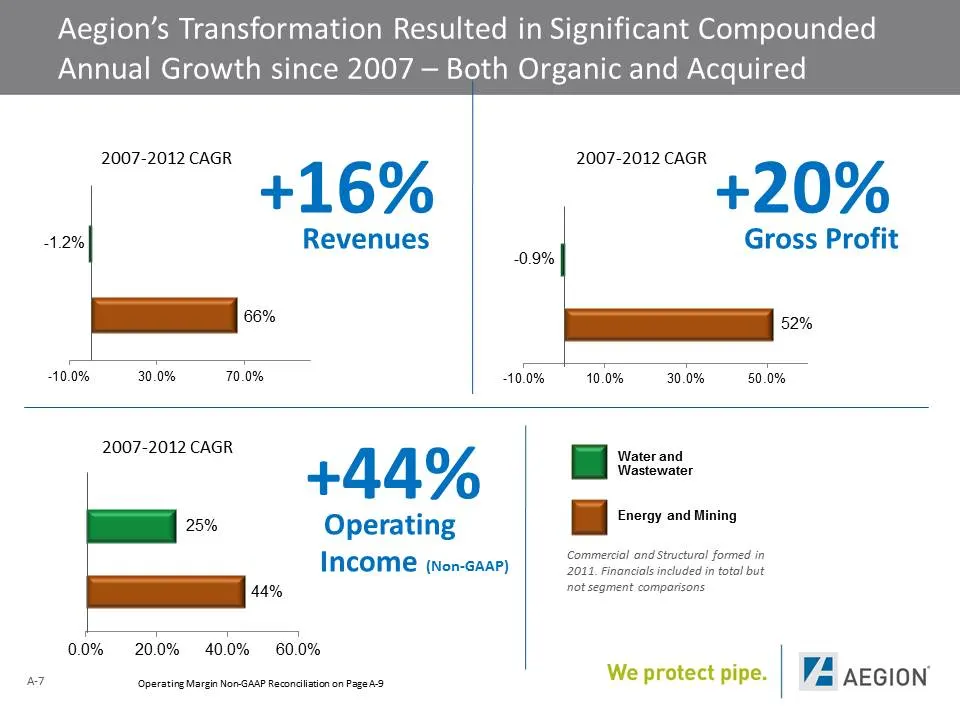
Slide 24: Aegion's Transformation Resulted in Significant Compounded Annual Growth since 2007
Aegion’s Transformation Resulted in Significant Compounded Annual Growth since 2007 — Both Organic and Acquired 2007-2012 CAGR 0 +16% 1.2% 66% 10.0% 30.0% 70.0% 10.0% 2007-2012 CAGR +20% Gross Profit 52% 10.0% 30.0% 50.0% 2007-2012 CAGR 0 +44% 25% Operating INCOME (won-saar) 44% 0.0% 200% 400% 60.0%
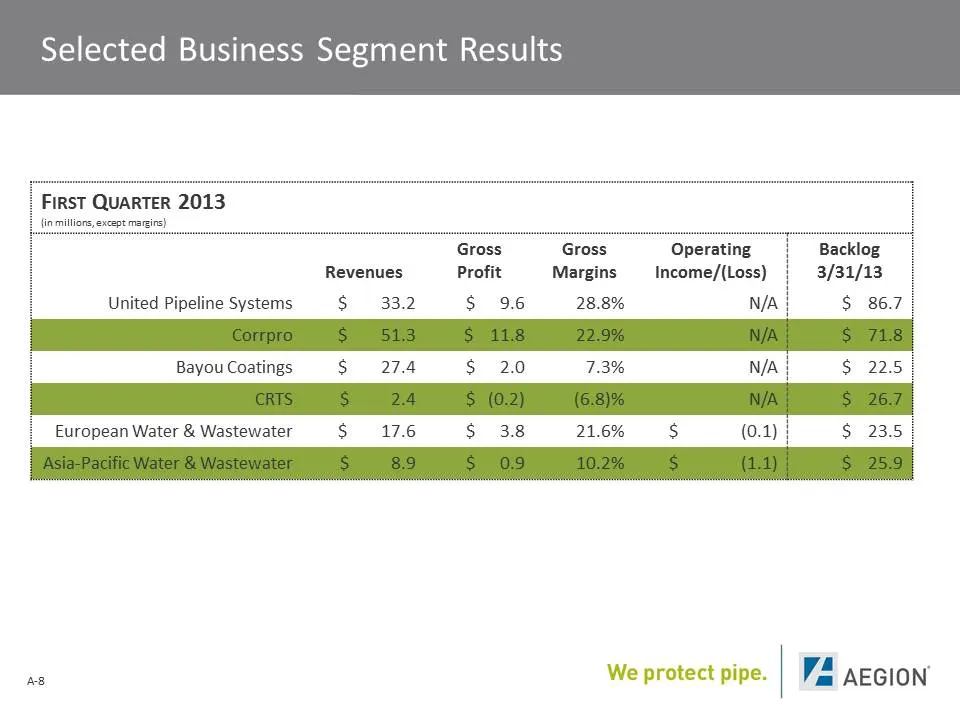
Slide 25: Selected Business Segment Results
Selected Business Segment Results FiRsT QUARTER 2013 lions, except margins) | Gross Gross Operating Backlog i Revenues Profit Margins —Income/(Loss) | 3/31/13 i United Pipeline Systems $ 33.2 S$ 9.6 28.8% N/A i S$ 86.7) i Bayou Coatings S$ 27.4 $ 20 7.3% N/A i $ 22.5) | European Water & Wastewater $
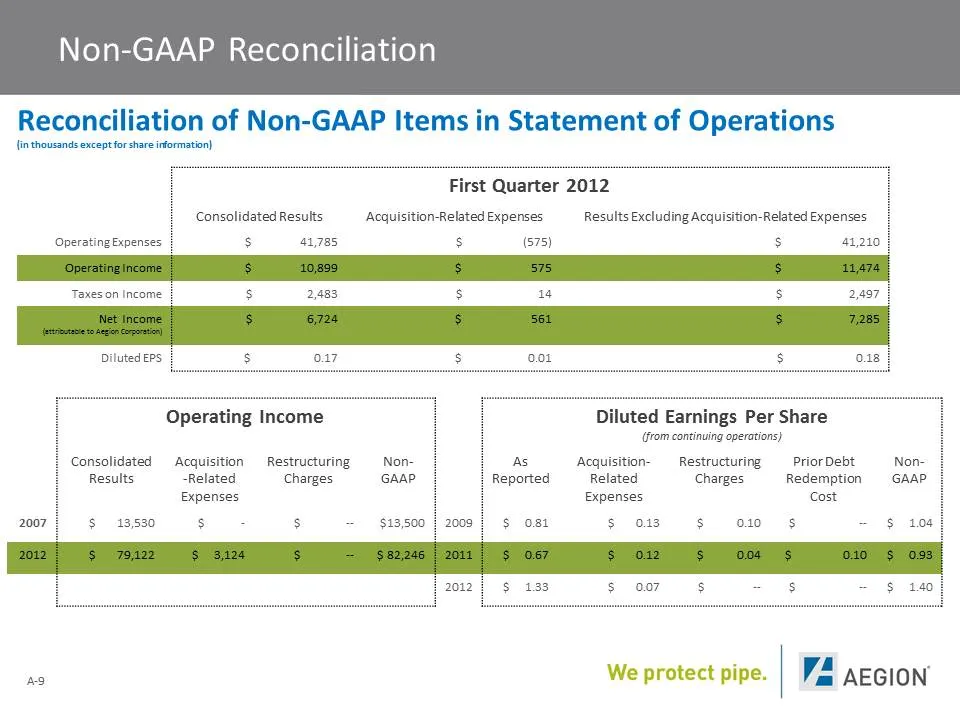
Slide 26: Non-GAAP Reconciliation
Non-GAAP Reconciliation Reconciliation of Non-GAAP It {in thousands except for share information} First Quarter 2012 Consolidated Results Acquisition-Related Expenses Results Excluding Acquisition-Related Expenses Operating Expenses $ 41,785 $ (575) $ 41,210 ‘axes on Income $ 2,483 s 14 s 2,497 | lu
Source: SEC EDGAR · 8-K filed May 15, 2013
More decks from Aegion Corporation
 D.A. Davidson Annual Diversified Industrials & Services Conference 202011 slides · Sep 22, 2020
 2020 Stifel Cross Sector Insight Conference9 slides · Jun 10, 2020
 Investor Presentation (March 2020)20 slides · Mar 4, 2020
 D.A. Davidson Annual Diversified Industrials & Services Conference 201930 slides · Sep 19, 2019
 Investor Presentation (August 2019)28 slides · Aug 1, 2019
 2019 Stifel Cross Sector Insight Conference18 slides · Jun 12, 2019