AMAG Pharmaceuticals — JP Morgan Healthcare Conference 2013
32 slides from AMAG Pharmaceuticals's conference presentation, Jan 7, 2013
Slide 1: AMAG Pharmaceuticals JP Morgan Healthcare Conference January 2013
AMAG PHARMACEUTICALS JP Morgan Healthcare Conference January 2013
Slide 2: Forward Looking Statements
FORWARD LOOKING STATEMENTS This presentation contains forward-looking statements within the meaning of the Private Securities Litigation Reform Act of 1995 and other federal securities laws. Any statements contained herein which do not describe historical facts, including but not limited to: (i) our
Slide 3: AMAG: 2012 Highlights
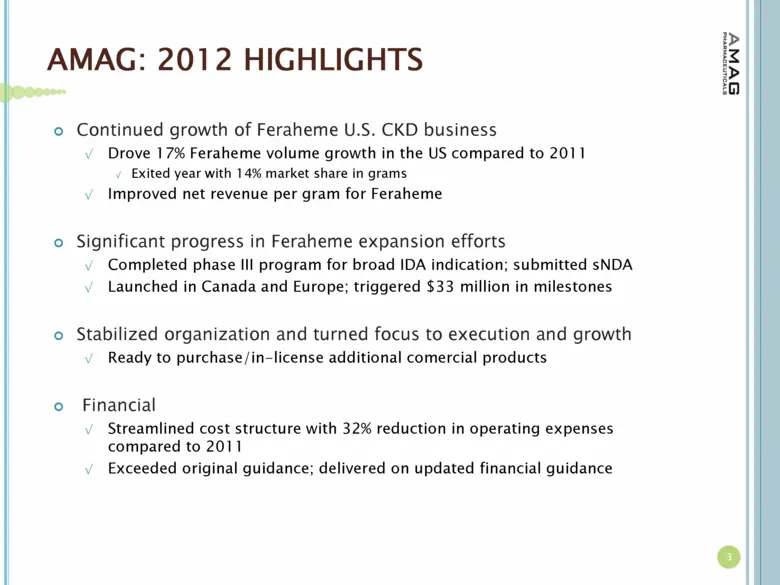
AMAG: 2012 HIGHLIGHTS Continued growth of Feraheme U.S. CKD business Drove 17% Feraheme volume growth in the US compared to 2011 Exited year with 14% market share in grams Improved net revenue per gram for Feraheme Significant progress in Feraheme expansion efforts Completed phase III program for br
Slide 4: Marketed Product Feraheme (ferumoxytol) Injection
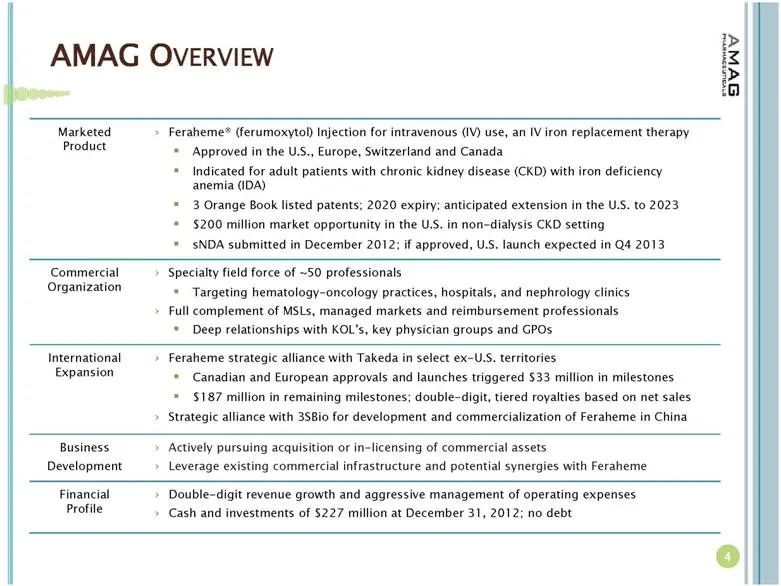
Marketed Product Feraheme® (ferumoxytol) Injection for intravenous (IV) use, an IV iron replacement therapy Approved in the U.S., Europe, Switzerland and Canada Indicated for adult patients with chronic kidney disease (CKD) with iron deficiency anemia (IDA) 3 Orange Book listed patents; 2020 expiry;
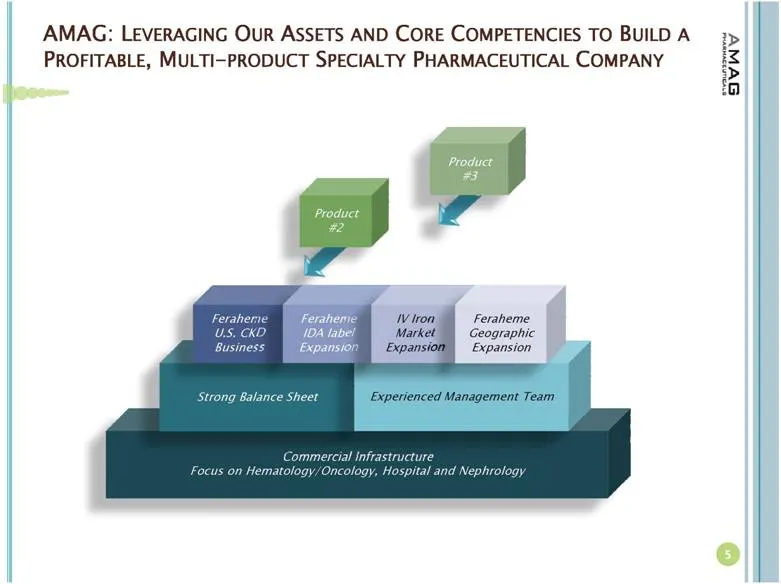
Slide 5: Leveraging Our Assets and Core Competencies to Build a Multi-Product Specialty Pharmaceutical Company
AMAG: LEVERAGING OUR ASSETS AND CORE COMPETENCIES TO BUILD A PROFITABLE, MULTI-PRODUCT SPECIALTY PHARMACEUTICAL COMPANY Commercial Infrastructure Focus on Hematology/Oncology, Hospital and Nephrology Strong Balance Sheet Product #2 Product #3 Experienced Management Team Feraheme U.S. CKD Business Fe
Slide 6: U.S. IV Iron Market
| U.S. IV IRON MARKET
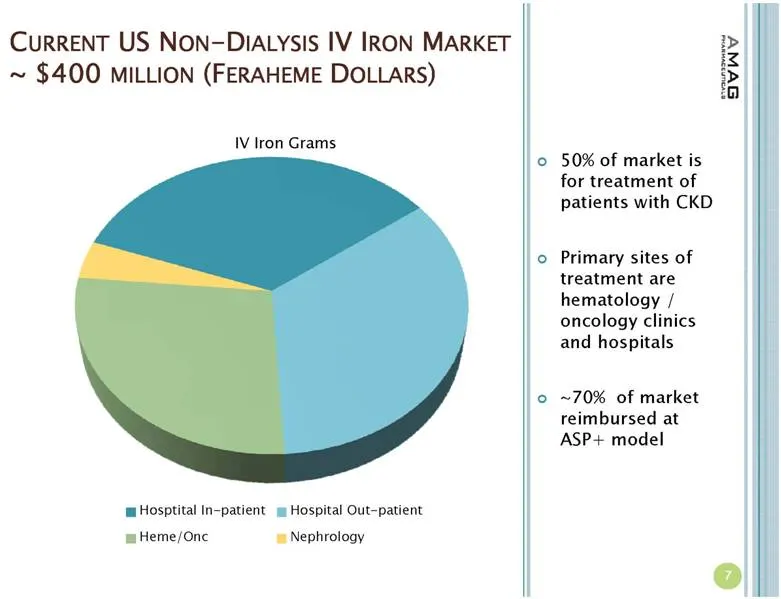
Slide 7: Current US Non-Dialysis IV Iron Market ~$400 Million
CURRENT US NON-DIALYSIS IV IRON MARKET ~ $400 MILLION (FERAHEME DOLLARS) 50% of market is for treatment of patients with CKD Primary sites of treatment are hematology / oncology clinics and hospitals ~70% of market reimbursed at ASP+ model 7
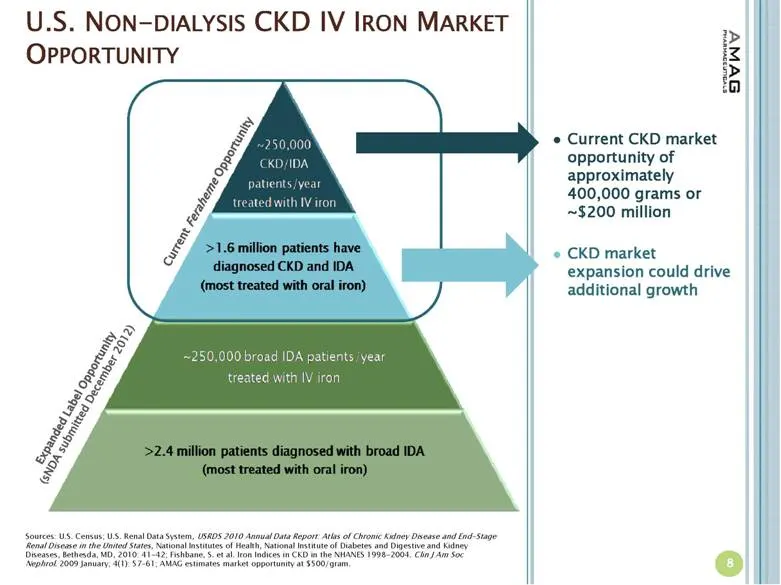
Slide 8: U.S. Non-Dialysis CKD IV Iron Market Opportunity
U.S. NON-DIALYSIS CKD IV IRON MARKET OPPORTUNITY Current Feraheme Opportunity Expanded Label Opportunity (sNDA submitted December 2012) Sources: U.S. Census; U.S. Renal Data System, USRDS 2010 Annual Data Report: Atlas of Chronic Kidney Disease and End-Stage Renal Disease in the United States, Natio
Slide 9: Feraheme Performance in the U.S.
FERAHEME PERFORMANCE IN THE U.S.
Slide 10: About Feraheme (ferumoxytol)/Rienso
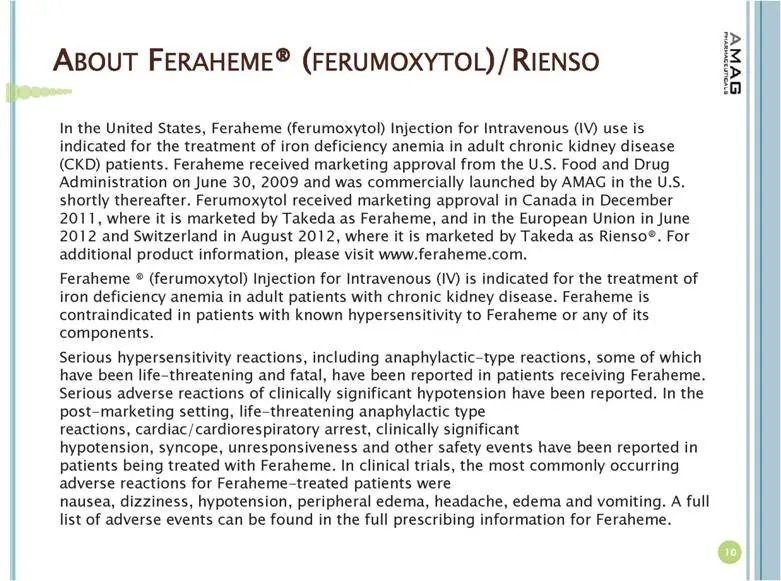
ABOUT FERAHEME® (FERUMOXYTOL)/RIENSO In the United States, Feraheme (ferumoxytol) Injection for Intravenous (IV) use is indicated for the treatment of iron deficiency anemia in adult chronic kidney disease (CKD) patients. Feraheme received marketing approval from the U.S. Food and Drug Administratio
Slide 11: Non-Dialysis Market Share Shift Since Feraheme Launch
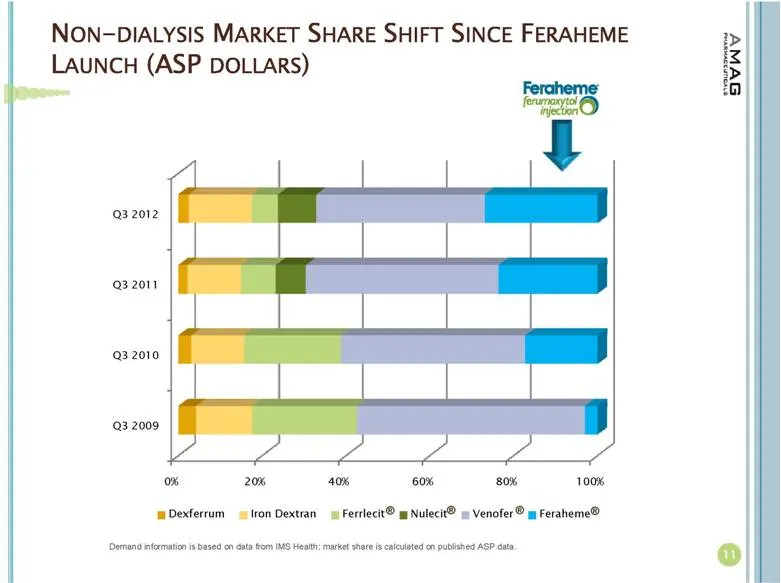
NON-DIALYSIS MARKET SHARE SHIFT SINCE FERAHEME LAUNCH (ASP DOLLARS) 11 ® ® ® ® Demand information is based on data from IMS Health; market share is calculated on published ASP data.
Slide 12: IV Iron Historical Dosing Paradigm
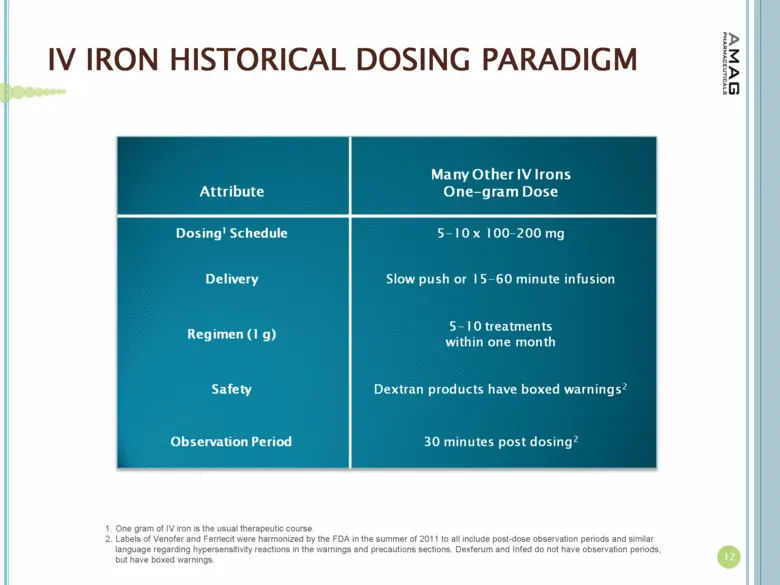
IV IRON HISTORICAL DOSING PARADIGM One gram of IV iron is the usual therapeutic course. Labels of Venofer and Ferrlecit were harmonized by the FDA in the summer of 2011 to all include post-dose observation periods and similar language regarding hypersensitivity reactions in the warnings and precauti
Slide 13: Feraheme Is As Easy As 1 Gram, 2 Doses, 3-8 Days Apart
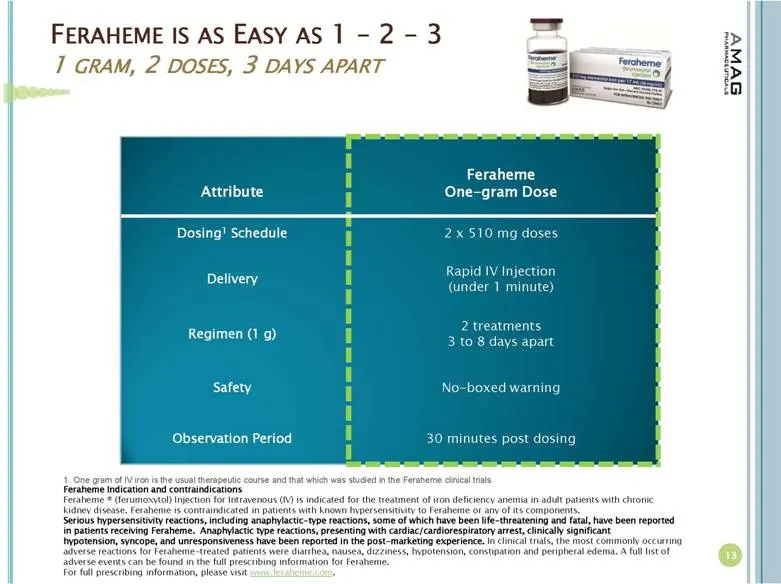
FERAHEME IS AS EASY AS 1 – 2 – 3 1 GRAM, 2 DOSES, 3 DAYS APART One gram of IV iron is the usual therapeutic course and that which was studied in the Feraheme clinical trials. Feraheme Indication and contraindications Feraheme ® (ferumoxytol) Injection for Intravenous (IV) is indicated for the treatm
Slide 14: 2012 – Strong Growth in Feraheme Provider Demand
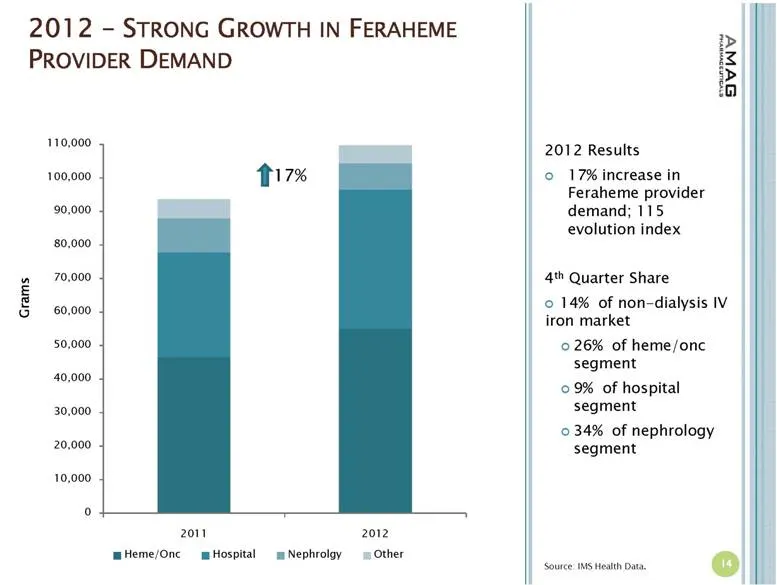
2012 – STRONG GROWTH IN FERAHEME PROVIDER DEMAND 14 Source: IMS Health Data. 17% Grams 2012 Results 17% increase in Feraheme provider demand; 115 evolution index 4th Quarter Share 14% of non-dialysis IV iron market 26% of heme/onc segment 9% of hospital segment 34% of nephrology segment
Slide 15: Expansion Opportunities
| EXPANSION OPPORTUNITIES avn’
Slide 16: U.S. Broad IDA IV Iron Market Opportunity Today
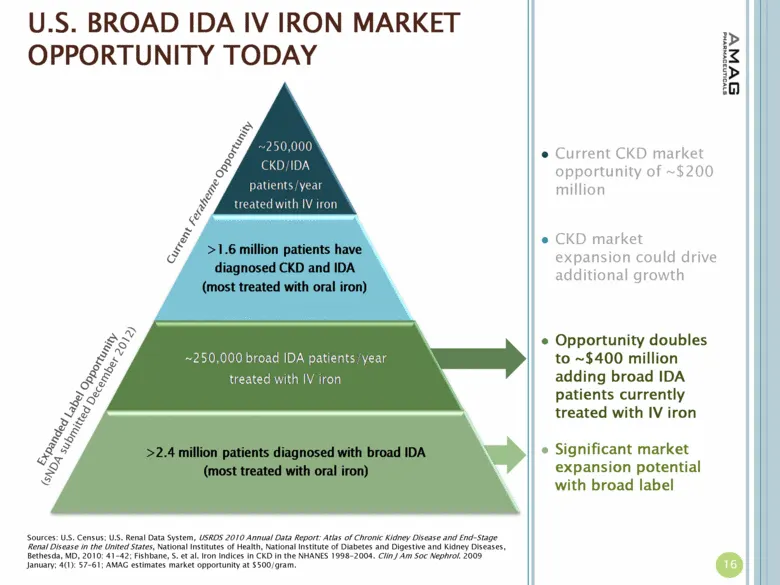
U.S. BROAD IDA IV IRON MARKET OPPORTUNITY TODAY Current Feraheme Opportunity Sources: U.S. Census; U.S. Renal Data System, USRDS 2010 Annual Data Report: Atlas of Chronic Kidney Disease and End-Stage Renal Disease in the United States, National Institutes of Health, National Institute of Diabetes an
Slide 17: U.S. Broad IDA IV Iron Market Opportunity Today
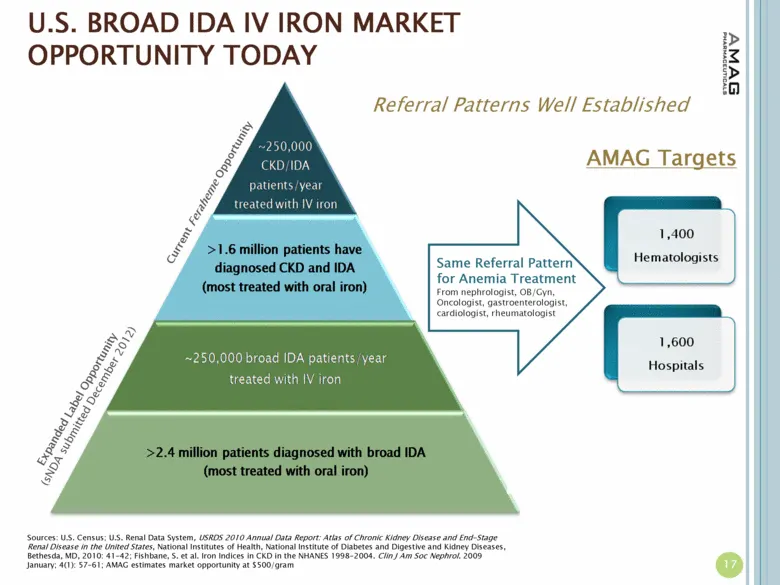
U.S. BROAD IDA IV IRON MARKET OPPORTUNITY TODAY Current Feraheme Opportunity Sources: U.S. Census; U.S. Renal Data System, USRDS 2010 Annual Data Report: Atlas of Chronic Kidney Disease and End-Stage Renal Disease in the United States, National Institutes of Health, National Institute of Diabetes an
Slide 18: Broad IDA Label Expansion Plans
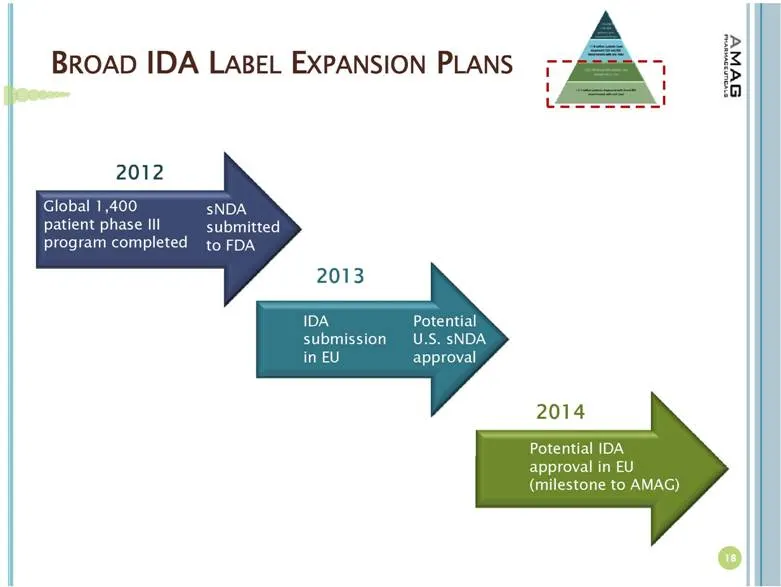
BROAD IDA LABEL EXPANSION PLANS 18 2012 2013 2014 sNDA submitted to FDA Global 1,400 patient phase III program completed Potential U.S. sNDA approval IDA submission in EU Potential IDA approval in EU (milestone to AMAG)
Slide 19: IDA-301: Patient Reported Outcomes of Ferumoxytol-Treated Patients
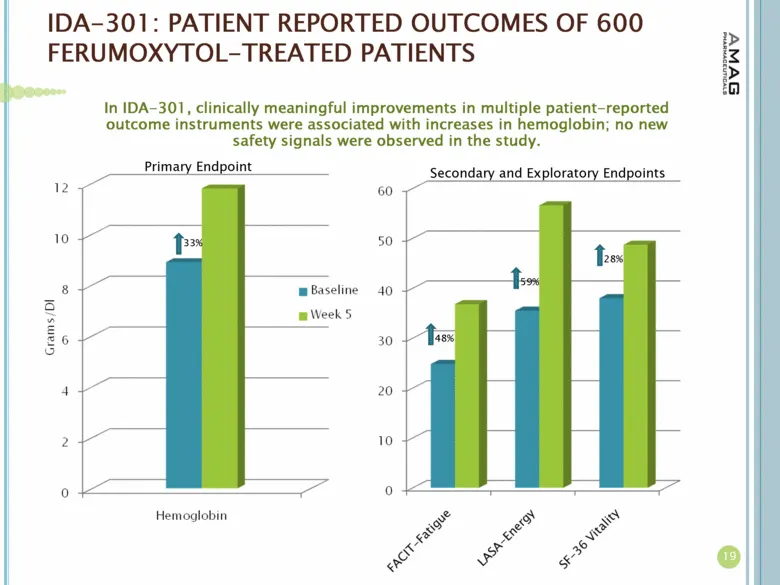
IDA-301: PATIENT REPORTED OUTCOMES OF 600 FERUMOXYTOL-TREATED PATIENTS 19 In IDA-301, clinically meaningful improvements in multiple patient-reported outcome instruments were associated with increases in hemoglobin; no new safety signals were observed in the study. 48% 59% 28% 33% Primary Endpoint S
Slide 20: IV Iron Market Expansion Opportunity
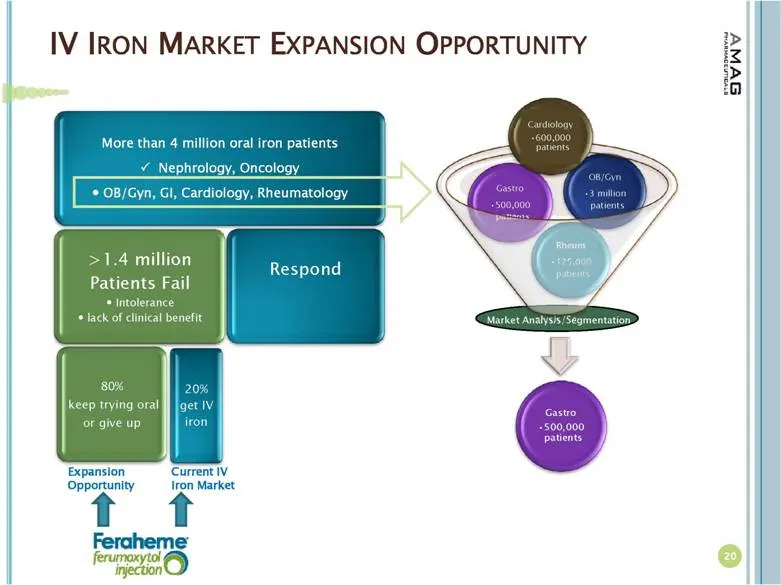
IV IRON MARKET EXPANSION OPPORTUNITY 20 Expansion Opportunity Current IV Iron Market
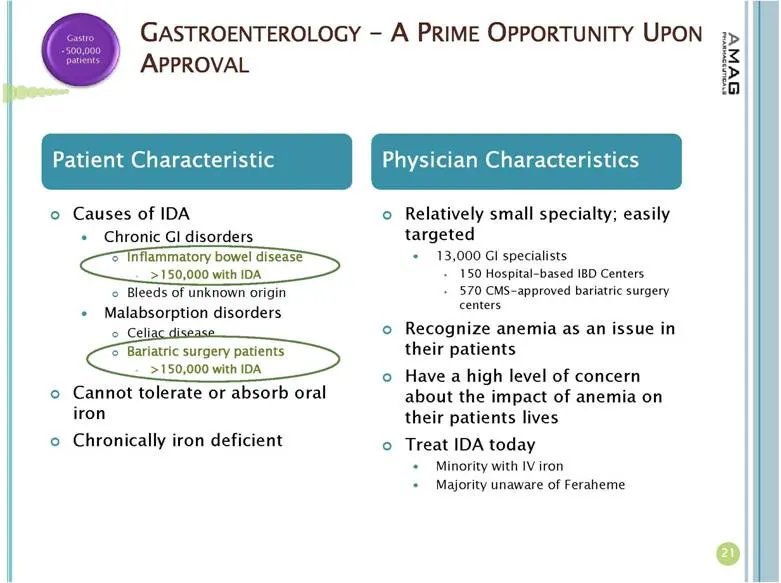
Slide 21: Gastroenterology – A Prime Opportunity Upon Approval
GASTROENTEROLOGY – A PRIME OPPORTUNITY UPON APPROVAL 21 Causes of IDA Chronic GI disorders Inflammatory bowel disease >150,000 with IDA Bleeds of unknown origin Malabsorption disorders Celiac disease Bariatric surgery patients >150,000 with IDA Cannot tolerate or absorb oral iron Chronically iron de
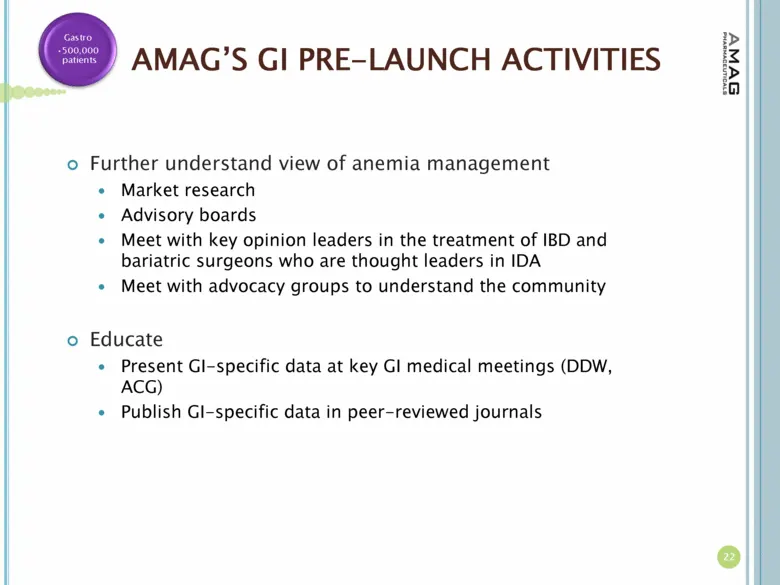
Slide 22: AMAG's GI Pre-Launch Activities
AMAG’S GI PRE-LAUNCH ACTIVITIES Further understand view of anemia management Market research Advisory boards Meet with key opinion leaders in the treatment of IBD and bariatric surgeons who are thought leaders in IDA Meet with advocacy groups to understand the community Educate Present GI-specific d
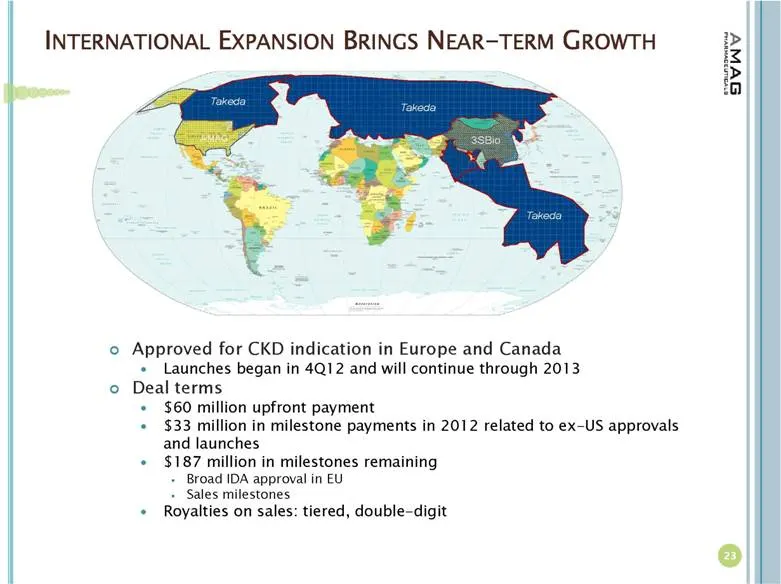
Slide 23: International Expansion Brings Near-Term Growth
INTERNATIONAL EXPANSION BRINGS NEAR-TERM GROWTH Approved for CKD indication in Europe and Canada Launches began in 4Q12 and will continue through 2013 Deal terms $60 million upfront payment $33 million in milestone payments in 2012 related to ex-US approvals and launches $187 million in milestones r
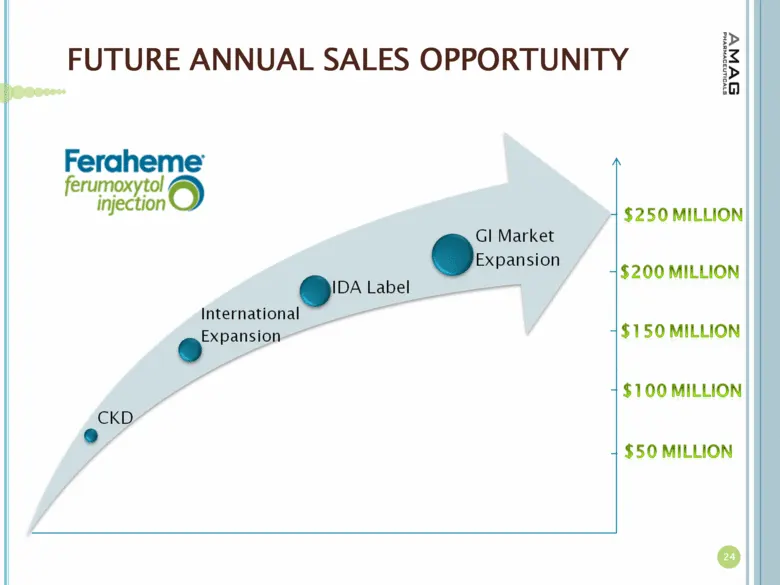
Slide 24: Future Annual Sales Opportunity
FUTURE ANNUAL SALES OPPORTUNITY 24
Slide 25: Portfolio Expansion
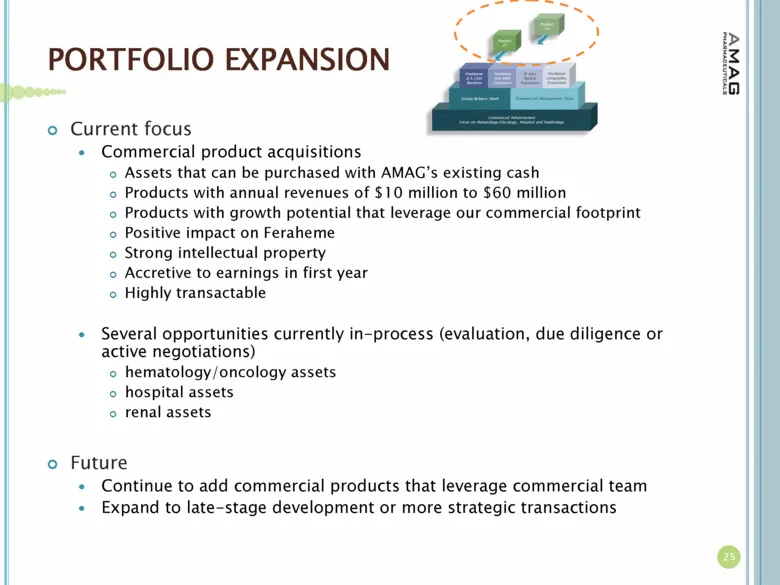
PORTFOLIO EXPANSION Current focus Commercial product acquisitions Assets that can be purchased with AMAG’s existing cash Products with annual revenues of $10 million to $60 million Products with growth potential that leverage our commercial footprint Positive impact on Feraheme Strong intellectual p
Slide 26: Financial Overview
| FINANCIAL OVERVIEW
Slide 27: 2012 Projected Financial Highlights
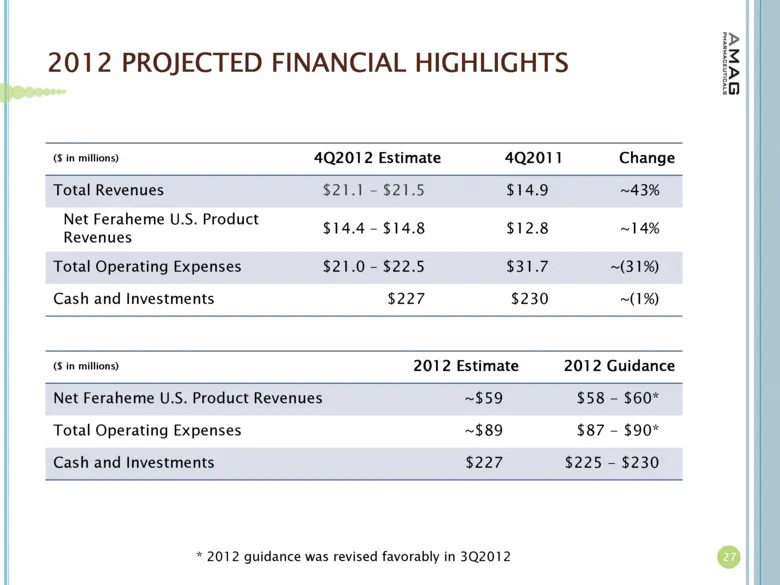
2012 PROJECTED FINANCIAL HIGHLIGHTS ($ in millions) 4Q2012 Estimate 4Q2011 Change Total Revenues $21.1 – $21.5 $14.9 ~43% Net Feraheme U.S. Product Revenues $14.4 – $14.8 $12.8 ~14% Total Operating Expenses $21.0 – $22.5 $31.7 ~(31%) Cash and Investments $227 $230 ~(1%) 27 ($ in millions) 2012 Estim
Slide 28: Improving Net Revenue per Gram of Feraheme Sold
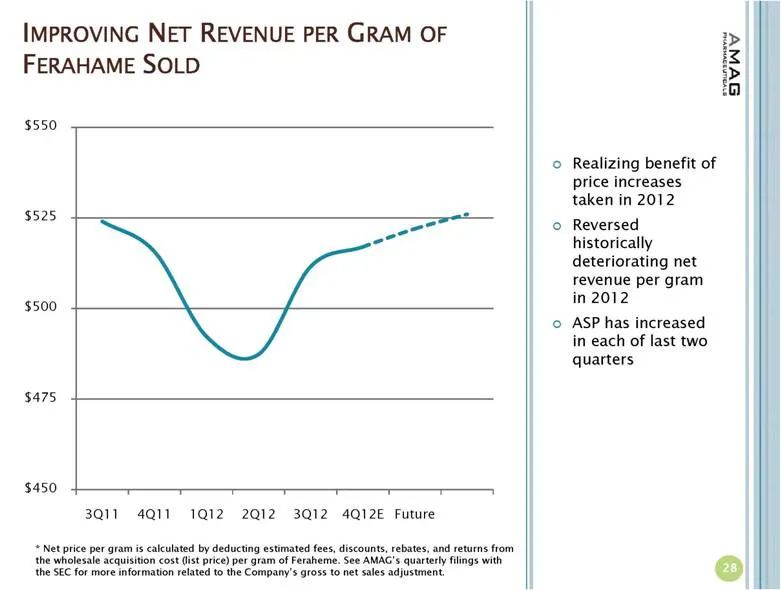
IMPROVING NET REVENUE PER GRAM OF FERAHAME SOLD 28 Realizing benefit of price increases taken in 2012 Reversed historically deteriorating net revenue per gram in 2012 ASP has increased in each of last two quarters * Net price per gram is calculated by deducting estimated fees, discounts, rebates, an
Slide 29: AMAG: Cash Flow Trajectory
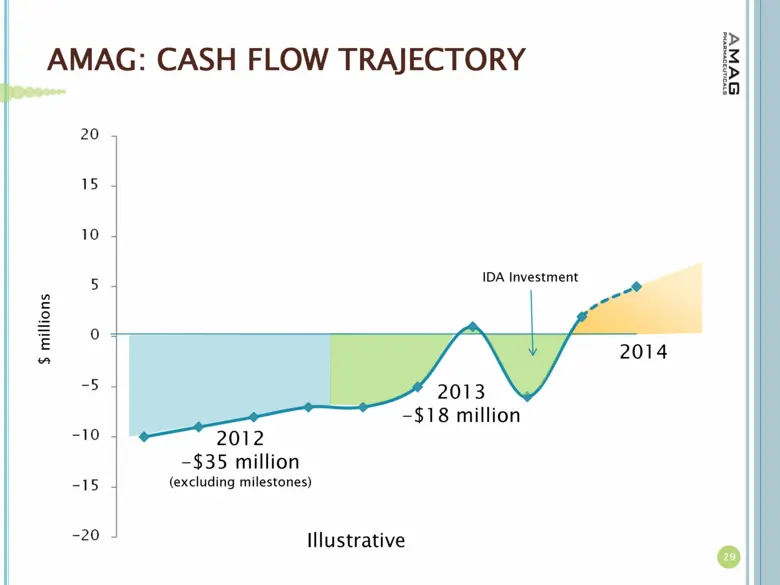
AMAG: CASH FLOW TRAJECTORY 29 $ millions 2012 -$35 million (excluding milestones) 2013 -$18 million Illustrative IDA Investment 2014
Slide 30: 2013 Financial Outlook
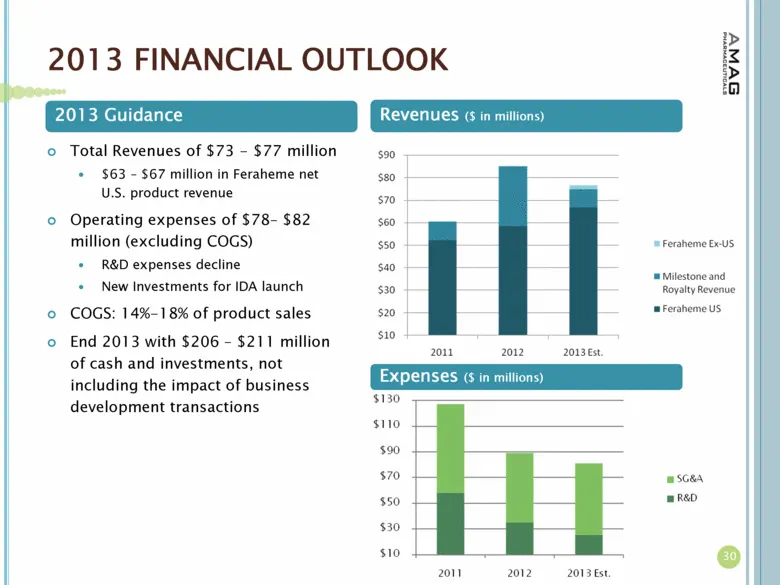
2013 FINANCIAL OUTLOOK 30 Expenses ($ in millions) Total Revenues of $73 - $77 million $63 – $67 million in Feraheme net U.S. product revenue Operating expenses of $78– $82 million (excluding COGS) R&D expenses decline New Investments for IDA launch COGS: 14%-18% of product sales End 2013 with $206
Slide 31: Building Off a Base of Success in 2013
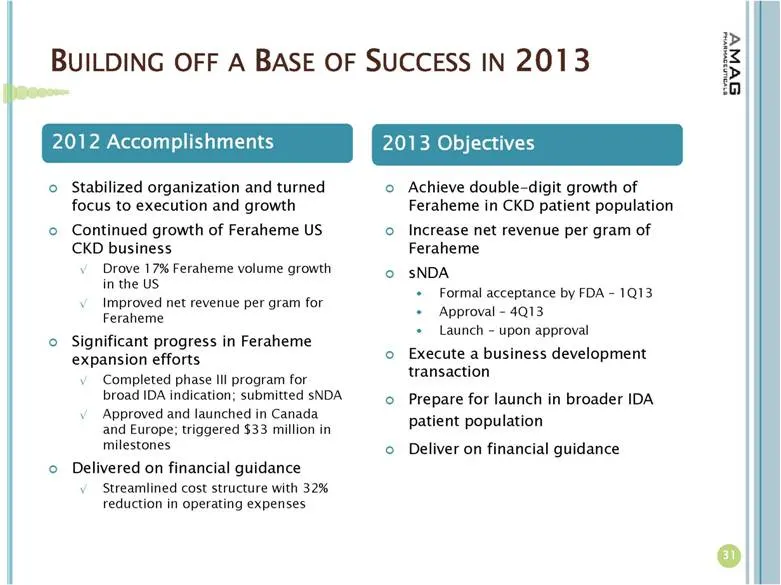
BUILDING OFF A BASE OF SUCCESS IN 2013 31 Stabilized organization and turned focus to execution and growth Continued growth of Feraheme US CKD business Drove 17% Feraheme volume growth in the US Improved net revenue per gram for Feraheme Significant progress in Feraheme expansion efforts Completed p
Slide 32: AMAG Pharmaceuticals: Well Positioned for Growth in 2013... and Beyond
AMAG PHARMACEUTICALS Well positioned for growth in 2013... and beyond
Source: SEC EDGAR · 8-K filed Jan 7, 2013
More decks from AMAG Pharmaceuticals Inc
 Q2 2020 Earnings Presentation16 slides · Aug 6, 2020
 Q1 2020 Earnings Presentation14 slides · May 11, 2020
 JP Morgan 38th Healthcare Conference 202033 slides · Jan 9, 2020
 Q3 2019 Earnings Presentation24 slides · Nov 1, 2019
 Proxy Contest (September 2019)48 slides · Sep 4, 2019
 Q2 2019 Earnings Presentation26 slides · Aug 7, 2019