William Lyon Homes — Investor Presentation (June 2015)
30 slides from William Lyon Homes's investor presentation, Jun 9, 2015
Slide 1: Investor Presentation June 2015
Investor Presentation June 2015 Exhibit 99.1
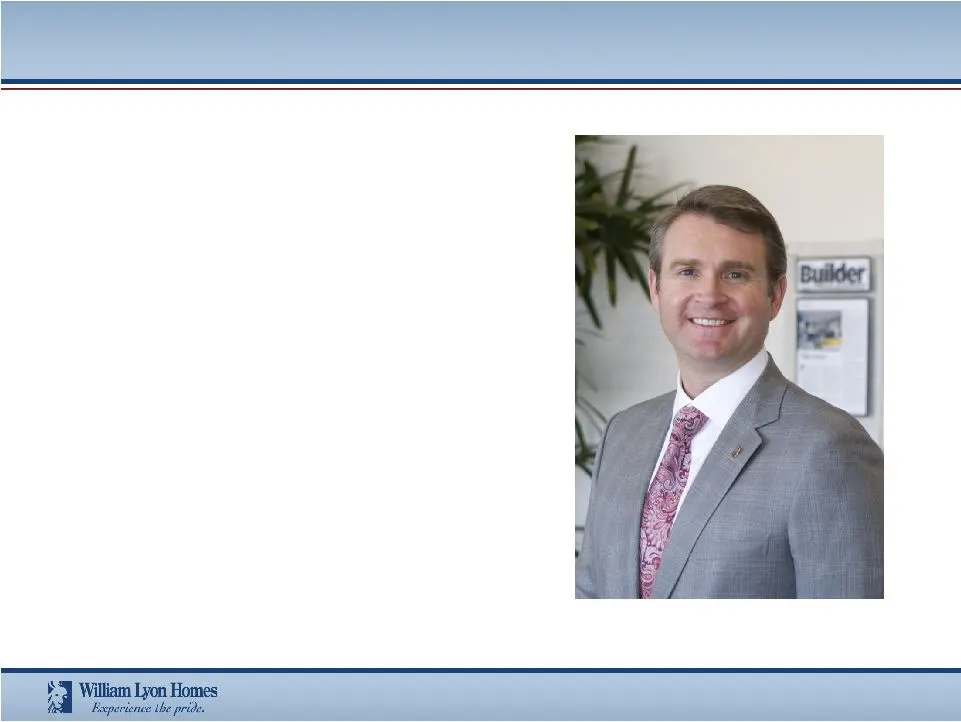
Slide 2: Management Presenter
Management Presenter Matthew R. Zaist Chief Operating Officer & President

Slide 3: Disclosure Statement
Disclosure Statement Certain statements contained in this presentation that are not historical information contain forward-looking statements, including, but not limited to, statements related to: market and industry trends, the anticipated financial and operating results from execution of the Compa
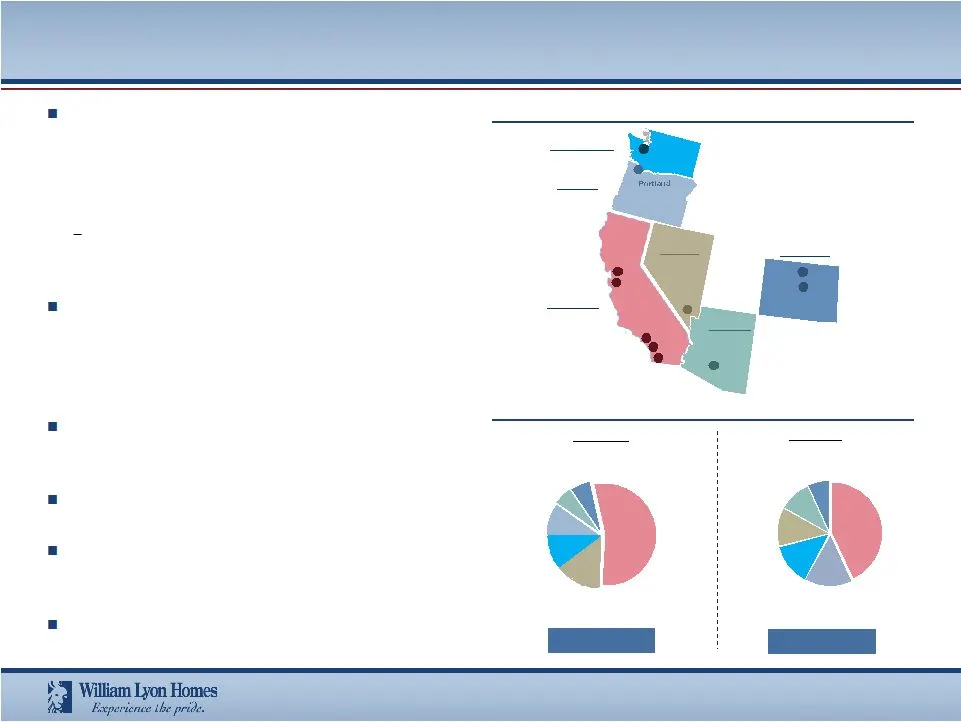
Slide 4: William Lyon Homes At-a-Glance
$944 million $944 million Seattle Fort Collins Denver 1,865 homes 1,865 homes California 54% Nevada 14% Washington 10% Oregon 10% Arizona 6% Colorado 6% California 43% Oregon 15% Washington 13% Nevada 12% Arizona 10% Colorado 7% William Lyon Homes “At-a-Glance” One of the largest Western U.S. region
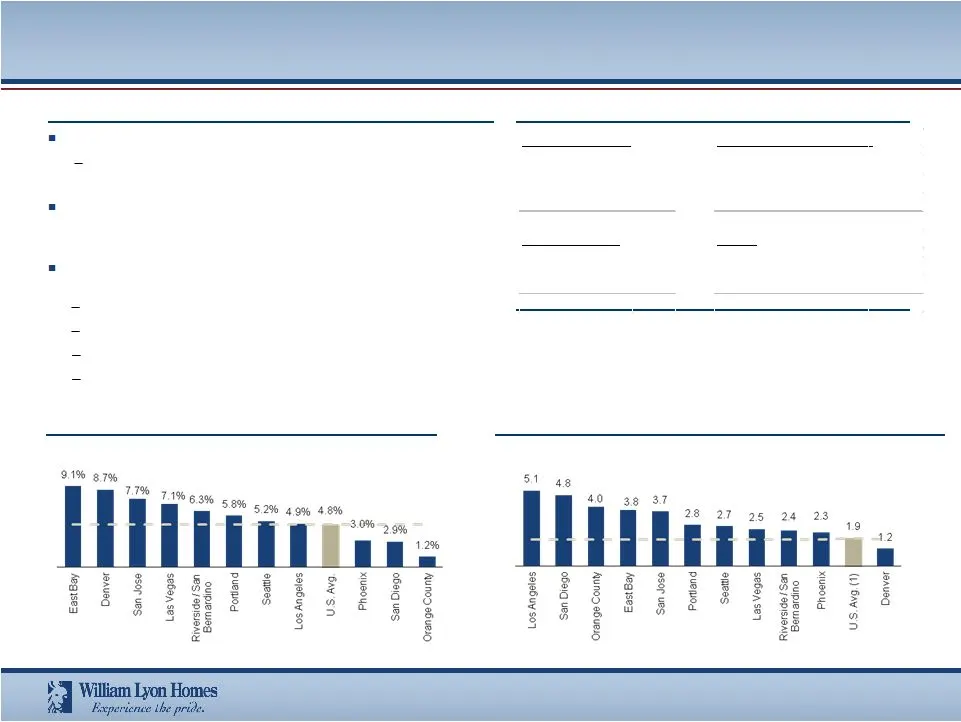
Slide 5: Leading Positions in High Growth Markets
Top 10 player in most of our markets, with improving market share Top 10 in 2014 in Los Angeles, Orange County, San Diego, Contra Costa and Santa Clara Counties, Seattle, Portland, and Las Vegas Expansion into the Pacific Northwest further strengthens our market positioning by adding two top 20 mark
Slide 6: Continued Growth and Diversification Through Monetization of High Quality Land Positions
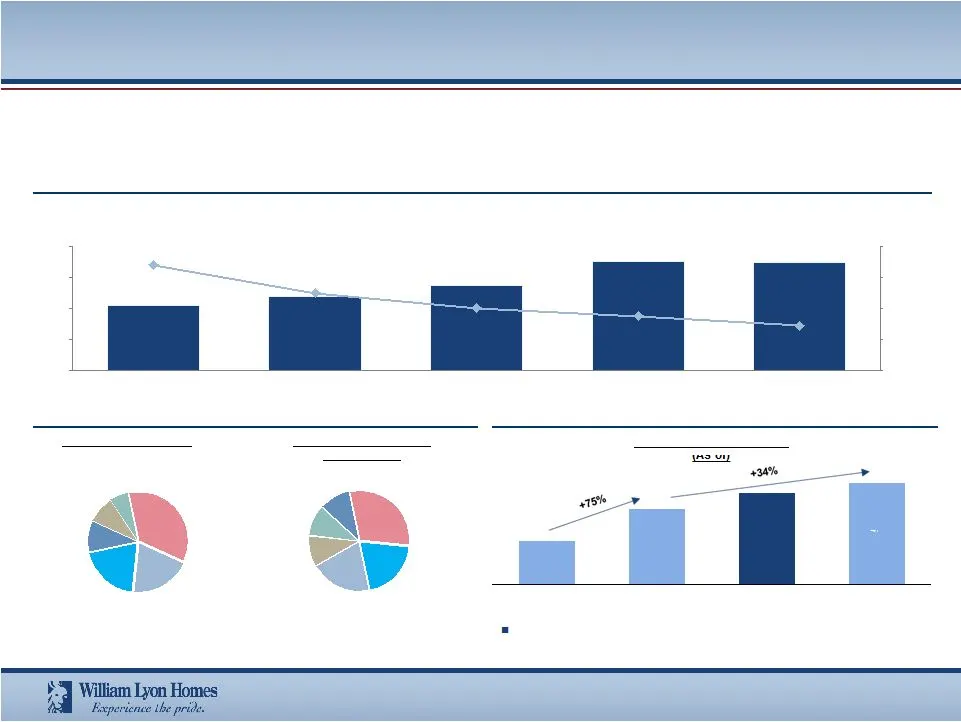
32 56 68 75 10,464 11,842 13,747 17,542 17,473 10.1 years 7.8 years 7.3 years 10.1 years 7.8 years 7.3 years 12/31/2013 12/31/2014 5/3/2015 Estimated mid-year 2015 California 35% Oregon 20% Washington 20% Colorado 10% Nevada 9% Arizona 6% Continued Growth and Diversification Through Monetization of

Slide 7: Experience the pride
Esspevience the pride.
Slide 8: 2014: A Year of Continued Growth
2014: A Year of Continued Growth
Slide 9: Key Financial Metrics – Our Strategies are Working
Key Financial Metrics – Our Strategies are Working Home sales revenue of $857 million, +64% y-o-y Consolidated operating revenue of $897 million, +57% y-o-y Homebuilding gross margin of $179.5 million, +55% y-o-y Adjusted homebuilding gross margin of 25.2% SG&A percentage of 11.7%, - 110 basis point
Slide 10: Strong Operational Performance in 2014
Strong Operational Performance in 2014 1,753 new homes delivered, up 29% y-o-y and the highest total in 7 years $489K ASP of new homes delivered, up 28% y-o-y 1,677 net new home orders, up 27% y-o-y new home communities at year end, up 75% from YE ‘13
Slide 11: Strategic Expansion – Polygon Northwest Acquisition
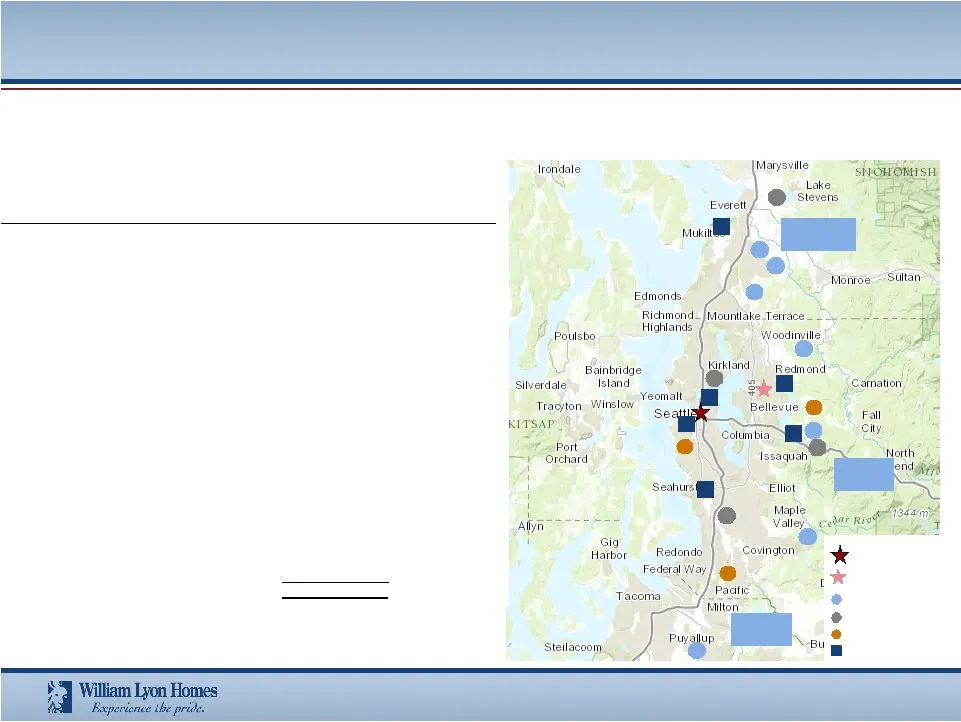
Strategic Expansion – Polygon Northwest Acquisition Strategic Rationale Seattle Market Overview Two of the most attractive and land-constrained markets in the country Approximately 4,500 lots owned or controlled as of March 31, 2015 Complementary brands, high customer satisfaction and similar buyer
Slide 12: Irondale
Irondale us ! tae % q © Poulsbo Higa | Woodinville | ite: ea Bainbridge farkland | Redm ond sieiy 4 Yeomalt cs ' Pd wisi é KUTSAP as Port “Elliot Maple Valley Covington

Slide 13: Seattle – Active and Future Communities
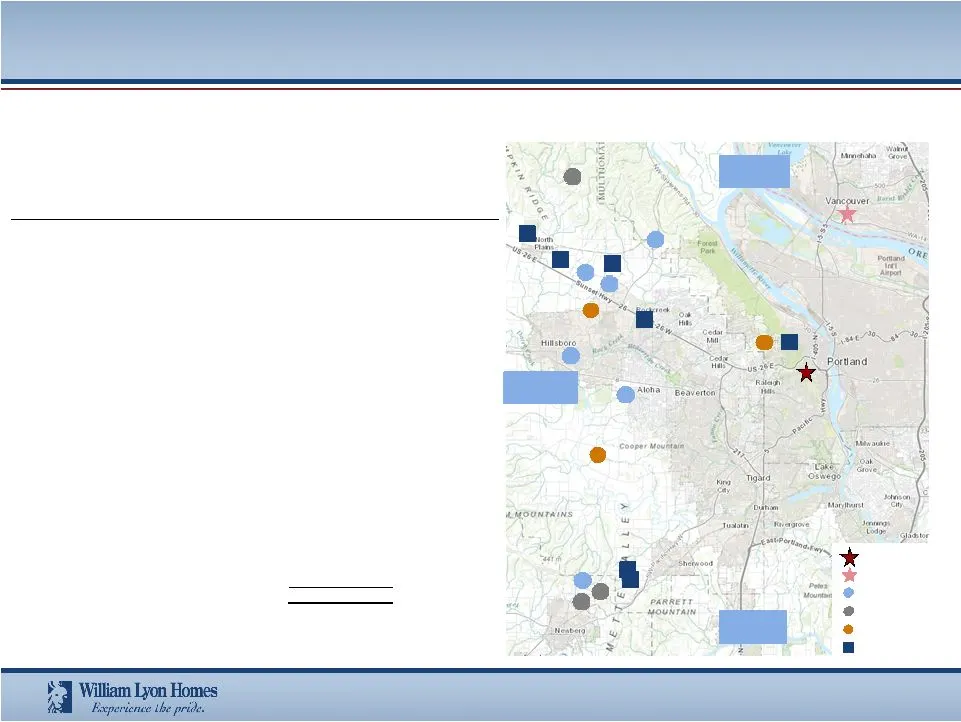
Pierce County Snohomish County King County xxx Highlands xxx Meadows Seattle – Active and Future Communities The Washington Division presently comprises over 2,000 owned and controlled lots. Polygon HQ Active Projects Future Projects Key Employers Downtown Boeing Starbucks Amazon Boeing Costco Micro
Slide 14

Slide 15: Portland – Active and Future Communities
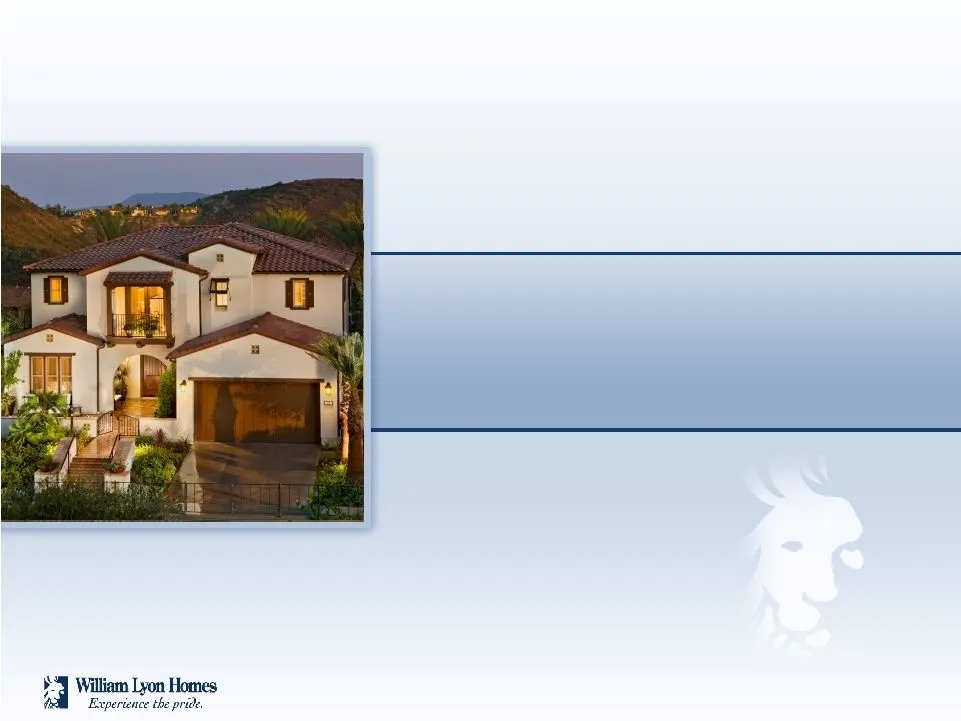
Clackamas County Multnomah County Washington County xx Mountain Portland – Active and Future Communities The Portland Division presently comprises approximately 2,400 owned and controlled lots. Polygon HQ Active Projects Future Projects Key Employers Downtown Nike Xerox FLIR Mentor Graphics Oregon H
Slide 16: Ongoing Momentum in 2015
Ongoing Momentum in 2015
Slide 17: Summary of Q1 2015 Results
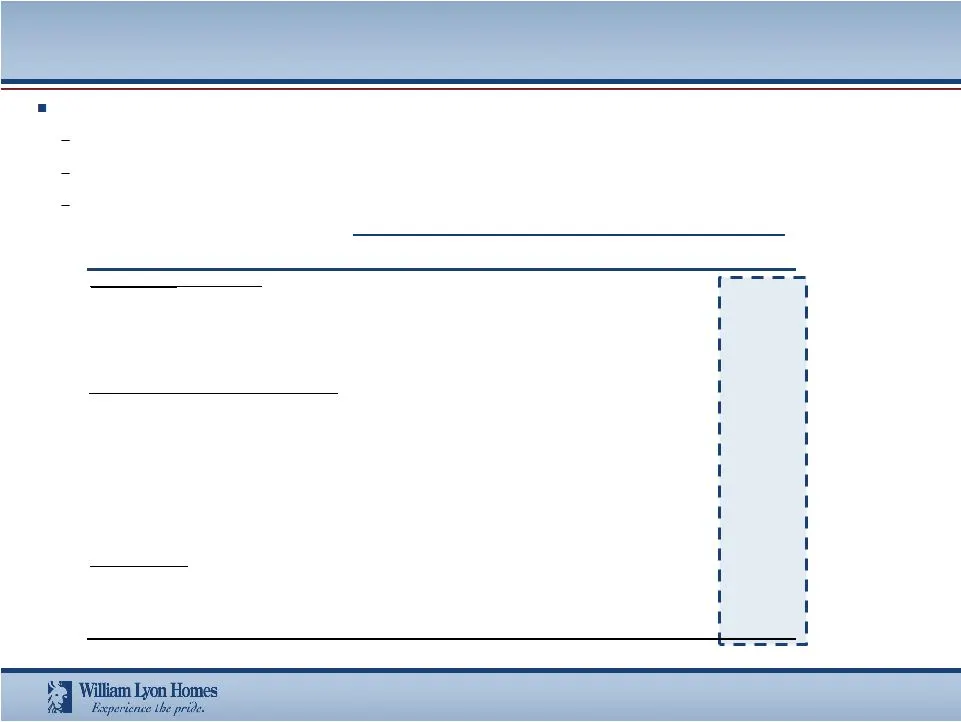
3/31/2015 3/31/2014 Change Select operating statistics New home orders 47% Homes closed 41% ASP (homes closed, $000s) $489.0 $508.3 (4%) Home sales revenue $189.7 $140.3 35% Homebuilding gross profit $35.6 $34.1 5% Operating income $10.4 $15.8 (34%) Net income to common stockholders $6.7 $8.7 (23%)
Slide 18: Monthly Sales Volume
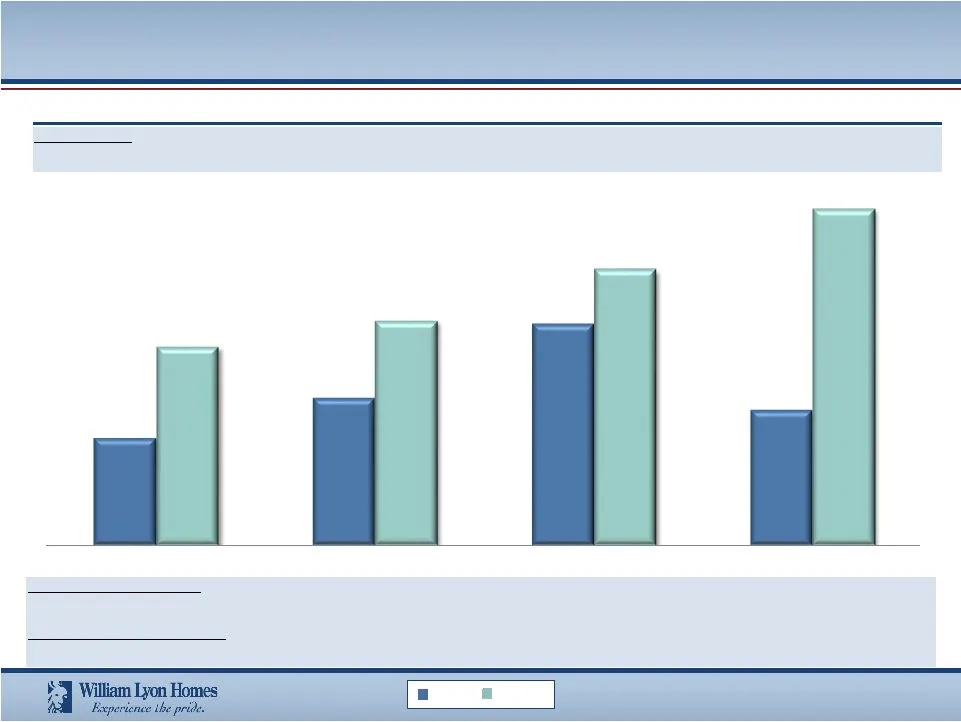
Monthly Sales Volume Total Net Orders by Month (Units) – Actual vs. Prior Year % y-o-y change: +86% +52% +25% +148% 2014 2015 January February March April Avg. Sales Locations (2015): Monthly Absorption Rate (2015): 3.0 3.7 4.4 4.7
Slide 19: Strong New Order Growth – Trailing Twelve Months in Dollars
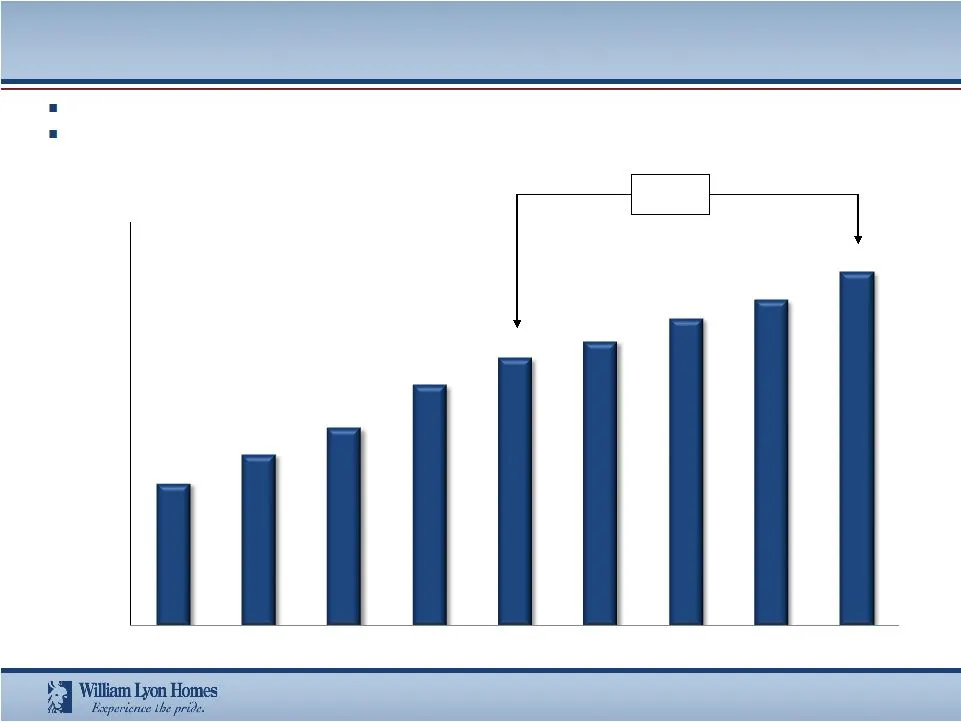
Strong New Order Growth – Trailing Twelve Months in Dollars Over the last two years, the Company has more than doubled its trailing twelve month dollar value of new home orders Approximately $268.2 million of net new home orders during Q1 2015 $355.3 $426.8 $492.8 $598.9 $666.3 $707.5 $764.4 $810.7
Slide 20: Strong New Order Growth – Trailing Twelve Months in Units
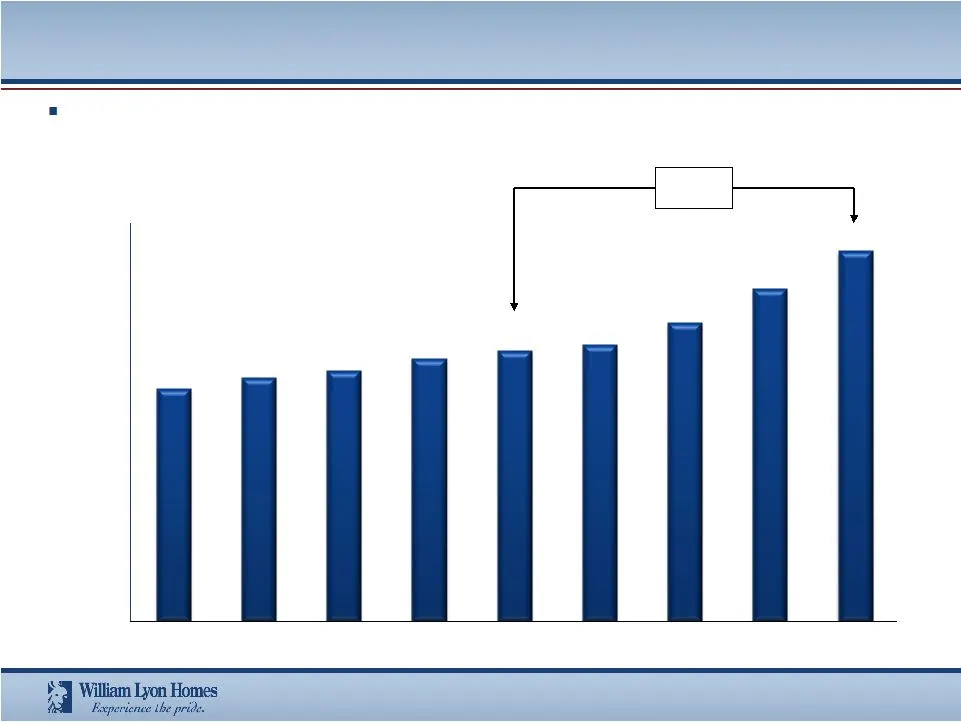
Strong New Order Growth – Trailing Twelve Months in Units Net home orders in units increased by 37% over the last year and 59% over the last two years 1,171 1,229 1,262 1,325 1,364 1,392 1,502 1,677 1,865 1,000 1,200 1,400 1,600 1,800 2,000 Q1'13 Q2'13 Q3'13 Q4'13 Q1'14 Q2'14 Q3'14 Q4'14 Q1'15 TTM O
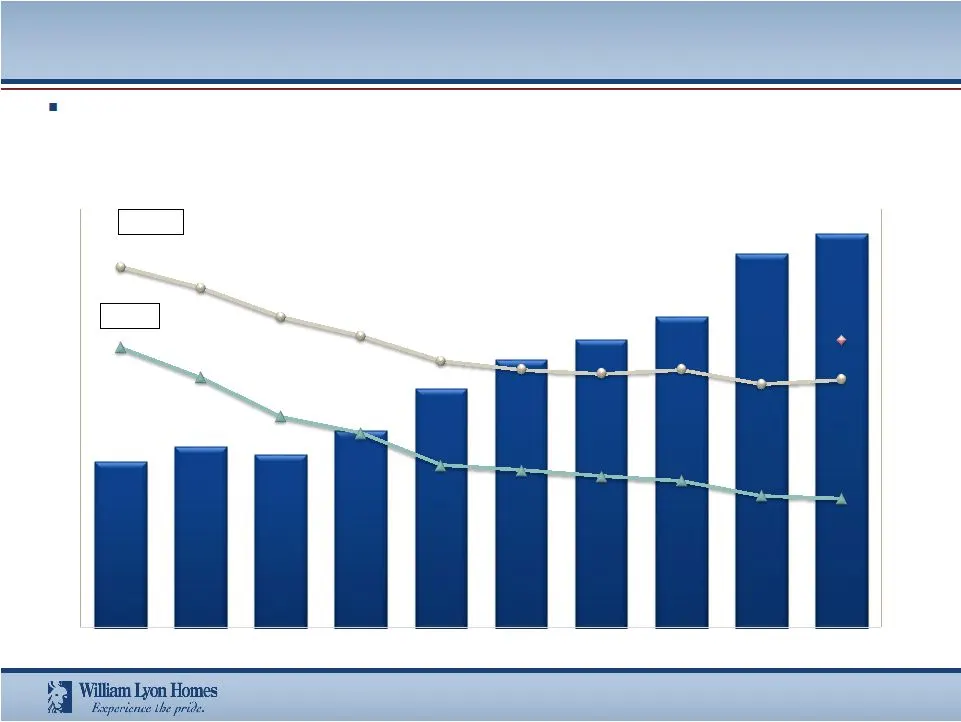
Slide 21: Consistent Growth and Operating Leverage
12.4% 12.2% 12.4% 11.7% 11.9% 9.4% 7.8% 7.6% 7.3% 7.1% 6.4% 6.2% 13.8 ² $398.3 $435.3 $415.5 $473.3 $572.5 $641.6 $690.0 $746.1 $896.7 $943.9 17.3% 16.3% 14.9% 14.0% 12.8% 13.5% 12.0% 10.1% 0.0% 2.0% 4.0% 6.0% 8.0% 10.0% 12.0% 14.0% 16.0% 18.0% 20.0% 1,000 Q4'12 Q1'13 Q2'13 Q3'13 Q4'13 Q1'14 Q2'14 Q
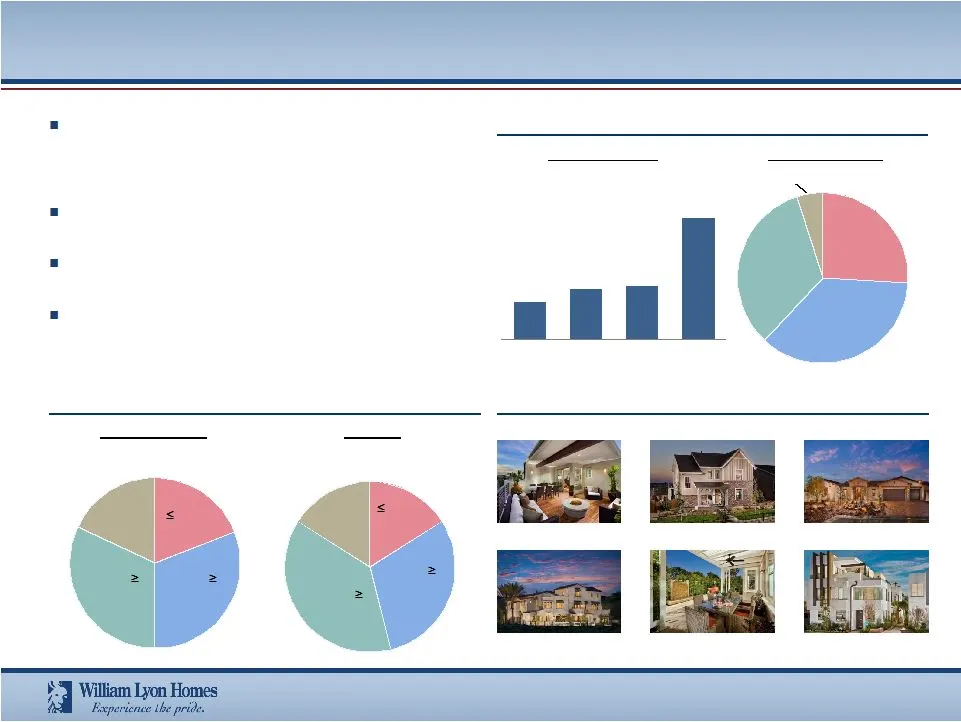
Slide 22: High Quality, Diverse Product Offerings
$360 $481 $506 $1,161 Entry 1st time move-up 2nd time move-up Luxury We employ a diversified product strategy, even within the same project footprint, allowing us to serve a wide range of buyers and to adapt quickly to strengthening or weakening market conditions Typically target entry-level, first
Slide 23: Experienced and Long-Tenured Management Team
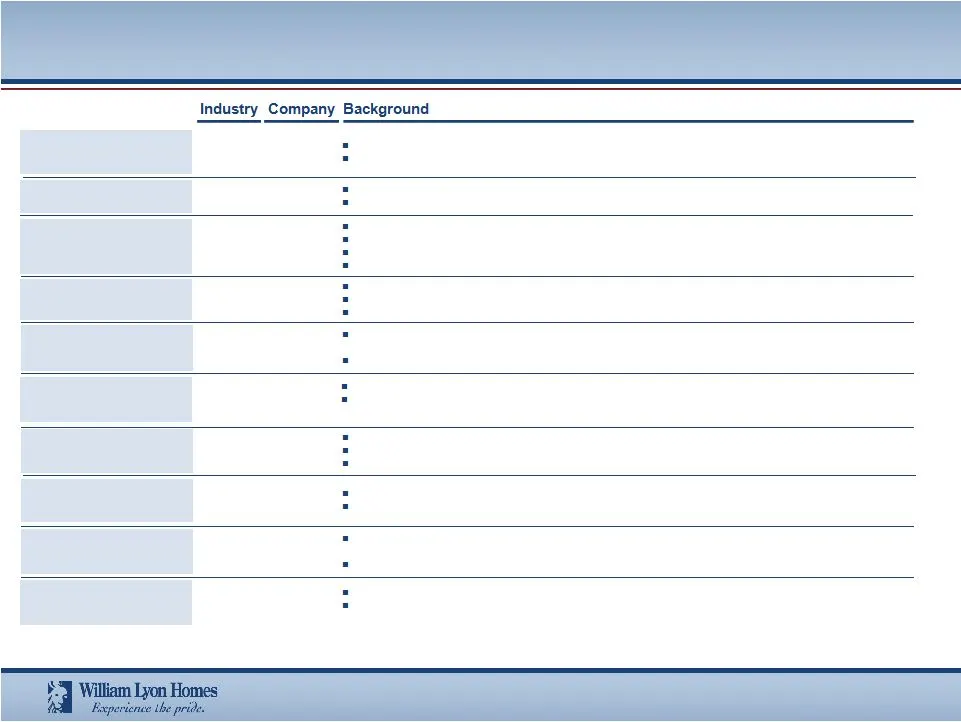
Experienced and Long-Tenured Management Team General William Lyon Executive Chairman and Chairman of the Board General William Lyon Executive Chairman and Chairman of the Board William H. Lyon CEO and Director William H. Lyon CEO and Director Matthew Zaist President and COO Matthew Zaist President a
Slide 24: Drive revenue growth and profitability through community count growth and monetization of existing land supply
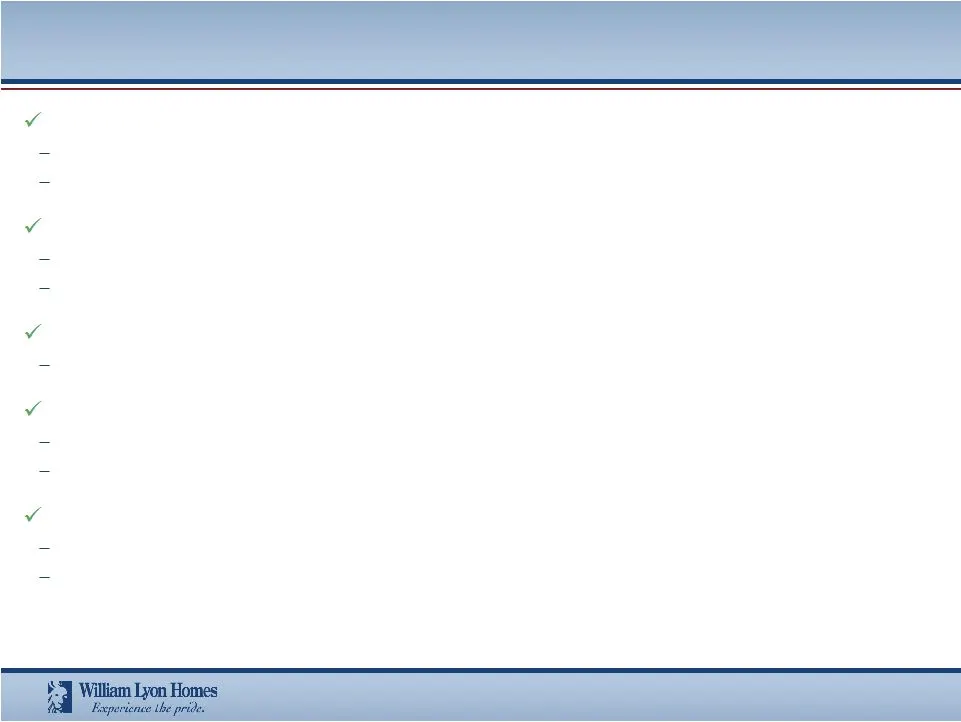
Drive revenue growth and profitability through community count growth and monetization of existing land supply The vast majority of our projected home closings over the next three years are covered by current land inventory Community count expected to grow from 56 at December 31, 2014 to 75 at mid-y

Slide 25: Thank you!
Thank you!
Slide 26: Experience the pride
Experience the pride
Slide 27: Year over Year Comparisons
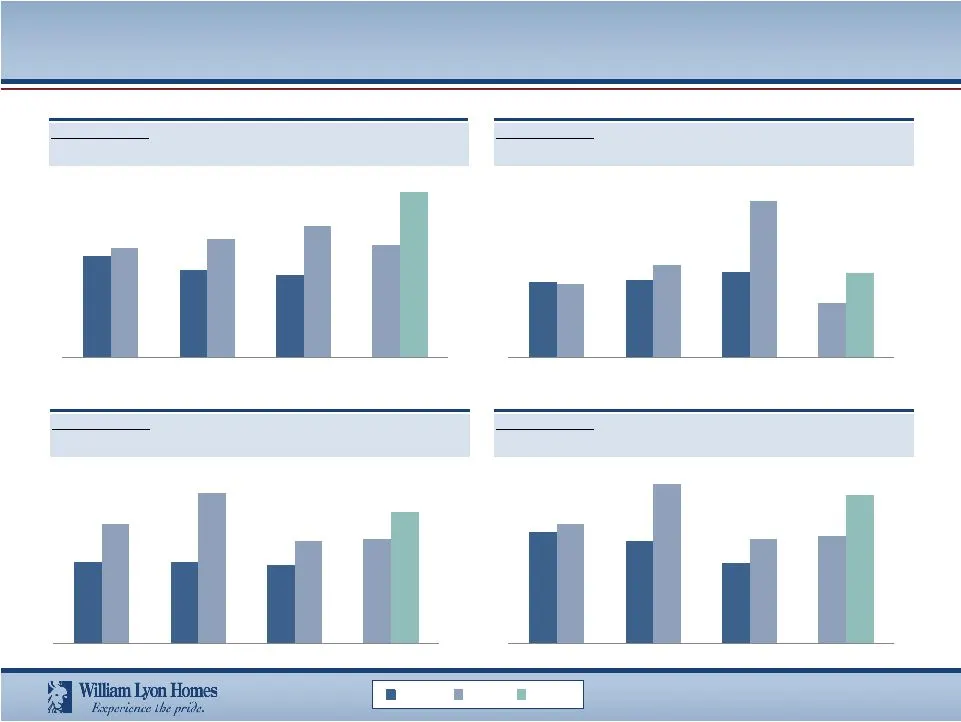
Year over Year Comparisons % y-o-y change: +8% +35% +60% +47% % y-o-y change: +47% +84% +30% +27% % y-o-y change: +6% +56% +30% +38% Net New Home Orders Homes Closed Backlog at Quarter-End ($ Millions) Backlog at Quarter-End (Units) % y-o-y change: (3%) +19% +83% +41% 2013 2014 Q2 Q3 Q4 Q1 Q2 Q3 Q4
Slide 28: Year over Year Comparisons (continued)
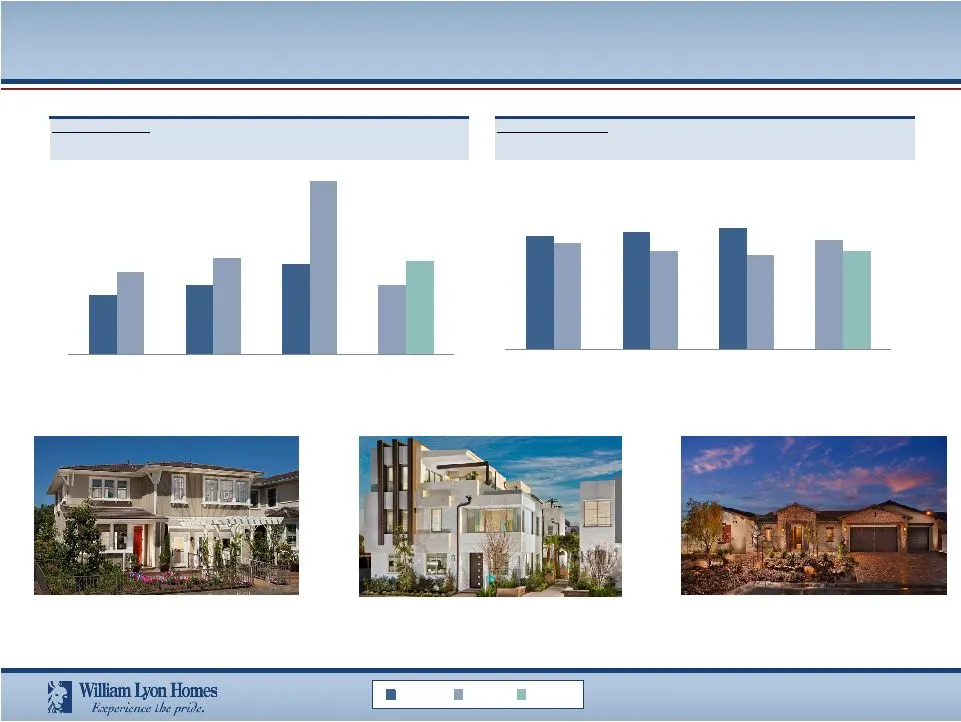
Bps y-o-y change: (140bps) (560bps) (790bps) (320bps) Year over Year Comparisons (continued) % y-o-y change: +39% +39% +93% +35% Homebuilding Revenue Adjusted Gross Margin Q2 Q3 Q4 Q1 $141 $196 $183 $353 $140 $190 Q2 Q3 Q4 Q1 30% 25% 31% 24% 28% 25% 29% 27% $121 $168 2013 2014 2015
Slide 29: Adjusted EBITDA reconciliation
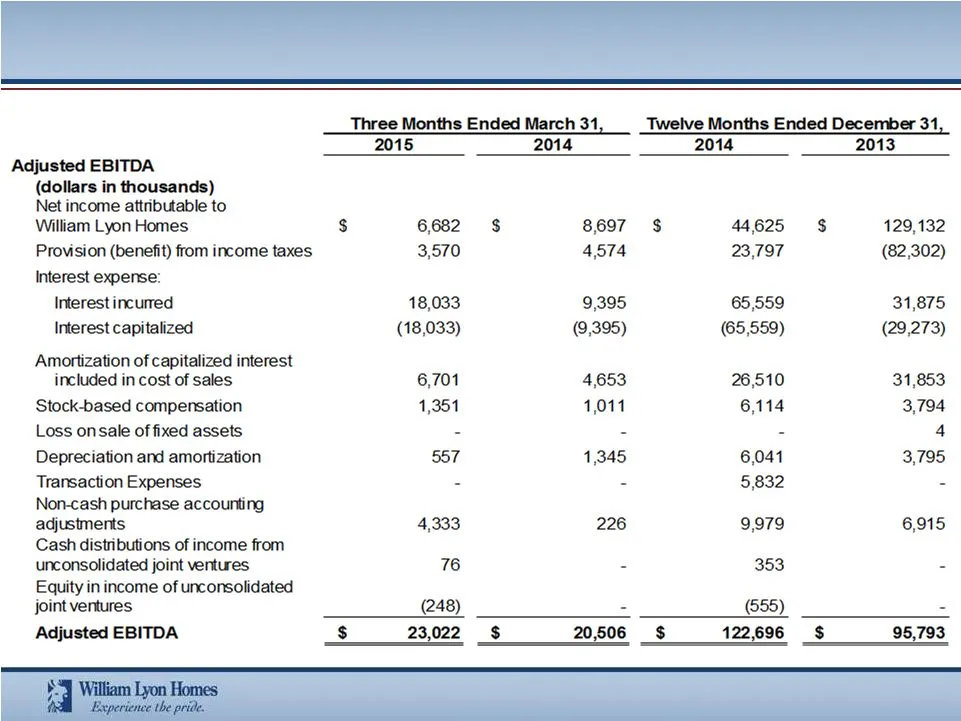
Three Months Ended March 31. Twelve Months Ended December 31, 2015 2014 2014 2013 Adjusted EBITDA (dollars in thousands) Net income attributable to William Lyon Homes $ 6,682 $ 8697 $ 44625 $ 129,132 Provision (benefit) from income taxes 3,570 4574 23,797 (82,302) Interest expense: Interest incurred
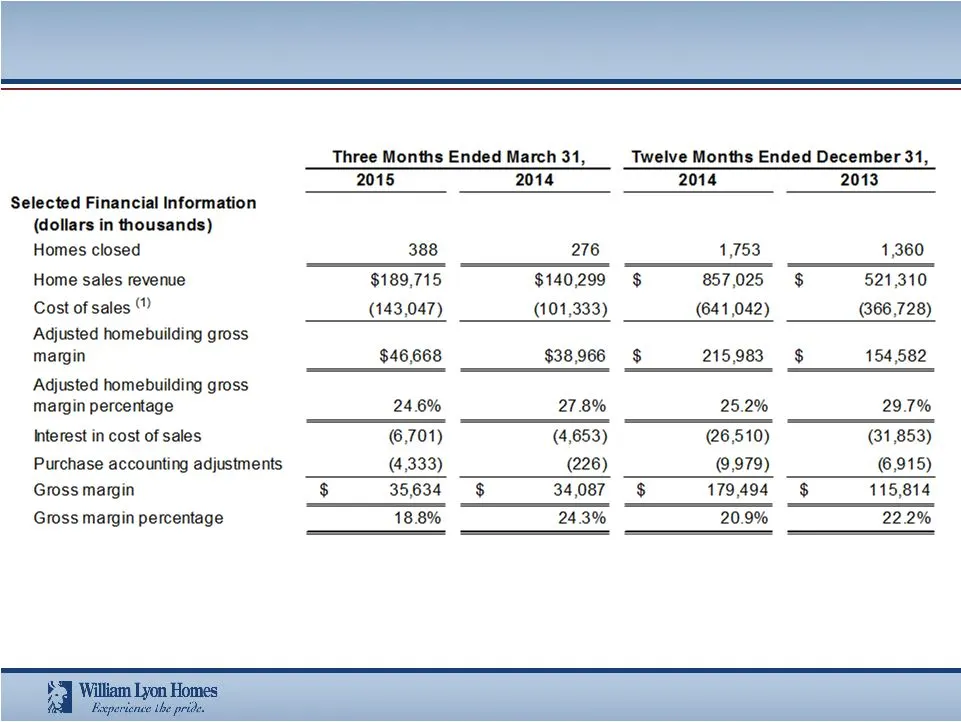
Slide 30: Adjusted Homebuilding Gross Margin
Adjusted Homebuilding Gross Margin (1) Cost of sales excluding interest and purchase accounting adjustments
Source: SEC EDGAR · 8-K filed Jun 9, 2015
More decks from William Lyon Homes
 Merger or Acquisition (November 2019)18 slides · Nov 6, 2019
 Q2 2019 Earnings Presentation15 slides · Aug 1, 2019
 Q1 2019 Earnings Presentation14 slides · May 2, 2019
 Q4 2018 Earnings Presentation18 slides · Feb 14, 2019
 Q3 2018 Earnings Presentation17 slides · Oct 30, 2018
 2018 Zelman Housing Summit31 slides · Sep 27, 2018