Meadowbrook Insurance Group Inc
Meadowbrook Insurance — Investor Presentation (November 2010)
14 slides from Meadowbrook Insurance's investor presentation, Nov 30, 2010
Slide 1: Investor Supplement November 2010
Investor Supplement November 2010
Slide 2: Forward-Looking Statements
2 Forward-Looking Statements Certain statements made by Meadowbrook Insurance Group, Inc. in this presentation may constitute forward-looking statements including, but not limited to, those statements that include the words "believes," "expects," "anticipates," "estimates," or similar expressions. P
Slide 3: Expense Reclassification
3 Expense Reclassification During the first quarter of 2010, the Company made certain reclassifications to the expense classifications on the Consolidated Statement of Income. These reclassifications were made to enable the user of the financial statements to calculate the GAAP combined ratio direct
Slide 4: YTD 2010 v. YTD 2009 Comparison
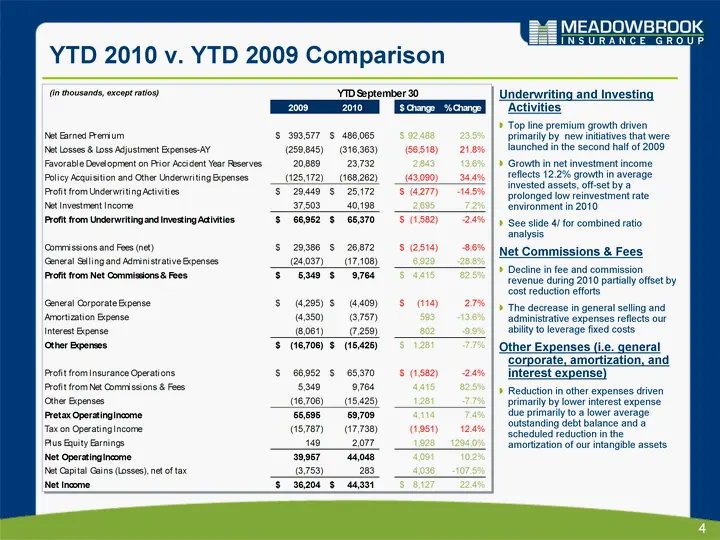
4 YTD 2010 v. YTD 2009 Comparison (in thousands, except ratios) Underwriting and Investing Activities Top line premium growth driven primarily by new initiatives that were launched in the second half of 2009 Growth in net investment income reflects 12.2% growth in average invested assets, off-set by
Slide 5: YTD 2010 v. YTD 2009 Combined Ratio Analysis
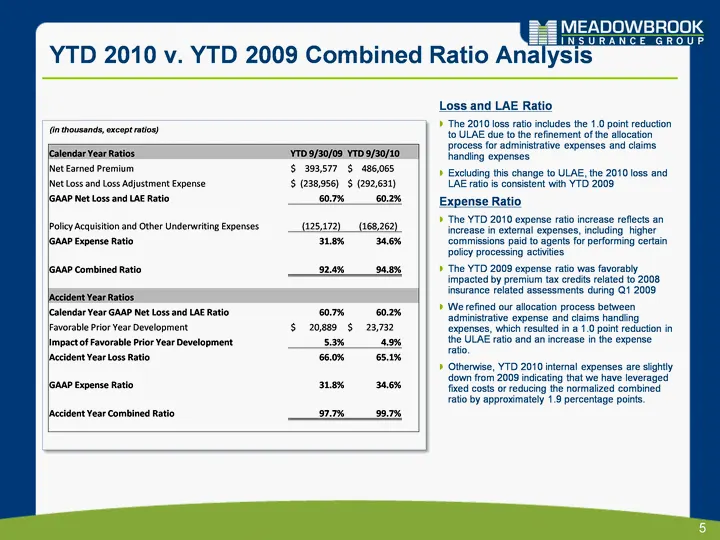
5 YTD 2010 v. YTD 2009 Combined Ratio Analysis Loss and LAE Ratio The 2010 loss ratio includes the 1.0 point reduction to ULAE due to the refinement of the allocation process for administrative expenses and claims handling expenses Excluding this change to ULAE, the 2010 loss and LAE ratio is consis
Slide 6: ROAE Components
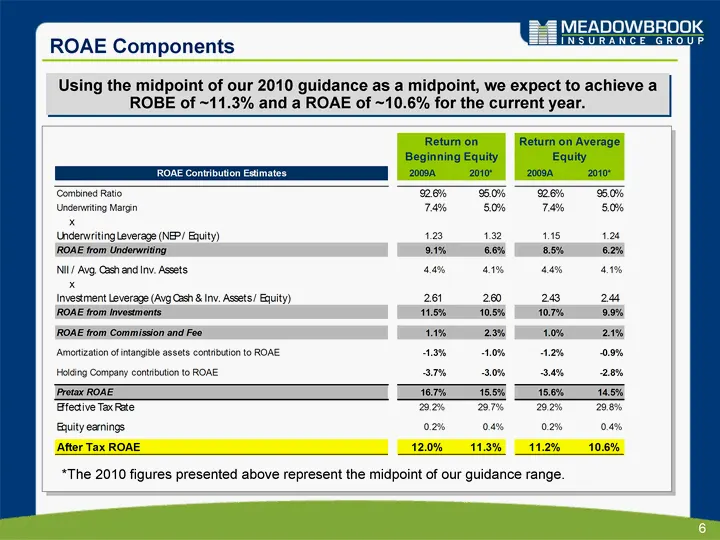
6 ROAE Components Using the midpoint of our 2010 guidance as a midpoint, we expect to achieve a ROBE of ~11.3% and a ROAE of ~10.6% for the current year. *The 2010 figures presented above represent the midpoint of our guidance range.
Slide 7: Investment Portfolio Appendix
7 Investment Portfolio Appendix
Slide 8: We Maintain a High Quality, Low Risk Investment Portfolio
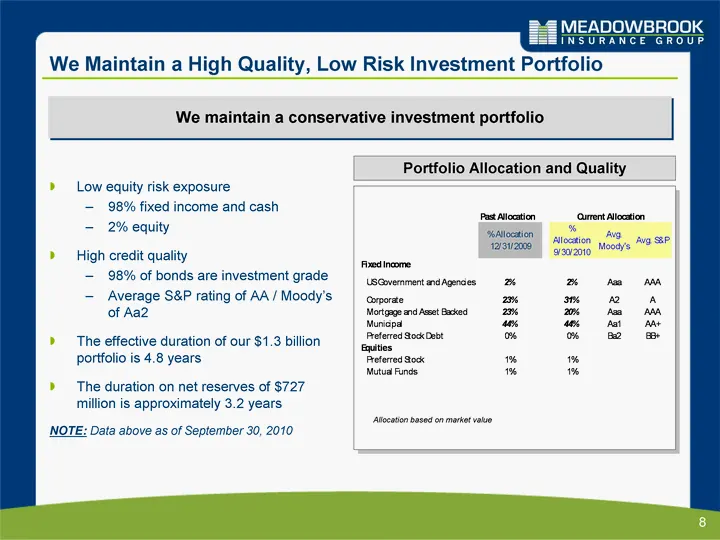
8 We Maintain a High Quality, Low Risk Investment Portfolio We maintain a conservative investment portfolio Portfolio Allocation and Quality Allocation based on market value Low equity risk exposure 98% fixed income and cash 2% equity High credit quality 98% of bonds are investment grade Average S&P
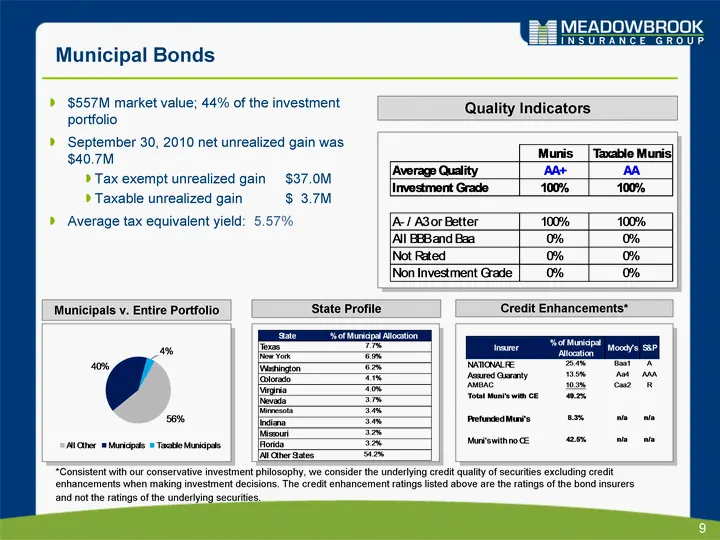
Slide 9: Municipal Bonds
9 Municipal Bonds Municipals v. Entire Portfolio Quality Indicators State Profile Credit Enhancements* $557M market value; 44% of the investment portfolio September 30, 2010 net unrealized gain was $40.7M Tax exempt unrealized gain $37.0M Taxable unrealized gain $ 3.7M Average tax equivalent yield:
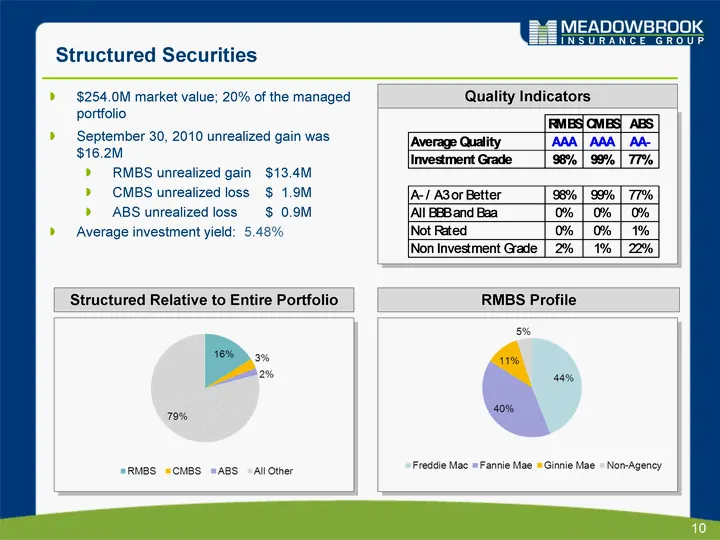
Slide 10: Structured Securities
10 Structured Securities Structured Relative to Entire Portfolio Quality Indicators RMBS Profile $254.0M market value; 20% of the managed portfolio September 30, 2010 unrealized gain was $16.2M RMBS unrealized gain $13.4M CMBS unrealized loss $ 1.9M ABS unrealized loss $ 0.9M Average investment yiel
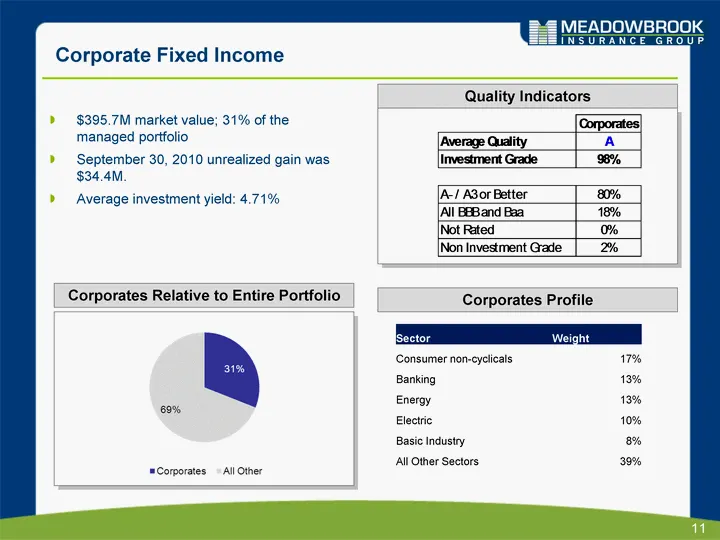
Slide 11: Corporate Fixed Income
11 Corporate Fixed Income Corporates Profile Corporates Relative to Entire Portfolio Quality Indicators Sector Weight Consumer non-cyclicals 17% Banking 13% Energy 13% Electric 10% Basic Industry 8% All Other Sectors 39% $395.7M market value; 31% of the managed portfolio September 30, 2010 unrealize
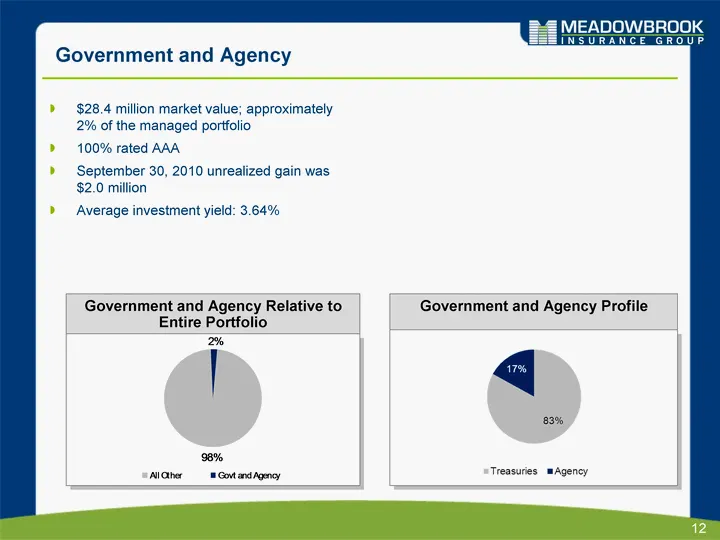
Slide 12: Government and Agency
12 Government and Agency Government and Agency Profile Government and Agency Relative to Entire Portfolio $28.4 million market value; approximately 2% of the managed portfolio 100% rated AAA September 30, 2010 unrealized gain was $2.0 million Average investment yield: 3.64%
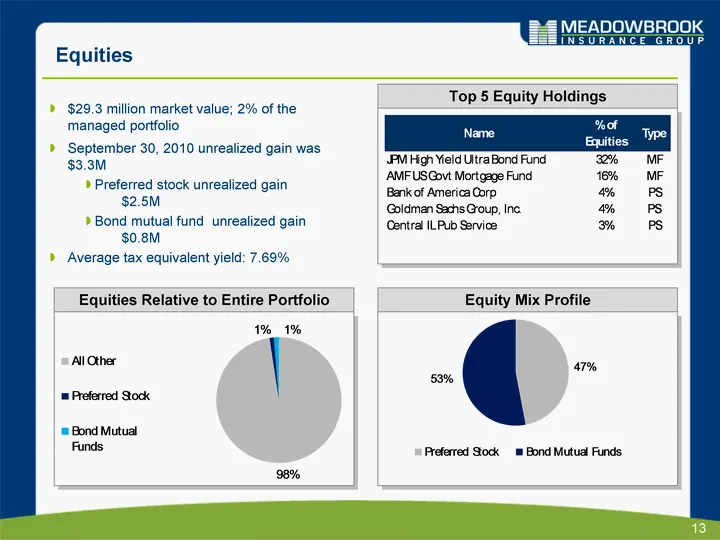
Slide 13: Equities
13 Equities Equity Mix Profile Equities Relative to Entire Portfolio Top 5 Equity Holdings $29.3 million market value; 2% of the managed portfolio September 30, 2010 unrealized gain was $3.3M Preferred stock unrealized gain $2.5M Bond mutual fund unrealized gain $0.8M Average tax equivalent yield: 7

Slide 14
Source: SEC EDGAR · 8-K filed Nov 30, 2010
More decks from Meadowbrook Insurance Group Inc
 Q3 2014 Earnings Presentation26 slides · Nov 18, 2014
 Q3 2014 Earnings Presentation19 slides · Nov 18, 2014
 Q2 2014 Earnings Presentation21 slides · Aug 28, 2014
 Q2 2014 Earnings Presentation27 slides · Aug 28, 2014
 Investor Presentation (June 2014)31 slides · Jun 3, 2014
 Q1 2014 Earnings Presentation21 slides · Jun 3, 2014