Abington Bancorp — IPO Roadshow (June 2007)
21 slides from Abington Bancorp's IPO roadshow presentation, Jun 18, 2007
Slide 1: Abington Bancorp, Inc. Syndicated Stock Offering June 2007
Abington Bancorp, Inc. has filed a registration statement (including a prospectus) with the SEC for the offering to which this communication relates. Before you invest, you should read the prospectus in that registration statement and other documents Abington Bancorp, Inc. has filed with the SEC for
Slide 2: Disclaimer
2 DisclaimerThis presentation is for informational purposes only and does not constitute an offer to sell shares of common stock of Abington Bancorp, Inc. Please refer to the prospectus dated May 14, 2007. Certain comments made in the course of this presentation by Abington are forward-looking in na
Slide 3: Our roots run deep …
Our roots run deep …
Slide 4: Our roots run deep…
4Our roots run deep…In 1867, a group of influential residents of Abington Township met at the Phoenix Hotel, then located at the southwest corner of Old York Road and West Avenue in Jenkintown. At this meeting, the first building and loan association in Jenkintown was founded. The most noteworthy me
Slide 5: Our roots run deep…
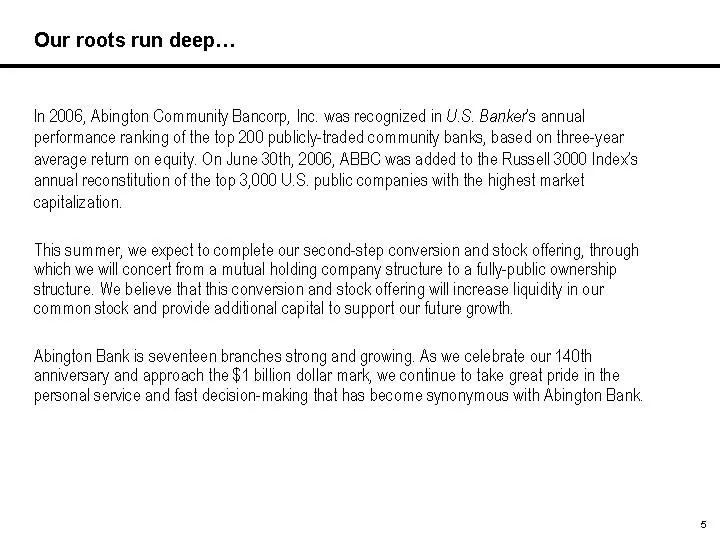
5 Our roots run deep…In 2006, Abington Community Bancorp, Inc. was recognized in U.S. Banker’s annual performance ranking of the top 200 publicly-traded community banks, based on three-year average return on equity. On June 30th, 2006, ABBC was added to the Russell 3000 Index’s annual reconstitution
Slide 6: Syndicated Offering Highlights
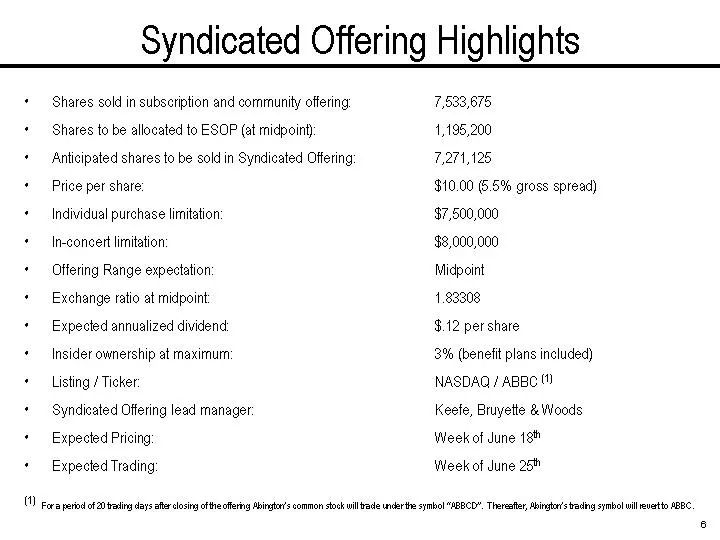
6Syndicated Offering Highlights • Shares sold in subscription and community offering:7,533,675 • Shares to be allocated to ESOP (at midpoint):1,195,200 • Anticipated shares to be sold in Syndicated Offering:7,271,125 • Price per share:$10.00 (5.5% gross spread)•Individual purchase limitation:$7,500,
Slide 7: Management Participants
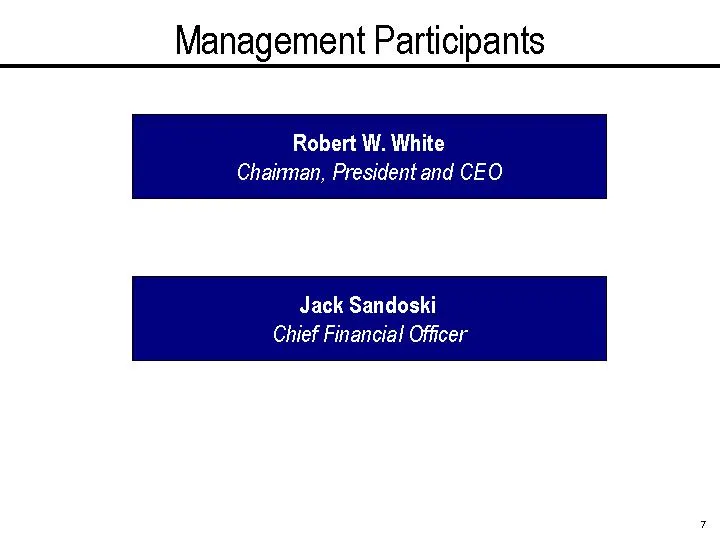
7 Management Participants Robert W. White Chairman, President and CEO Jack Sandoski Chief Financial Officer
Slide 8: Directors and Executive Officers
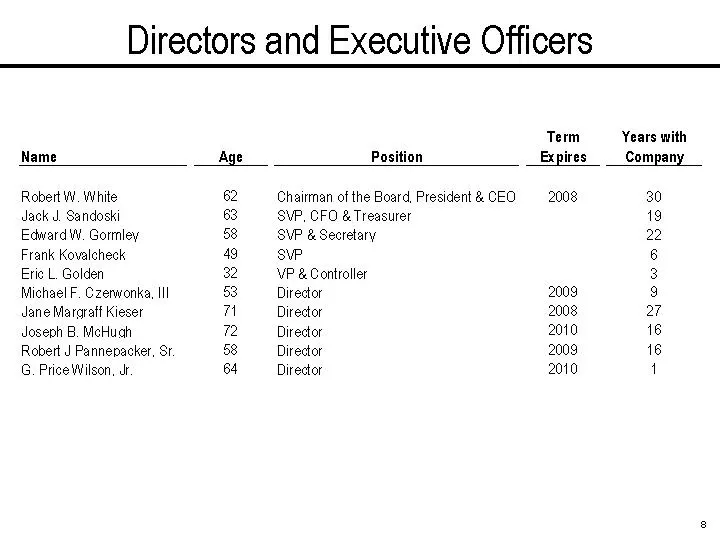
8Directors and Executive Officers Name Age Position Term Expires Years with Company Robert W. White 62 Chairman of the Board, President & CEO 2008 30 Jack J. Sandoski 63 SVP, CFO & Treasurer 19 Edward W. Gormley 58 SVP & Secretary 22 Frank Kovalcheck 49 SVP6Eric L. Golden 32 VP & Controller 3 Michae
Slide 9: Overview of Second Step Conversion
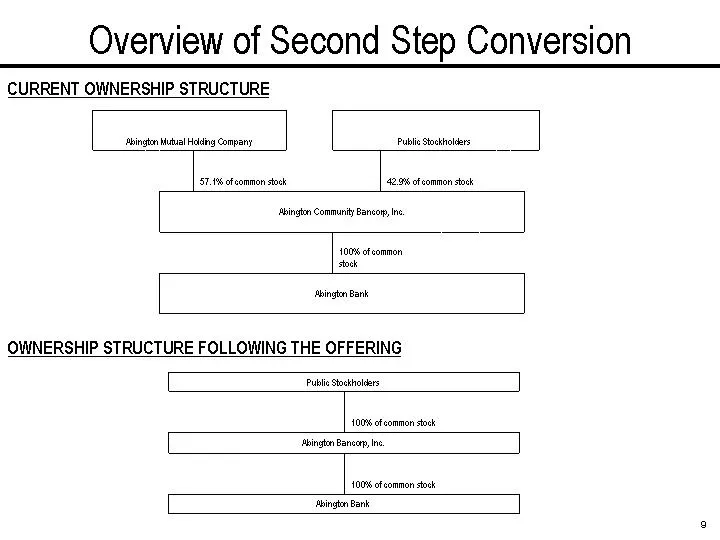
9Overview of Second Step Conversion CURRENT OWNERSHIP STRUCTURE Abington Bank100% of common stock Abington Community Bancorp, Inc.42.9% of common stock57.1% of common stock Public Stockholders Abington Mutual Holding Company OWNERSHIP STRUCTURE FOLLOWING THE OFFERING Abington Bank100% of common stoc
Slide 10: Investment Highlights
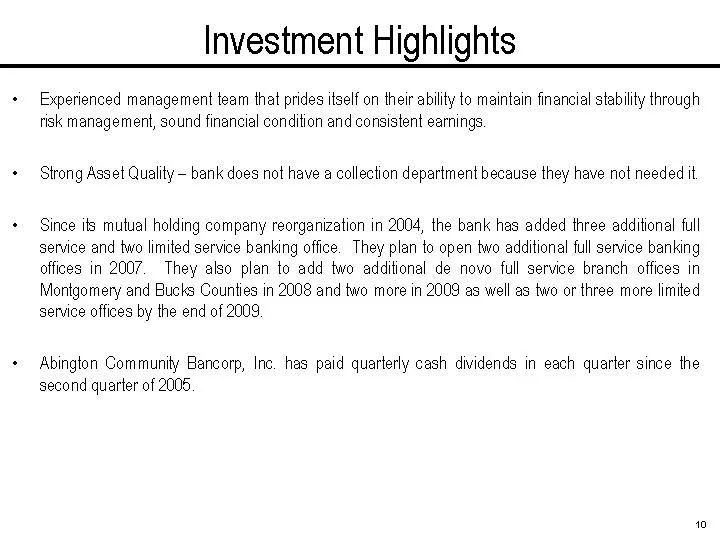
10Investment Highlights • Experienced management team that prides itself on their ability to maintain financial stability through risk management, sound financial condition and consistent earnings. • Strong Asset Quality -bank does not have a collection department because they have not needed it. •
Slide 11: Pro Forma Summary
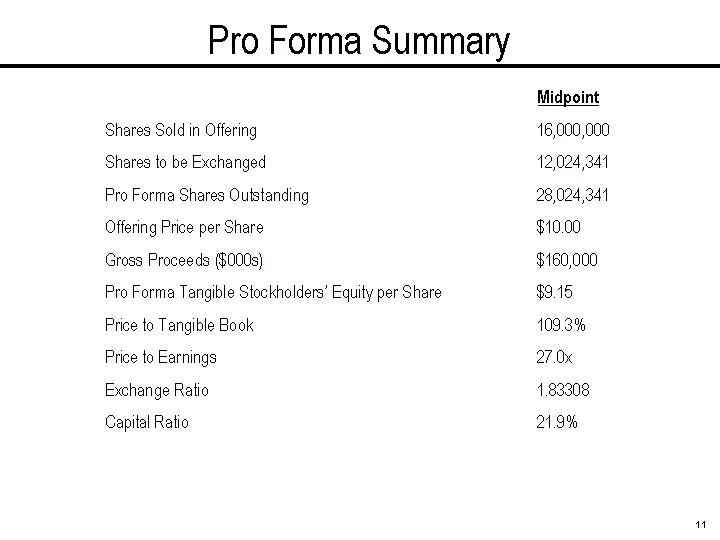
11Pro Forma Summary Midpoint Shares Sold in Offering16,000,000Shares to be Exchanged 12,024,341 Pro Forma Shares Outstanding 28,024,341 Offering Price per Share $10.00 Gross Proceeds ($000s) $160,000 Pro Forma Tangible Stockholders’ Equity per Share $9.15 Price to Tangible Book 109.3% Price to Earni
Slide 12: Growth Highlights
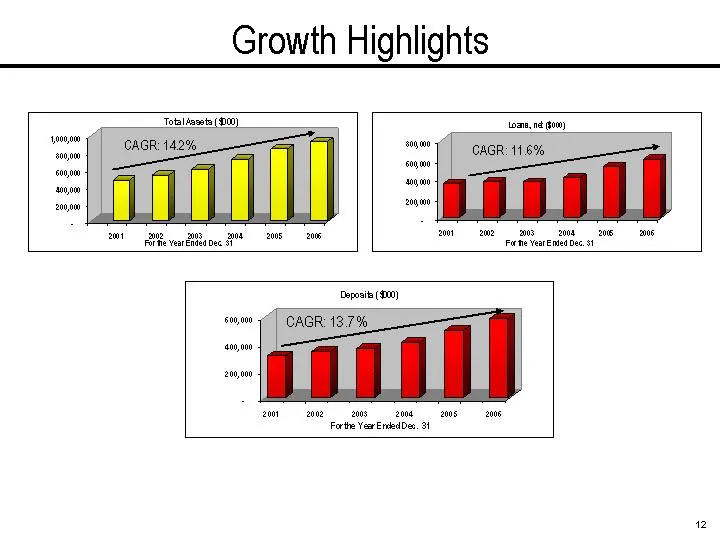
12 Growth Highlights 2001 2002 2003 2004 2005 2006 Total Assets ($000) For the Year Ended Dec. 31CAGR: 14.2% -200,000 400,000 600,000 800,000 2001 2002 2003 2004 2005 2006 Loans, net ($000).For the Year Ended Dec. 31CAGR: 11.6% - 200,000 400,000 600,000 2001 2002 2003 2004 2005 2006 Deposits ($000).
Slide 13: Loan Portfolio at 12/31/06
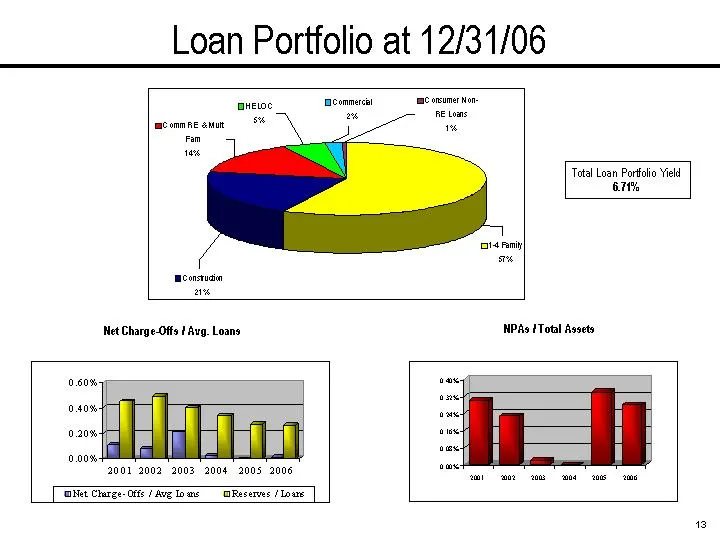
13 Loan Portfolio at 12/31/06 1-4 Family 57% Construction 21% Comm RE & Mult Fam 14% HELOC 5% Commercial 2% Consumer Non-RE Loans 1% Net Charge-Offs / Avg. Loans NPAs / Total Assets 0.00% 0.20% 0.40% 0.60% 2001 2002 2003 2004 2005 2006 Net Charge-Offs / Avg Loans Reserves / Loans 0.00% 0.08% 0.16% 0
Slide 14: Deposit Portfolio at 12/31/06
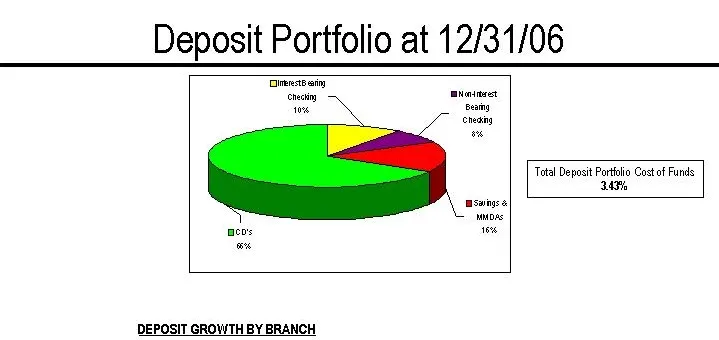
Deposit Portfolio at 12/31/06 Tieeseain neki a nwa Total Deposit Potolio Cost of Funds 2aF saris cos 16% DEPOSIT GROWTH BY BRANCH
Slide 15: Deposit Portfolio at 12/31/06
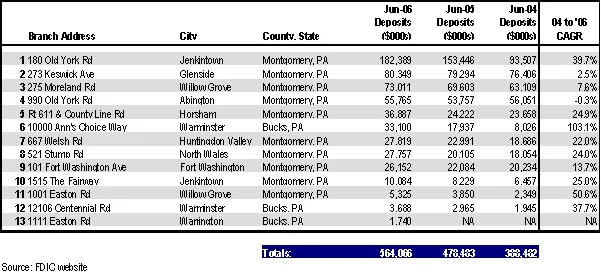
14 Deposit Portfolio at 12/31/06 Non-Interest Bearing Checking8%Interest Bearing Checking 10% Savings & MMDAs 16% CD's 66% DEPOSIT GROWTH BY BRANCH Jun-06 Jun-05 Jun-04 Deposits Deposits Deposits 04 to '06 Branch Address City County, State ($000s) ($000s) ($000s)CAGR 1180 Old York Rd Jenkintown Mont
Slide 16: Branch Network
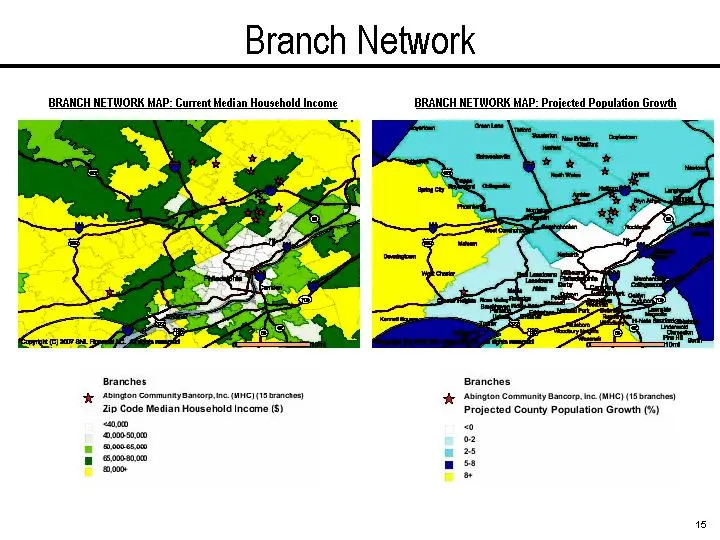
15 Branch Network BRANCH NETWORK MAP: Projected Population Growth BRANCH NETWORK MAP: Current Median Household Income
Slide 17: Dividend History
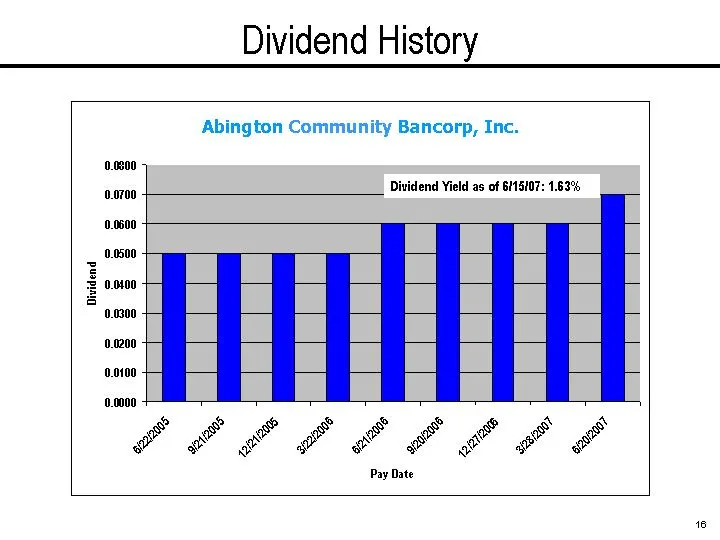
16 Dividend History Abington Community Bancorp, Inc.0.0000 0.0100 0.0200 0.0300 0.0400 0.0500 0.0600 0.0700 0.0800 6/22/2005 9/21/2005 12/21/2005 3/22/2006 6/21/2006 9/20/2006 12/27/2006 3/28/2007 6/20/2007 Pay Date Dividend Dividend Yield as of 6/15/07: 1.63%
Slide 18: Historical Financial Highlights
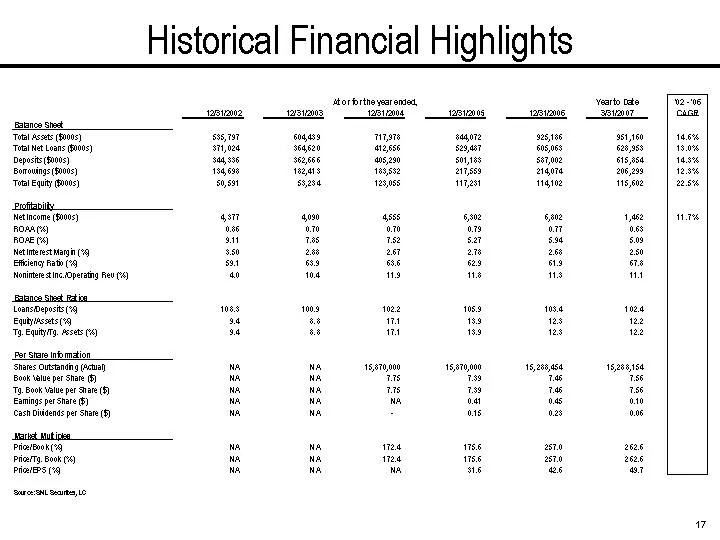
17Historical Financial HighlightsYear to Date'02 - '0612/31/2002 12/31/2003 12/31/2004 12/31/2005 12/31/2006 3/31/2007 CAGR Balance Sheet Total Assets ($000s) 535,797 604,439 717,978 844,072 925,186 951,160 14.6% Total Net Loans ($000s) 371,024 364,620 412,656 529,487 605,063 628,953 13.0% Deposits
Slide 19: Pro Forma Peer Group Comparison
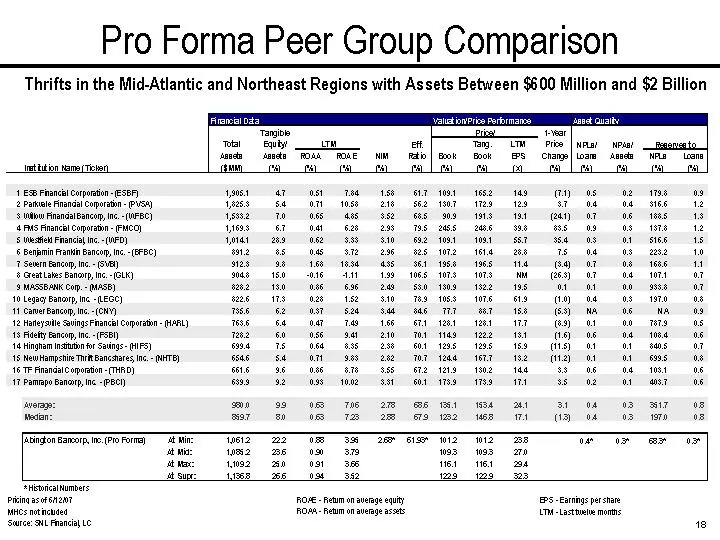
18Pro Forma Peer Group Comparison Financial DataValuation /Price Performance Asset Quality TangiblePrice/1-YearTotalEquity/Eff.Tang.LTMPrice NPLs/NPAs/AssetsAssetsROAAROAENIMRatioBookBookEPSChangeLoansAssetsNPLsLoansInstitution Name (Ticker)($MM)(%)(%)(%)(%)(%)(%)(%)(x)(%)(%)(%)(%)(%)1ESB Financial
Slide 20: Price Performance 12/17/04 - 6/12/07
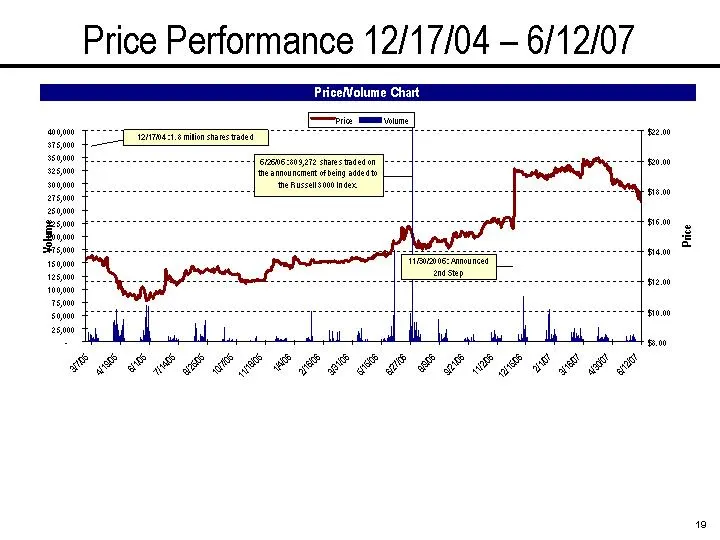
19 Price Performance 12/17/04 -6/12/07 $8.00 $10.00 $12.00 $14.00 $16.00 $18.00 $20.00 $22.00 6/12/07 4/30/07 3/16/07 2/1/07 12/15/06 11/2/06 9/21/06 8/9/06 6/27/06 5/15/06 3/31/06 2/16/06 1/4/06 11/18/05 10/7/05 8/25/05 7/14/05 6/1/05 4/19/05 3/7/05 Price-25,000 50,000 75,000 100,000 125,000 150,00
Slide 21: Thank you!
20 Thank you! Syndicated Stock Offering NASDAQ: ABBC June 2007 Abington Bancorp, Inc.
Source: SEC EDGAR · 425 filed Jun 18, 2007