Green Bancorp — Sandler O'Neill East Coast Financial Services Conference 2018
34 slides from Green Bancorp's conference presentation, Nov 6, 2018
Slide 1: Sandler O'Neill East Coast Financial Services Conference November 6-7, 2018
Sandler O’Neill East Coast Financial Services Conference November 6-7, 2018
Slide 2: Safe Harbor Statement
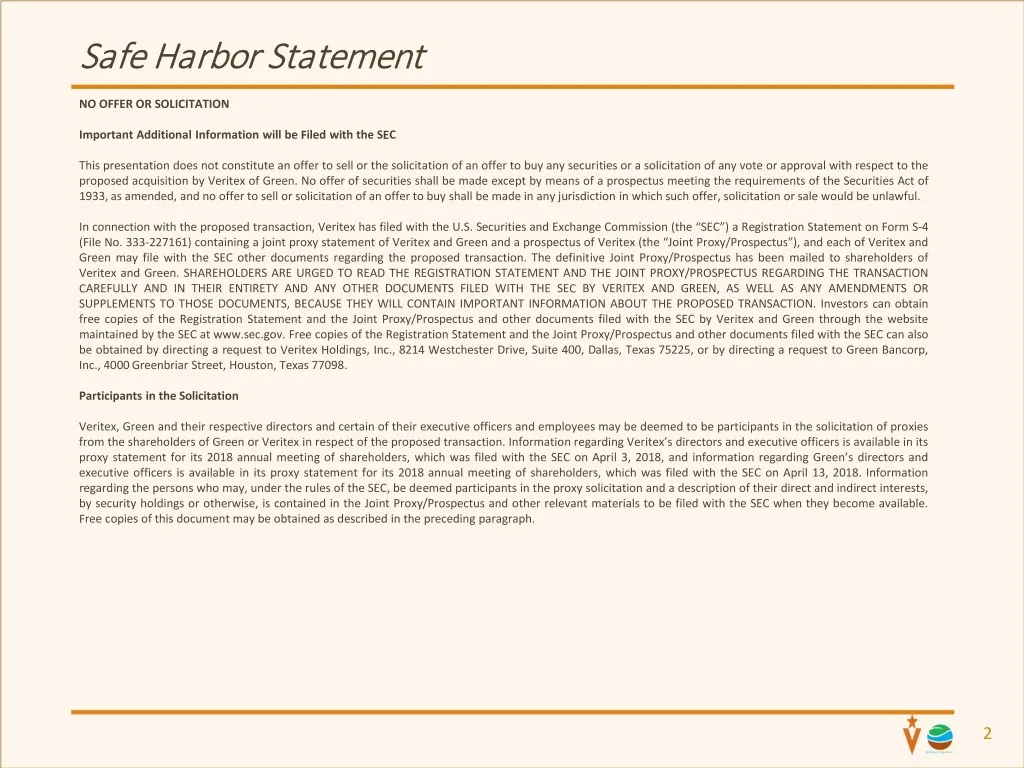
Safe Harbor Statement NO OFFER OR SOLICITATION Important Additional Information will be Filed with the SEC This presentation does not constitute an offer to sell or the solicitation of an offer to buy any securities or a solicitation of any vote or approval with respect to the proposed acquisition b
Slide 3: Forward Looking Statements
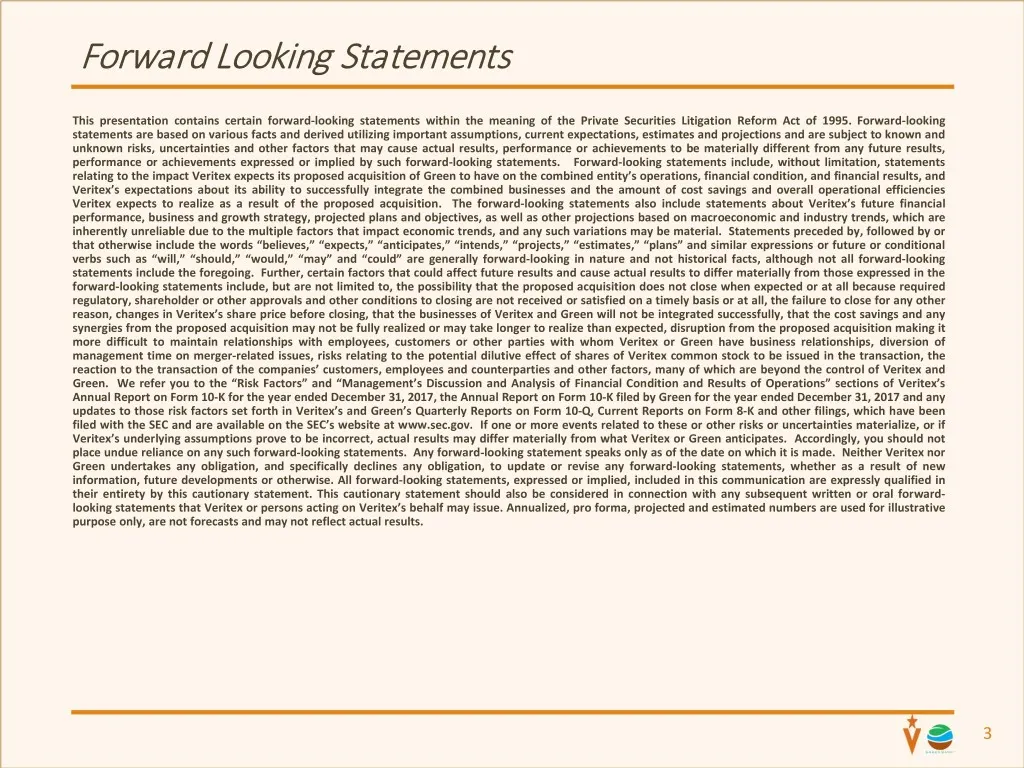
Forward Looking Statements This presentation contains certain forward-looking statements within the meaning of the Private Securities Litigation Reform Act of 1995. Forward-looking statements are based on various facts and derived utilizing important assumptions, current expectations, estimates and
Slide 4: VBTX Third Quarter 2018 Summary
VBTX Third Quarter 2018 Summary 4
Slide 5: Third Quarter 2018 Summary
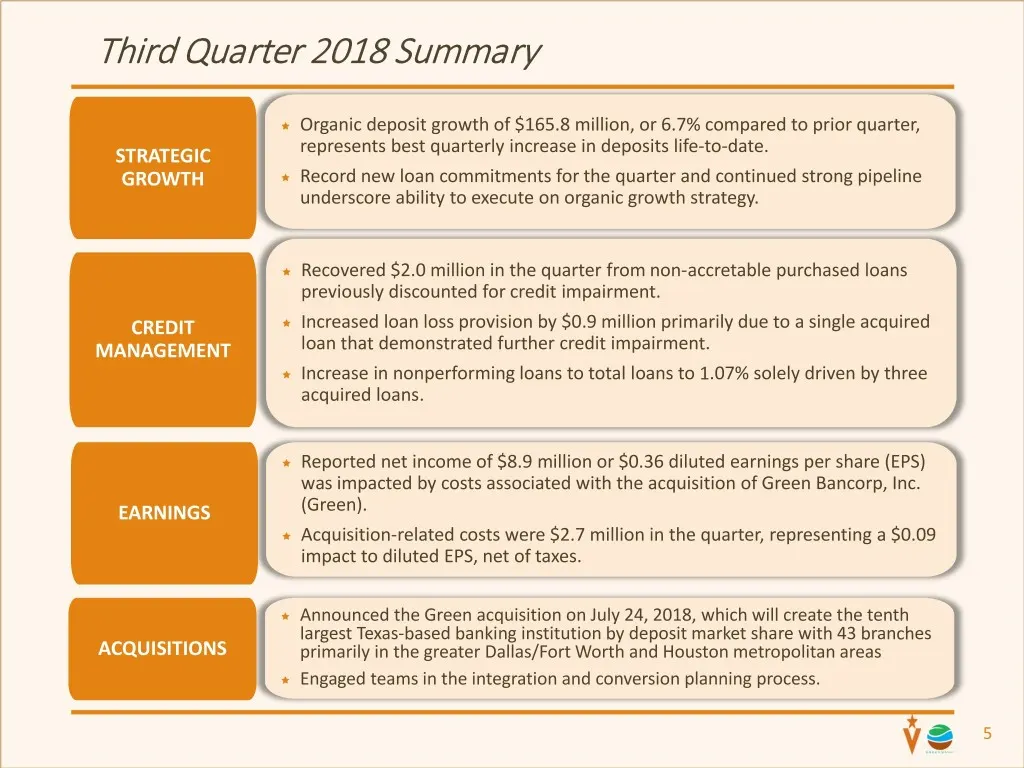
Third Quarter 2018 Summary Organic deposit growth of $165.8 million, or 6.7% compared to prior quarter, STRATEGIC represents best quarterly increase in deposits life-to-date. GROWTH Record new loan commitments for the quarter and continued strong pipeline underscore ability to execute on organic
Slide 6: Third Quarter 2018 Financial Highlights
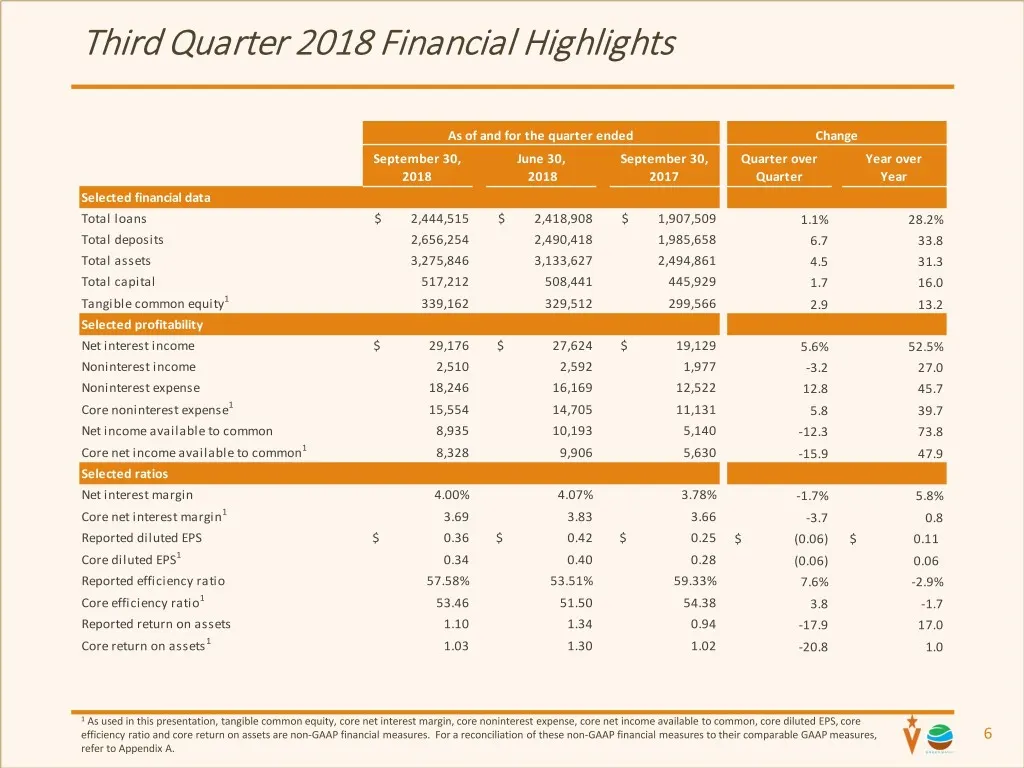
Third Quarter 2018 Financial Highlights As of and for the quarter ended Change September 30, June 30, September 30, Quarter over Year over 2018 2018 2017 Quarter Year Selected financial data Total loans $ 2,444,515 $ 2,418,908 $ 1,907,509 1.1% 28.2% Total deposits 2,656,254 2,490,418 1,985,658 6.7 3
Slide 7: Continued Growth of a Diversified Loan Portfolio
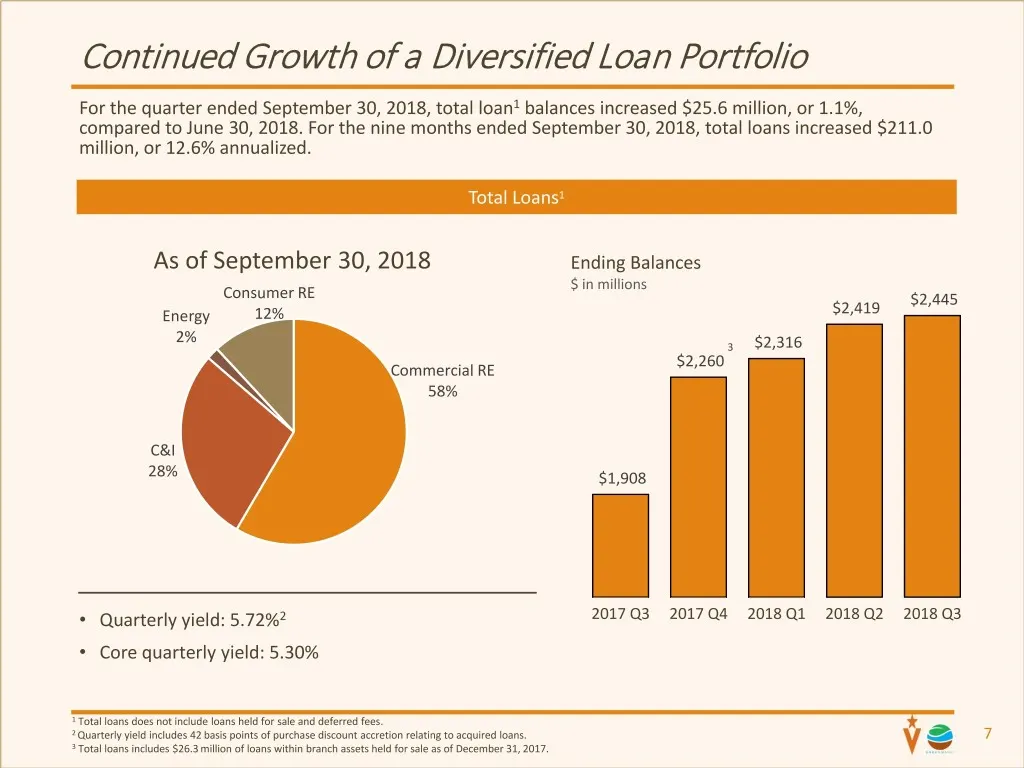
Continued Growth of a Diversified Loan Portfolio For the quarter ended September 30, 2018, total loan1 balances increased $25.6 million, or 1.1%, compared to June 30, 2018. For the nine months ended September 30, 2018, total loans increased $211.0 million, or 12.6% annualized. Total Loans1 As of Sep
Slide 8: New Commitments, Payoffs and Pay-downs
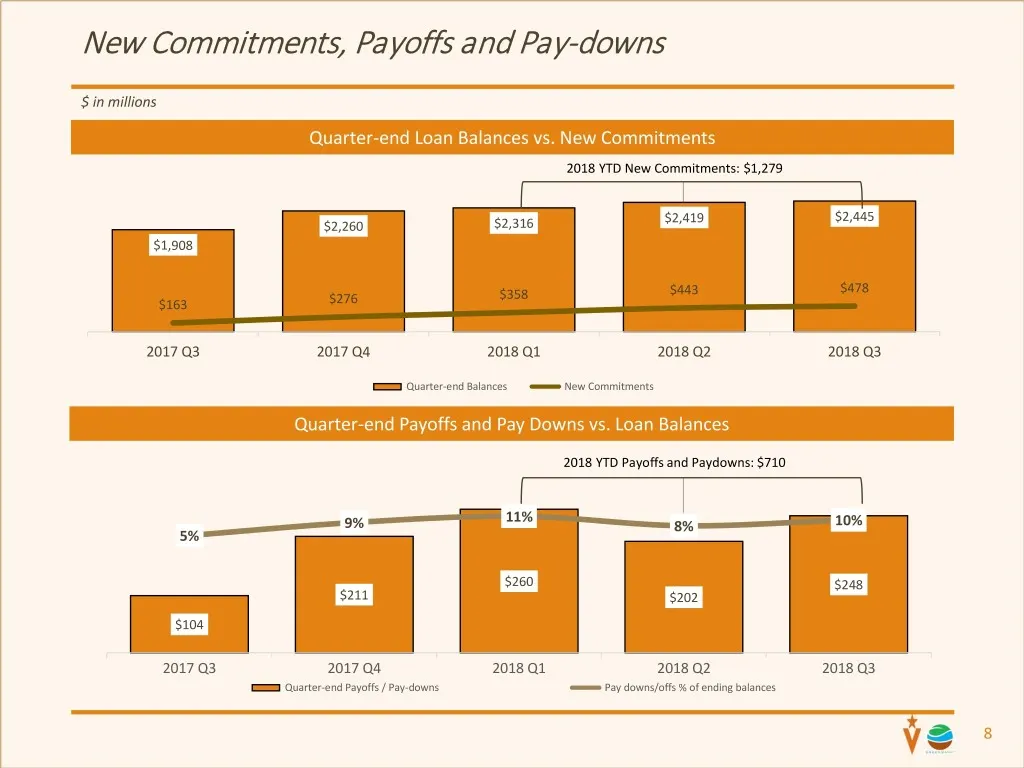
New Commitments, Payoffs and Pay-downs $ in millions Quarter-end Loan Balances vs. New Commitments 2018 YTD New Commitments: $1,279 $2,419 $2,445 $2,260 $2,316 $1,908 $358 $443 $478 $163 $276 2017 Q3 2017 Q4 2018 Q1 2018 Q2 2018 Q3 Quarter-end Balances New Commitments Quarter-end Payoffs and Pay Dow
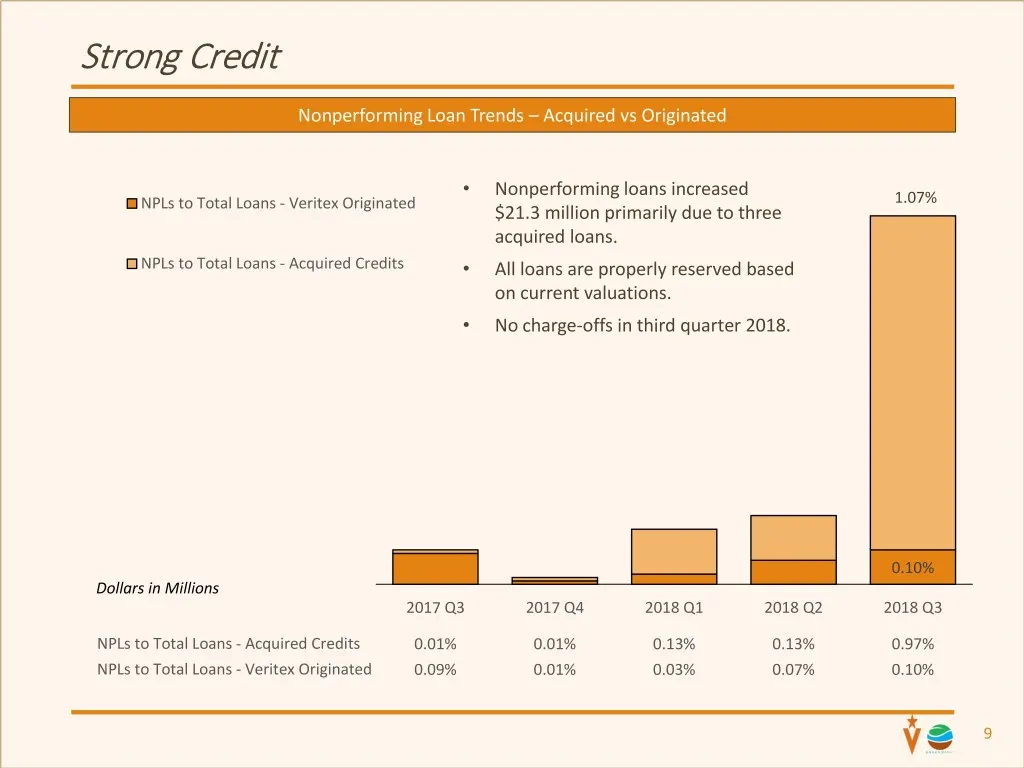
Slide 9: Strong Credit: Nonperforming Loan Trends – Acquired vs Originated
Strong Credit Nonperforming Loan Trends – Acquired vs Originated • Nonperforming loans increased 1.07% NPLs to Total Loans - Veritex Originated $21.3 million primarily due to three acquired loans. NPLs to Total Loans - Acquired Credits • All loans are properly reserved based on current valuations. •
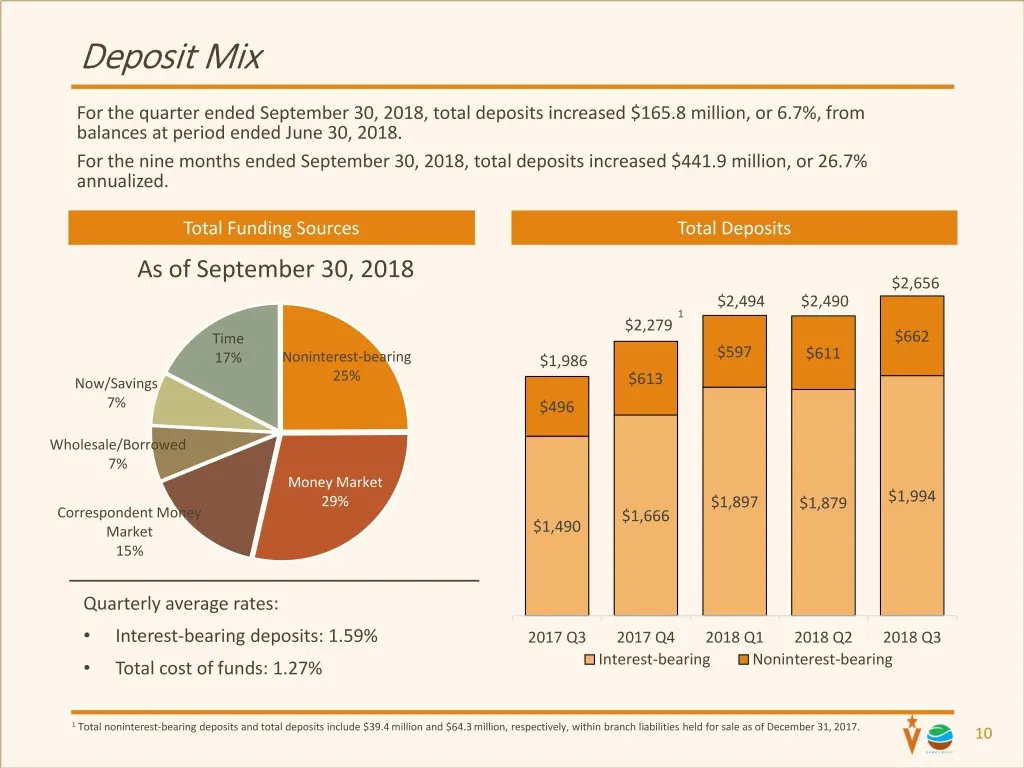
Slide 10: Deposit Mix
Deposit Mix For the quarter ended September 30, 2018, total deposits increased $165.8 million, or 6.7%, from balances at period ended June 30, 2018. For the nine months ended September 30, 2018, total deposits increased $441.9 million, or 26.7% annualized. Total Funding Sources Total Deposits As of
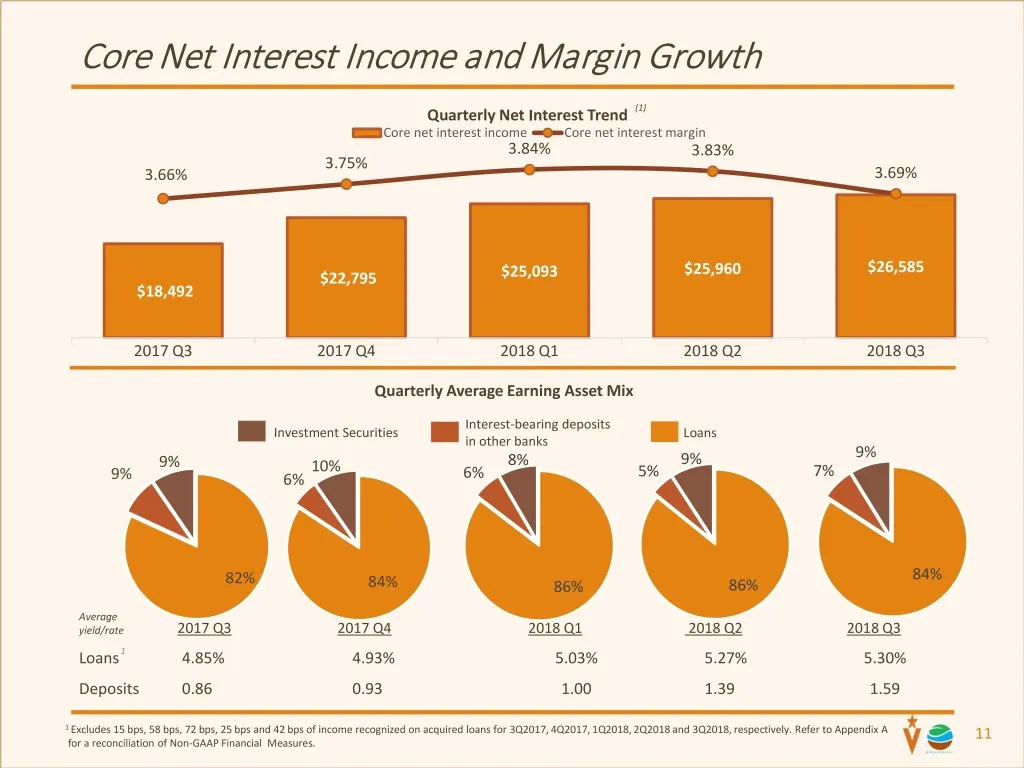
Slide 11: Core Net Interest Income and Margin Growth
Core Net Interest Income and Margin Growth Quarterly Net Interest Trend (1) Core net interest income Core net interest margin 3.84% 3.83% 3.75% 3.66% 3.69% $25,960 $26,585 $22,795 $25,093 $18,492 2017 Q3 2017 Q4 2018 Q1 2018 Q2 2018 Q3 Quarterly Average Earning Asset Mix Interest-bearing deposits In
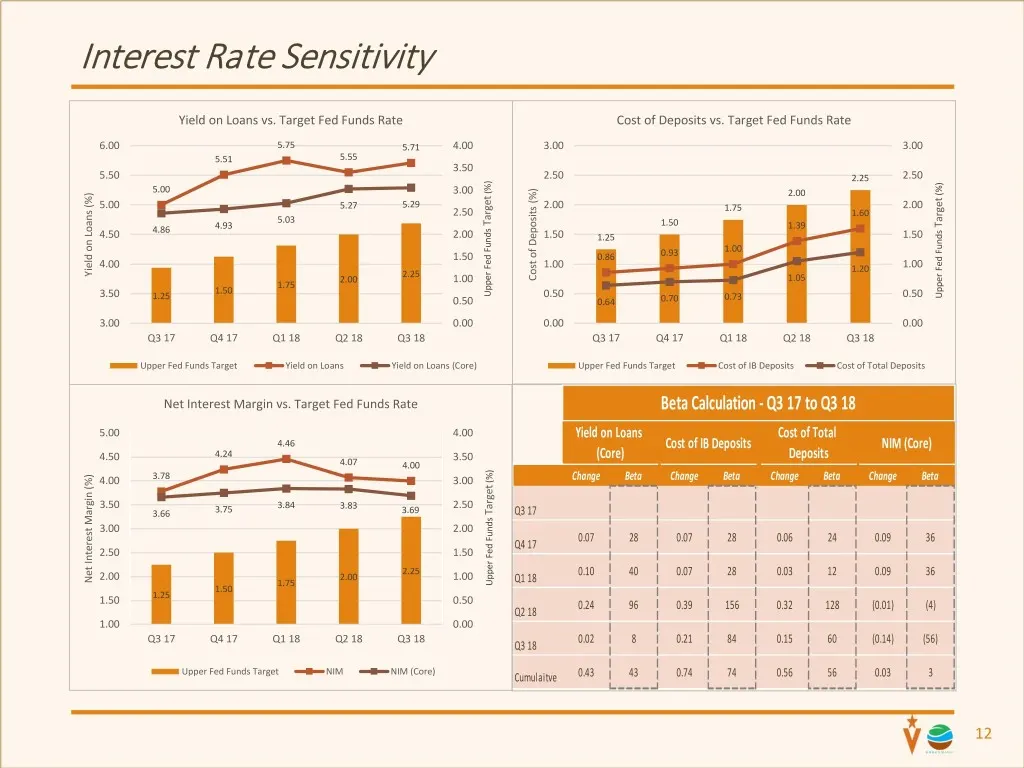
Slide 12: Interest Rate Sensitivity
Interest Rate Sensitivity Yield on Loans vs. Target Fed Funds Rate Cost of Deposits vs. Target Fed Funds Rate 6.00 5.75 5.71 4.00 3.00 3.00 5.51 5.55 3.50 5.50 2.50 2.25 2.50 5.00 (%) 3.00 2.00 (%) 5.00 5.27 5.29 2.00 1.75 2.00 2.50 1.60 5.03 Target 1.50 Target 4.86 4.93 1.39 4.50 2.00 1.50 1.25 1.5
Slide 13: Impact of core adjustments on Q3 2018
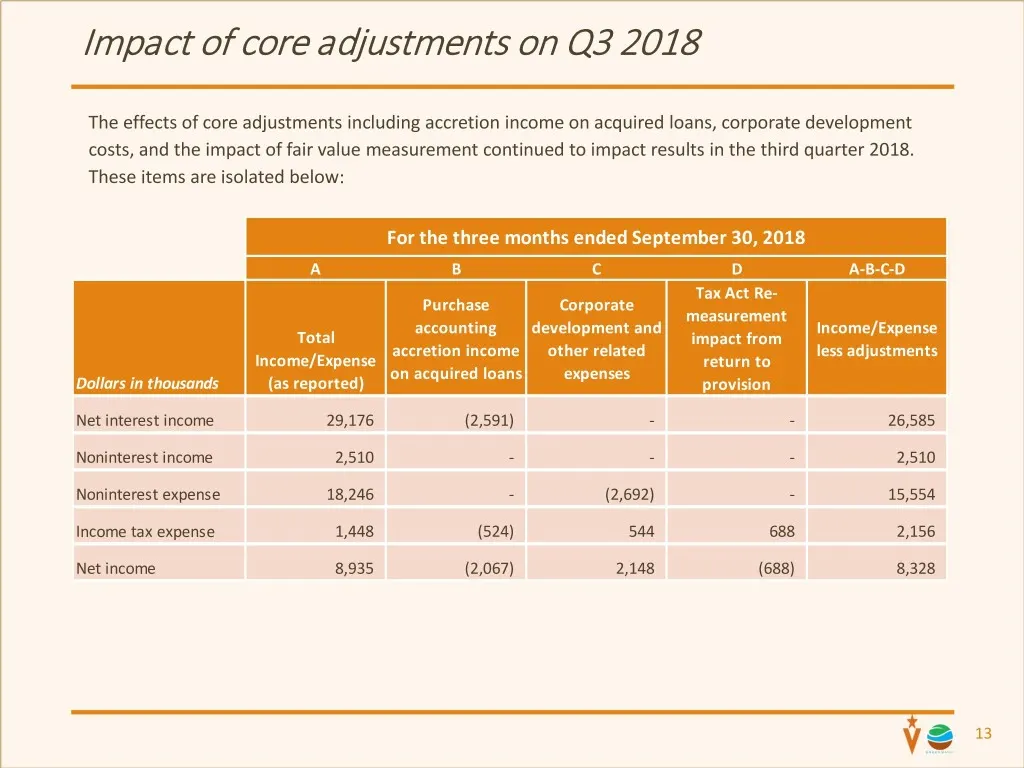
Impact of core adjustments on Q3 2018 The effects of core adjustments including accretion income on acquired loans, corporate development costs, and the impact of fair value measurement continued to impact results in the third quarter 2018. These items are isolated below: For the three months ended
Slide 14: GBNC Third Quarter 2018 Summary
GBNC Third Quarter 2018 Summary 14
Slide 15: Third Quarter 2018 Significant Items
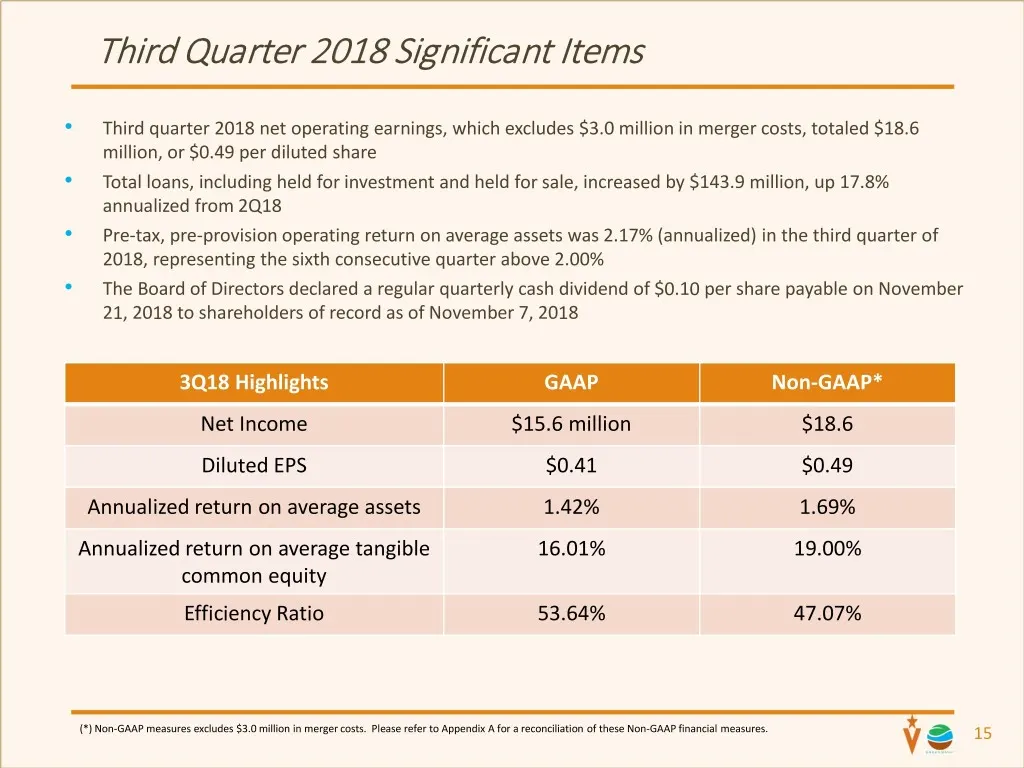
Third Quarter 2018 Significant Items • Third quarter 2018 net operating earnings, which excludes $3.0 million in merger costs, totaled $18.6 million, or $0.49 per diluted share • Total loans, including held for investment and held for sale, increased by $143.9 million, up 17.8% annualized from 2Q18
Slide 16: Fully Diluted EPS and TBVPS
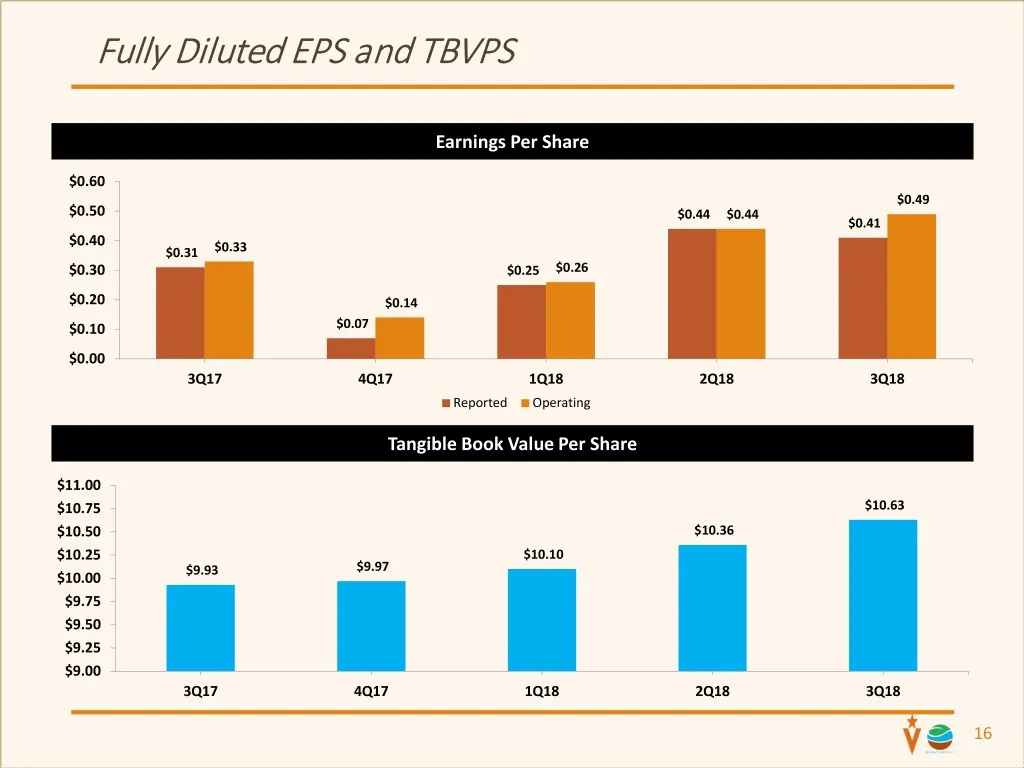
Fully Diluted EPS and TBVPS Earnings Per Share $0.60 $0.49 $0.50 $0.44 $0.44 $0.41 $0.40 $0.31 $0.33 $0.30 $0.25 $0.26 $0.20 $0.14 $0.10 $0.07 $0.00 3Q17 4Q17 1Q18 2Q18 3Q18 Reported Operating Tangible Book Value Per Share $11.00 $10.75 $10.63 $10.50 $10.36 $10.25 $10.10 $9.93 $9.97 $10.00 $9.75 $9.
Slide 17: Performance Metrics
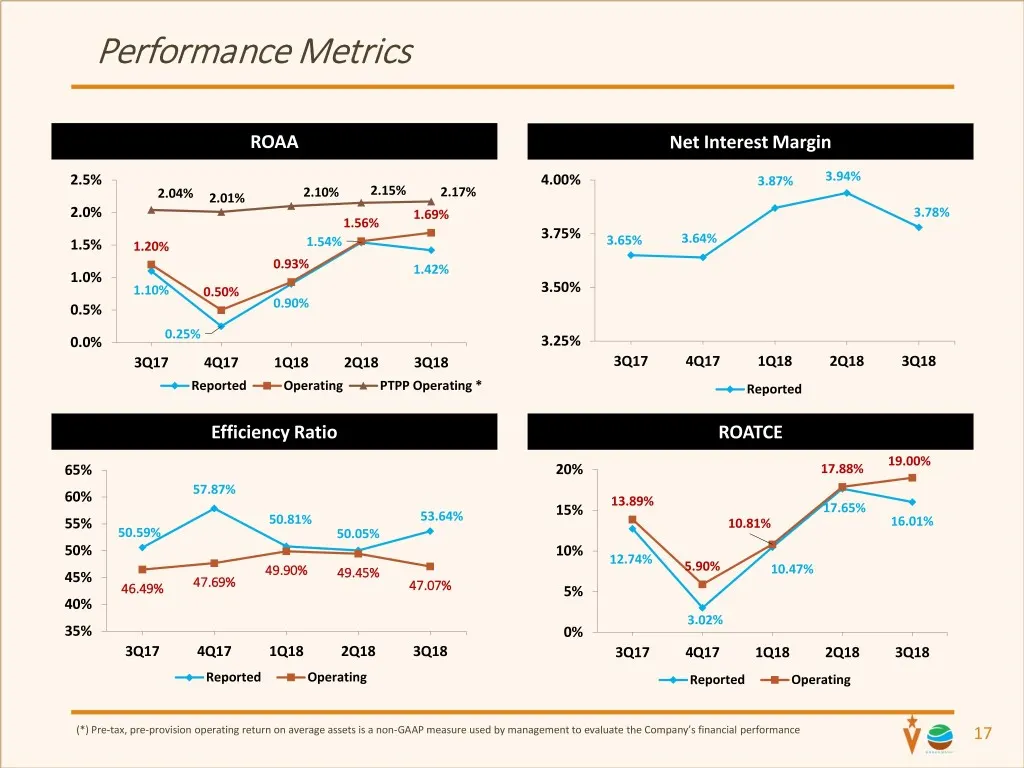
Performance Metrics ROAA Net Interest Margin 2.5% 4.00% 3.87% 3.94% 2.15% 2.04% 2.01% 2.10% 2.17% 2.0% 1.69% 3.78% 1.56% 3.75% 3.64% 1.5% 1.20% 1.54% 3.65% 0.93% 1.42% 1.0% 1.10% 0.50% 3.50% 0.5% 0.90% 0.25% 0.0% 3.25% 3Q17 4Q17 1Q18 2Q18 3Q18 3Q17 4Q17 1Q18 2Q18 3Q18 Reported Operating PTPP Operati
Slide 18: Loan Portfolio Overview
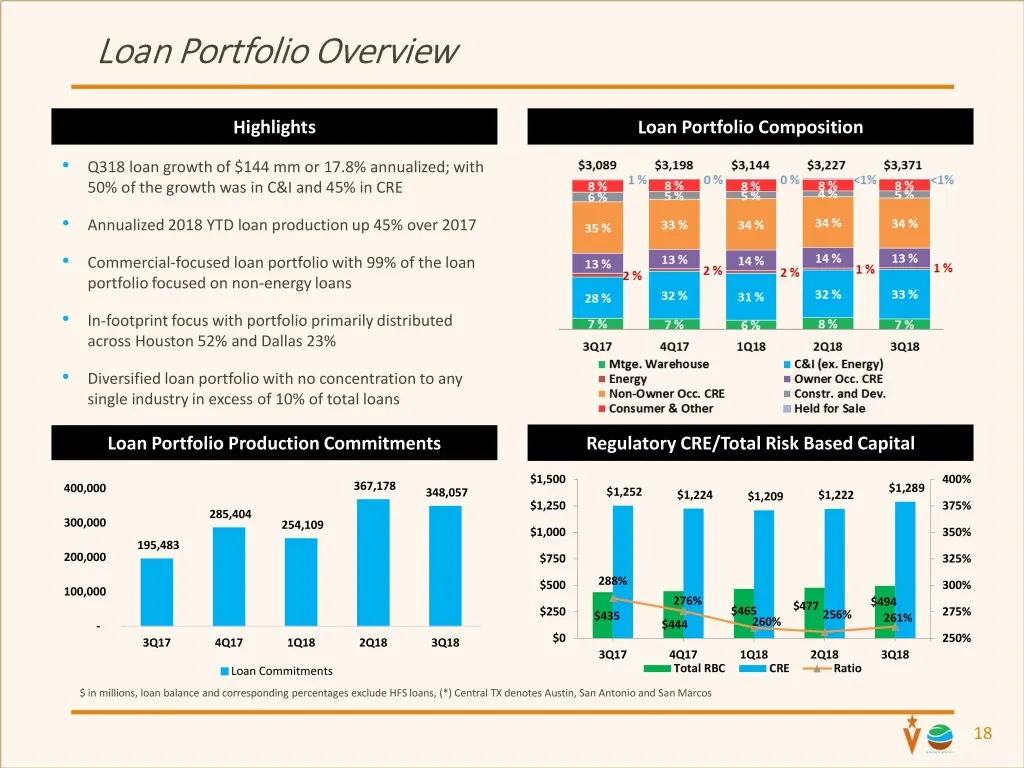
Loan Portfolio Overview Highlights Loan Portfolio Composition • Q318 loan growth of $144 mm or 17.8% annualized; with 50% of the growth was in C&I and 45% in CRE • Annualized 2018 YTD loan production up 45% over 2017 • Commercial-focused loan portfolio with 99% of the loan portfolio focused on non-e
Slide 19: Deposits & Liquidity Highlights
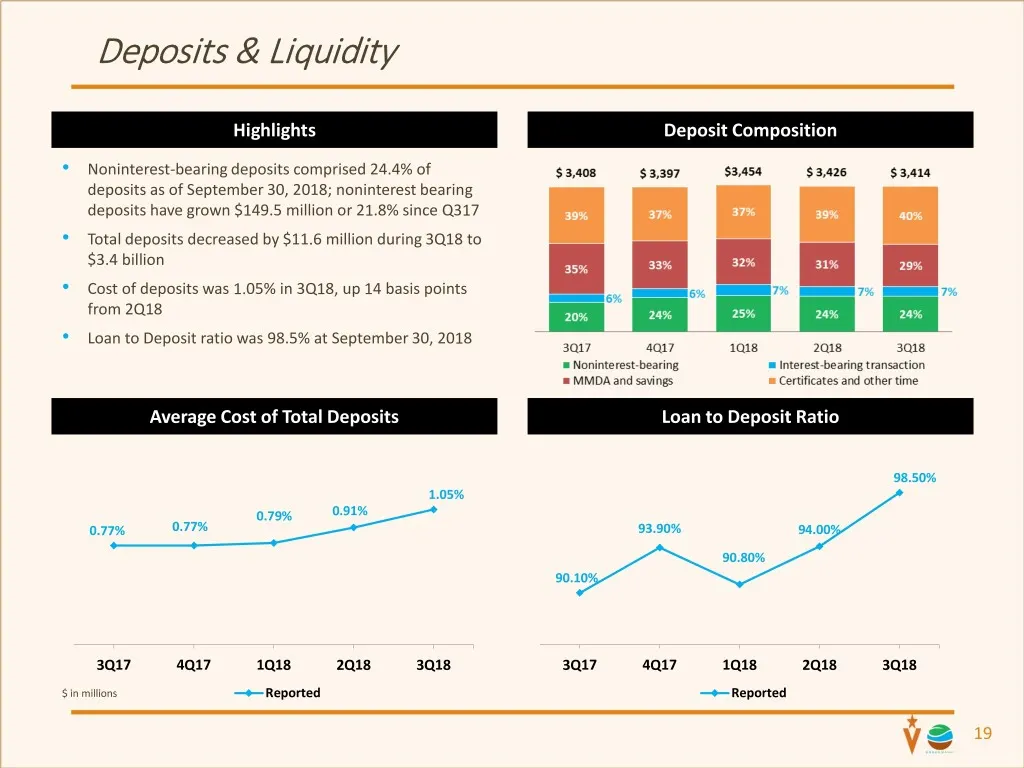
Deposits & Liquidity Highlights Deposit Composition • Noninterest-bearing deposits comprised 24.4% of deposits as of September 30, 2018; noninterest bearing deposits have grown $149.5 million or 21.8% since Q317 • Total deposits decreased by $11.6 million during 3Q18 to $3.4 billion • Cost of deposi
Slide 20: Net Interest Income & Net Interest Margin
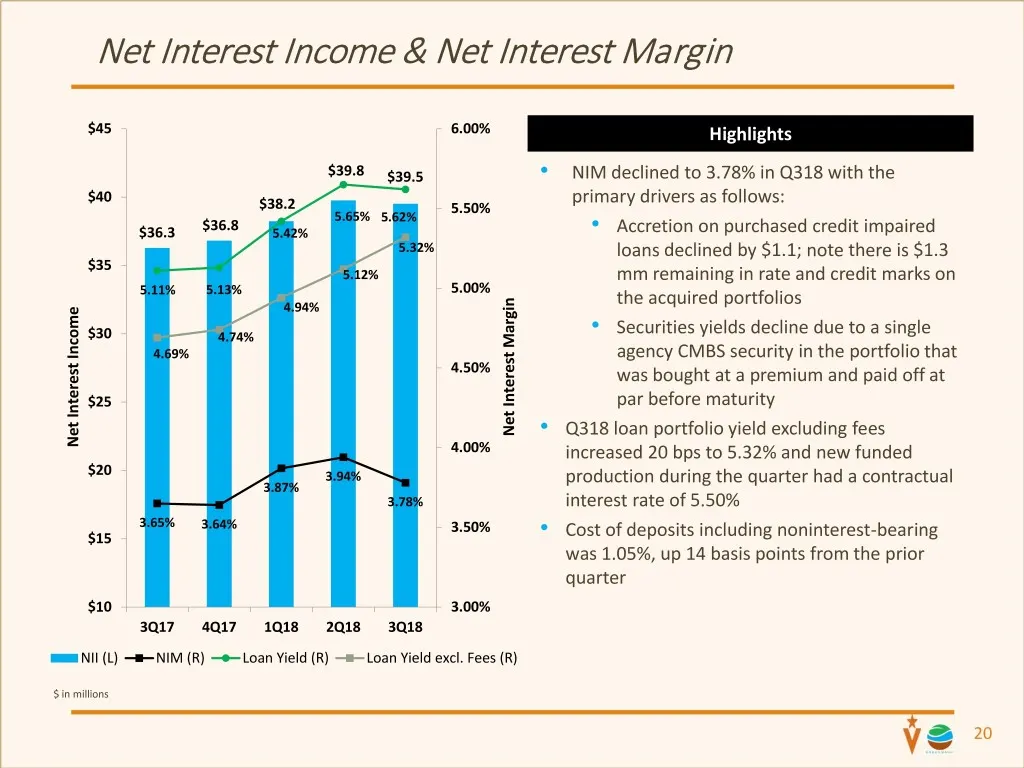
Net Interest Income & Net Interest Margin $45 6.00% Highlights $39.8 $39.5 • NIM declined to 3.78% in Q318 with the $40 primary drivers as follows: $38.2 5.50% 5.65% 5.62% $36.8 $36.3 5.42% • Accretion on purchased credit impaired 5.32% loans declined by $1.1; note there is $1.3 $35 5.12% mm remaini
Slide 21: Interest Rate Sensitivity
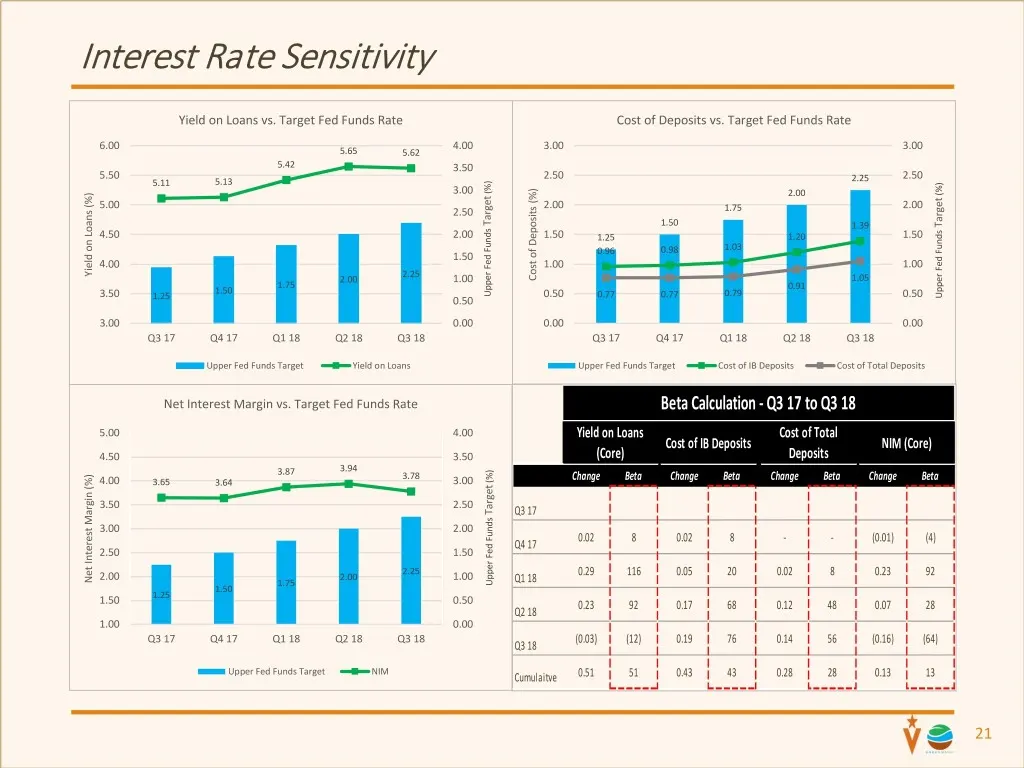
Interest Rate Sensitivity Yield on Loans vs. Target Fed Funds Rate Cost of Deposits vs. Target Fed Funds Rate 6.00 4.00 3.00 3.00 5.65 5.62 5.42 3.50 5.50 2.50 2.50 5.11 5.13 2.25 (%) 3.00 2.00 (%) 5.00 2.00 2.00 2.50 1.75 Target 1.50 1.39 Target 4.50 2.00 1.50 1.25 1.20 1.50 0.98 1.03 1.50 0.96 4.0
Slide 22: Noninterest Income
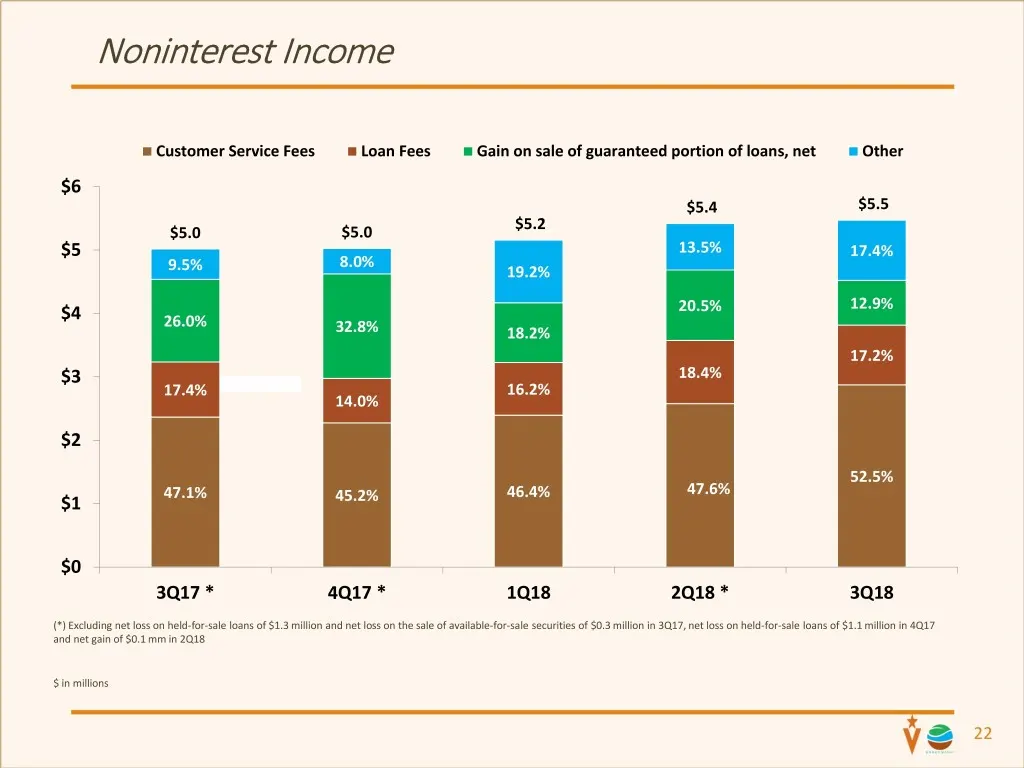
Noninterest Income Customer Service Fees Loan Fees Gain on sale of guaranteed portion of loans, net Other $6 $5.4 $5.5 $5.2 $5.0 $5.0 $5 13.5% 17.4% 8.0% 9.5% 19.2% 20.5% 12.9% $4 26.0% 32.8% 18.2% 17.2% $3 18.4% 17.4% 16.2% 14.0% $2 52.5% 47.1% 46.4% 47.6% $1 45.2% $0 3Q17 * 4Q17 * 1Q18 2Q18 * 3Q18
Slide 23: Asset Quality
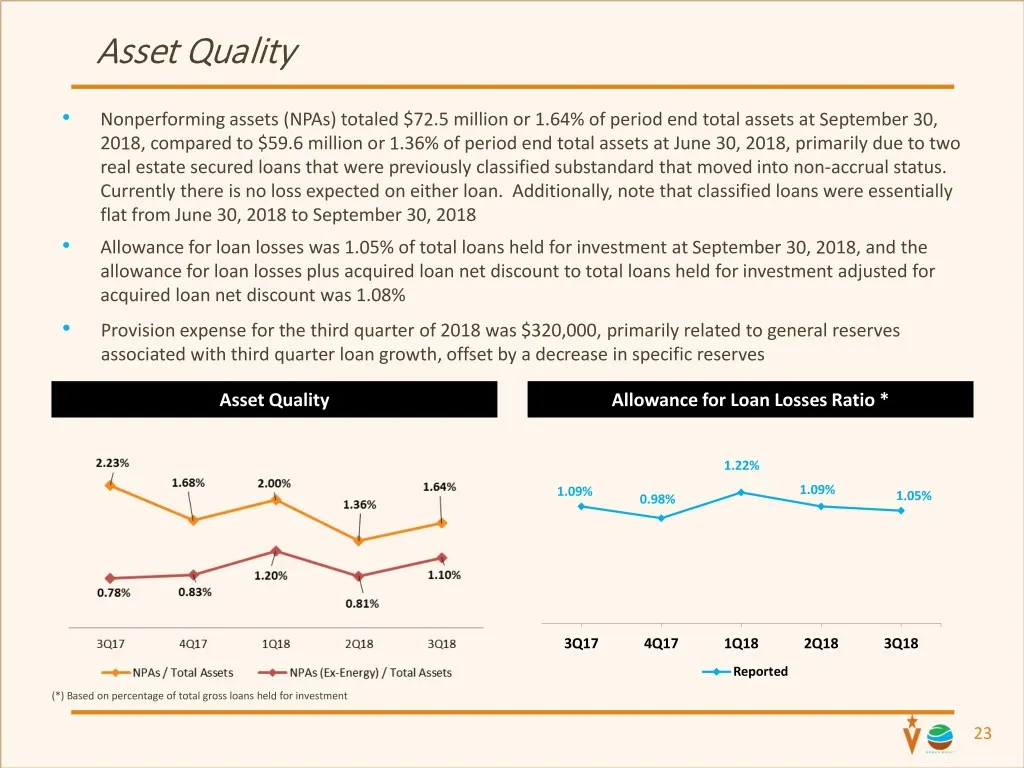
Asset Quality • Nonperforming assets (NPAs) totaled $72.5 million or 1.64% of period end total assets at September 30, 2018, compared to $59.6 million or 1.36% of period end total assets at June 30, 2018, primarily due to two real estate secured loans that were previously classified substandard that
Slide 24: Capital Position
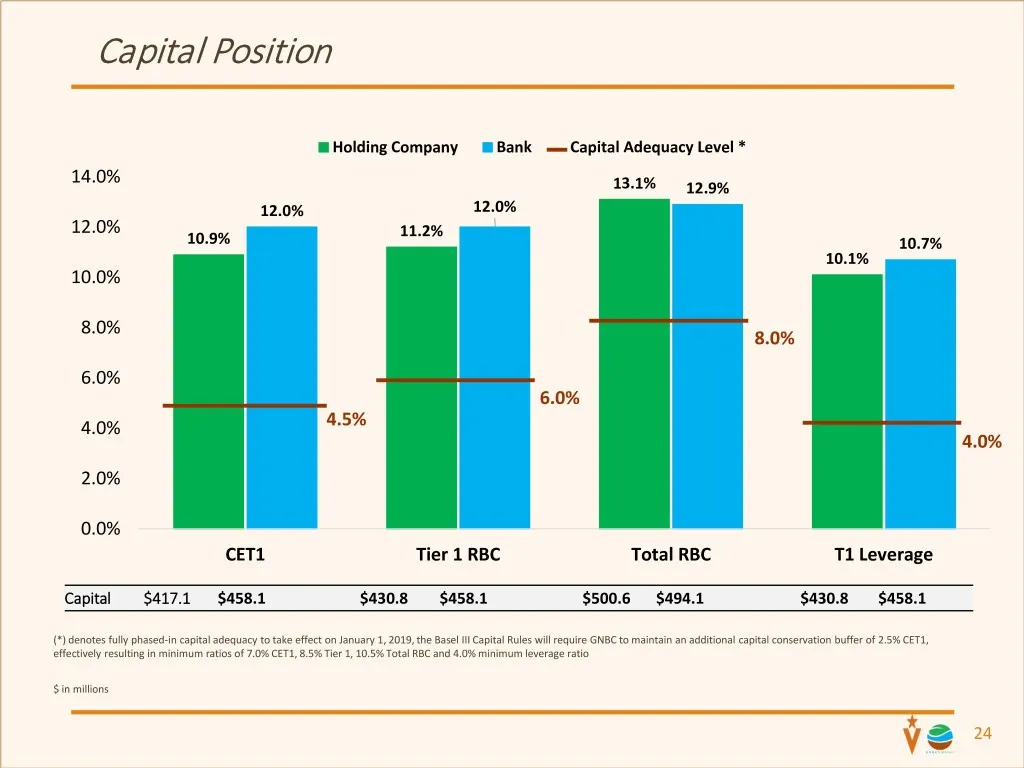
Capital Position Holding Company Bank Capital Adequacy Level * 14.0% 13.1% 12.9% 12.0% 12.0% 12.0% 11.2% 10.9% 10.7% 10.1% 10.0% 8.0% 8.0% 6.0% 6.0% 4.0% 4.5% 4.0% 2.0% 0.0% CET1 Tier 1 RBC Total RBC T1 Leverage Capital $417.1 $458.1 $430.8 $458.1 $500.6 $494.1 $430.8 $458.1 (*) denotes fully phased
Slide 25: Merger Integration Update
a Vv VE Res E xX Ss GREEN BANCORP HOLDINGS SUNG: Merger Integration Update
Slide 26: Integrations Update – Strategic and Financial Rationale
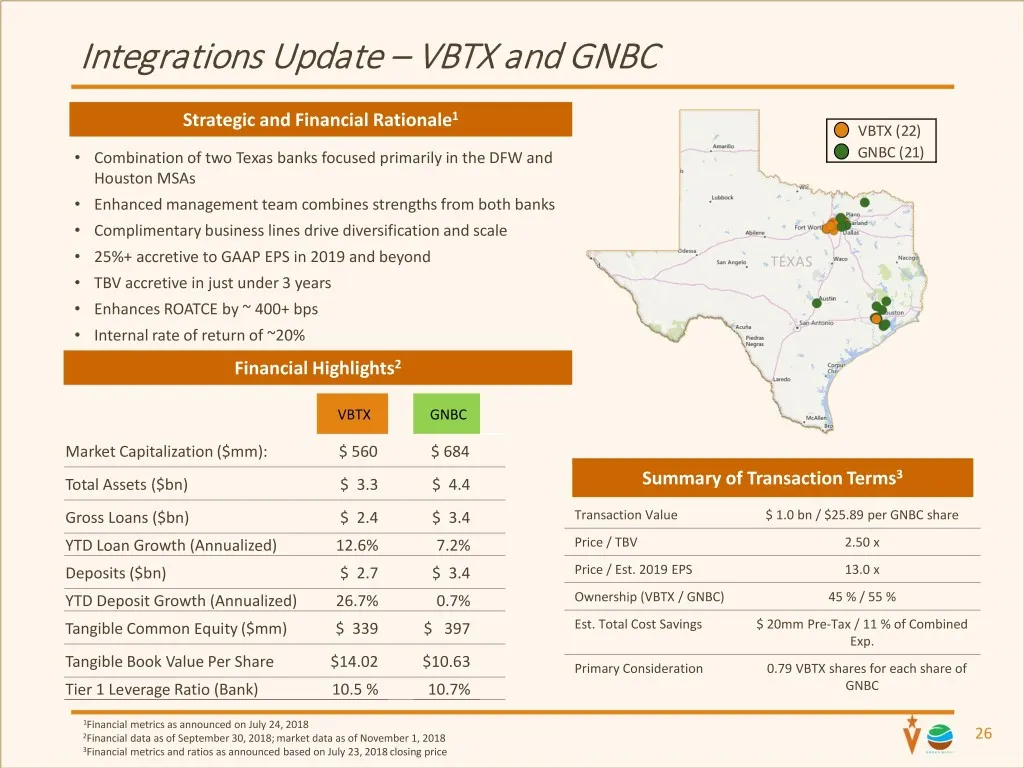
Integrations Update – VBTX and GNBC Strategic and Financial Rationale1 VBTX (22) • Combination of two Texas banks focused primarily in the DFW and GNBC (21) Houston MSAs • Enhanced management team combines strengths from both banks • Complimentary business lines drive diversification and scale • 25%
Slide 27: Integrations Update – Integration Approach
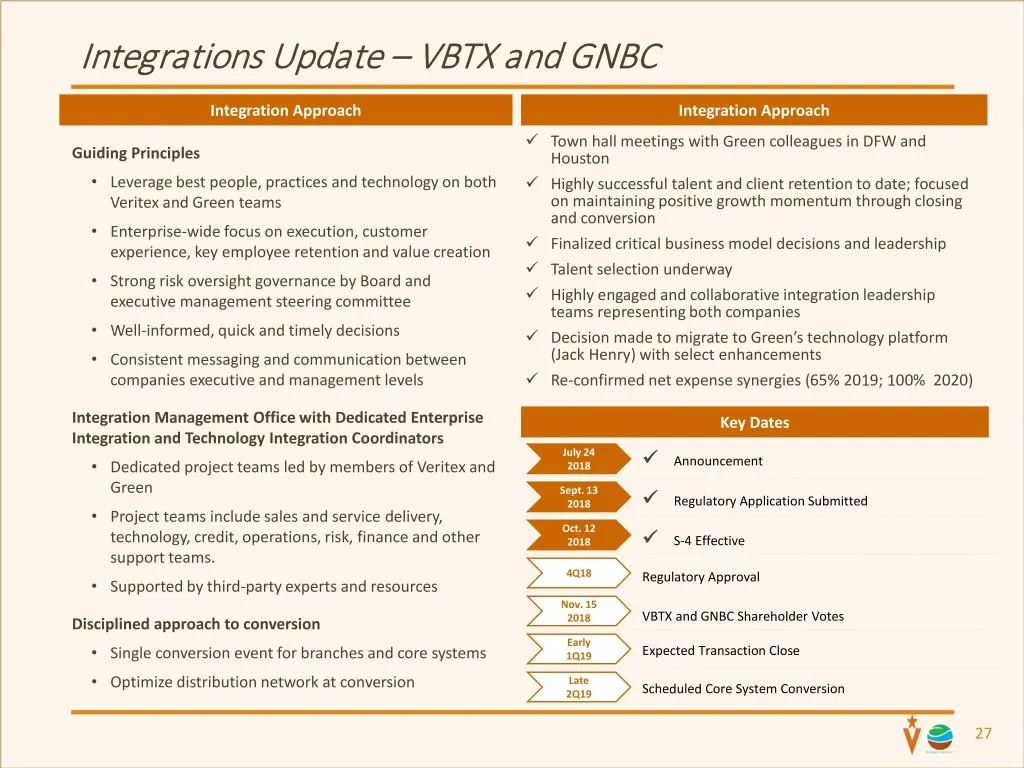
Integrations Update – VBTX and GNBC Integration Approach Integration Approach Town hall meetings with Green colleagues in DFW and Guiding Principles Houston • Leverage best people, practices and technology on both Highly successful talent and client retention to date; focused Veritex and Green t
Slide 28: Appendix A
a Vv VE Res E xX Ss GREEN BANCORP HOLDINGS SUNG: Appendix A
Slide 29: VBTX Reconciliation of Non-GAAP Financial Measures
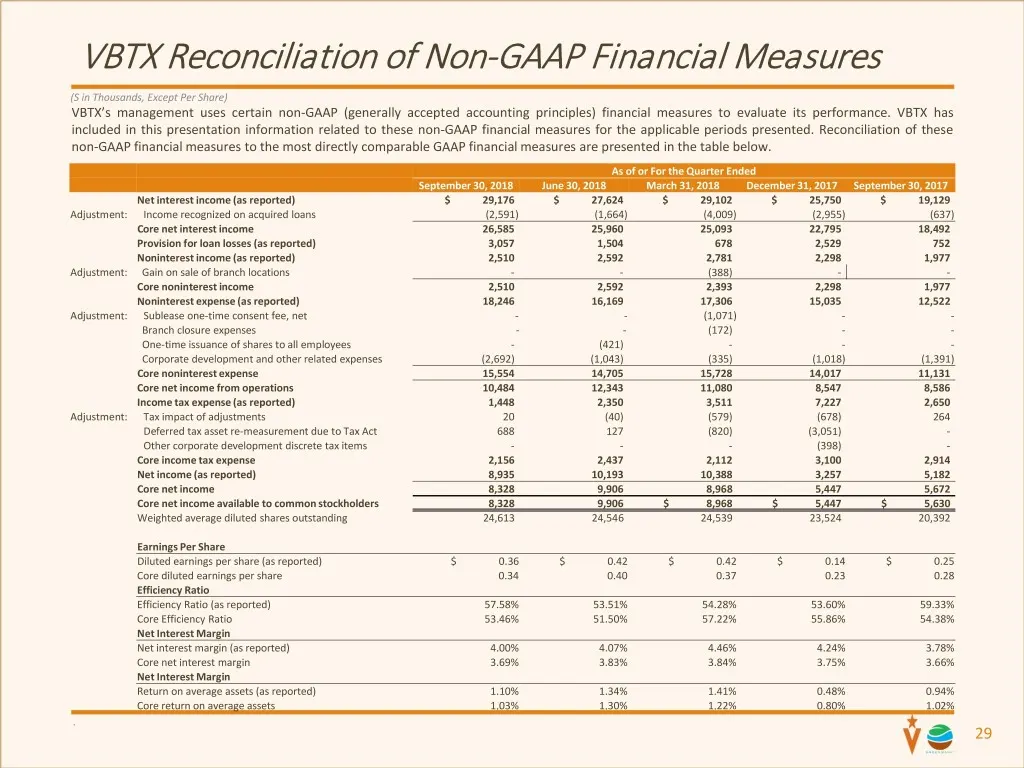
VBTX Reconciliation of Non-GAAP Financial Measures (S in Thousands, Except Per Share) VBTX’s management uses certain non-GAAP (generally accepted accounting principles) financial measures to evaluate its performance. VBTX has included in this presentation information related to these non-GAAP financ
Slide 30: VBTX Reconciliation of Non-GAAP Financial Measures
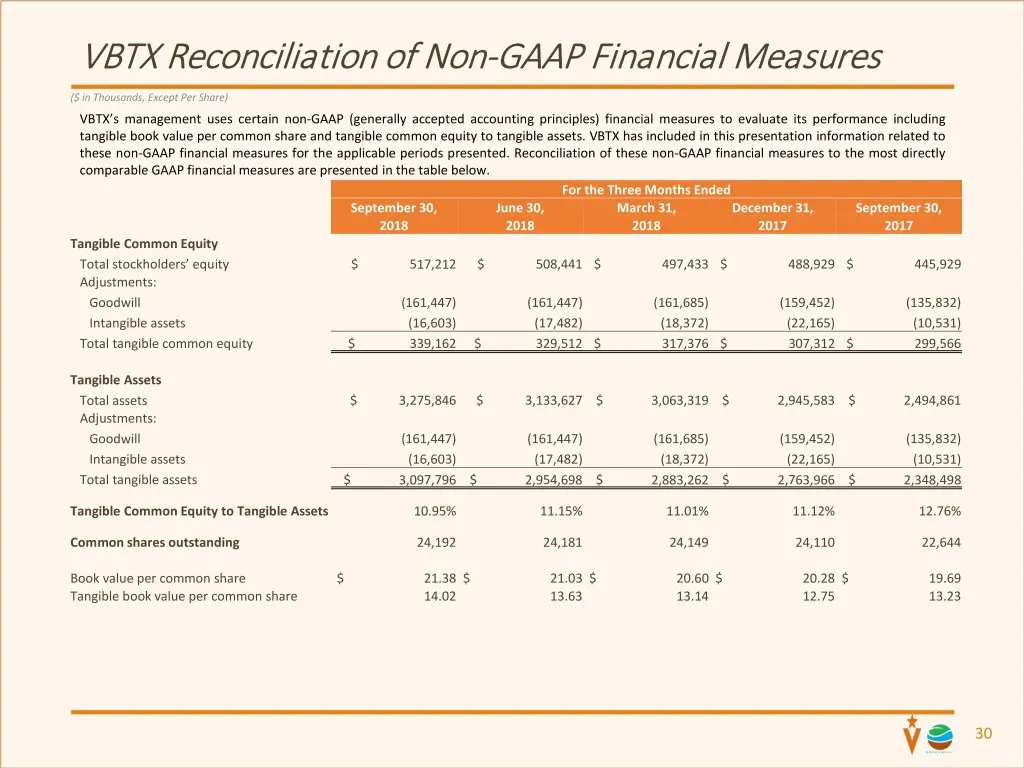
VBTX Reconciliation of Non-GAAP Financial Measures ($ in Thousands, Except Per Share) VBTX’s management uses certain non-GAAP (generally accepted accounting principles) financial measures to evaluate its performance including tangible book value per common share and tangible common equity to tangibl
Slide 31: GNBC Reconciliation of Non-GAAP Financial Measures
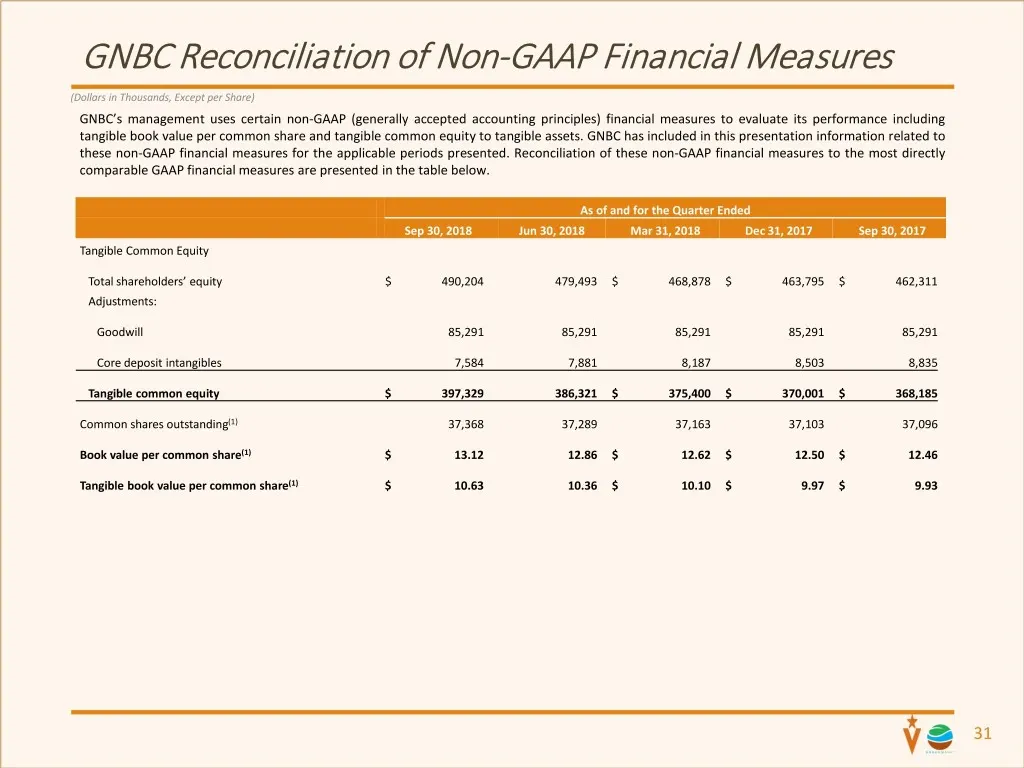
GNBC Reconciliation of Non-GAAP Financial Measures (Dollars in Thousands, Except per Share) GNBC’s management uses certain non-GAAP (generally accepted accounting principles) financial measures to evaluate its performance including tangible book value per common share and tangible common equity to t
Slide 32: GNBC Reconciliation of Non-GAAP Financial Measures
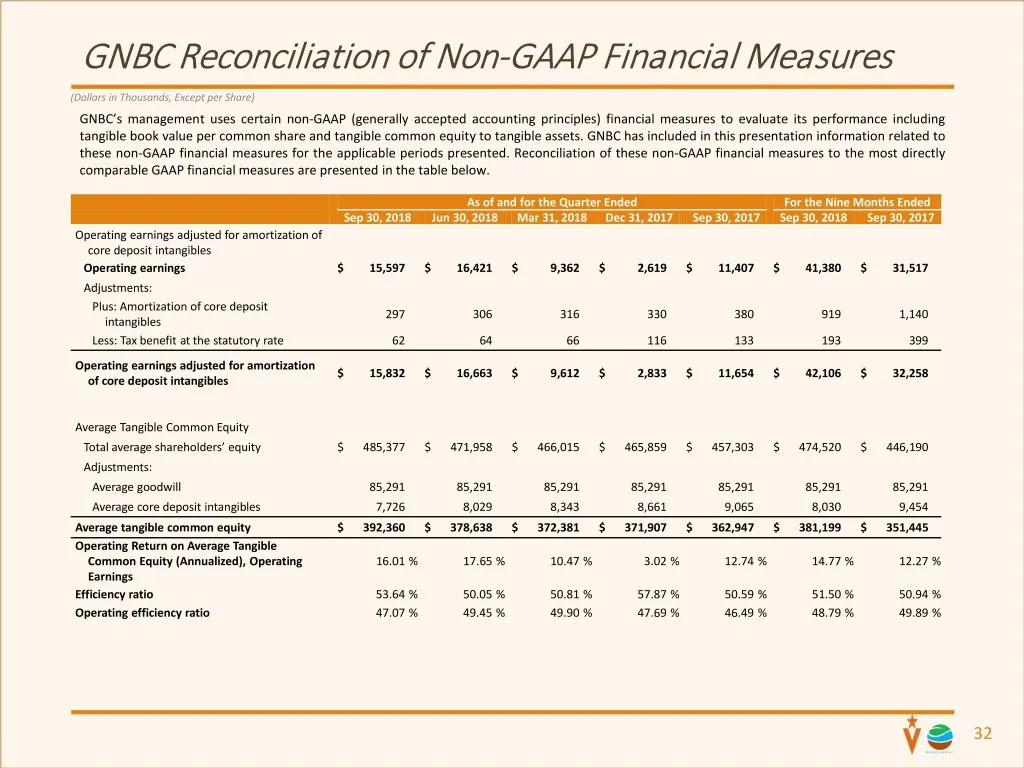
GNBC Reconciliation of Non-GAAP Financial Measures (Dollars in Thousands, Except per Share) GNBC’s management uses certain non-GAAP (generally accepted accounting principles) financial measures to evaluate its performance including tangible book value per common share and tangible common equity to t
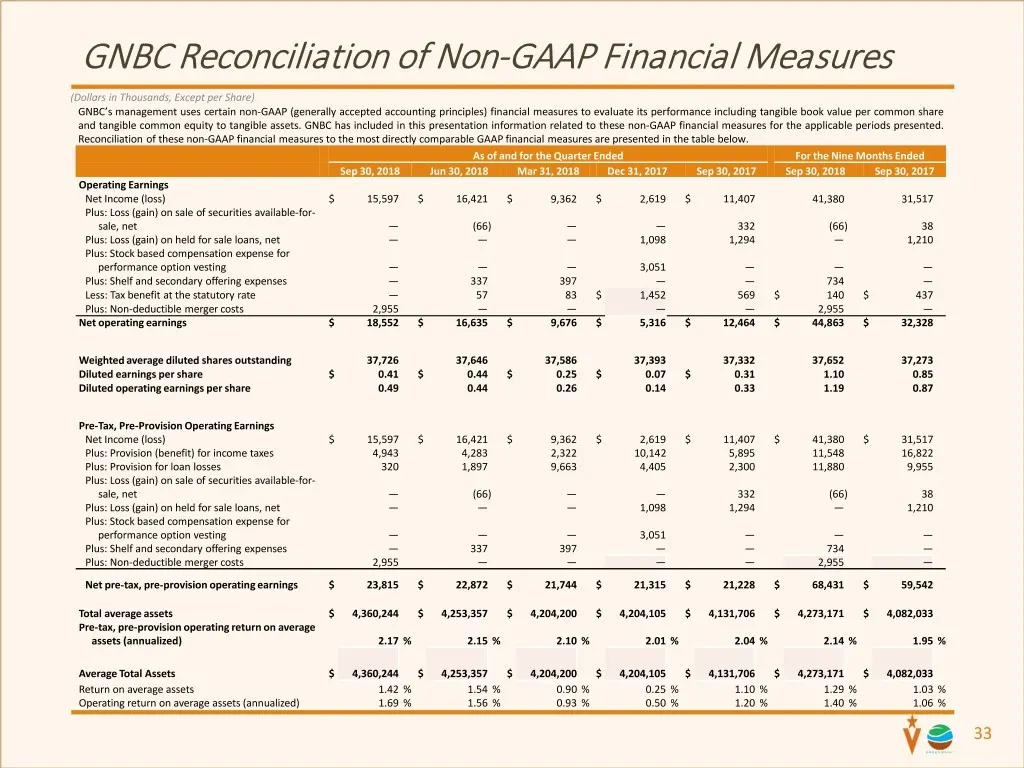
Slide 33: GNBC Reconciliation of Non-GAAP Financial Measures
GNBC Reconciliation of Non-GAAP Financial Measures (Dollars in Thousands, Except per Share) GNBC’s management uses certain non-GAAP (generally accepted accounting principles) financial measures to evaluate its performance including tangible book value per common share and tangible common equity to t

Slide 34: Veritex Community Bank – Truth in Texas Banking
a Vv VERITEX COMMUNITY BANK TRUTH IN TEXAS BANKING
Source: SEC EDGAR · 425 filed Nov 6, 2018
More decks from Green Bancorp Inc
 Q3 2018 Earnings Presentation12 slides · Oct 22, 2018
 Q3 2018 Earnings Presentation17 slides · Oct 22, 2018
 Merger or Acquisition (July 2018)28 slides · Jul 24, 2018
 Q1 2018 Earnings Presentation34 slides · May 4, 2018
 Q1 2018 Earnings Presentation19 slides · Apr 26, 2018
 Q4 2017 Earnings Presentation33 slides · Mar 6, 2018