Anixter International — Investor Day (November 2015)
138 slides from Anixter International's investor day presentation, Nov 9, 2015
Slide 1: Anixter Investor Day 2015
Anixter Investor Day 2015 Exhibit 99.1
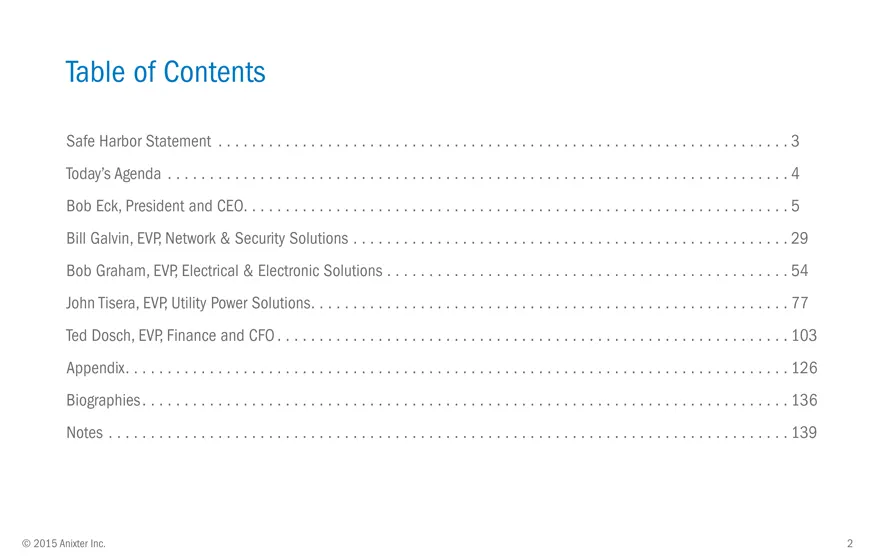
Slide 2: Table of Contents
Table of Contents Safe Harbor Statement 3 Today’s Agenda 4 Bob Eck, President and CEO. 5 Bill Galvin, EVP, Network & Security Solutions 29 Bob Graham, EVP, Electrical & Electronic Solutions 54 John Tisera, EVP, Utility Power Solutions. 77 Ted Dosch, EVP, Finance and CFO 103 Appendix 126 Biographies
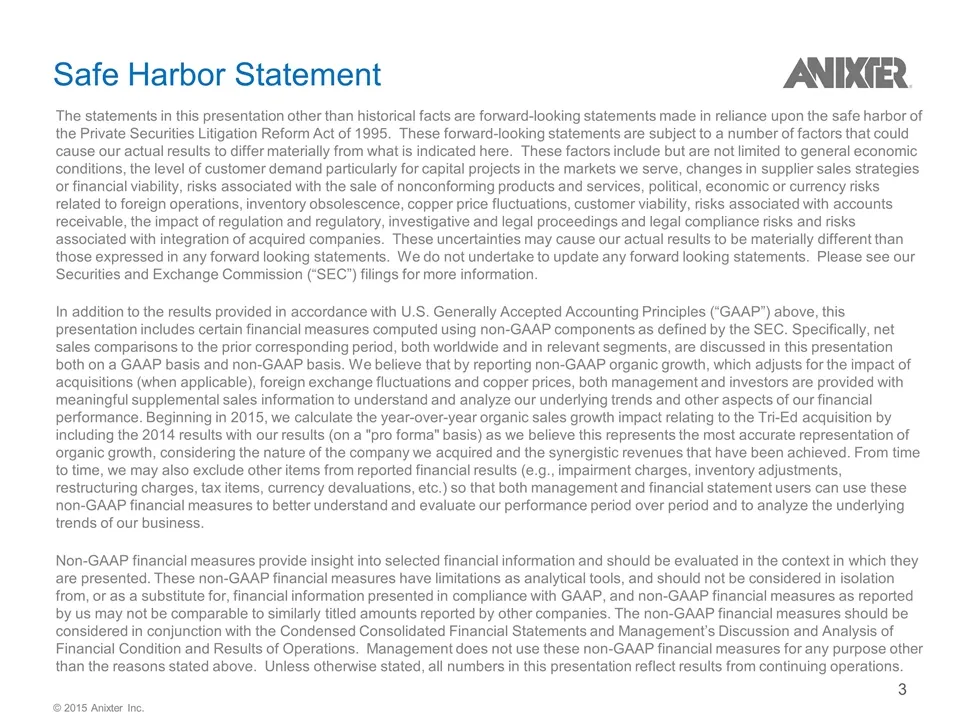
Slide 3: Safe Harbor Statement
The statements in this presentation other than historical facts are forward-looking statements made in reliance upon the safe harbor of the Private Securities Litigation Reform Act of 1995. These forward-looking statements are subject to a number of factors that could cause our actual results to dif
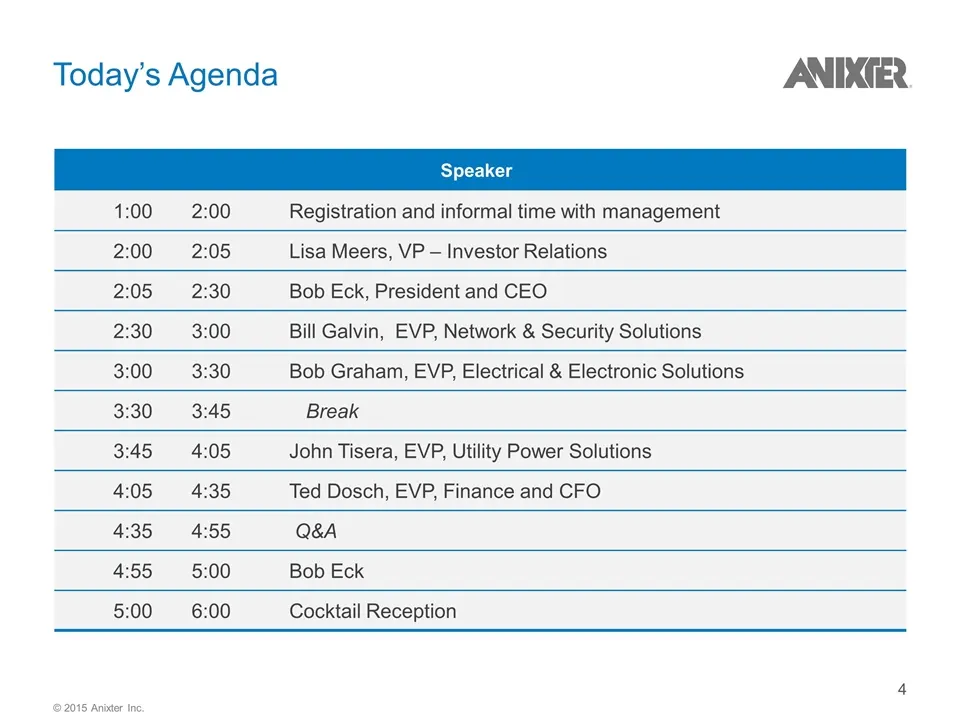
Slide 4: Today's Agenda
Today’s Agenda Speaker 1:00 2:00 Registration and informal time with management 2:00 2:05 Lisa Meers, VP – Investor Relations 2:05 2:30 Bob Eck, President and CEO 2:30 3:00 Bill Galvin, EVP, Network & Security Solutions 3:00 3:30 Bob Graham, EVP, Electrical & Electronic Solutions 3:30 3:45 Break 3:4
Slide 5: Bob Eck, President and CEO
Anixter Investor Day 2015 Bob Eck President and CEO
Slide 6: Key Messages Today
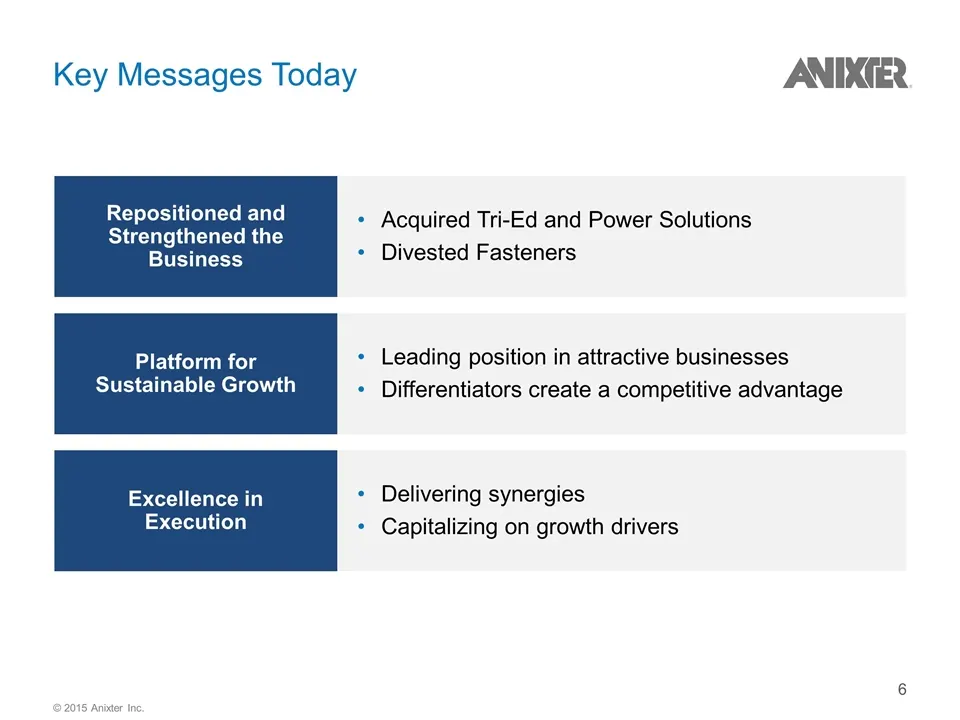
Key Messages Today Acquired Tri-Ed and Power Solutions Divested Fasteners Repositioned and Strengthened the Business Leading position in attractive businesses Differentiators create a competitive advantage Platform for Sustainable Growth Delivering synergies Capitalizing on growth drivers Excellence
Slide 7: Agenda
Agenda Platform for Sustainable Growth Growth Drivers Anixter at a Glance Repositioned and Strengthened the Business © 2015 Anixter Inc.
Slide 8: A Solid Performance Record 2009 to 2014
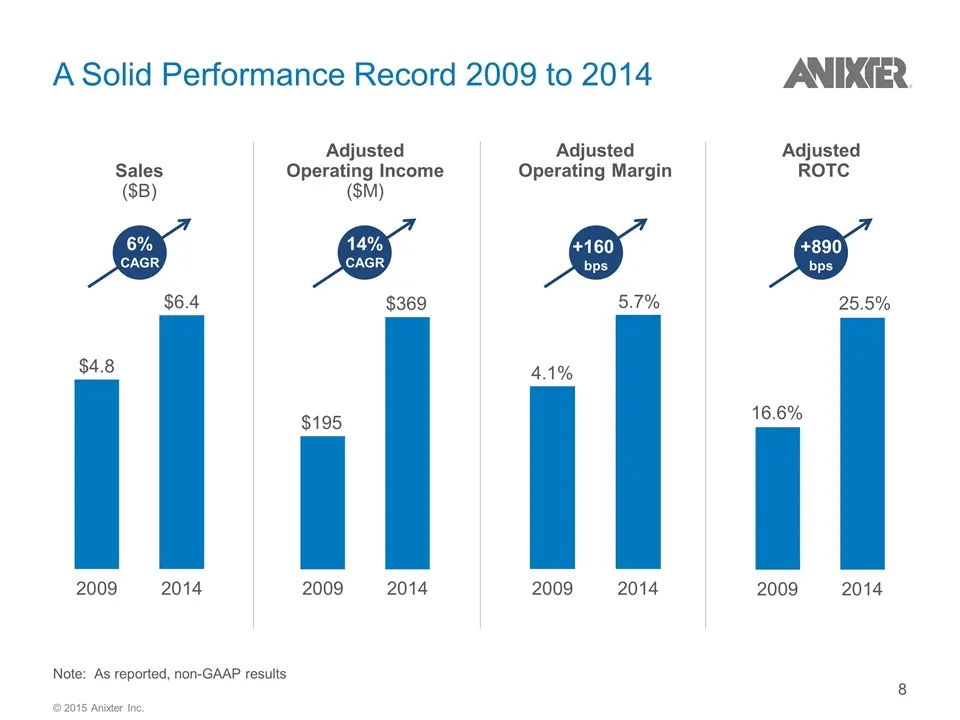
A Solid Performance Record 2009 to 2014 Adjusted Operating Income ($M) Sales ($B) Adjusted Operating Margin Adjusted ROTC Note: As reported, non-GAAP results 6% CAGR 14% CAGR +160 bps +890 bps © 2015 Anixter Inc.
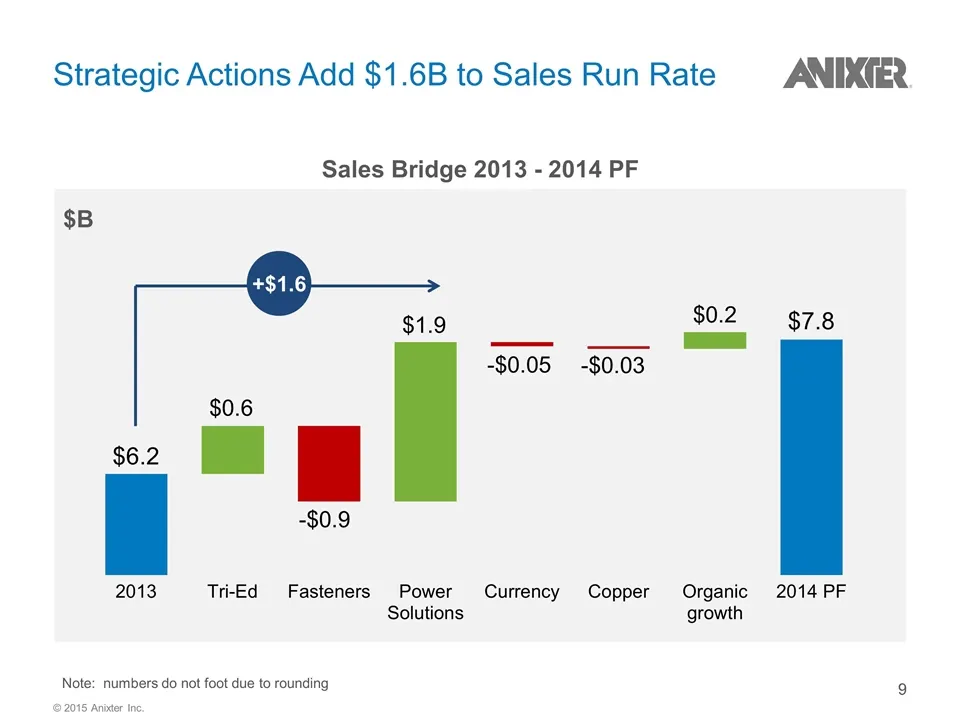
Slide 9: Strategic Actions Add $1.6B to Sales Run Rate
Strategic Actions Add $1.6B to Sales Run Rate Sales Bridge 2013 - 2014 PF $B Note: numbers do not foot due to rounding +$1.6 © 2015 Anixter Inc.
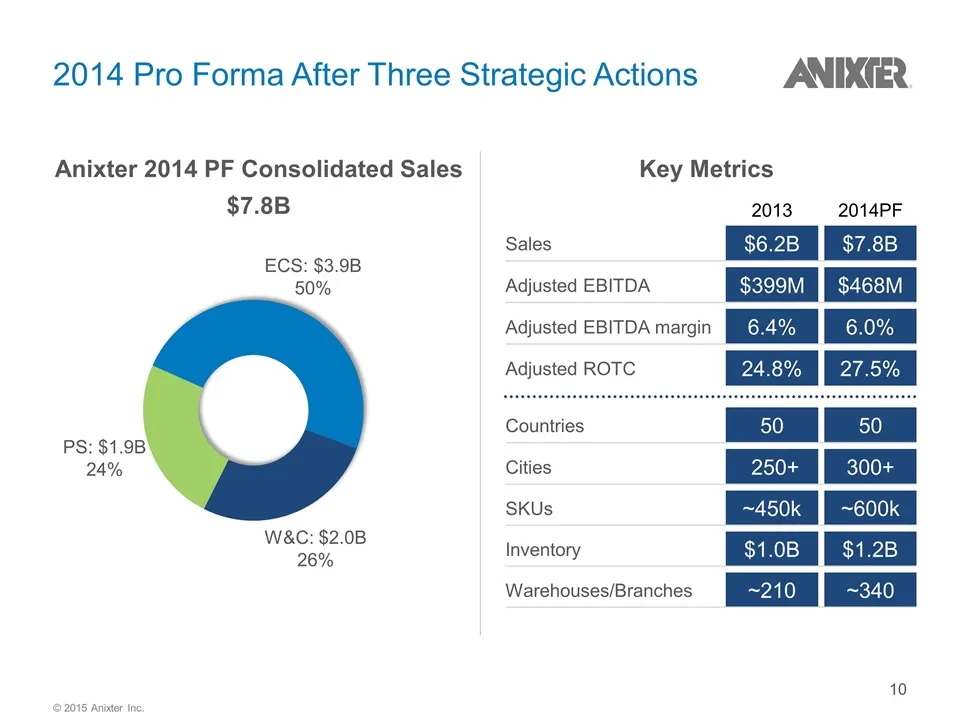
Slide 10: Key Metrics 2014 Pro Forma After Three Strategic Actions
Key Metrics 2014 Pro Forma After Three Strategic Actions 2013 2014PF Sales $6.2B $7.8B Adjusted EBITDA $399M $468M Adjusted EBITDA margin 6.4% 6.0% Adjusted ROTC 24.8% 27.5% Countries 50 50 Cities 250+ 300+ SKUs ~450k ~600k Inventory $1.0B $1.2B Warehouses/Branches ~210 ~340 Anixter 2014 PF Consolid
Slide 11: Agenda
Agenda Platform for Sustainable Growth Growth Drivers Anixter at a Glance Repositioned and Strengthened the Business © 2015 Anixter Inc.
Slide 12: Repositioned and Strengthened Platform
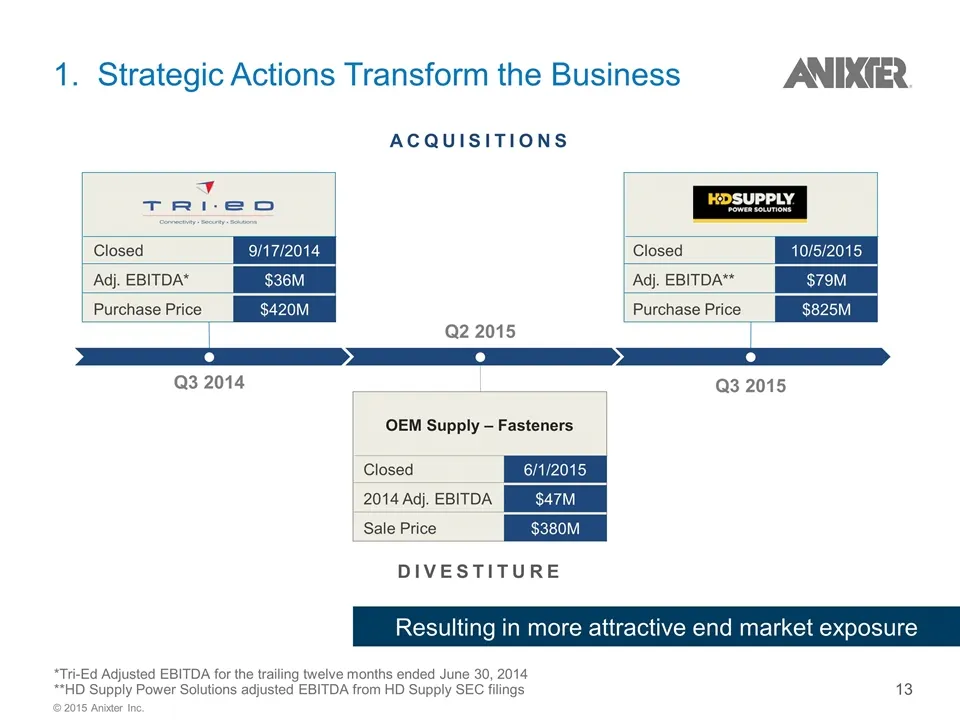
Repositioned and Strengthened Platform Strategic actions transform the business Creating a more focused mix with new segment structure Improved geographic mix Power Solutions increases breadth and depth of product portfolio © 2015 Anixter Inc.
Slide 13: Strategic Actions Transform the Business
Q3 2014 Q2 2015 Q3 2015 Resulting in more attractive end market exposure 1. Strategic Actions Transform the Business Closed 9/17/2014 Adj. EBITDA* $36M Purchase Price $420M Acquisitions Divestiture Closed 10/5/2015 Adj. EBITDA** $79M Purchase Price $825M Closed 6/1/2015 2014 Adj. EBITDA $47M Sale Pr
Slide 14: Creating a More Focused Mix with New Segment Structure
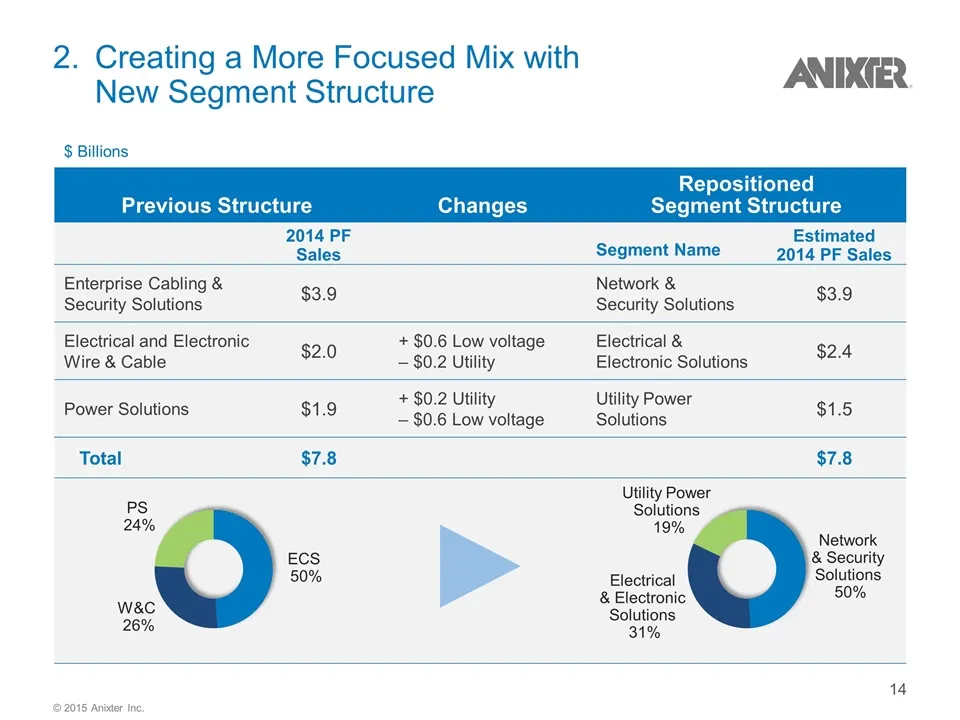
2.Creating a More Focused Mix with New Segment Structure Previous Structure Changes Repositioned Segment Structure 2014 PF Sales Segment Name Estimated 2014 PF Sales Enterprise Cabling & Security Solutions $3.9 Network & Security Solutions $3.9 Electrical and Electronic Wire & Cable $2.0 + $0.6 Low
Slide 15: Improved Geographic Mix
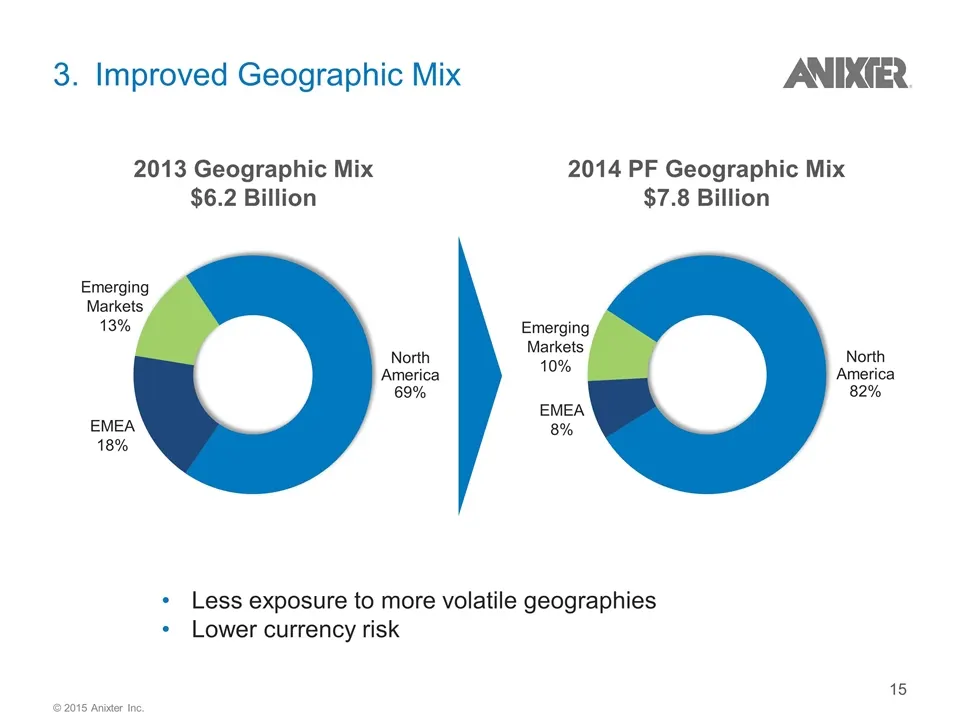
Less exposure to more volatile geographies Lower currency risk 3.Improved Geographic Mix 2013 Geographic Mix $6.2 Billion 2014 PF Geographic Mix $7.8 Billion North America 69% EMEA 18% Emerging Markets 13% North America 82% Emerging Markets 10% EMEA 8% © 2015 Anixter Inc.
Slide 16: Power Solutions Increases Breadth and Depth of Product Portfolio
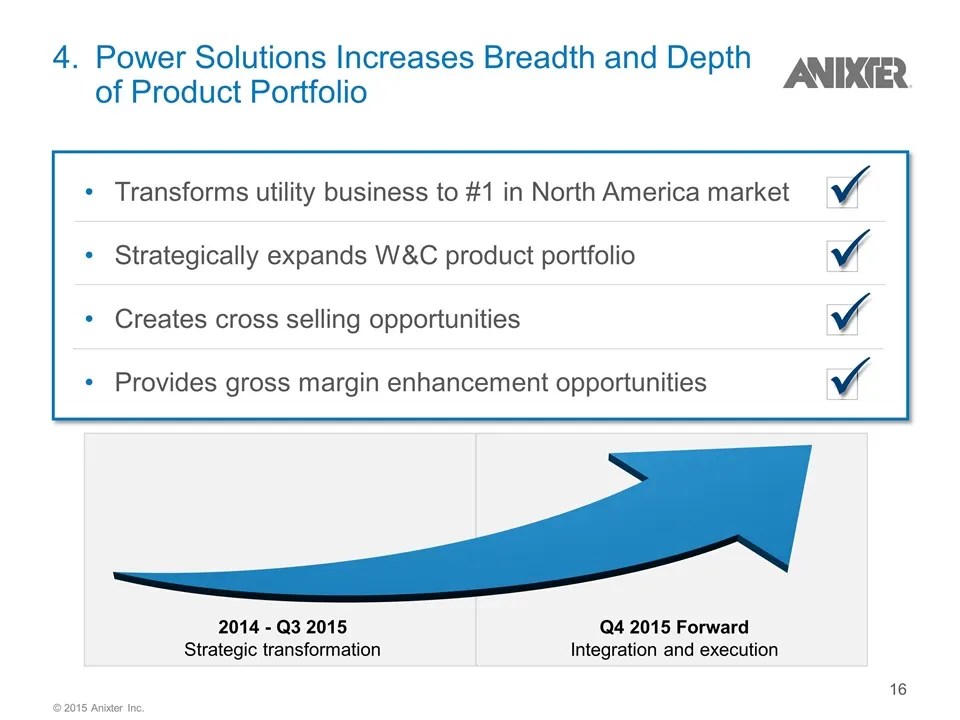
4.Power Solutions Increases Breadth and Depth of Product Portfolio Transforms utility business to #1 in North America market Strategically expands W&C product portfolio Creates cross selling opportunities Provides gross margin enhancement opportunities 2014 - Q3 2015 Strategic transformation Q4 2015
Slide 17: Agenda
Agenda Platform for Sustainable Growth Growth Drivers Anixter at a Glance Repositioned and Strengthened the Business © 2015 Anixter Inc.
Slide 18: Key Platform Strengths
Key Platform Strengths Leading positions in attractive businesses Strong, diverse and global suppliers and customers Competitive advantages and barriers to entry Digital marketing capabilities enhance our value proposition © 2015 Anixter Inc.
Slide 19: Leading Positions in Attractive Businesses
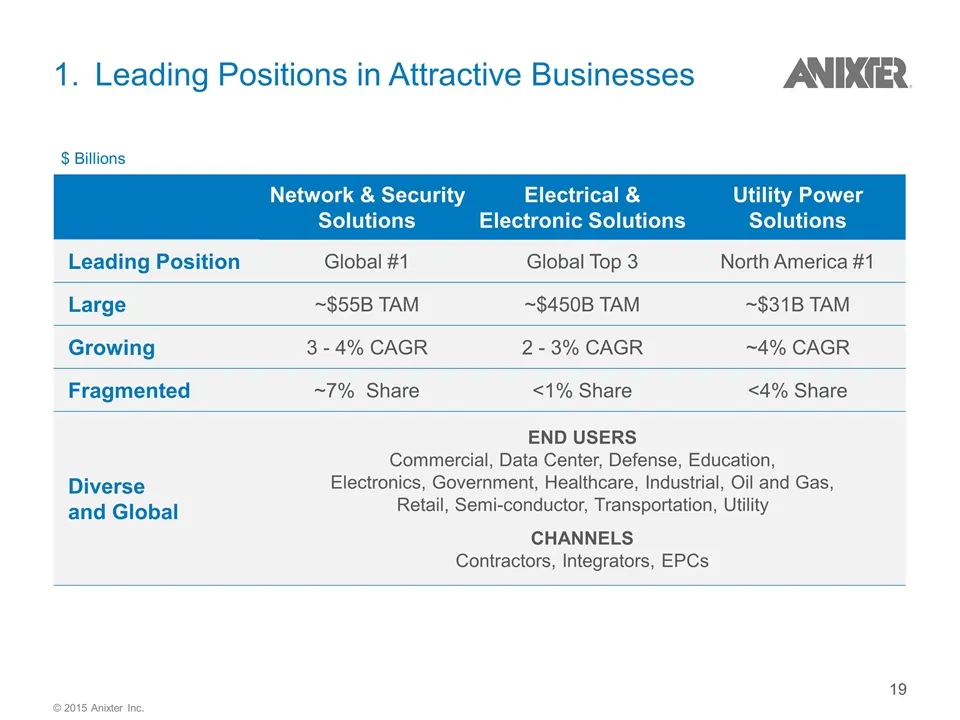
1.Leading Positions in Attractive Businesses Network & Security Solutions Electrical & Electronic Solutions Utility Power Solutions Leading Position Global #1 Global Top 3 North America #1 Large ~$55B TAM ~$450B TAM ~$31B TAM Growing 3 - 4% CAGR 2 - 3% CAGR ~4% CAGR Fragmented ~7% Share <1% Share <4
Slide 20: Strong, Diverse and Global Suppliers and Customers
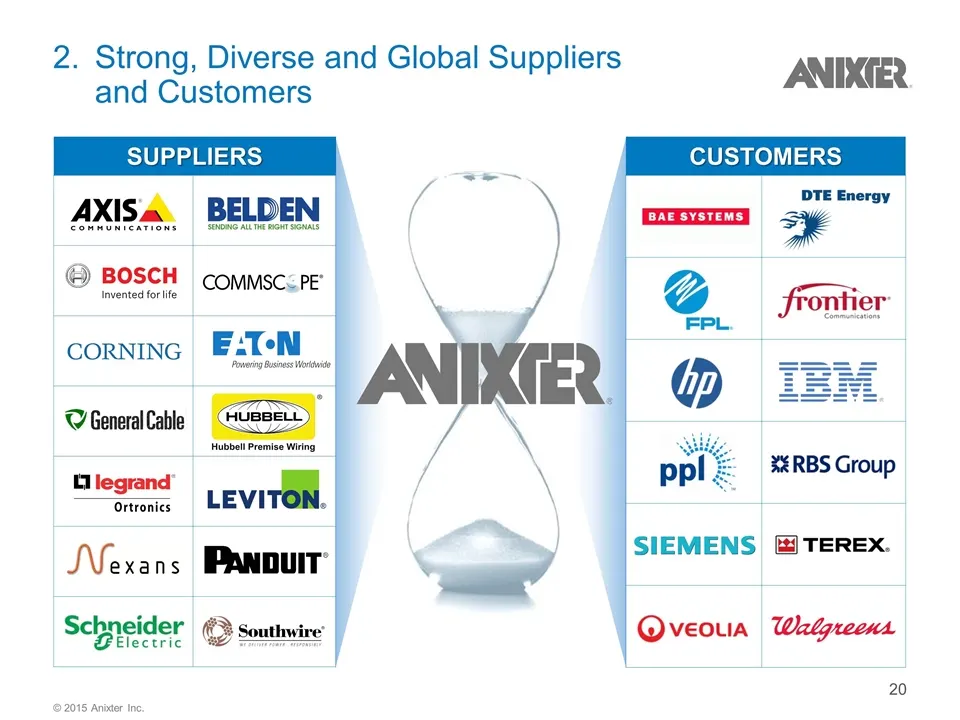
2.Strong, Diverse and Global Suppliers and Customers CUSTOMERS SUPPLIERS © 2015 Anixter Inc.
Slide 21: Competitive Advantages and Barriers to Entry
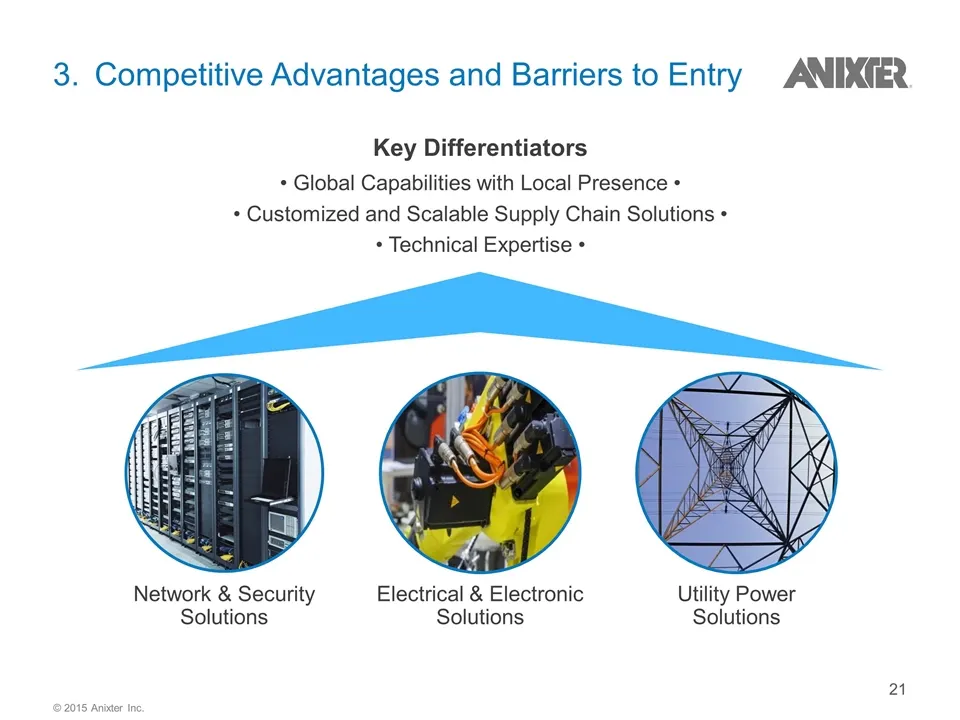
3. Competitive Advantages and Barriers to Entry Key Differentiators • Global Capabilities with Local Presence • • Customized and Scalable Supply Chain Solutions • • Technical Expertise • Network & Security Solutions Electrical & Electronic Solutions Utility Power Solutions © 2015 Anixter Inc.
Slide 22: Differentiators in Action
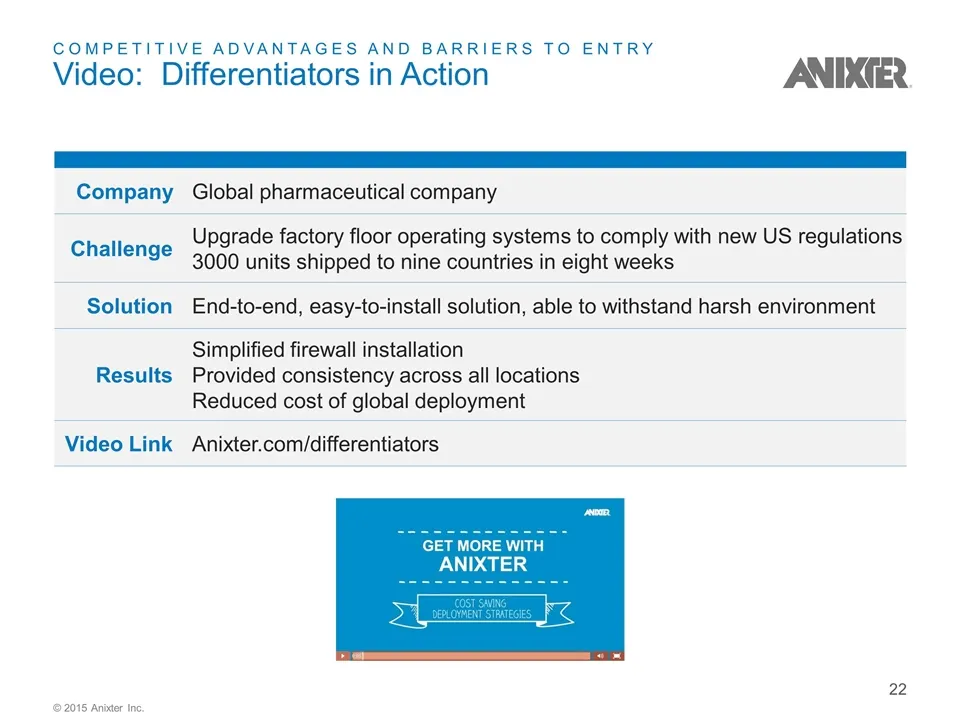
COMPETITIVE ADVANTAGES AND BARRIERS TO ENTRY Video: Differentiators in Action Company Global pharmaceutical company Challenge Upgrade factory floor operating systems to comply with new US regulations 3000 units shipped to nine countries in eight weeks Solution End-to-end, easy-to-install solution, a
Slide 23: Digital Marketing Capabilities Enhance our Value Proposition
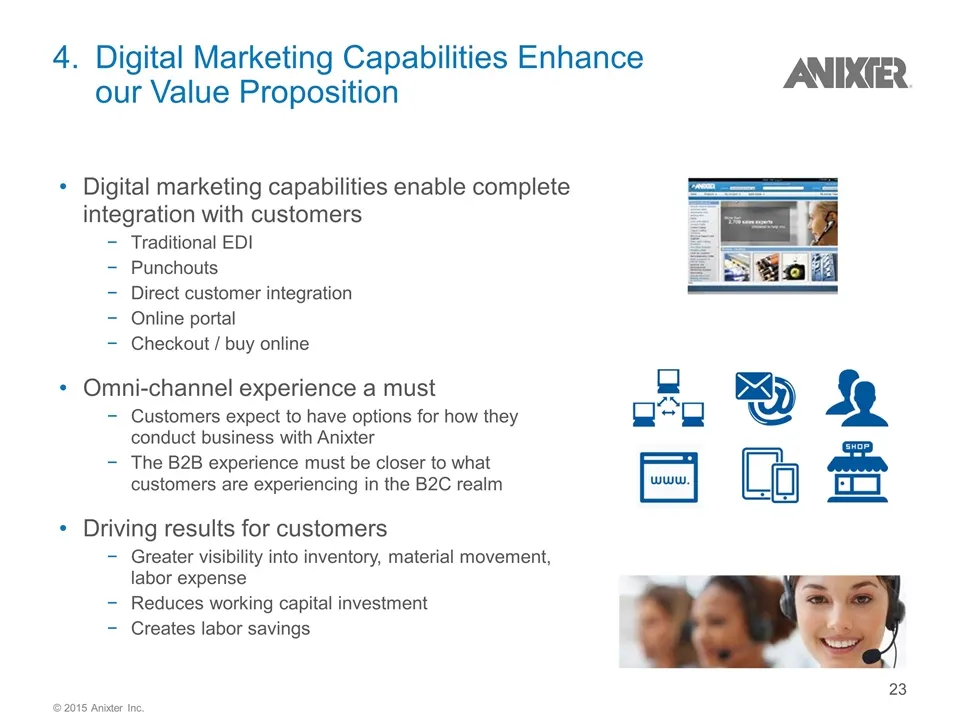
4.Digital Marketing Capabilities Enhance our Value Proposition Digital marketing capabilities enable complete integration with customers Traditional EDI Punchouts Direct customer integration Online portal Checkout / buy online Omni-channel experience a must Customers expect to have options for how t
Slide 24: Agenda
Agenda Platform for Sustainable Growth Growth Drivers Anixter at a Glance Repositioned and Strengthened the Business © 2015 Anixter Inc.
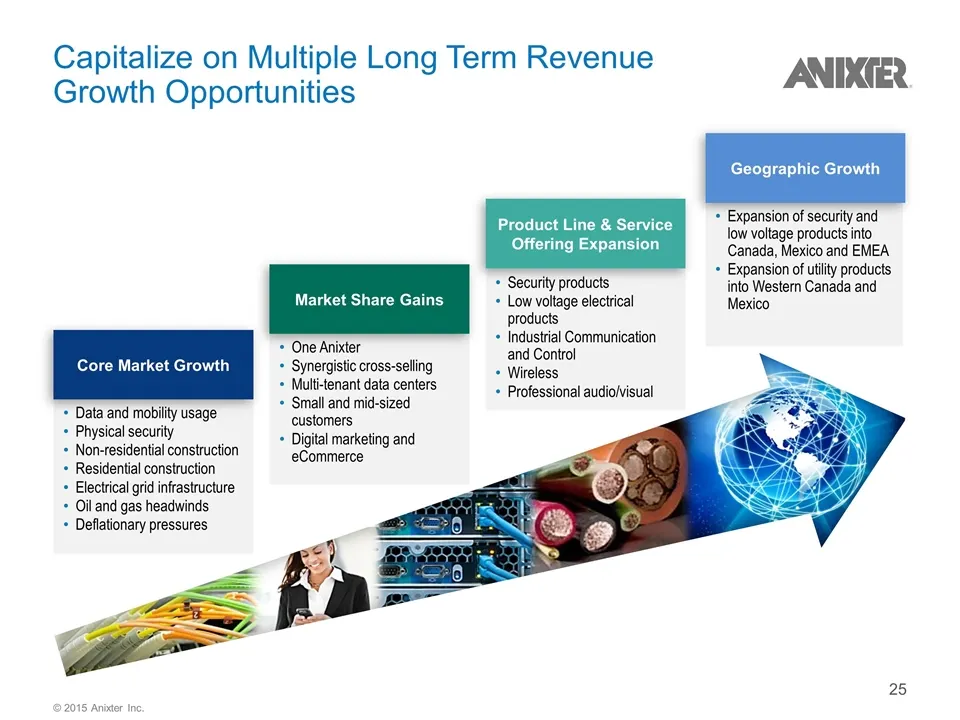
Slide 25: Capitalize on Multiple Long Term Revenue Growth Opportunities
Capitalize on Multiple Long Term Revenue Growth Opportunities Security products Low voltage electrical products Industrial Communication and Control Wireless Professional audio/visual Data and mobility usage Physical security Non-residential construction Residential construction Electrical grid infr
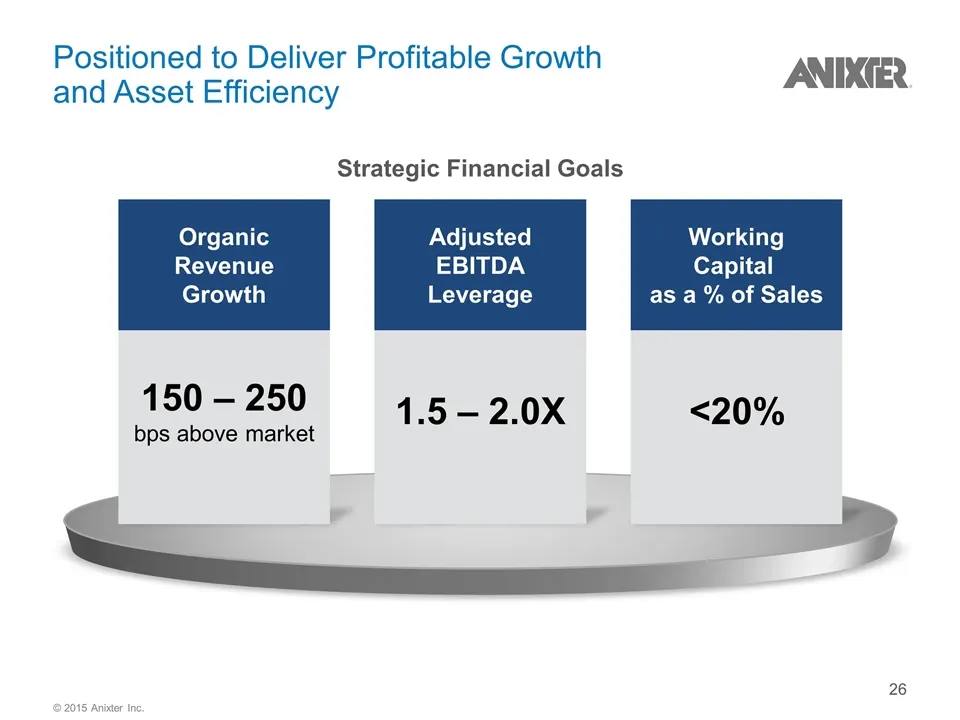
Slide 26: Positioned to Deliver Profitable Growth and Asset Efficiency
Positioned to Deliver Profitable Growth and Asset Efficiency 150 – 250 bps above market 1.5 – 2.0X <20% Strategic Financial Goals Organic Revenue Growth Adjusted EBITDA Leverage Working Capital as a % of Sales © 2015 Anixter Inc.
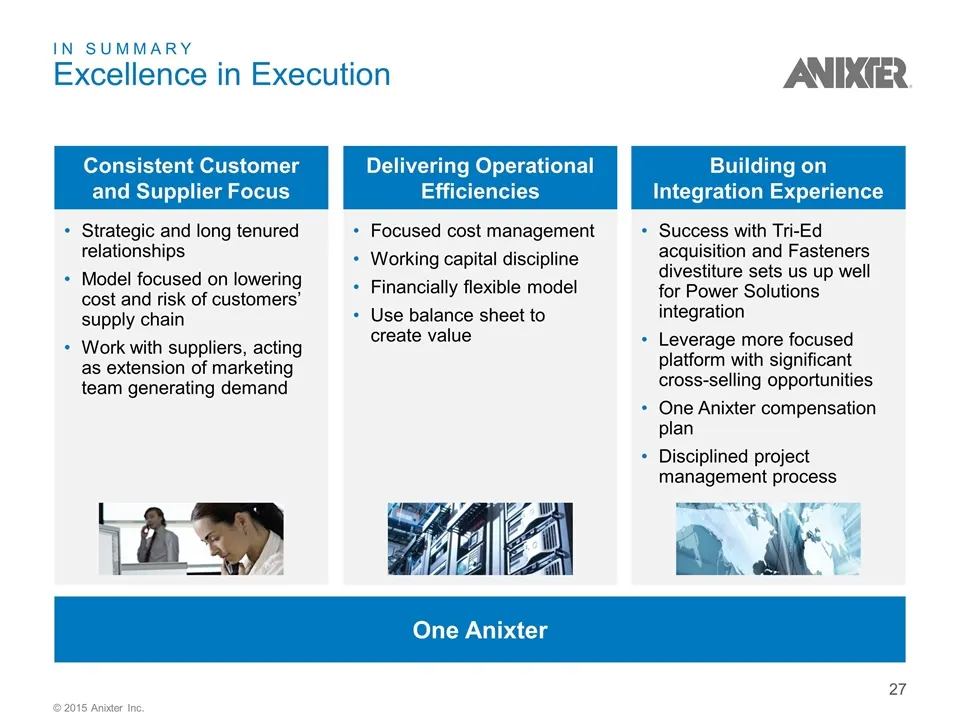
Slide 27: In Summary: Excellence in Execution
Focused cost management Working capital discipline Financially flexible model Use balance sheet to create value Success with Tri-Ed acquisition and Fasteners divestiture sets us up well for Power Solutions integration Leverage more focused platform with significant cross-selling opportunities One An
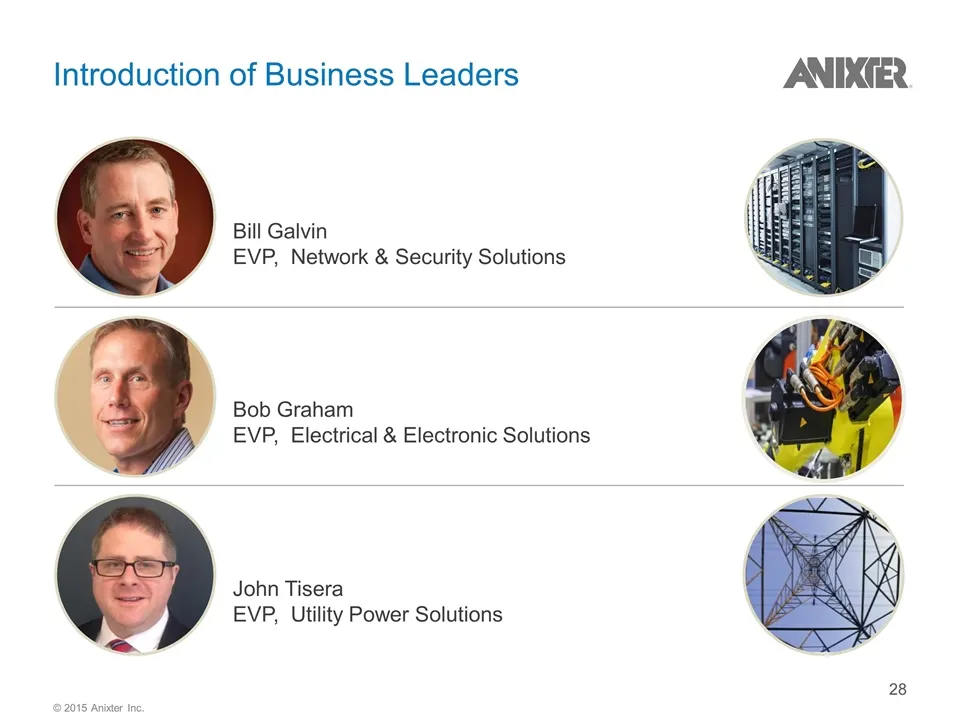
Slide 28: Introduction of Business Leaders
Introduction of Business Leaders Bill Galvin EVP, Network & Security Solutions Bob Graham EVP, Electrical & Electronic Solutions John Tisera EVP, Utility Power Solutions © 2015 Anixter Inc.
Slide 29: Bill Galvin, EVP, Network & Security Solutions
Anixter Investor Day 2015 Bill Galvin EVP, Network & Security Solutions
Slide 30: Agenda
Agenda Growth Strategy Network & Security Solutions Overview Key Strengths © 2015 Anixter Inc.
Slide 31: Network & Security Solutions at a Glance
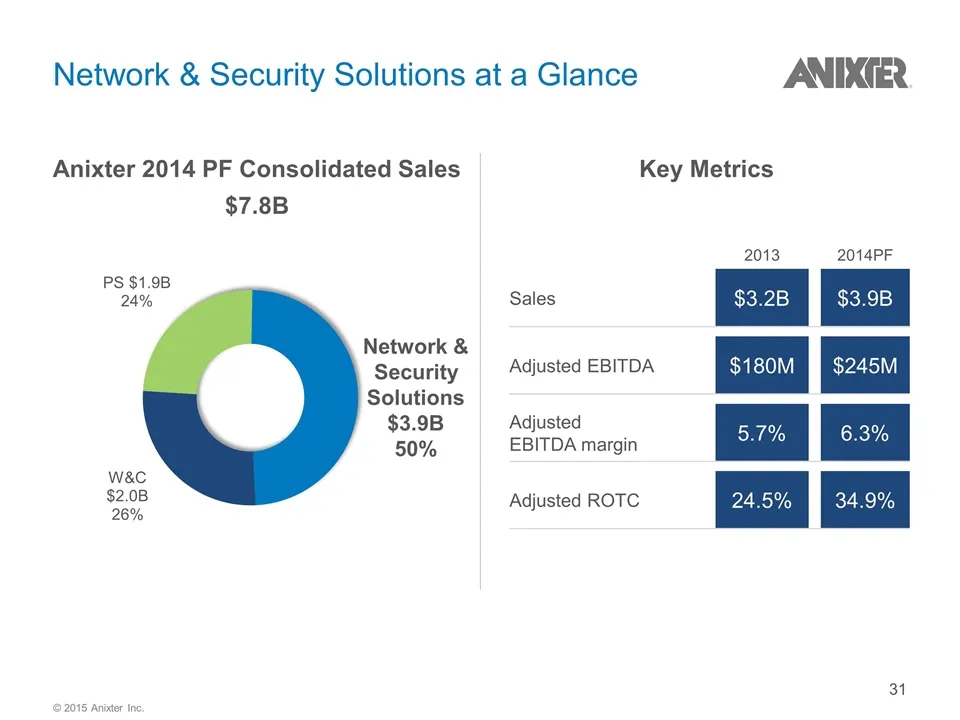
Key Metrics Network & Security Solutions at a Glance 2013 2014PF Sales $3.2B $3.9B Adjusted EBITDA $180M $245M Adjusted EBITDA margin 5.7% 6.3% Adjusted ROTC 24.5% 34.9% Anixter 2014 PF Consolidated Sales $7.8B Network & Security Solutions $3.9B 50% © 2015 Anixter Inc.
Slide 32: Global Player with Presence in >50 Countries
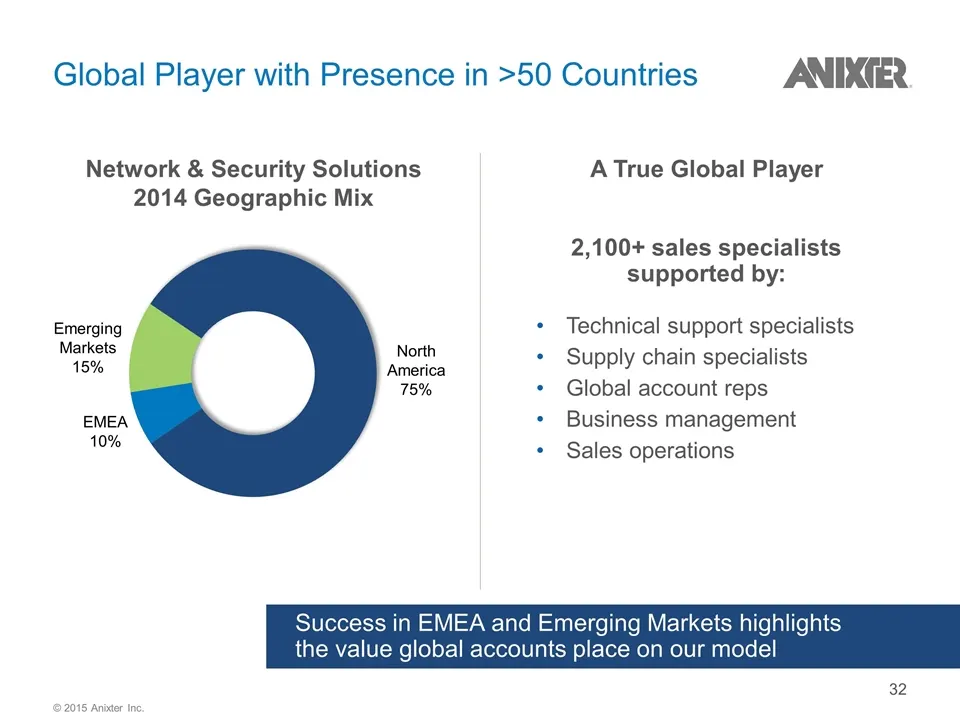
Global Player with Presence in >50 Countries Emerging Markets 15% North America 75% EMEA 10% Network & Security Solutions 2014 Geographic Mix A True Global Player Success in EMEA and Emerging Markets highlights the value global accounts place on our model Technical support specialists Supply chain s
Slide 33: Exceeding Market Performance
Exceeding Market Performance Strong growth in Europe, Middle East and Emerging Markets Taking share Cost structure improved On track with Tri-Ed synergies – focus on execution Platform is scalable – set up to deliver on operating leverage goals Positioned strategically to capitalize on growth in our
Slide 34: Products are Critical Components of the Connected Infrastructure
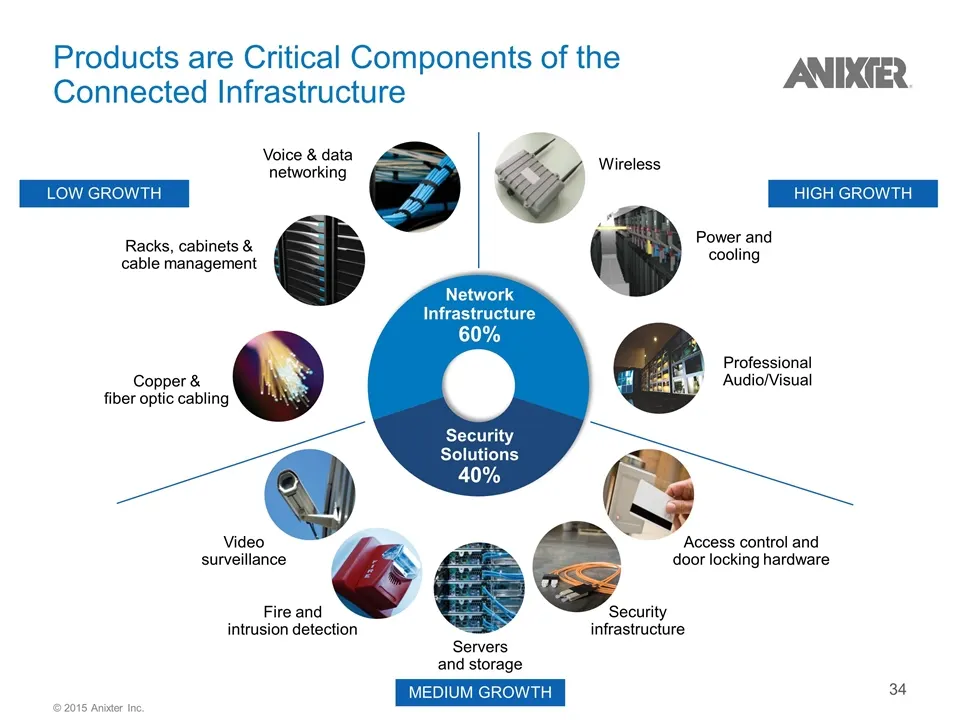
Products are Critical Components of the Connected Infrastructure Network Infrastructure 60% Security Solutions 40% Copper & fiber optic cabling Racks, cabinets & cable management Voice & data networking Wireless Power and cooling Professional Audio/Visual Video surveillance Fire and intrusion detect
Slide 35: Network & Security Solutions Products/Services
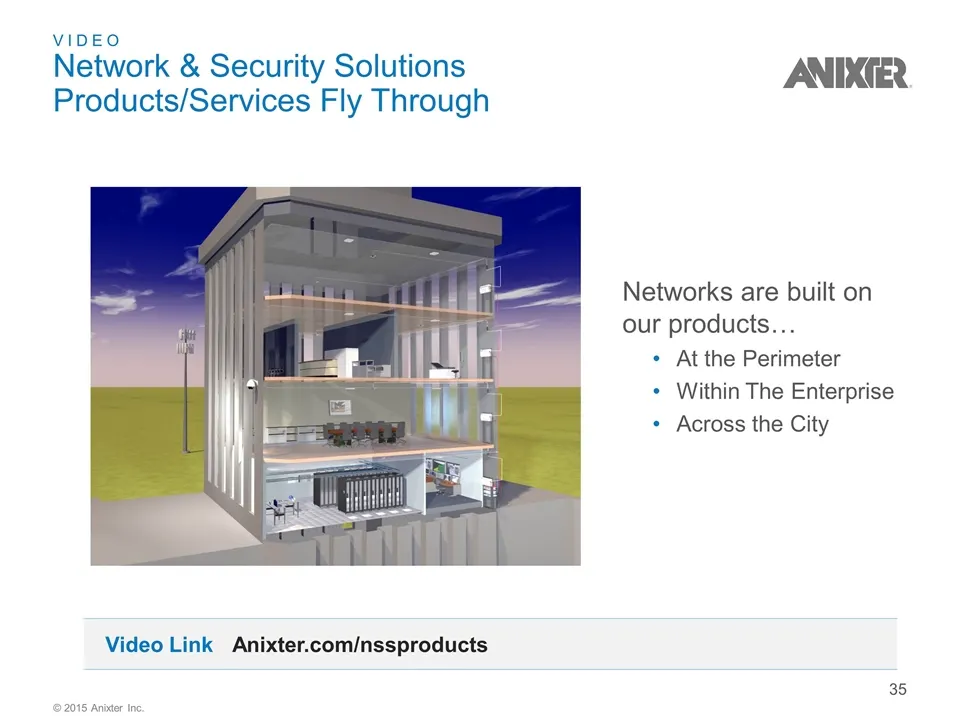
VIDEO Network & Security Solutions Products/Services Fly Through Networks are built on our products… At the Perimeter Within The Enterprise Across the City Video Link Anixter.com/nssproducts © 2015 Anixter Inc.
Slide 36: Tri-Ed Strengthens Our Business
Tri-Ed Strengthens Our Business Key Metrics Sales $570M Adjusted EBITDA $36M Dealers & customers 20k+ Branches 63 SKUs ~110k Employees 600+ Creates leading global security platform positioned for sustainable growth Expands product set to intrusion detection and fire/life safety Expands access with s
Slide 37: Agenda
Agenda Growth Strategy Network & Security Solutions Overview Key Strengths © 2015 Anixter Inc.
Slide 38: Key Strengths
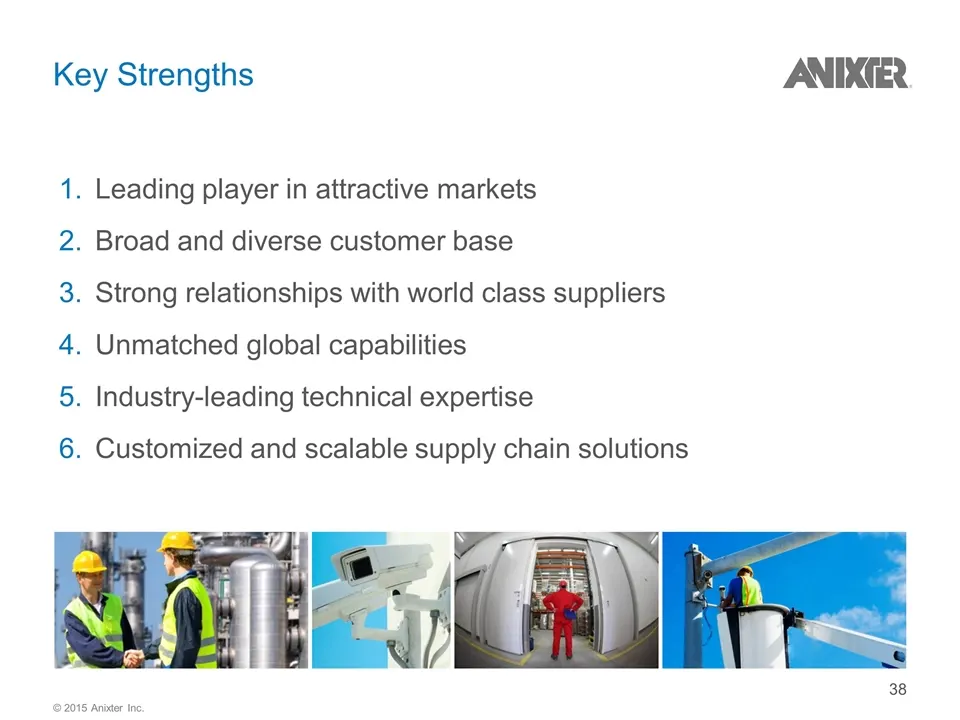
Key Strengths Leading player in attractive markets Broad and diverse customer base Strong relationships with world class suppliers Unmatched global capabilities Industry-leading technical expertise Customized and scalable supply chain solutions © 2015 Anixter Inc.
Slide 39: Leading Player in Attractive Markets
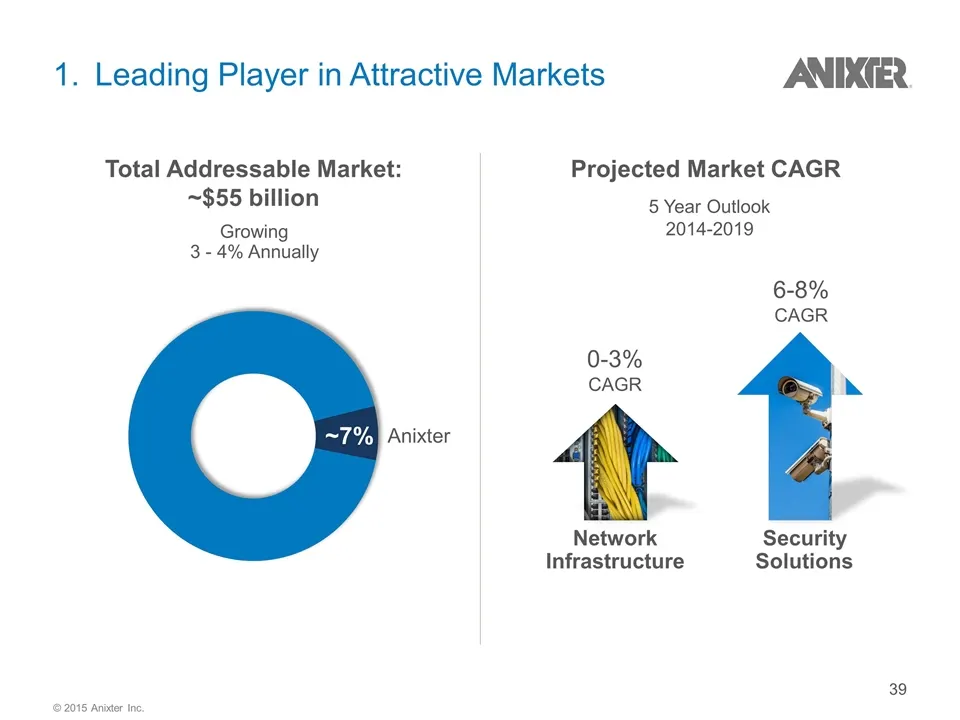
1. Leading Player in Attractive Markets Network Infrastructure Security Solutions 0-3% CAGR 6-8% CAGR Total Addressable Market: ~$55 billion Growing 3 - 4% Annually ~7% Anixter Projected Market CAGR 5 Year Outlook 2014-2019 © 2015 Anixter Inc.
Slide 40: Broad and Diverse Customer Base
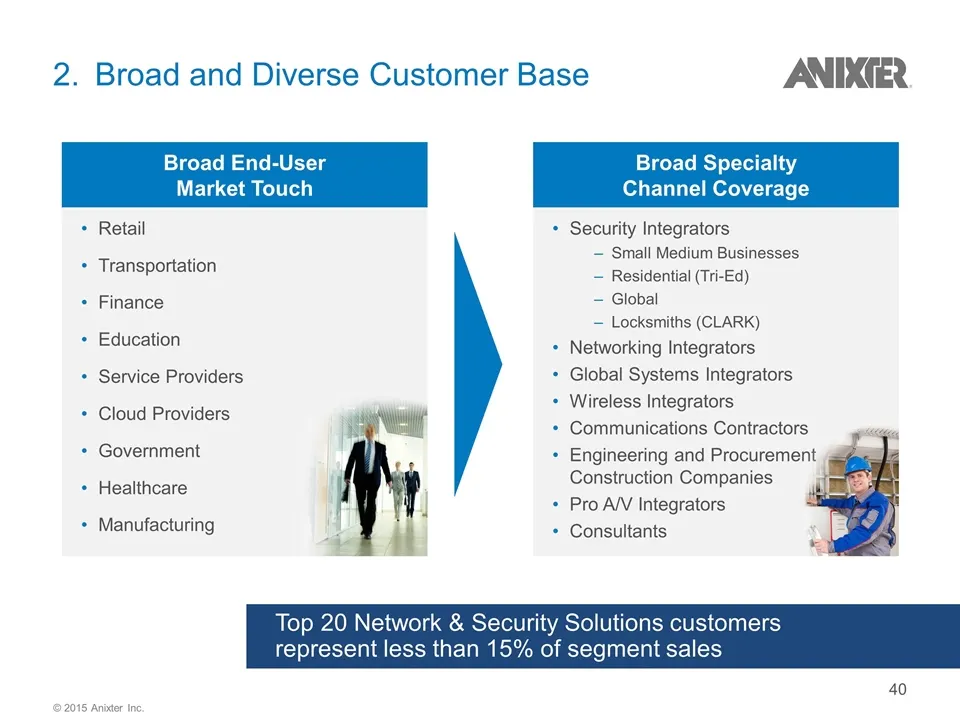
2. Broad and Diverse Customer Base Retail Transportation Finance Education Service Providers Cloud Providers Government Healthcare Manufacturing Top 20 Network & Security Solutions customers represent less than 15% of segment sales Security Integrators Small Medium Businesses Residential (Tri-Ed) Gl
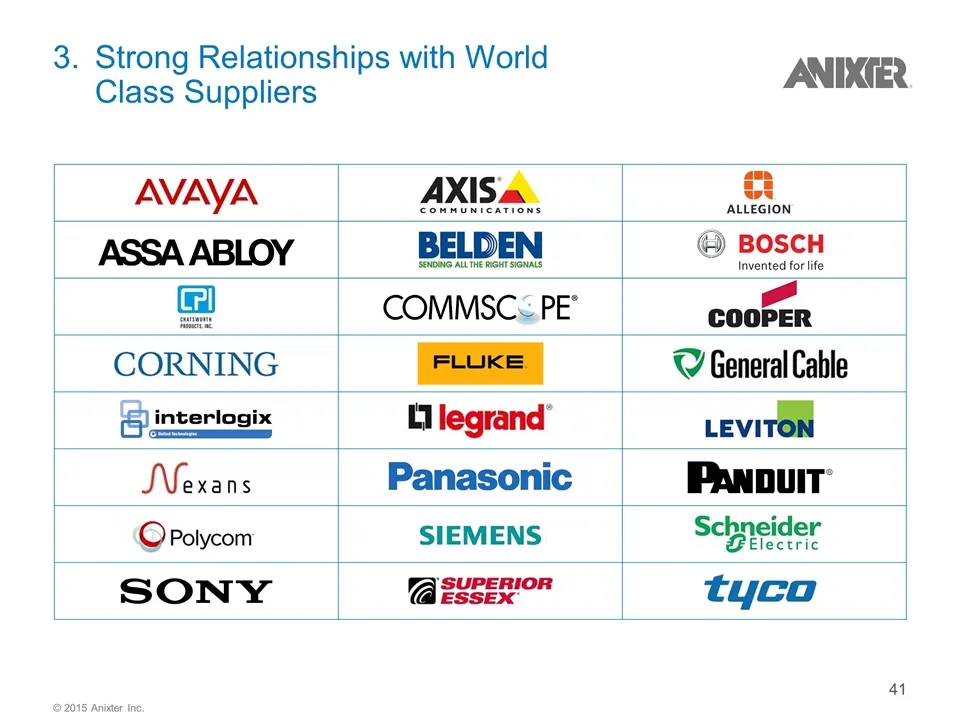
Slide 41: Strong Relationships with World Class Suppliers
3.Strong Relationships with World Class Suppliers © 2015 Anixter Inc.
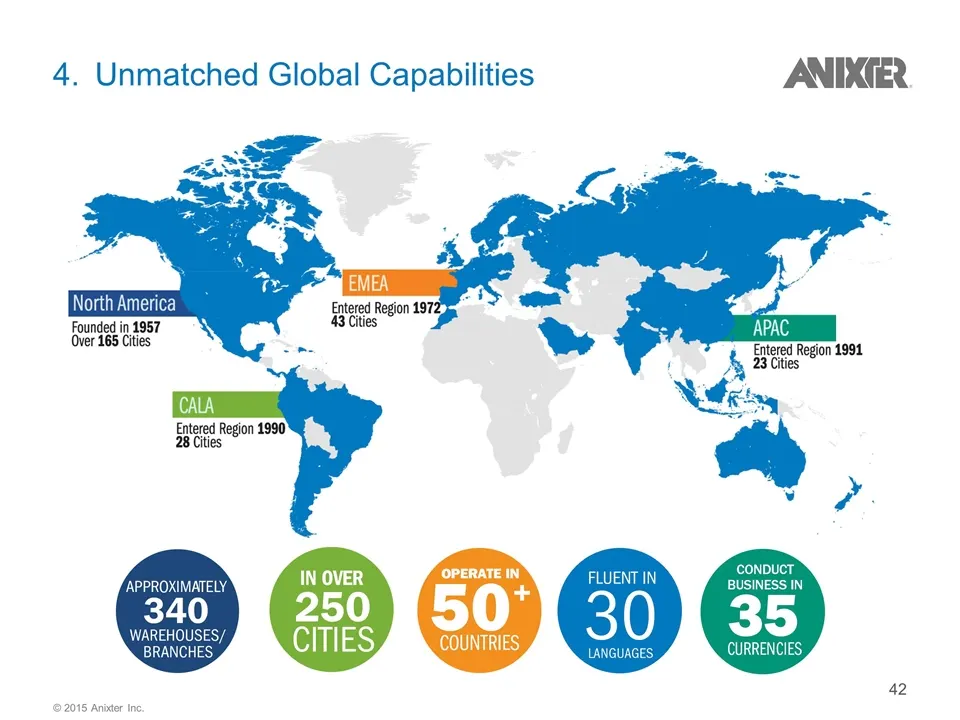
Slide 42: Unmatched Global Capabilities
4. Unmatched Global Capabilities © 2015 Anixter Inc.
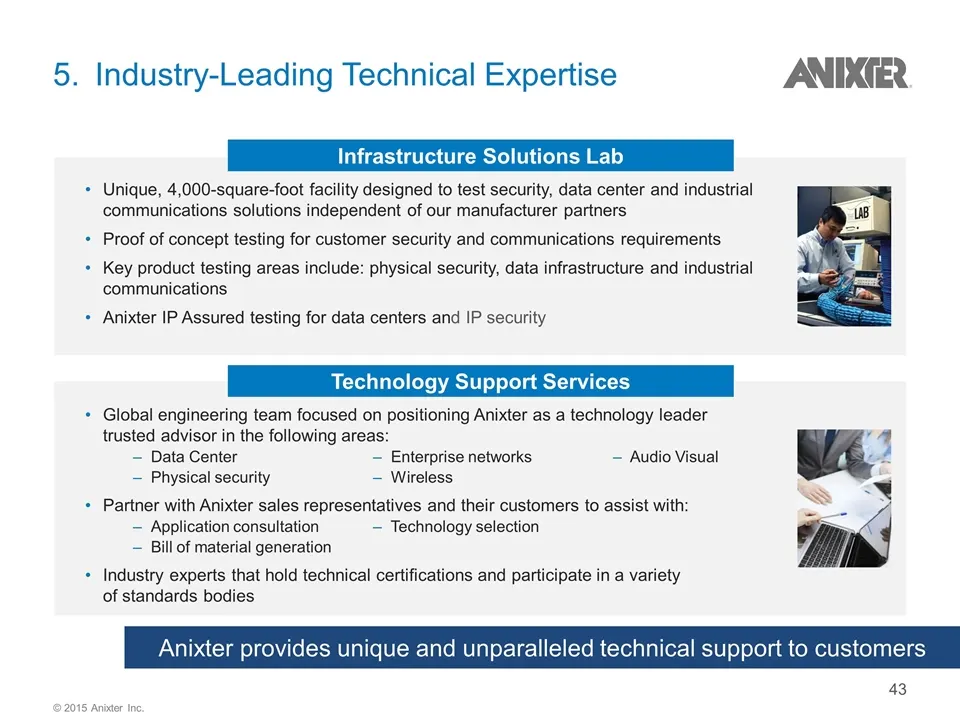
Slide 43: Industry-Leading Technical Expertise
Unique, 4,000-square-foot facility designed to test security, data center and industrial communications solutions independent of our manufacturer partners Proof of concept testing for customer security and communications requirements Key product testing areas include: physical security, data infrast
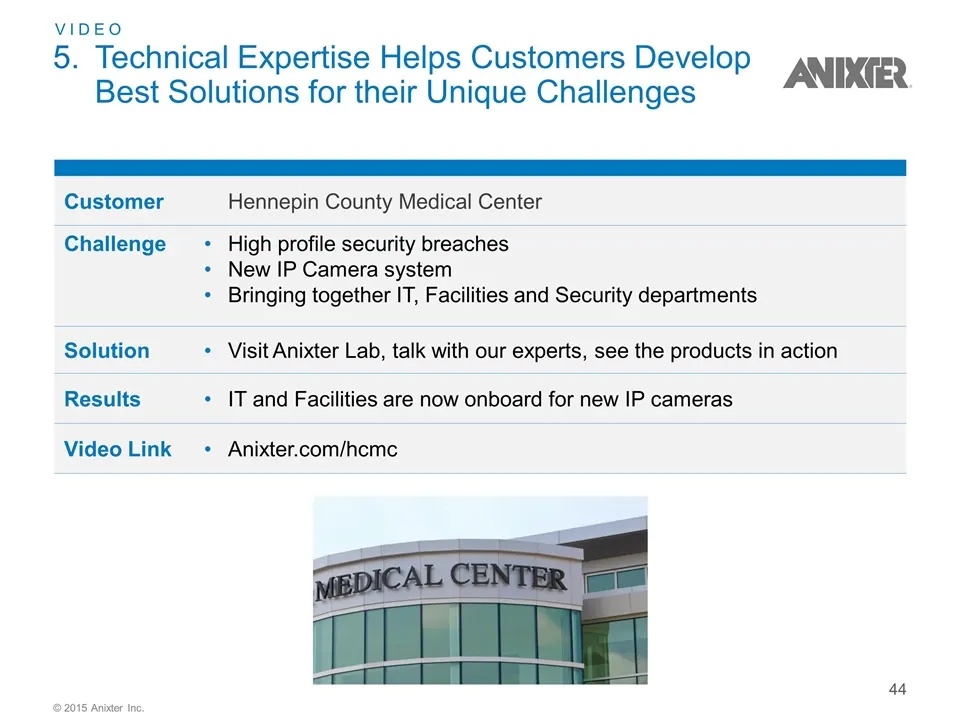
Slide 44: Technical Expertise Helps Customers Develop Best Solutions
5. Technical Expertise Helps Customers Develop Best Solutions for their Unique Challenges Customer Hennepin County Medical Center Challenge High profile security breaches New IP Camera system Bringing together IT, Facilities and Security departments Solution Visit Anixter Lab, talk with our experts,
Slide 45: Customized and Scalable Supply Chain Solutions
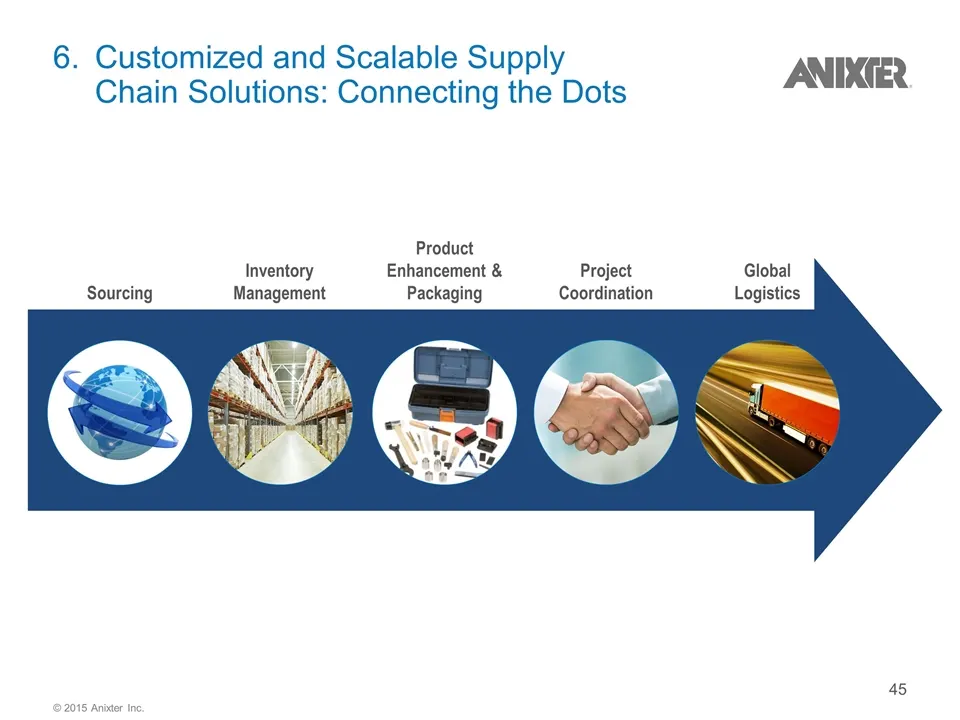
6. Customized and Scalable Supply Chain Solutions: Connecting the Dots Sourcing Inventory Management Product Enhancement & Packaging Project Coordination Global Logistics © 2015 Anixter Inc.
Slide 46: Agenda
Agenda Growth Strategy Network & Security Solutions Overview Key Strengths © 2015 Anixter Inc.
Slide 47: Growth Strategy
Growth Strategy Leverage existing global platform to deliver growth Capitalize on growth opportunities Deliver Tri-Ed synergies © 2015 Anixter Inc.
Slide 48: Leverage Existing Global Platform to Deliver Growth
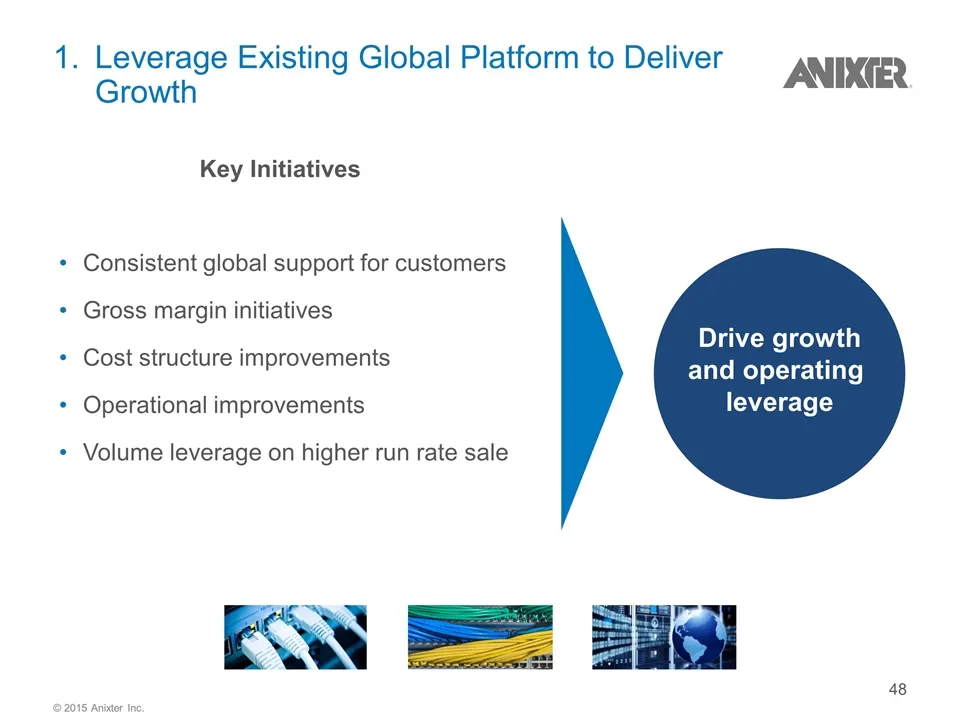
1. Leverage Existing Global Platform to Deliver Growth Consistent global support for customers Gross margin initiatives Cost structure improvements Operational improvements Volume leverage on higher run rate sale Key Initiatives Drive growth and operating leverage © 2015 Anixter Inc.
Slide 49: Capitalize on Growth Opportunities
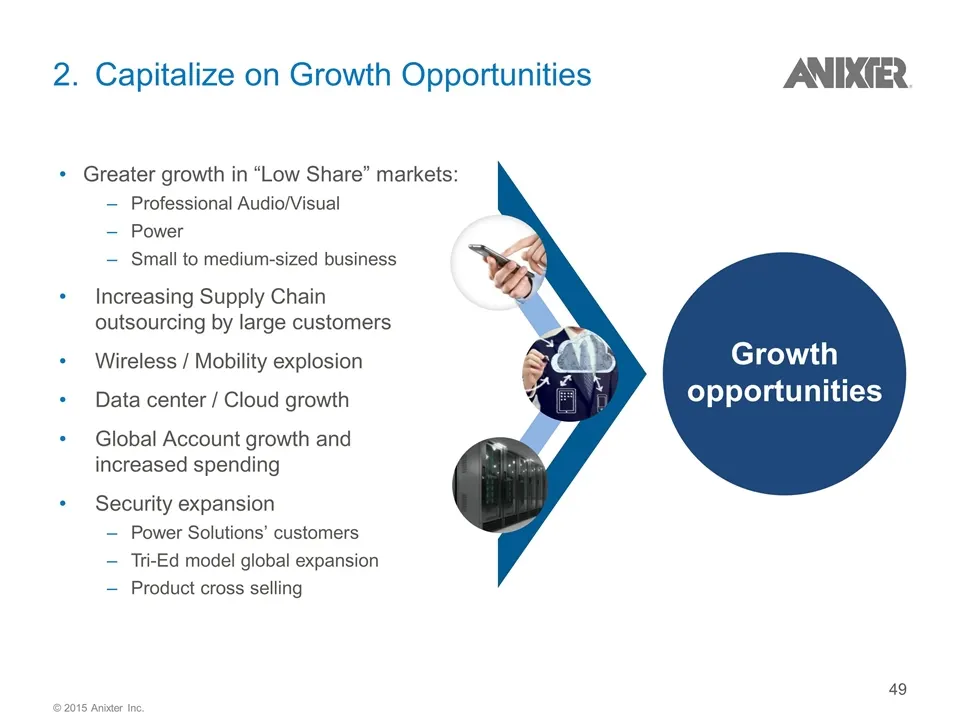
2. Capitalize on Growth Opportunities Greater growth in “Low Share” markets: Professional Audio/Visual Power Small to medium-sized business Increasing Supply Chain outsourcing by large customers Wireless / Mobility explosion Data center / Cloud growth Global Account growth and increased spending Sec
Slide 50: Deliver Tri-Ed Synergies
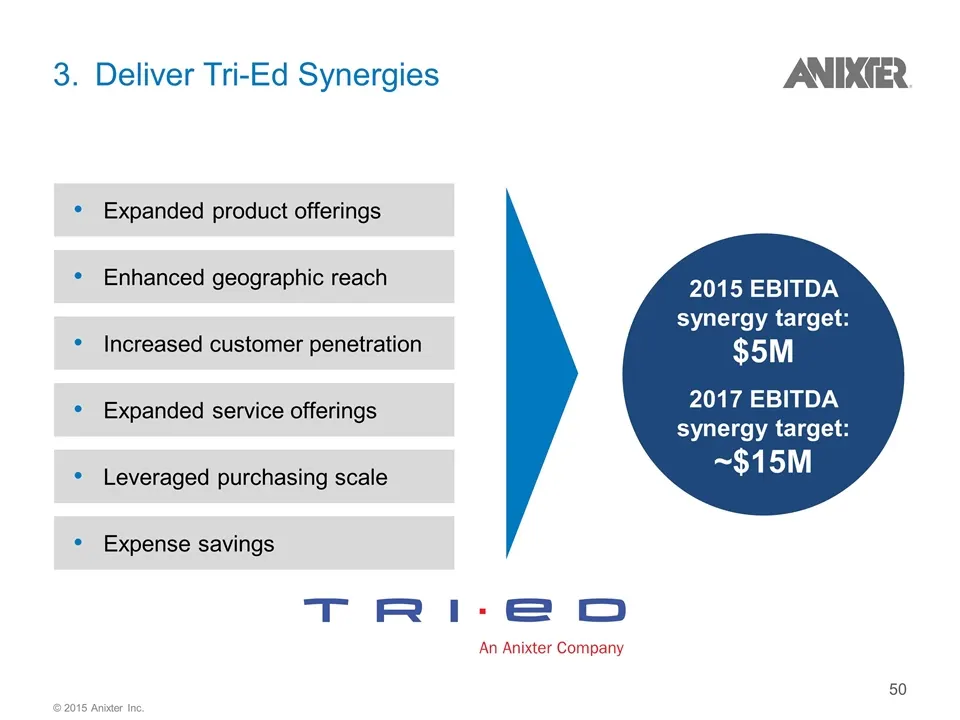
3. Deliver Tri-Ed Synergies Enhanced geographic reach Expanded service offerings 2015 EBITDA synergy target: $5M 2017 EBITDA synergy target: ~$15M Leveraged purchasing scale Increased customer penetration Expanded product offerings Expense savings © 2015 Anixter Inc.
Slide 51: Tri-Ed Synergies – Ahead of Target
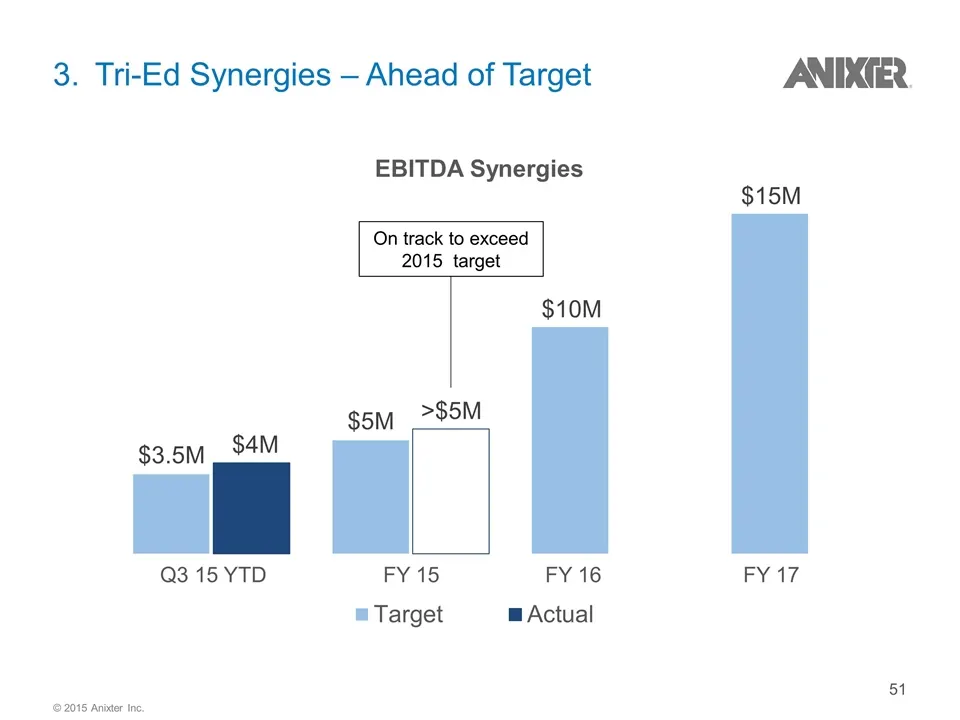
3. Tri-Ed Synergies – Ahead of Target EBITDA Synergies On track to exceed 2015 target Q3 15 YTD FY 15 FY 16 FY 17 © 2015 Anixter Inc.
Slide 52: Long Term Network & Security Solutions Goals
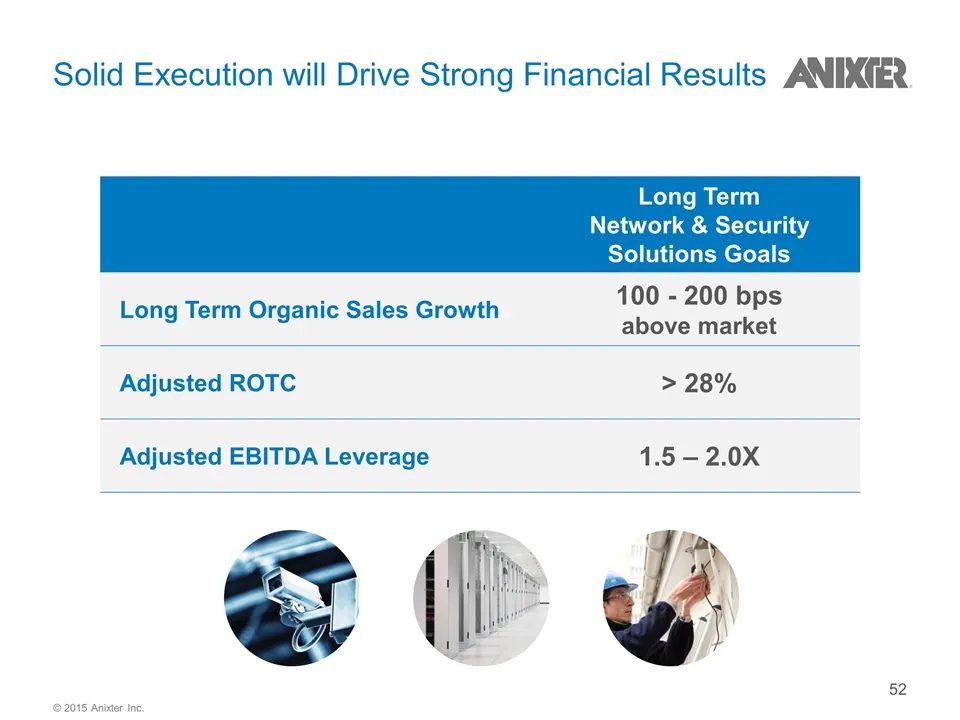
Solid Execution will Drive Strong Financial Results 52 Long Term Network & Security Solutions Goals Long Term Organic Sales Growth 100 - 200 bps above market Adjusted ROTC > 28% Adjusted EBITDA Leverage 1.5 – 2.0X © 2015 Anixter Inc.
Slide 53: In Summary
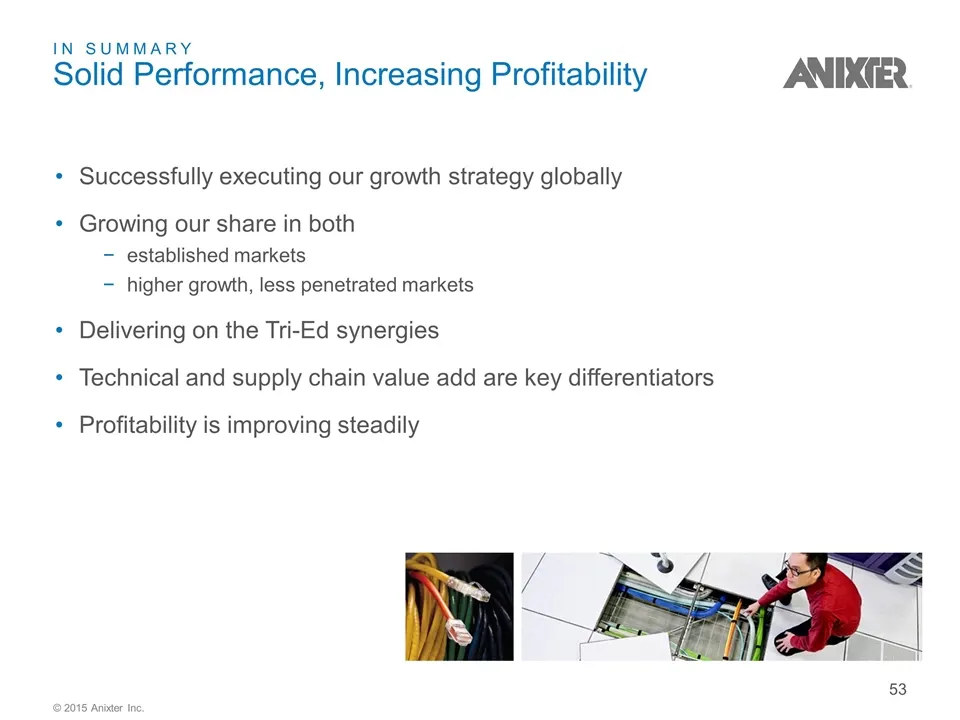
IN SUMMARY Solid Performance, Increasing Profitability 53 Successfully executing our growth strategy globally Growing our share in both established markets higher growth, less penetrated markets Delivering on the Tri-Ed synergies Technical and supply chain value add are key differentiators Profitabi
Slide 54: Bob Graham, EVP, Electrical & Electronic Solutions
Anixter Investor Day 2015 Bob Graham EVP, Electrical & Electronic Solutions
Slide 55: Agenda
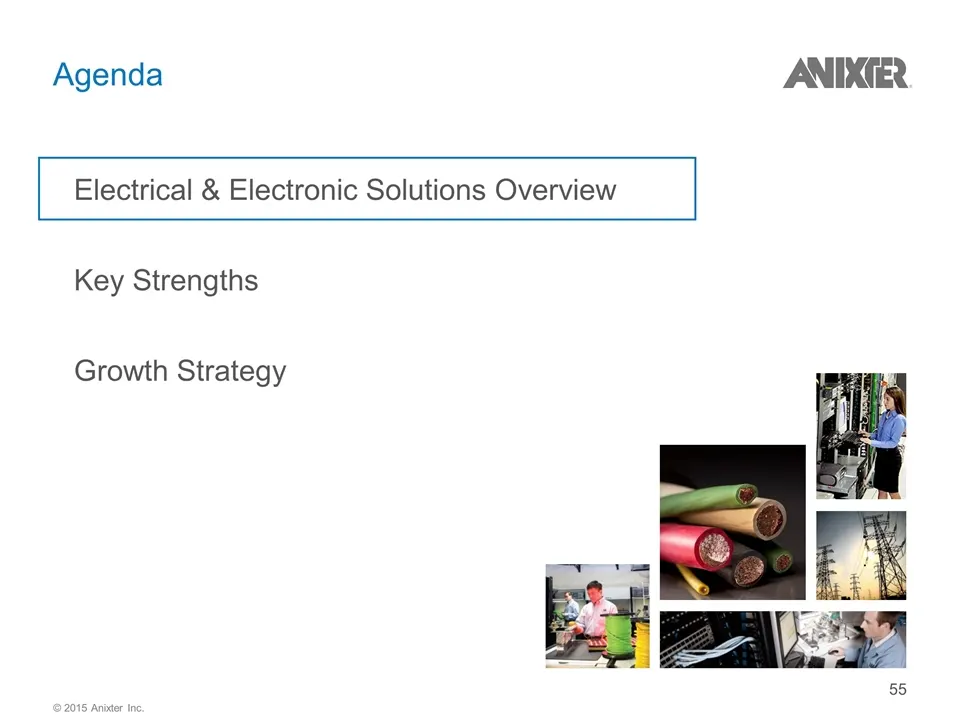
Agenda 55 Key Strengths Growth Strategy Electrical & Electronic Solutions Overview © 2015 Anixter Inc.
Slide 56: W&C at a Glance
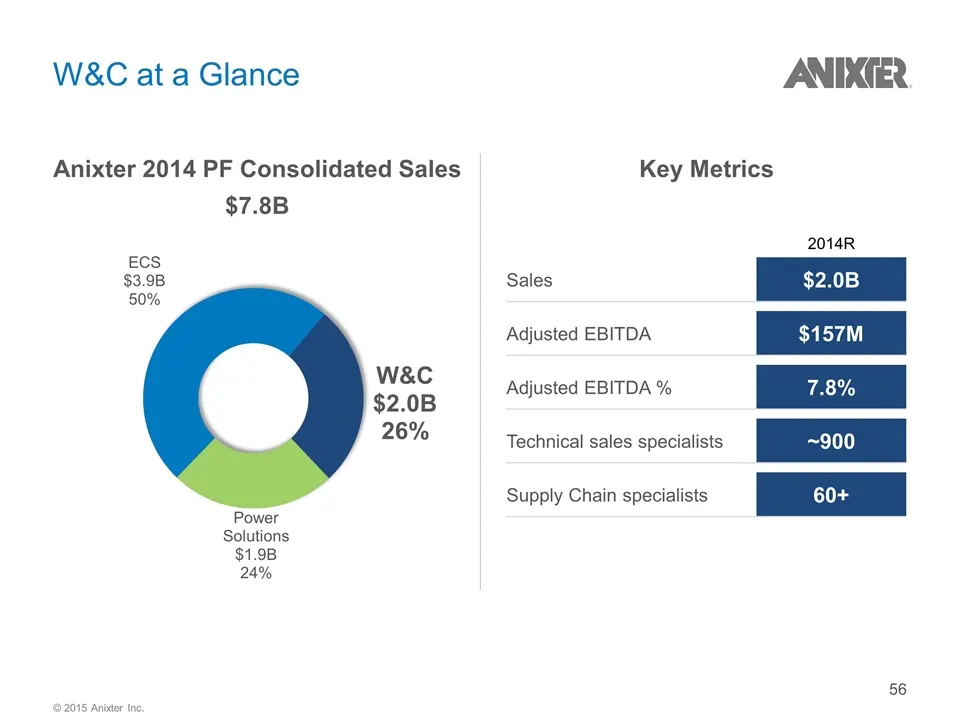
W&C at a Glance 56 2014R Sales $2.0B Adjusted EBITDA $157M Adjusted EBITDA % 7.8% Technical sales specialists ~900 Supply Chain specialists 60+ Anixter 2014 PF Consolidated Sales $7.8B Key Metrics © 2015 Anixter Inc.
Slide 57: Global Player with Presence in >30 Countries
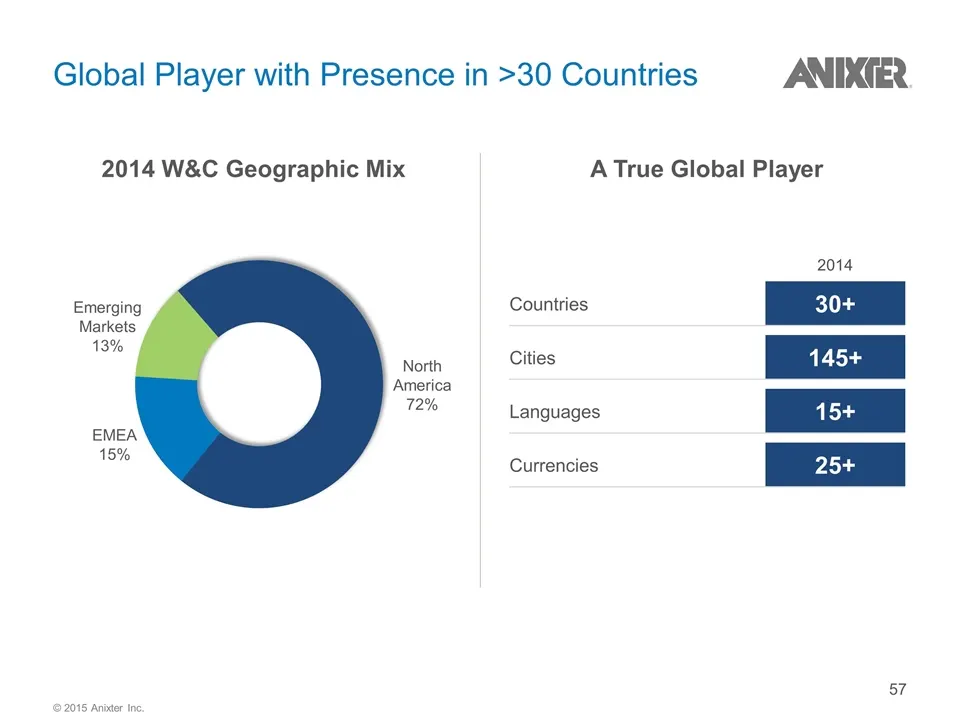
Global Player with Presence in >30 Countries Emerging Markets 13% North America 72% EMEA 15% 2014 W&C Geographic Mix Countries 30+ Cities 145+ Languages 15+ Currencies 25+ A True Global Player 2014 Kim to send Ryan Support © 2015 Anixter Inc.
Slide 58: Broad and Diverse Customer Base
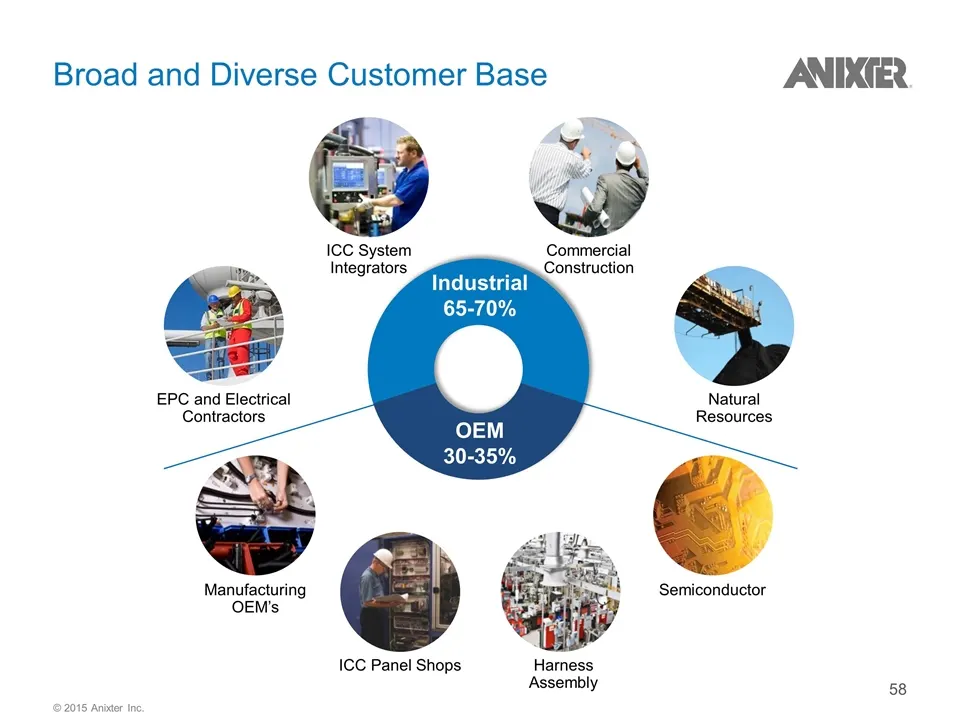
Broad and Diverse Customer Base EPC and Electrical Contractors ICC System Integrators Commercial Construction Natural Resources Industrial 65-70% OEM 30-35% Manufacturing OEM’s ICC Panel Shops Harness Assembly Semiconductor Accounting need support – Joe? © 2015 Anixter Inc.
Slide 59: New Segment Structure: Stronger Platform after Power Solutions
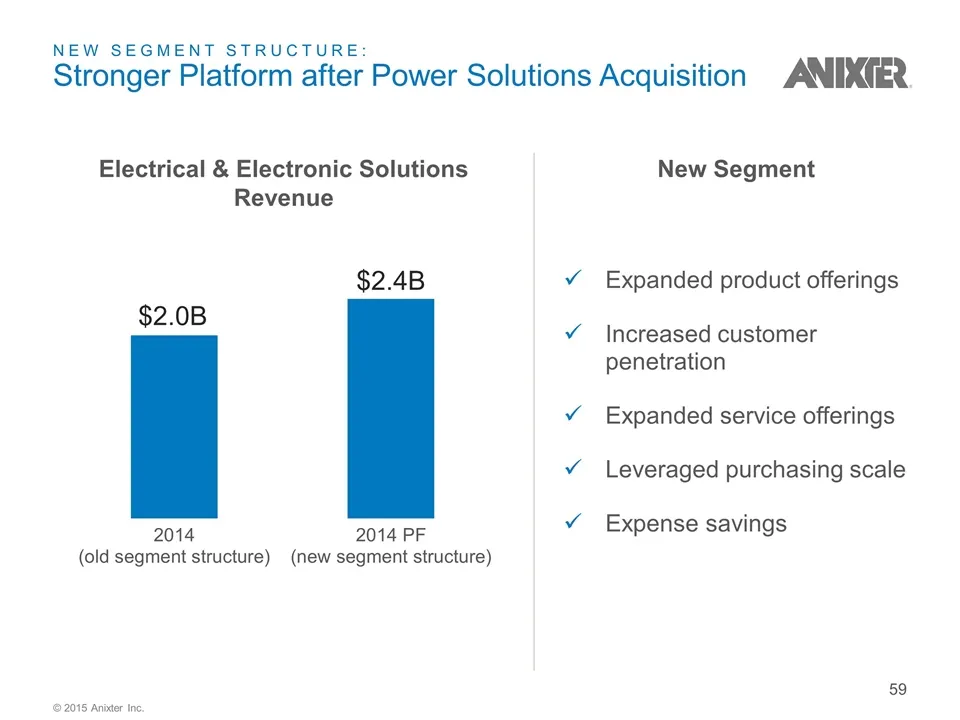
NEW SEGMENT STRUCTURE: Stronger Platform after Power Solutions Acquisition New Segment Electrical & Electronic Solutions Revenue Expanded product offerings Increased customer penetration Expanded service offerings Leveraged purchasing scale Expense savings Consistency check © 2015 Anixter Inc.
Slide 60: Agenda
Agenda Key Strengths Growth Strategy Electrical & Electronic Solutions Overview © 2015 Anixter Inc.
Slide 61: Key Strengths of Electrical & Electronic Solutions
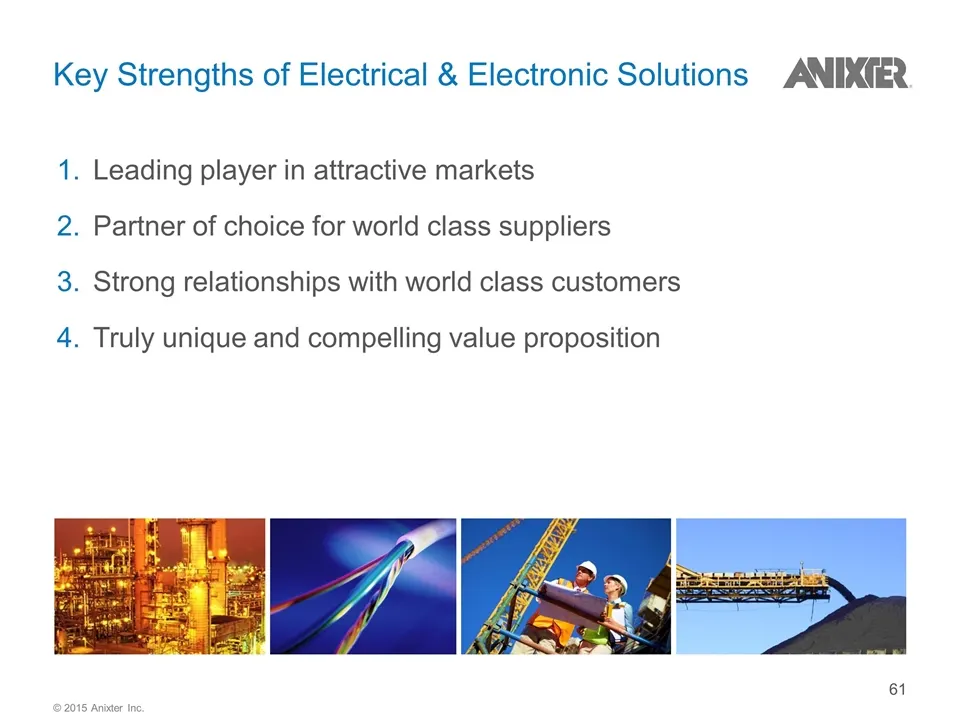
Key Strengths of Electrical & Electronic Solutions Leading player in attractive markets Partner of choice for world class suppliers Strong relationships with world class customers Truly unique and compelling value proposition © 2015 Anixter Inc.
Slide 62: Leading Player in Attractive Markets
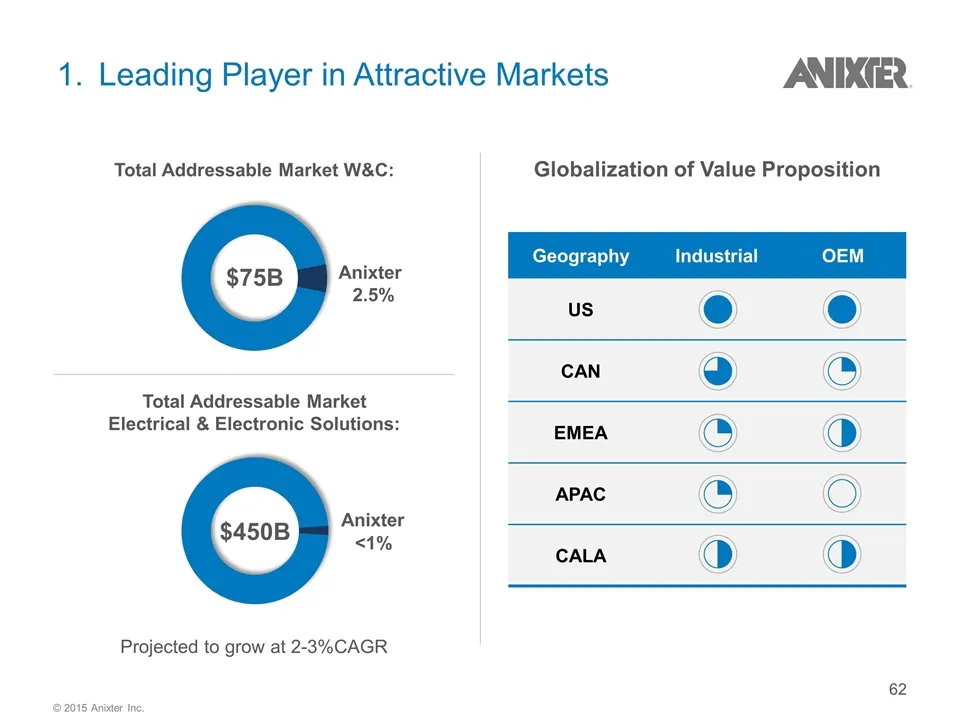
1. Leading Player in Attractive Markets Total Addressable Market Electrical & Electronic Solutions: Projected to grow at 2-3%CAGR <1% Anixter Geography Industrial OEM US CAN EMEA APAC CALA Globalization of Value Proposition Total Addressable Market W&C: Anixter 2.5% $75B $450B © 2015 Anixter Inc.
Slide 63: Partner of Choice for World Class Suppliers
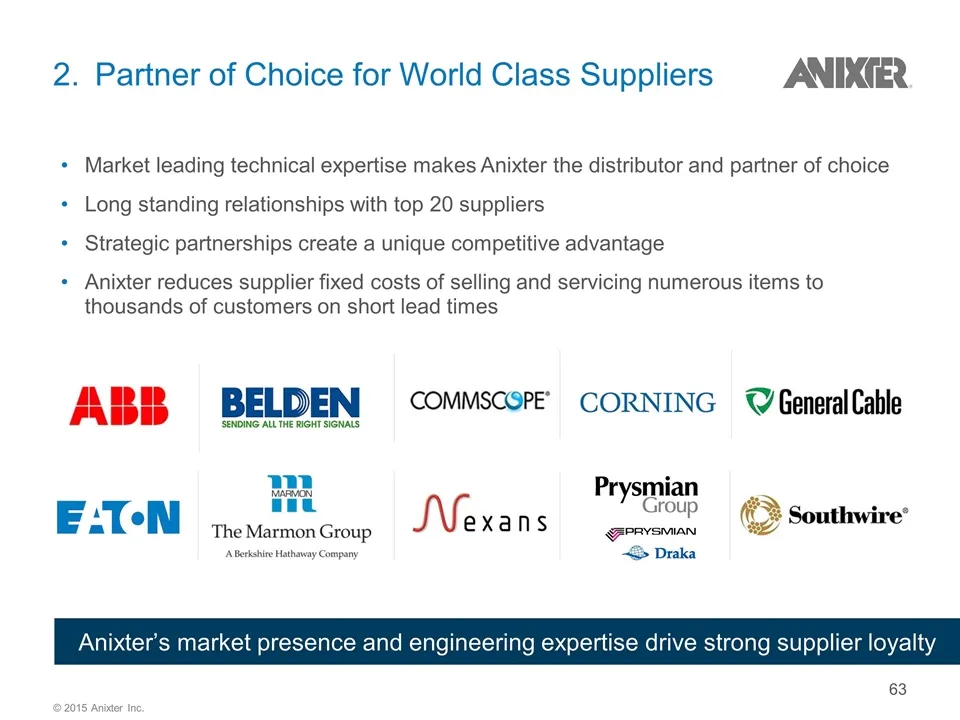
2.Partner of Choice for World Class Suppliers Market leading technical expertise makes Anixter the distributor and partner of choice Long standing relationships with top 20 suppliers Strategic partnerships create a unique competitive advantage Anixter reduces supplier fixed costs of selling and serv
Slide 64: Strong Relationships with World Class Customers
3. Strong Relationships with World Class Customers BAE Systems Bechtel CB&I DOW Duke Energy Eaton First Energy Fluor GE Oil & Gas Johnson Controls Kiewit MKS Terex Veca Our core value proposition lowers cost, complexity and risk for our customers © 2015 Anixter Inc.
Slide 65: Truly Unique and Compelling Value Proposition
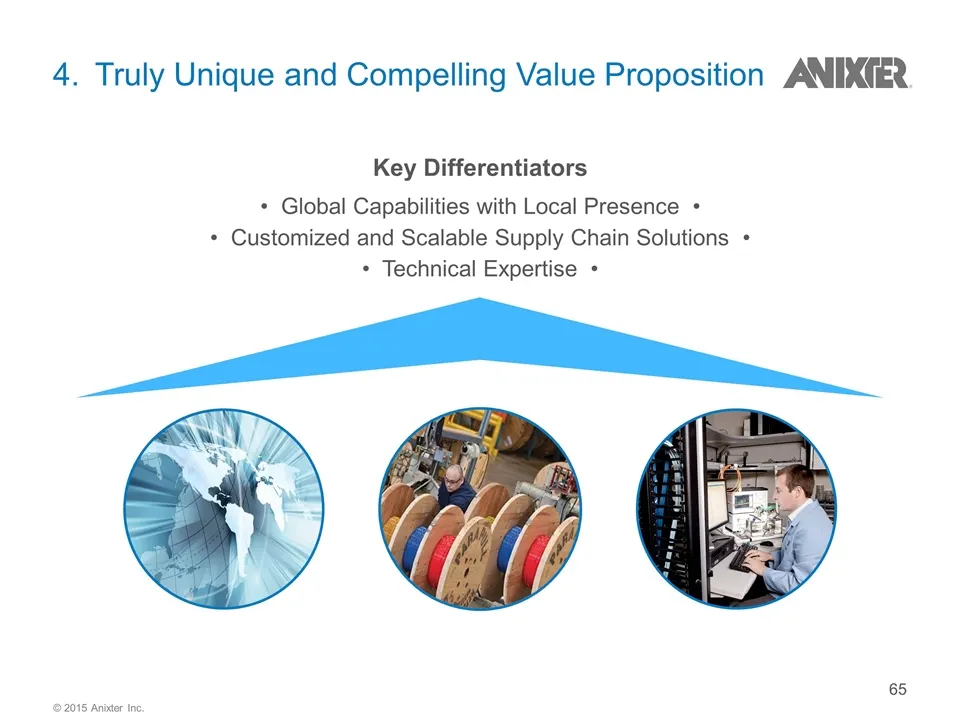
4. Truly Unique and Compelling Value Proposition Key Differentiators • Global Capabilities with Local Presence • • Customized and Scalable Supply Chain Solutions • • Technical Expertise • © 2015 Anixter Inc.
Slide 66: Agenda
Agenda Key Strengths Growth Strategy Electrical & Electronic Solutions Overview © 2015 Anixter Inc.
Slide 67: Market Dynamics Play to Our Strengths
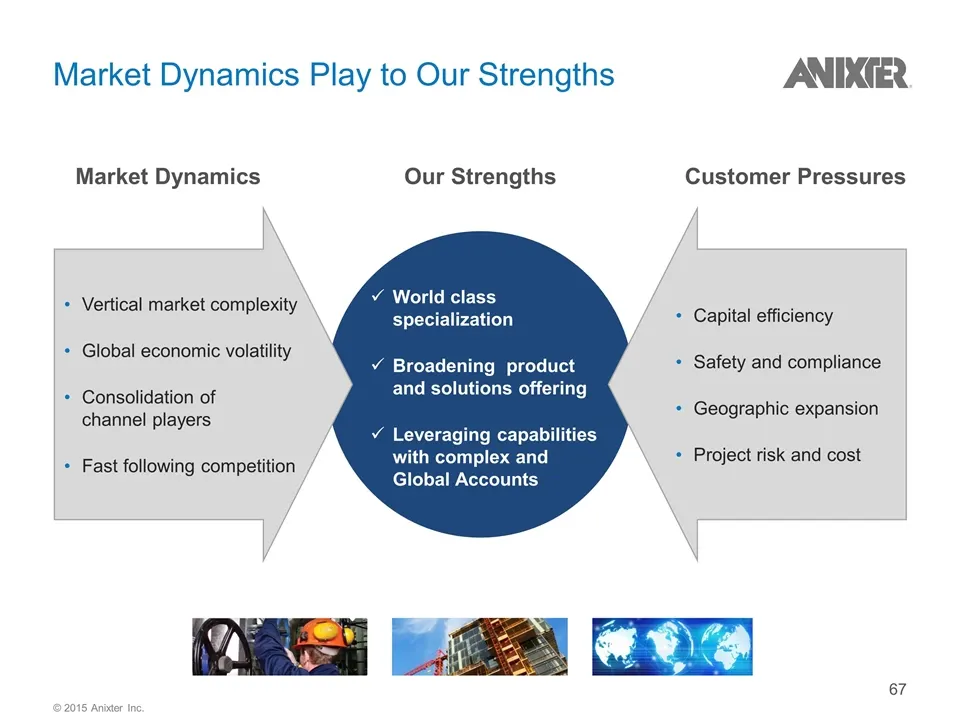
Market Dynamics Play to Our Strengths Vertical market complexity Global economic volatility Consolidation of channel players Fast following competition Market Dynamics Customer Pressures World class specialization Broadening product and solutions offering Leveraging capabilities with complex and Glo
Slide 68: Growth Strategy
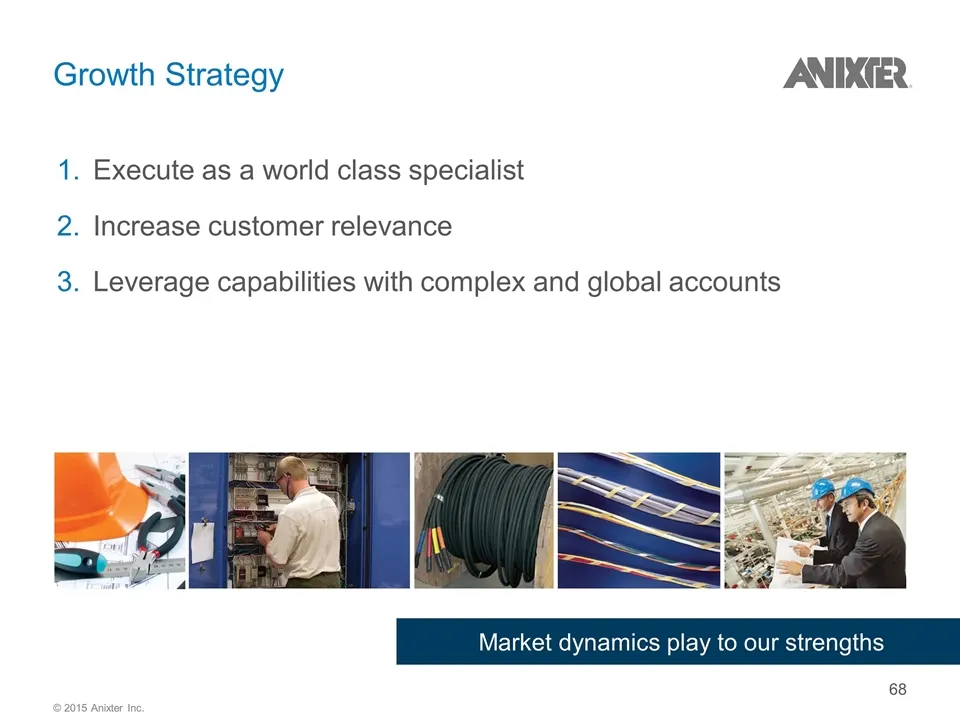
Market dynamics play to our strengths Growth Strategy Execute as a world class specialist Increase customer relevance Leverage capabilities with complex and global accounts © 2015 Anixter Inc.
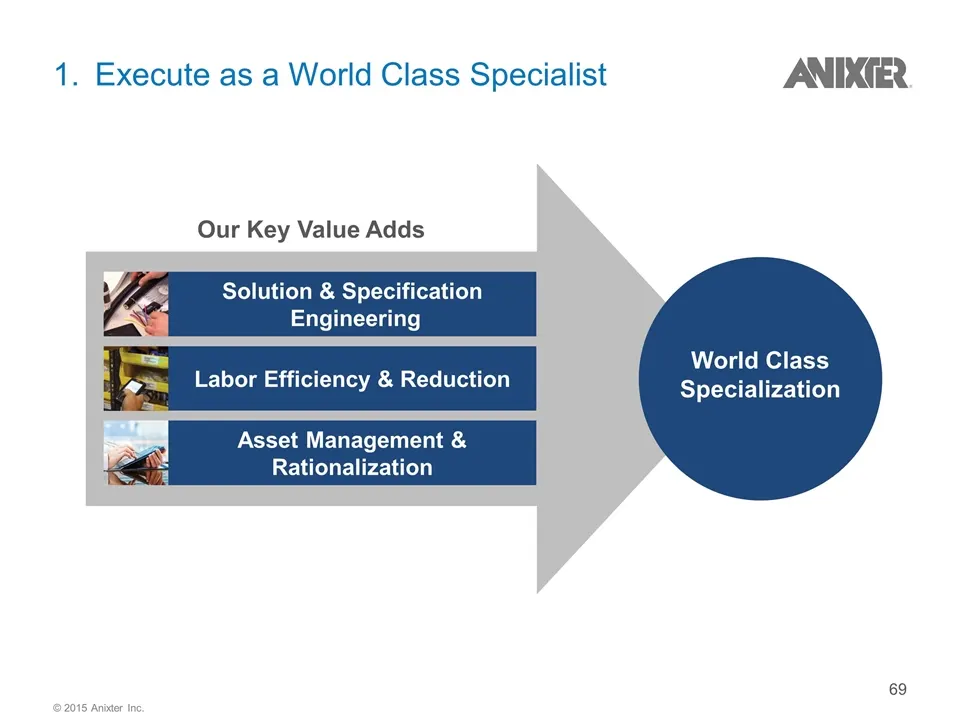
Slide 69: Execute as a World Class Specialist
1. Execute as a World Class Specialist World Class Specialization Solution & Specification Engineering Labor Efficiency & Reduction Asset Management & Rationalization Our Key Value Adds © 2015 Anixter Inc.
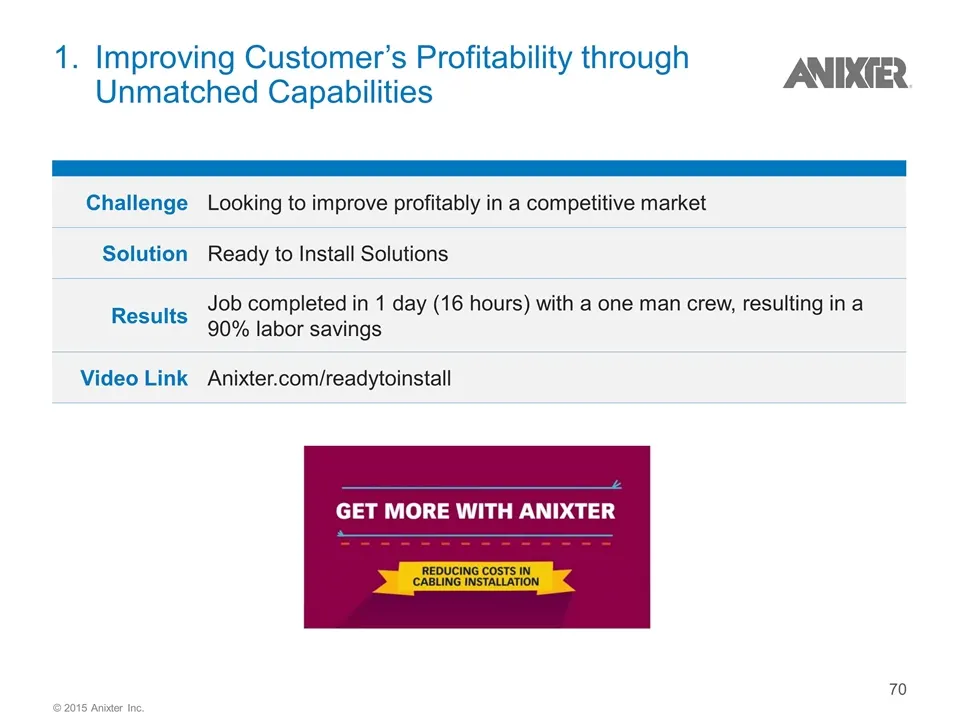
Slide 70: Improving Customer's Profitability through Unmatched Capabilities
1.Improving Customer’s Profitability through Unmatched Capabilities Challenge Looking to improve profitably in a competitive market Solution Ready to Install Solutions Results Job completed in 1 day (16 hours) with a one man crew, resulting in a 90% labor savings Video Link Anixter.com/readytoinstal
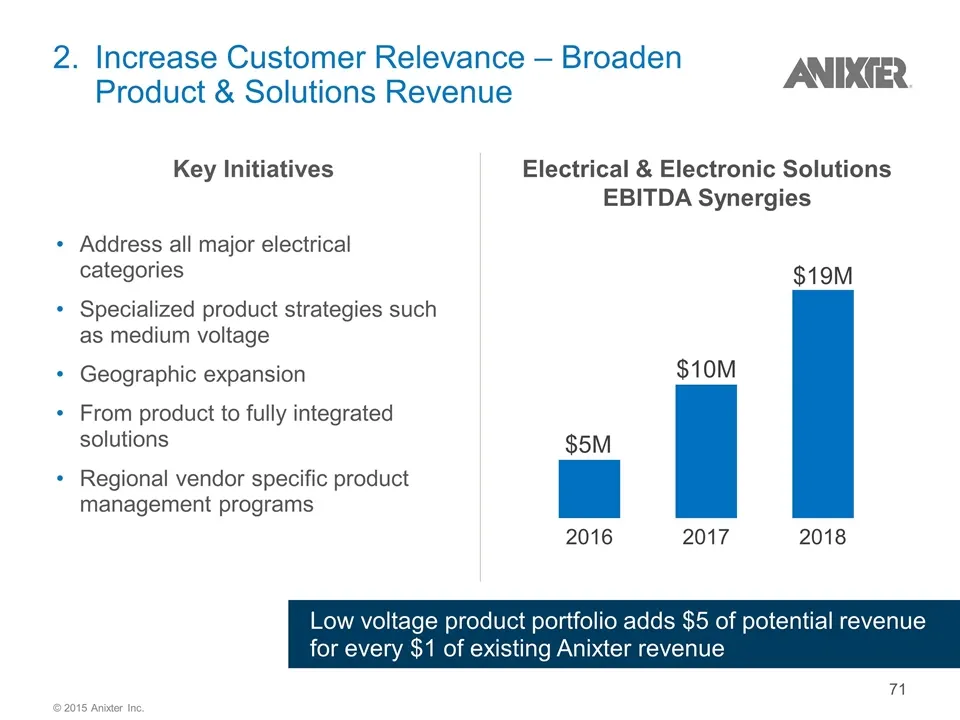
Slide 71: Increase Customer Relevance – Broaden Product & Solutions Revenue
Address all major electrical categories Specialized product strategies such as medium voltage Geographic expansion From product to fully integrated solutions Regional vendor specific product management programs Key Initiatives Electrical & Electronic Solutions EBITDA Synergies 2. Increase Customer R
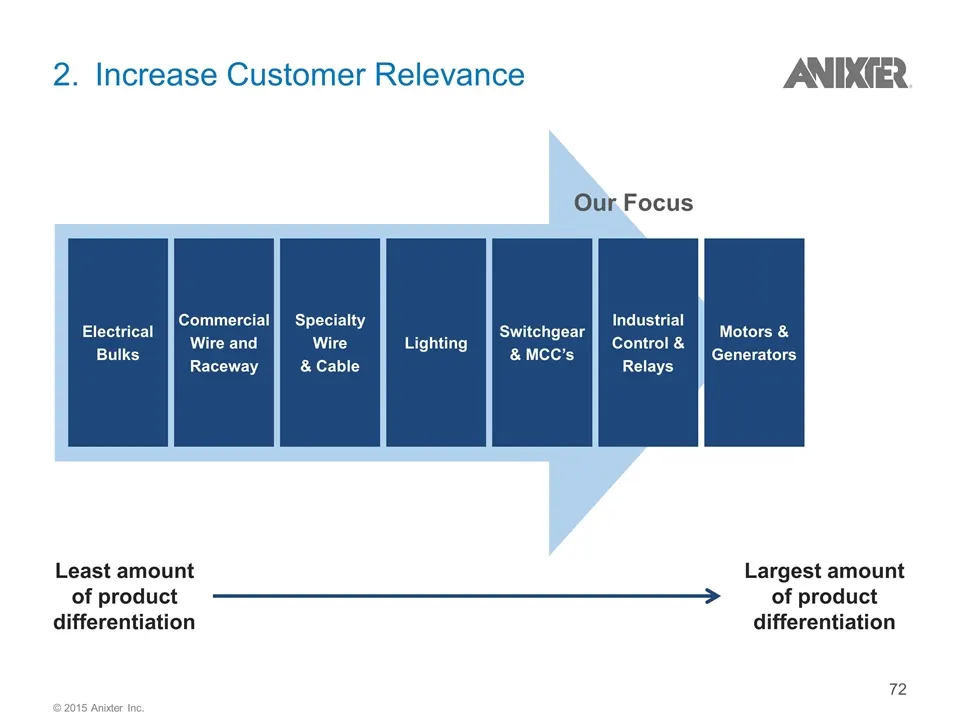
Slide 72: Increase Customer Relevance Our Focus
Electrical Bulks Commercial Wire and Raceway Specialty Wire & Cable Lighting Switchgear & MCC’s Industrial Control & Relays Motors & Generators Least amount of product differentiation Largest amount of product differentiation 2. Increase Customer Relevance Our Focus © 2015 Anixter Inc.
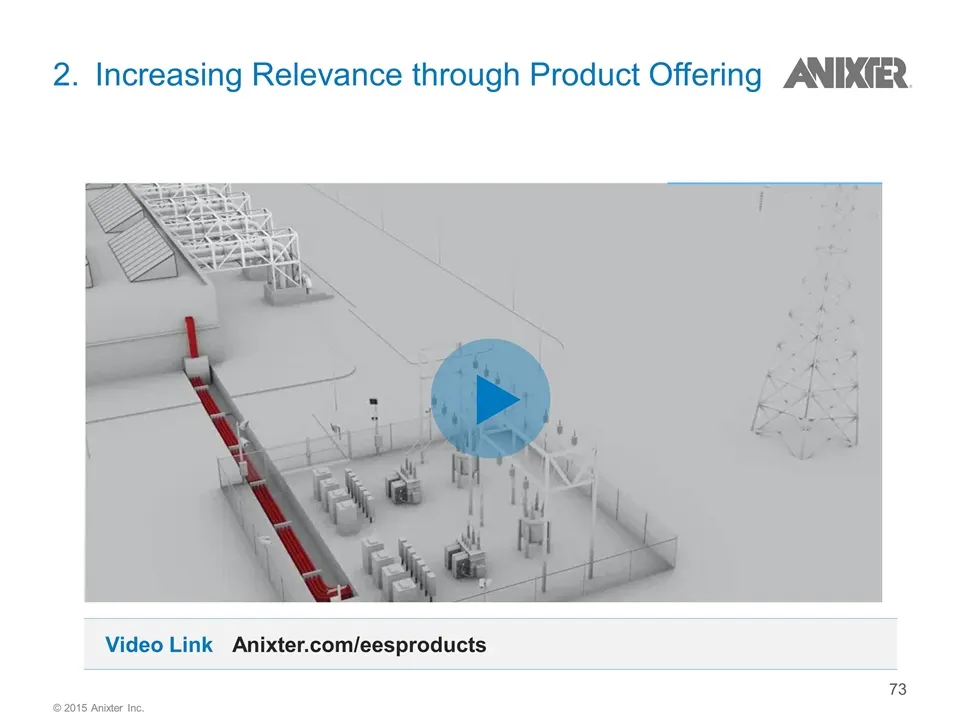
Slide 73: Increasing Relevance through Product Offering
2. Increasing Relevance through Product Offering Change to 5 Video Link Anixter.com/eesproducts © 2015 Anixter Inc.
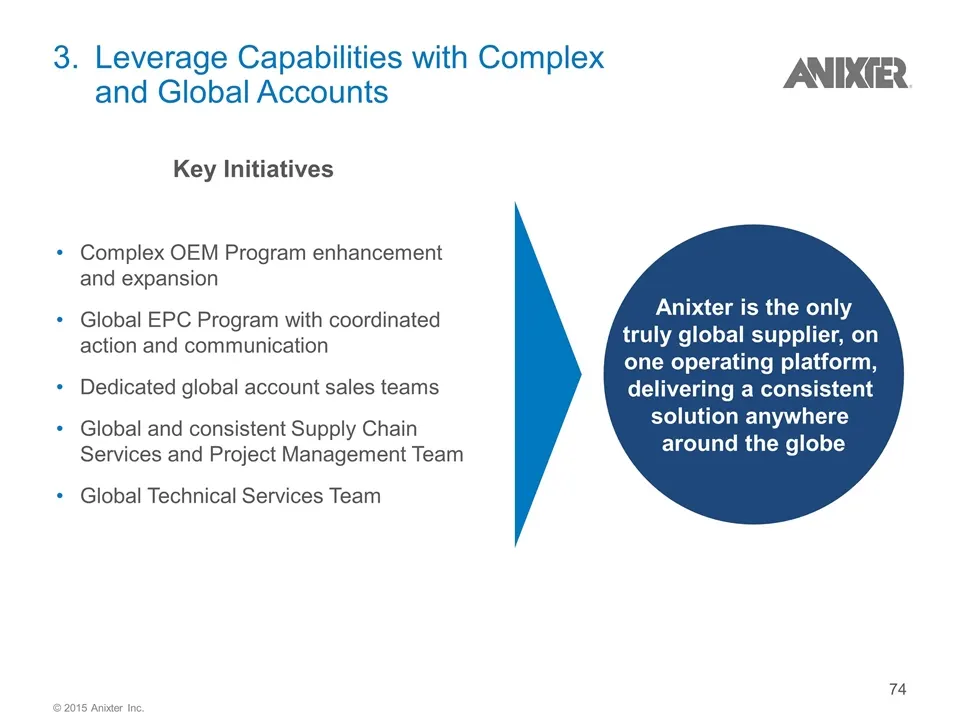
Slide 74: Leverage Capabilities with Complex and Global Accounts
3. Leverage Capabilities with Complex and Global Accounts Anixter is the only truly global supplier, on one operating platform, delivering a consistent solution anywhere around the globe Complex OEM Program enhancement and expansion Global EPC Program with coordinated action and communication Dedica
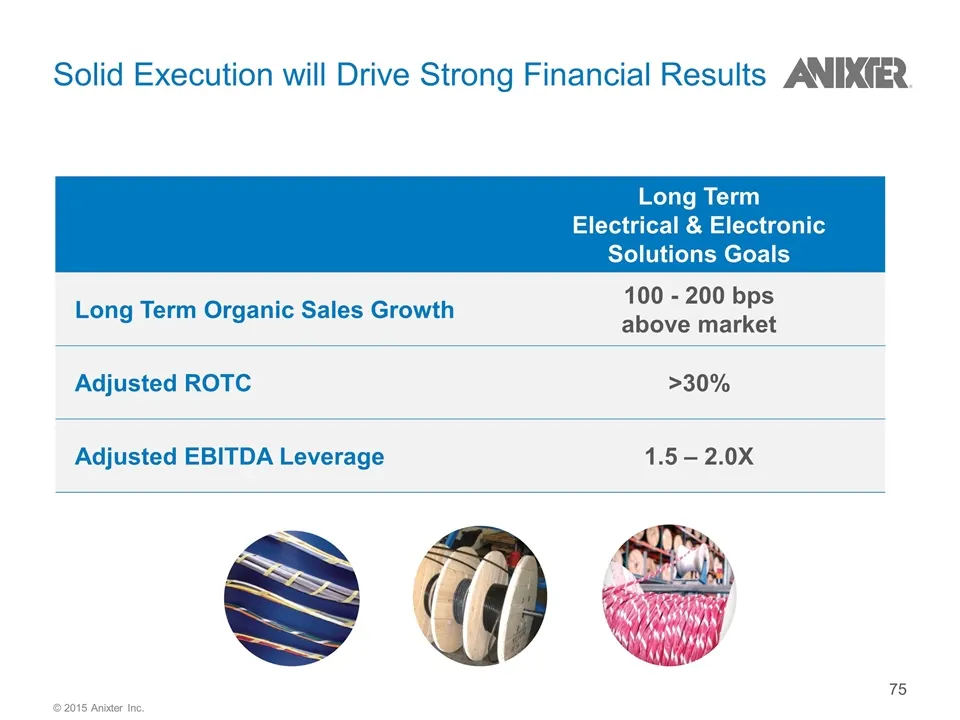
Slide 75: Long Term Electrical & Electronic Solutions Goals
Solid Execution will Drive Strong Financial Results Long Term Electrical & Electronic Solutions Goals Long Term Organic Sales Growth 100 - 200 bps above market Adjusted ROTC >30% Adjusted EBITDA Leverage 1.5 – 2.0X © 2015 Anixter Inc.
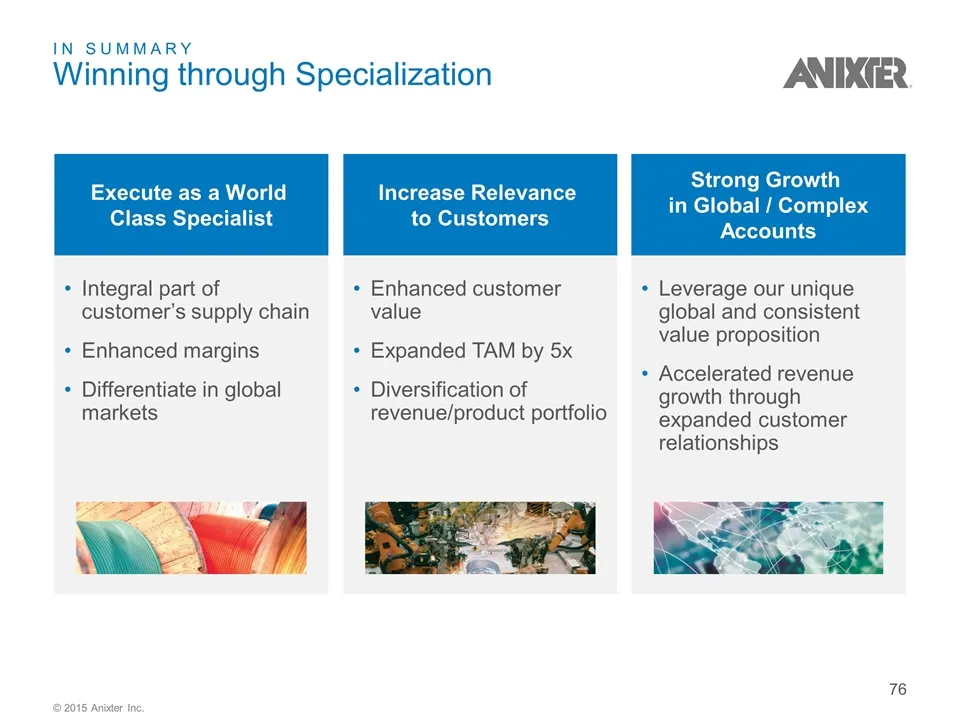
Slide 76: In Summary: Winning through Specialization
Enhanced customer value Expanded TAM by 5x Diversification of revenue/product portfolio Leverage our unique global and consistent value proposition Accelerated revenue growth through expanded customer relationships Integral part of customer’s supply chain Enhanced margins Differentiate in global mar
Slide 77: John Tisera, EVP, Utility Power Solutions
Anixter Investor Day 2015 John Tisera EVP, Utility Power Solutions
Slide 78: Agenda
Agenda Key Strengths Why We Win Utility Power Solutions Overview Growth Strategy © 2015 Anixter Inc.
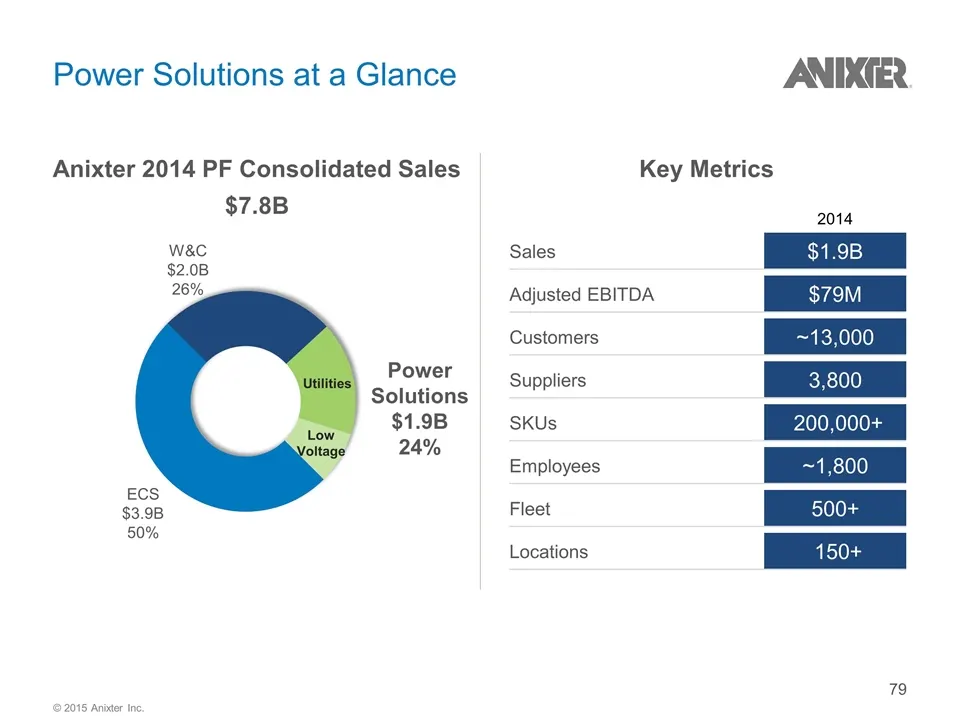
Slide 79: Power Solutions at a Glance
Key Metrics Power Solutions at a Glance 2014 Sales $1.9B Adjusted EBITDA $79M Customers ~13,000 Suppliers 3,800 SKUs 200,000+ Employees ~1,800 Fleet 500+ Locations 150+ Anixter 2014 PF Consolidated Sales $7.8B ECS $3.9B 50% W&C $2.0B 26% Power Solutions $1.9B 24% Utilities Low Voltage © 2015 Anixter
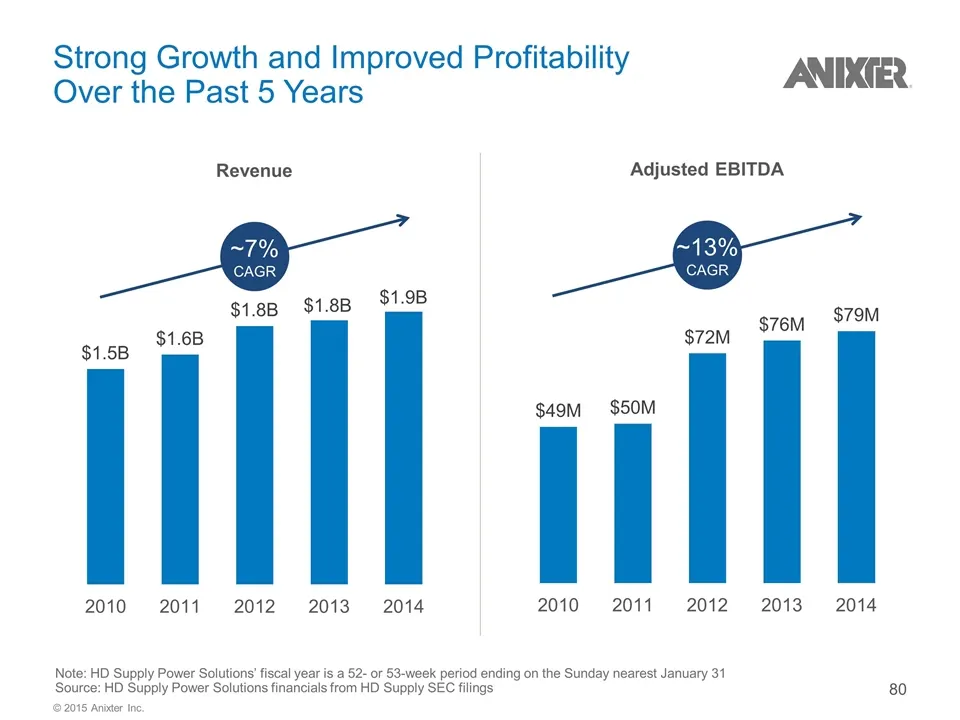
Slide 80: Strong Growth and Improved Profitability Over the Past Years
Strong Growth and Improved Profitability Over the Past 5 Years Note: HD Supply Power Solutions’ fiscal year is a 52- or 53-week period ending on the Sunday nearest January 31 Source: HD Supply Power Solutions financials from HD Supply SEC filings Revenue ~7% CAGR Adjusted EBITDA ~13% CAGR © 2015 Ani
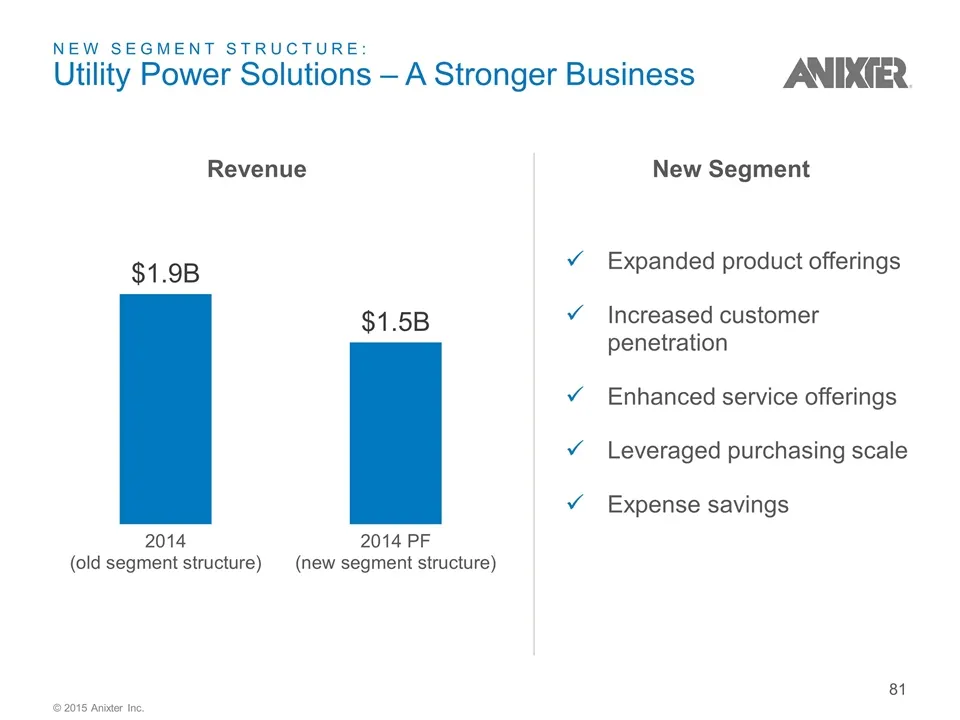
Slide 81: Utility Power Solutions – A Stronger Business
NEW SEGMENT STRUCTURE: Utility Power Solutions – A Stronger Business New Segment Expanded product offerings Increased customer penetration Enhanced service offerings Leveraged purchasing scale Expense savings Revenue © 2015 Anixter Inc.
Slide 82: Agenda
Agenda Key Strengths Why We Win Utility Power Solutions Overview Growth Strategy © 2015 Anixter Inc.
Slide 83: Key Strengths
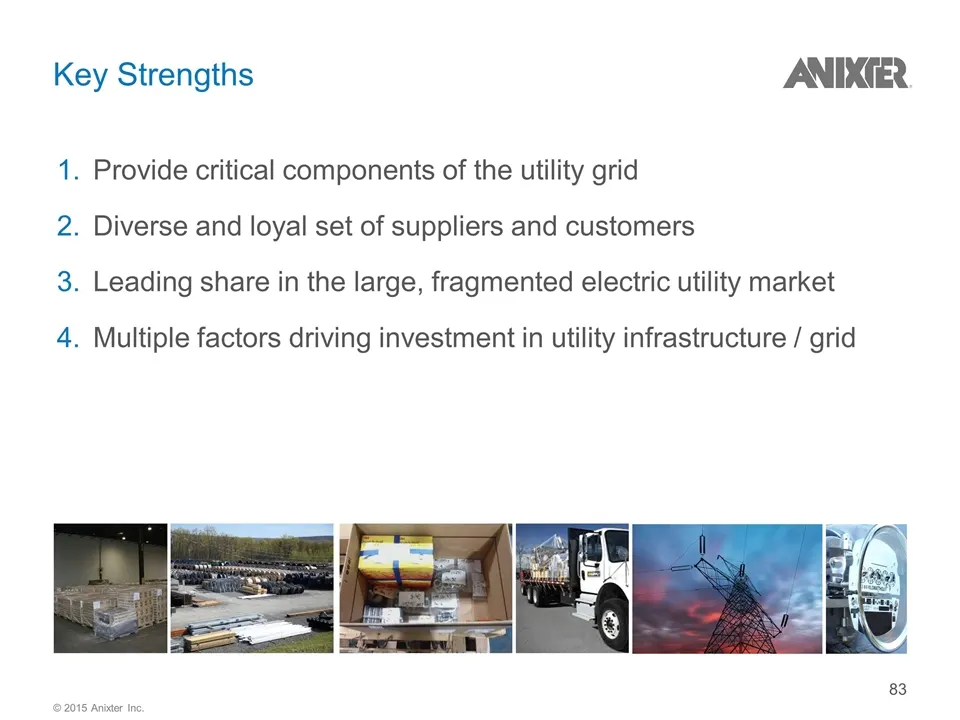
Key Strengths Provide critical components of the utility grid Diverse and loyal set of suppliers and customers Leading share in the large, fragmented electric utility market Multiple factors driving investment in utility infrastructure / grid © 2015 Anixter Inc.
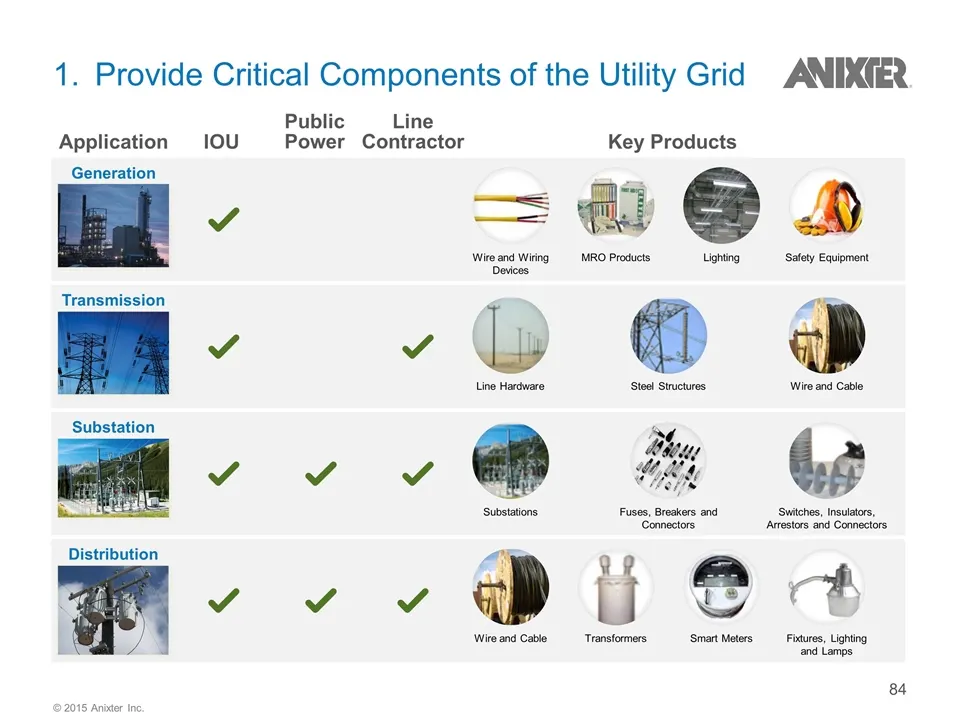
Slide 84: Provide Critical Components of the Utility Grid
1. Provide Critical Components of the Utility Grid Generation Transmission Substation Distribution Application IOU Key Products MRO Products Lighting Safety Equipment Switches, Insulators, Arrestors and Connectors Line Hardware Steel Structures Fuses, Breakers and Connectors Substations Transformers
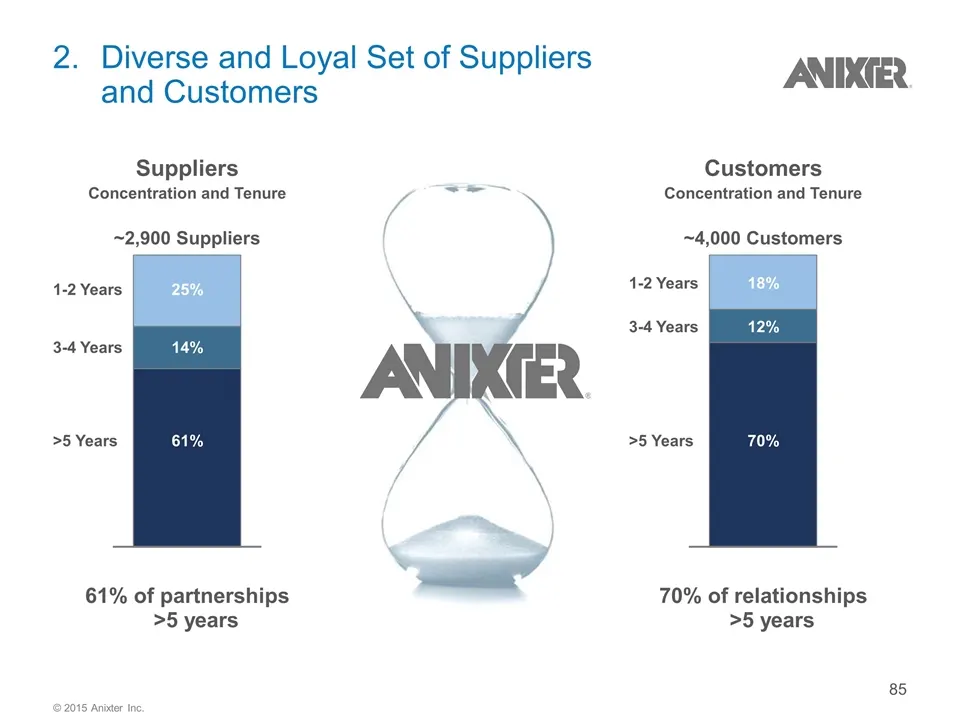
Slide 85: Diverse and Loyal Set of Suppliers and Customers
1-2 Years 3-4 Years >5 Years 25% 14% 61% ~2,900 Suppliers 1-2 Years 3-4 Years >5 Years 18% 12% 70% ~4,000 Customers Customers Concentration and Tenure 70% of relationships >5 years Suppliers Concentration and Tenure 61% of partnerships >5 years 2. Diverse and Loyal Set of Suppliers and Customers © 2
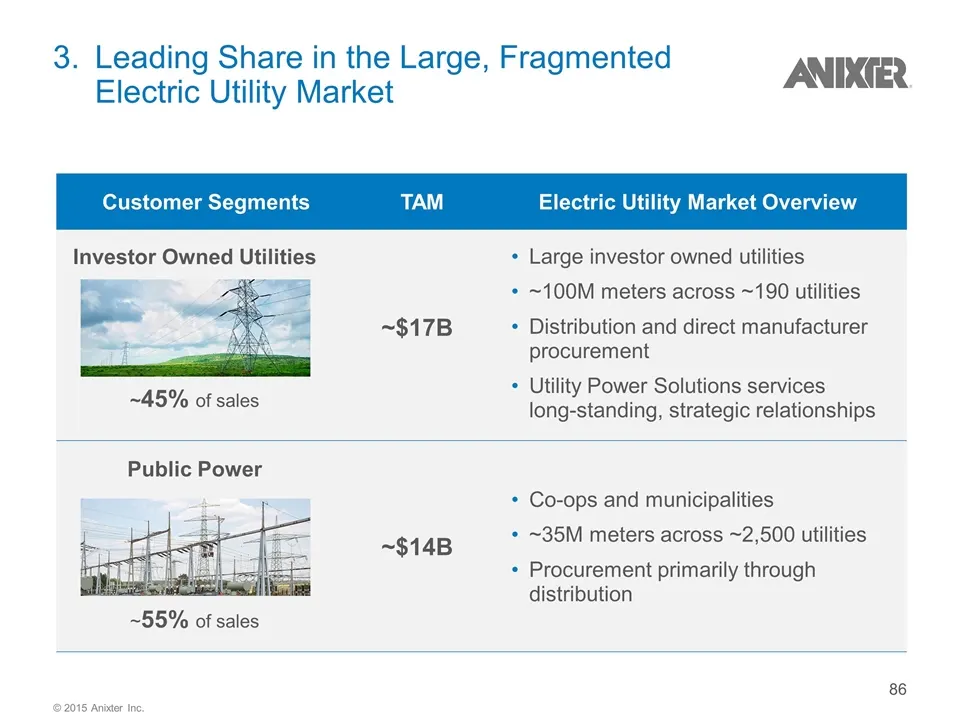
Slide 86: Leading Share in the Large, Fragmented Electric Utility Market
Customer Segments TAM Electric Utility Market Overview 3. Leading Share in the Large, Fragmented Electric Utility Market Investor Owned Utilities Large investor owned utilities ~100M meters across ~190 utilities Distribution and direct manufacturer procurement Utility Power Solutions services long-s
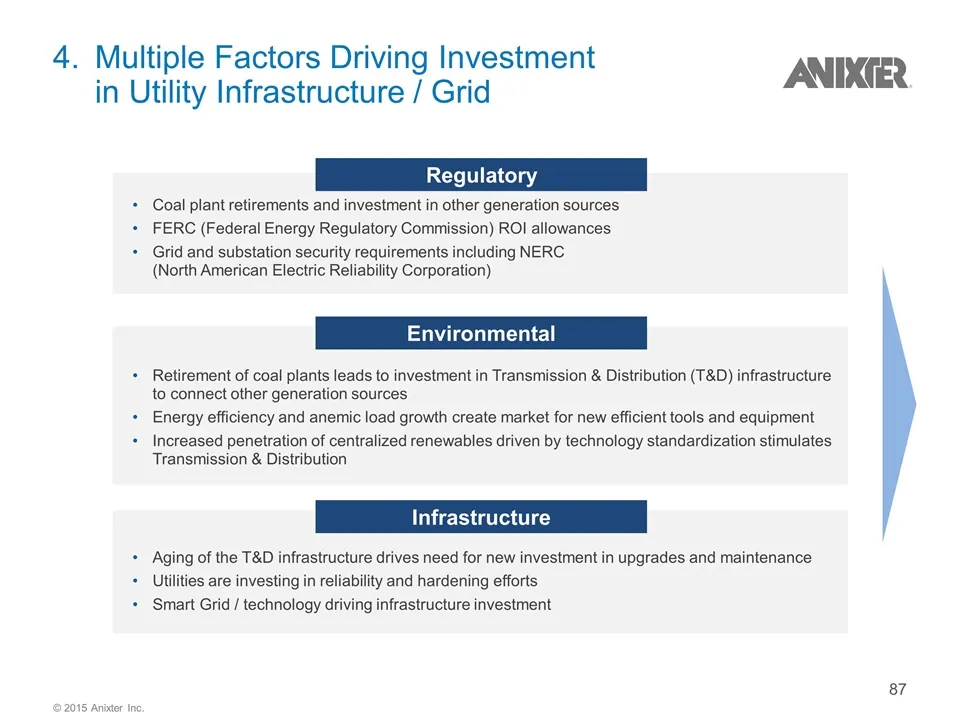
Slide 87: Multiple Factors Driving Investment in Utility Infrastructure / Grid
4. Multiple Factors Driving Investment in Utility Infrastructure / Grid Coal plant retirements and investment in other generation sources FERC (Federal Energy Regulatory Commission) ROI allowances Grid and substation security requirements including NERC (North American Electric Reliability Corporati
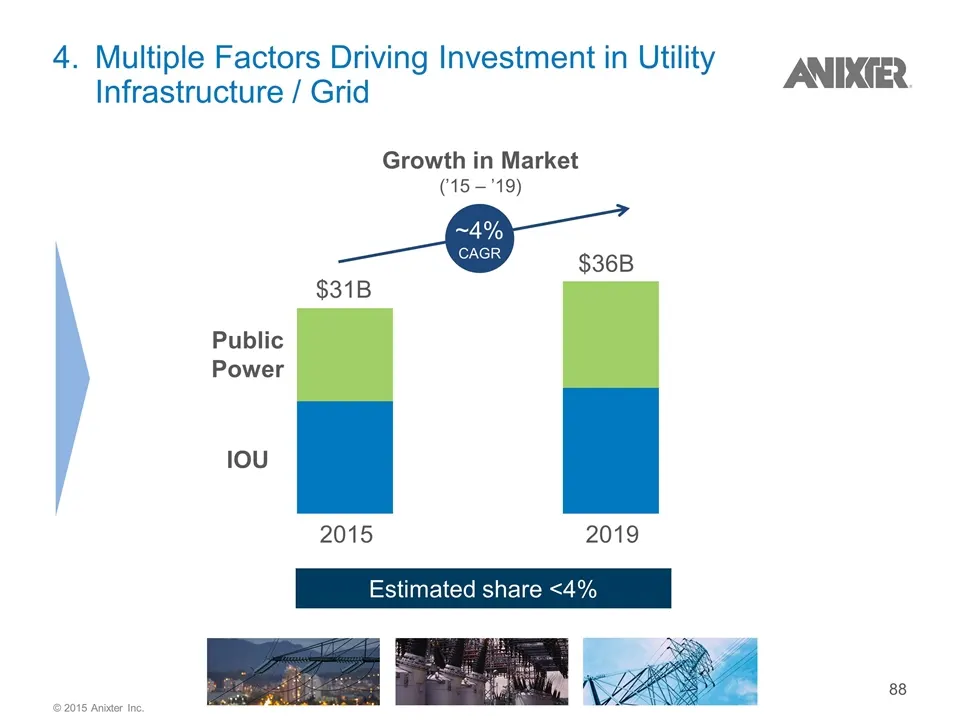
Slide 88: Multiple Factors Driving Investment in Utility Infrastructure / Grid
4. Multiple Factors Driving Investment in Utility Infrastructure / Grid $36B 2015 2019 IOU Public Power $31B Growth in Market (’15 – ’19) Estimated share <4% ~4% CAGR © 2015 Anixter Inc.
Slide 89: Agenda
Agenda Key Strengths Why We Win Utility Power Solutions Overview Growth Strategy © 2015 Anixter Inc.
Slide 90: Proven Execution of High Value Services for Utility Customers
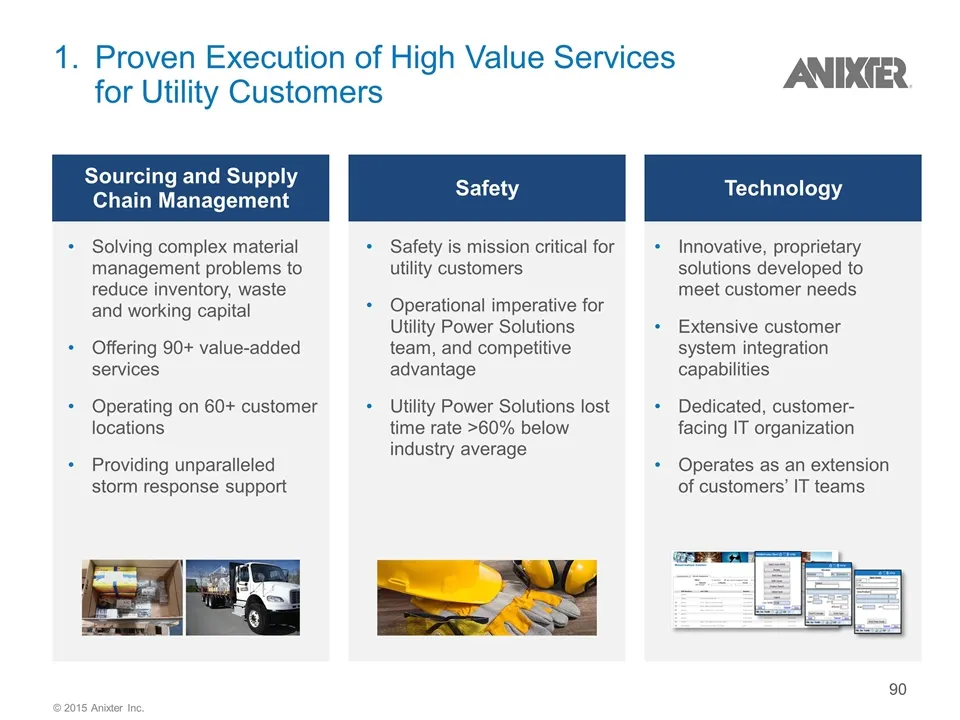
Safety Technology 1. Proven Execution of High Value Services for Utility Customers Sourcing and Supply Chain Management Solving complex material management problems to reduce inventory, waste and working capital Offering 90+ value-added services Operating on 60+ customer locations Providing unparall
Slide 91: Legacy Utility Power Solutions Footprint
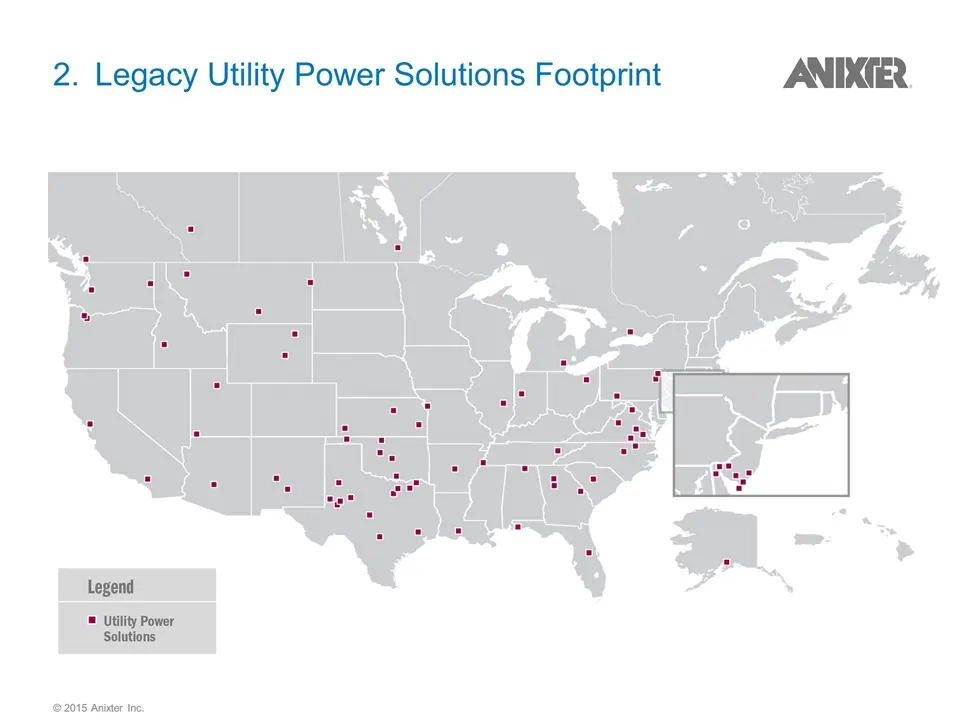
2. Legacy Utility Power Solutions Footprint © 2015 Anixter Inc.
Slide 92: Expanded Geographic Footprint when Combined with Legacy Anixter
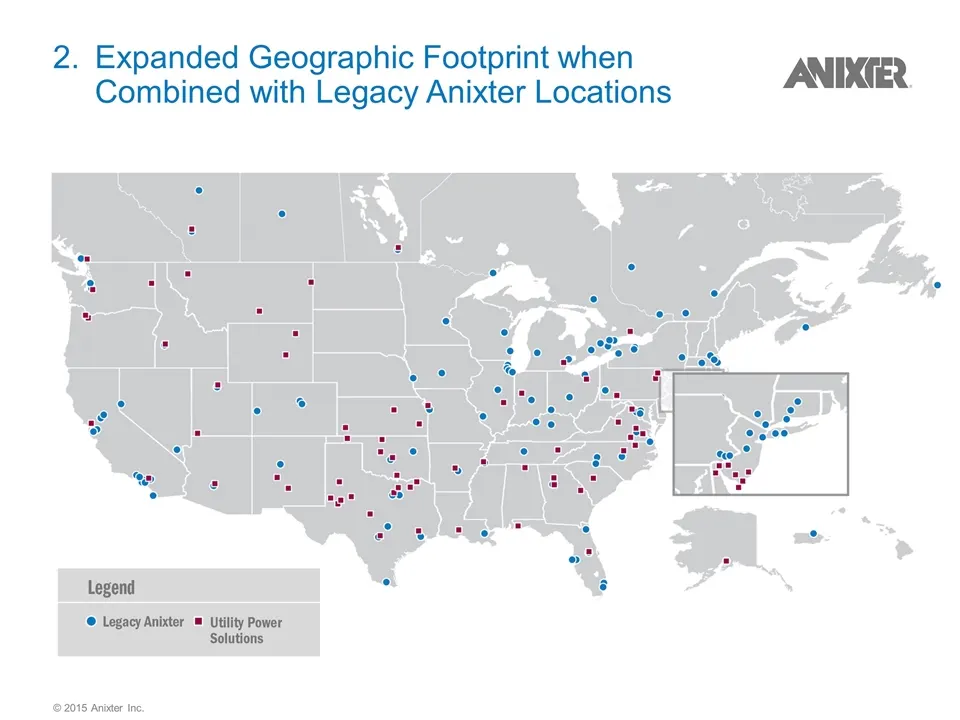
2. Expanded Geographic Footprint when Combined with Legacy Anixter Locations © 2015 Anixter Inc.
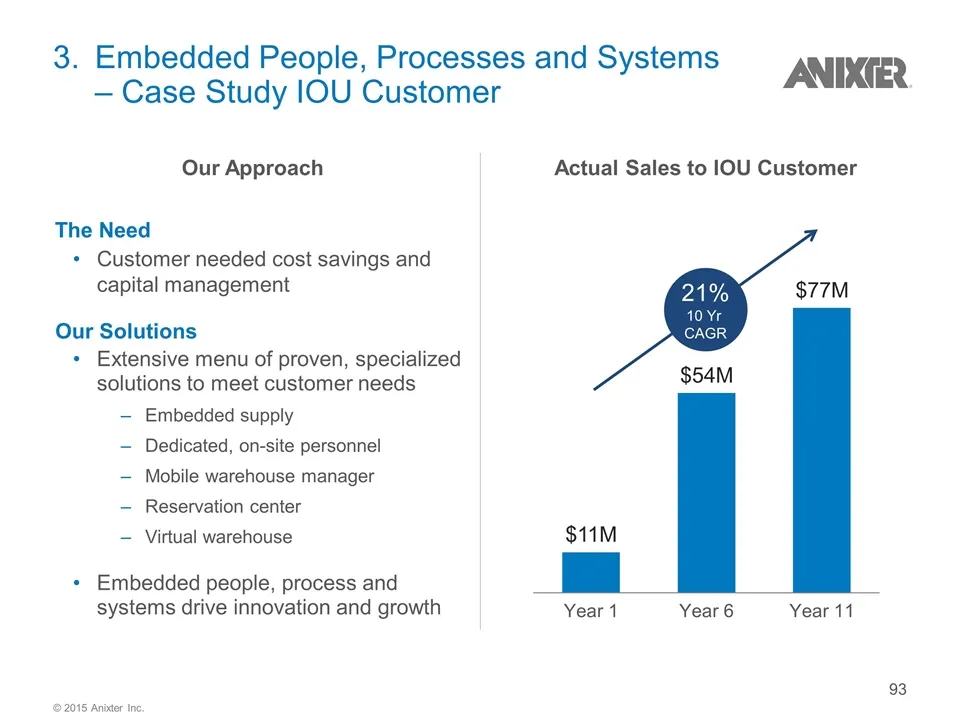
Slide 93: Embedded People, Processes and Systems – Case Study
3. Embedded People, Processes and Systems – Case Study IOU Customer Extensive menu of proven, specialized solutions to meet customer needs Embedded supply Dedicated, on-site personnel Mobile warehouse manager Reservation center Virtual warehouse Actual Sales to IOU Customer Embedded people, process
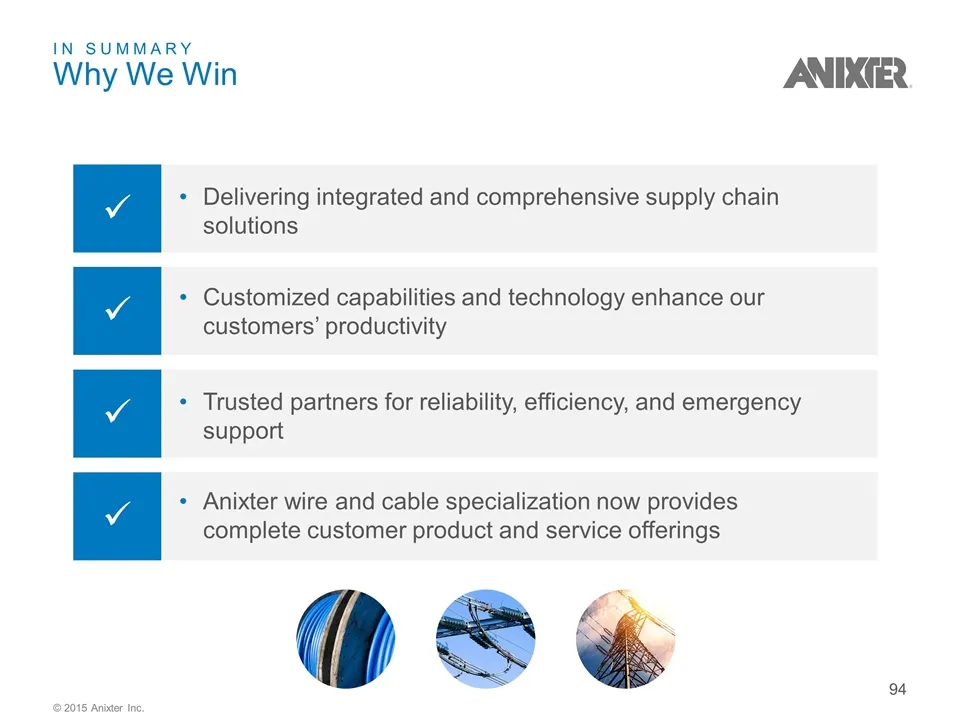
Slide 94: In Summary: Why We Win
IN SUMMARY Why We Win Delivering integrated and comprehensive supply chain solutions Customized capabilities and technology enhance our customers’ productivity Anixter wire and cable specialization now provides complete customer product and service offerings Trusted partners for reliability, efficie
Slide 95: Agenda
Agenda Key Strengths Why We Win Utility Power Solutions Overview Growth Strategy © 2015 Anixter Inc.
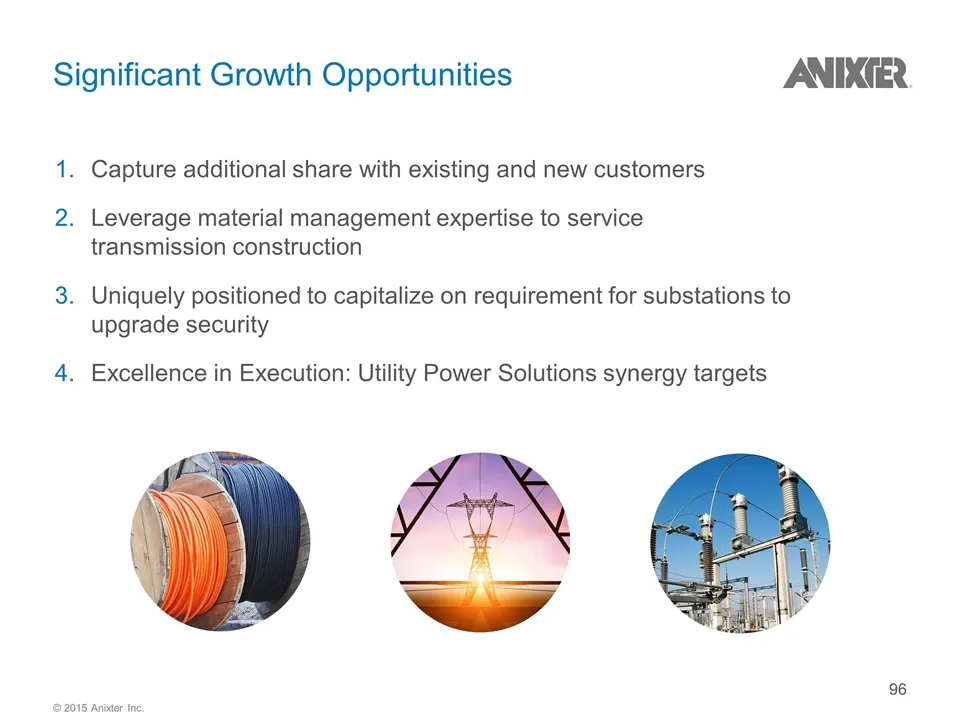
Slide 96: Significant Growth Opportunities
Significant Growth Opportunities Capture additional share with existing and new customers Leverage material management expertise to service transmission construction Uniquely positioned to capitalize on requirement for substations to upgrade security Excellence in Execution: Utility Power Solutions
Slide 97: Capture Additional Share with Existing and New Customers
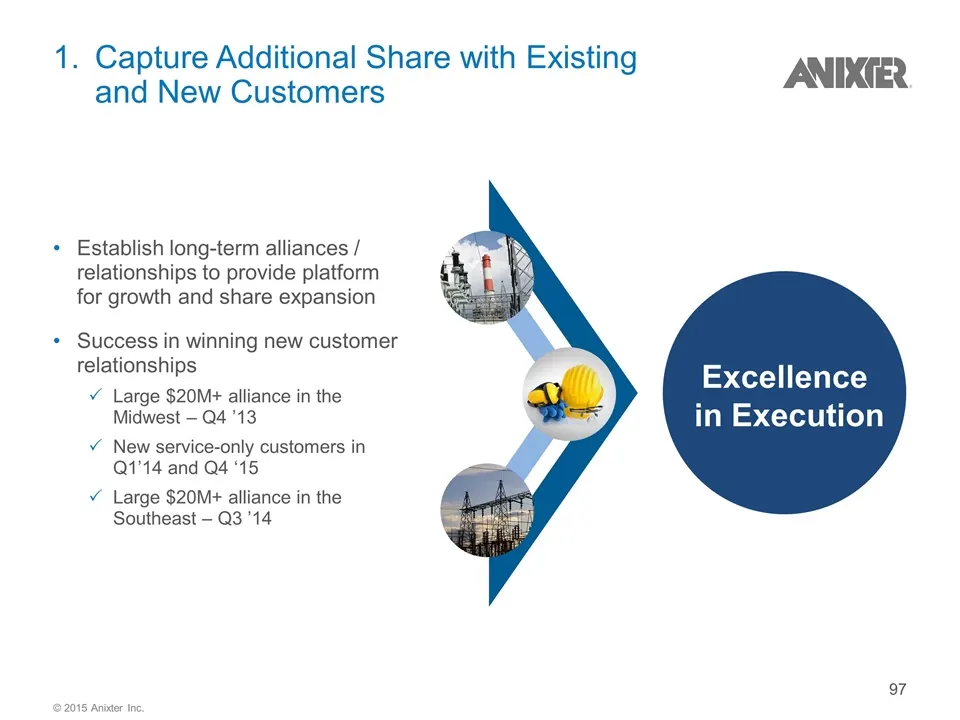
1. Capture Additional Share with Existing and New Customers Establish long-term alliances / relationships to provide platform for growth and share expansion Success in winning new customer relationships Large $20M+ alliance in the Midwest – Q4 ’13 New service-only customers in Q1’14 and Q4 ‘15 Large
Slide 98: Leverage Material Management Expertise to Service Transmission Construction
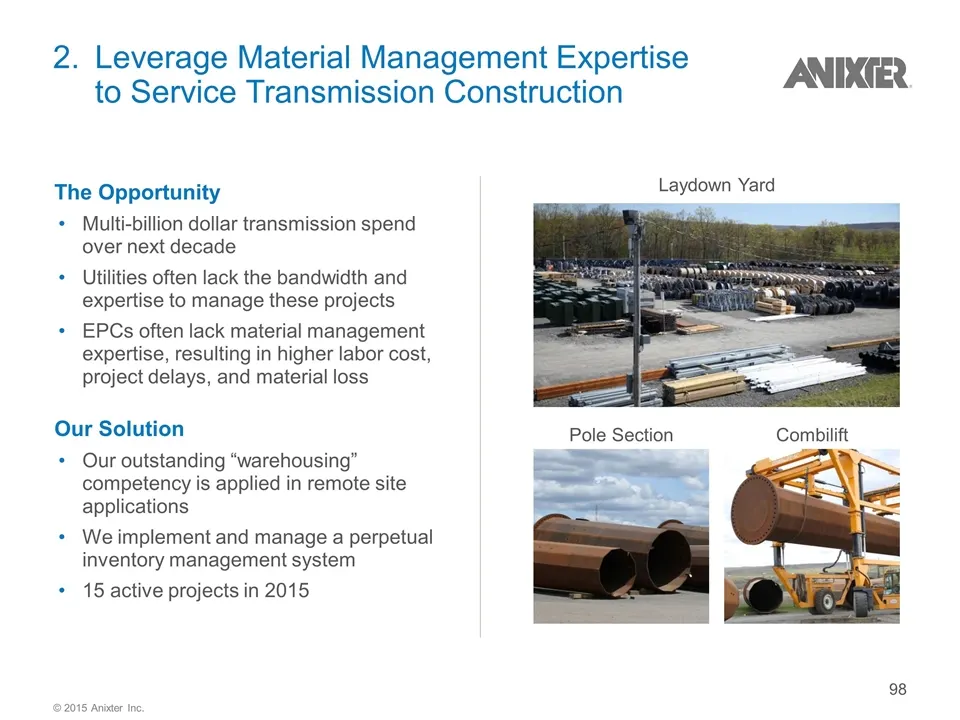
2. Leverage Material Management Expertise to Service Transmission Construction Laydown Yard Our outstanding “warehousing” competency is applied in remote site applications We implement and manage a perpetual inventory management system 15 active projects in 2015 The Opportunity Combilift Our Solutio
Slide 99: Positioned to Capitalize on Requirement for Substations to Upgrade Security
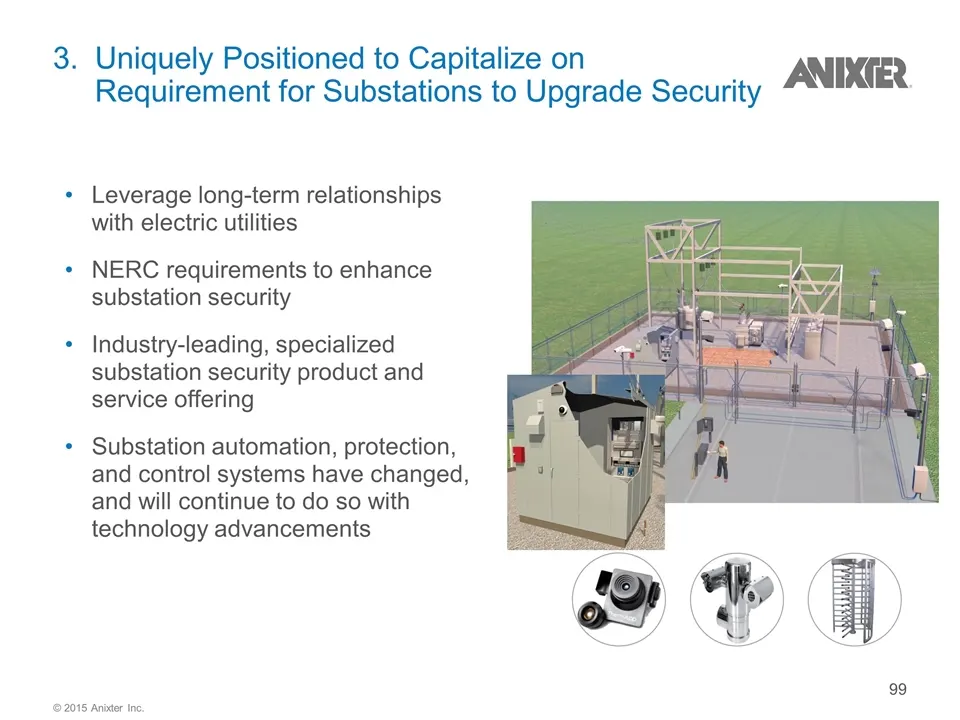
3. Uniquely Positioned to Capitalize on Requirement for Substations to Upgrade Security Leverage long-term relationships with electric utilities NERC requirements to enhance substation security Industry-leading, specialized substation security product and service offering Substation automation, prot
Slide 100: Excellence in Execution: Delivering Utility Power Solutions Synergy Targets
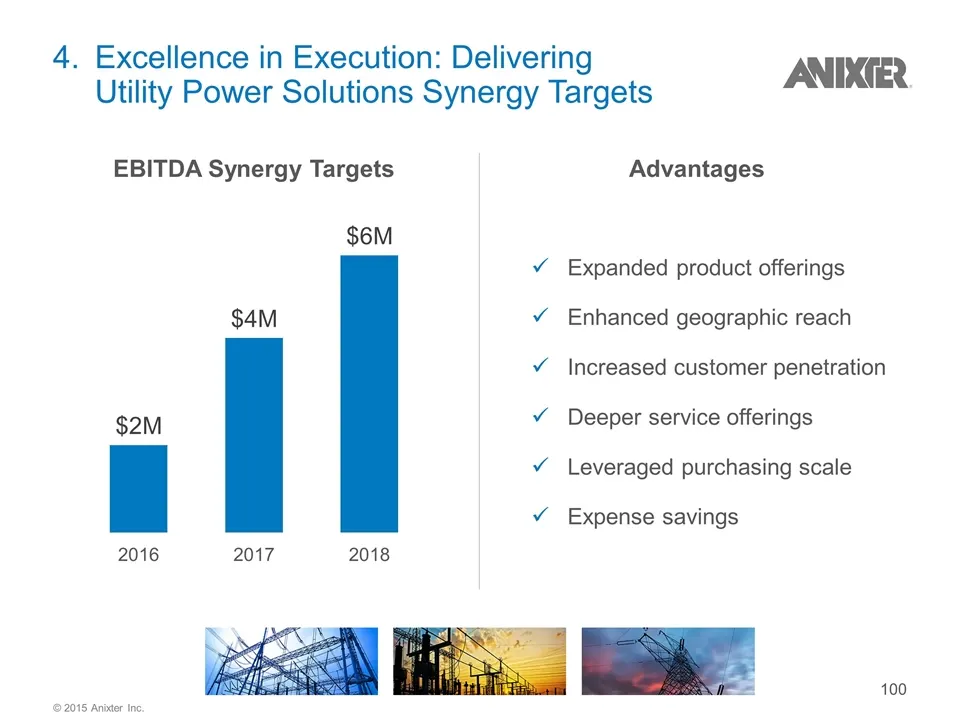
4. Excellence in Execution: Delivering Utility Power Solutions Synergy Targets 100 EBITDA Synergy Targets Expanded product offerings Enhanced geographic reach Increased customer penetration Deeper service offerings Leveraged purchasing scale Expense savings Advantages © 2015 Anixter Inc.
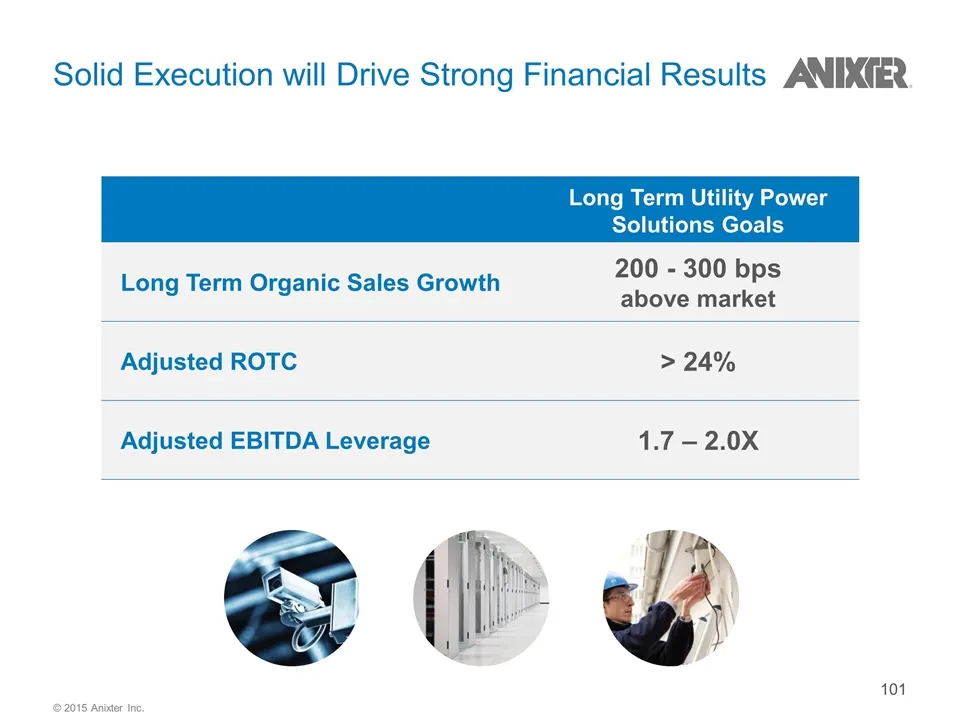
Slide 101: Long Term Utility Power Solutions Goals
Solid Execution will Drive Strong Financial Results 101 Long Term Utility Power Solutions Goals Long Term Organic Sales Growth 200 - 300 bps above market Adjusted ROTC > 24% Adjusted EBITDA Leverage 1.7 – 2.0X © 2015 Anixter Inc.
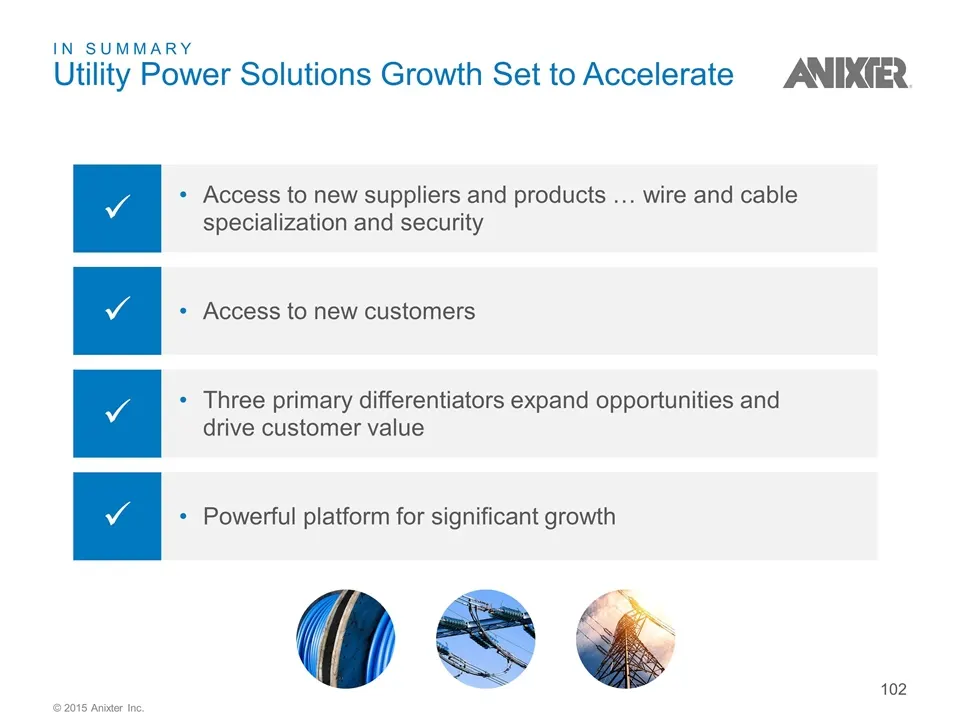
Slide 102: In Summary: Utility Power Solutions Growth Set to Accelerate
IN SUMMARY Utility Power Solutions Growth Set to Accelerate 102 Access to new suppliers and products … wire and cable specialization and security Access to new customers Powerful platform for significant growth Three primary differentiators expand opportunities and drive customer value ü ü ü ü © 201
Slide 103: Ted Dosch, EVP, Finance and CFO
Anixter Investor Day 2015 Ted Dosch EVP, Finance and CFO
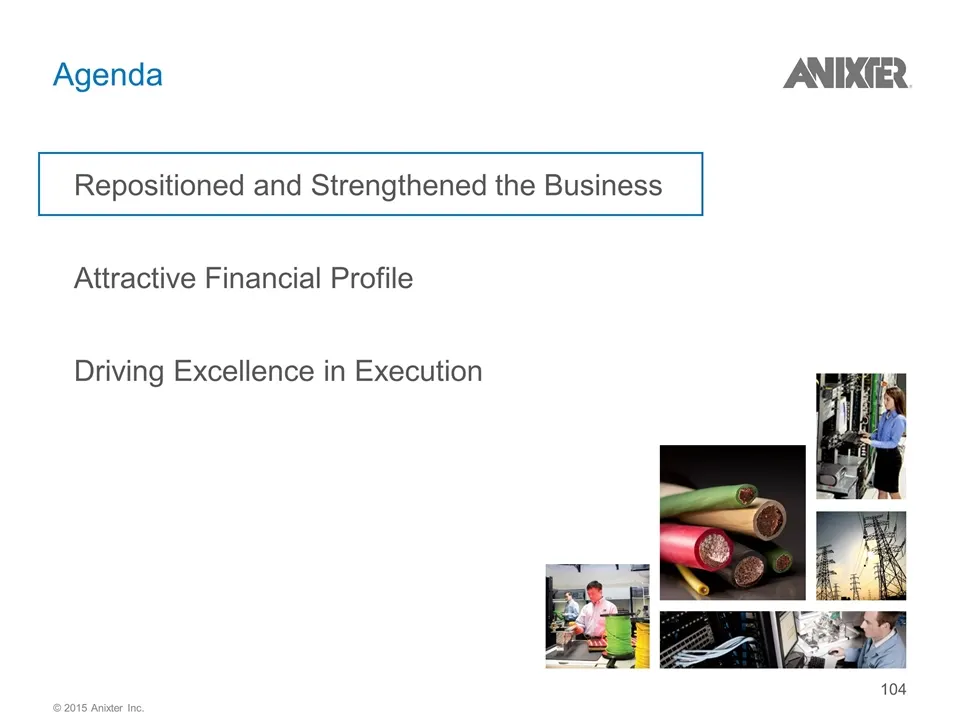
Slide 104: Agenda
Agenda 104 Driving Excellence in Execution Repositioned and Strengthened the Business Attractive Financial Profile © 2015 Anixter Inc.
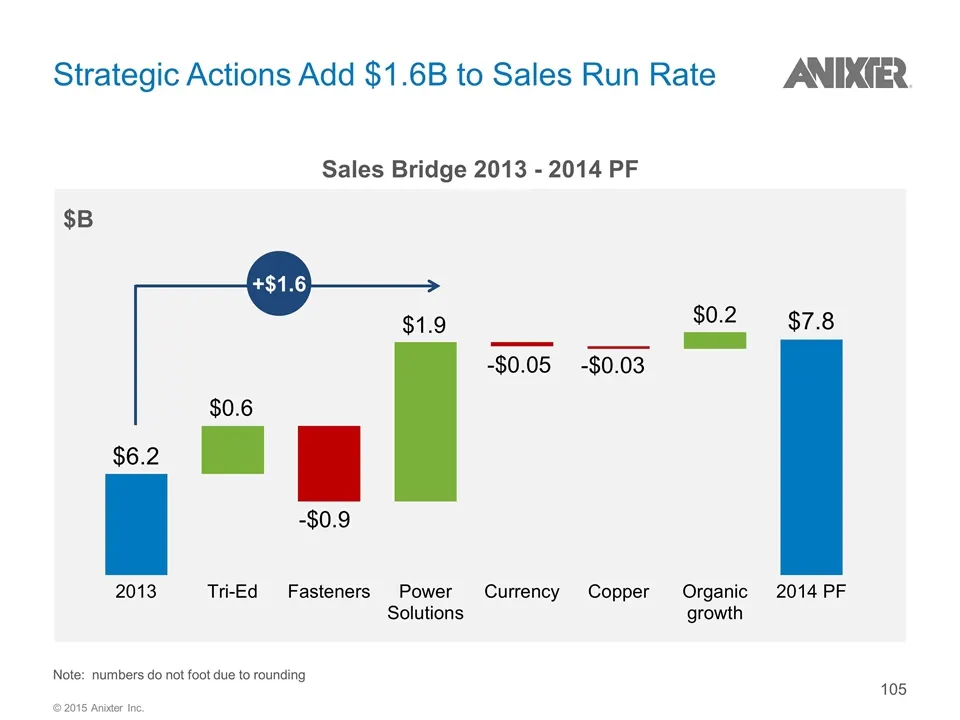
Slide 105: Strategic Actions Add $1.6B to Sales Run Rate
Strategic Actions Add $1.6B to Sales Run Rate 105 Sales Bridge 2013 - 2014 PF $B Note: numbers do not foot due to rounding +$1.6 © 2015 Anixter Inc.
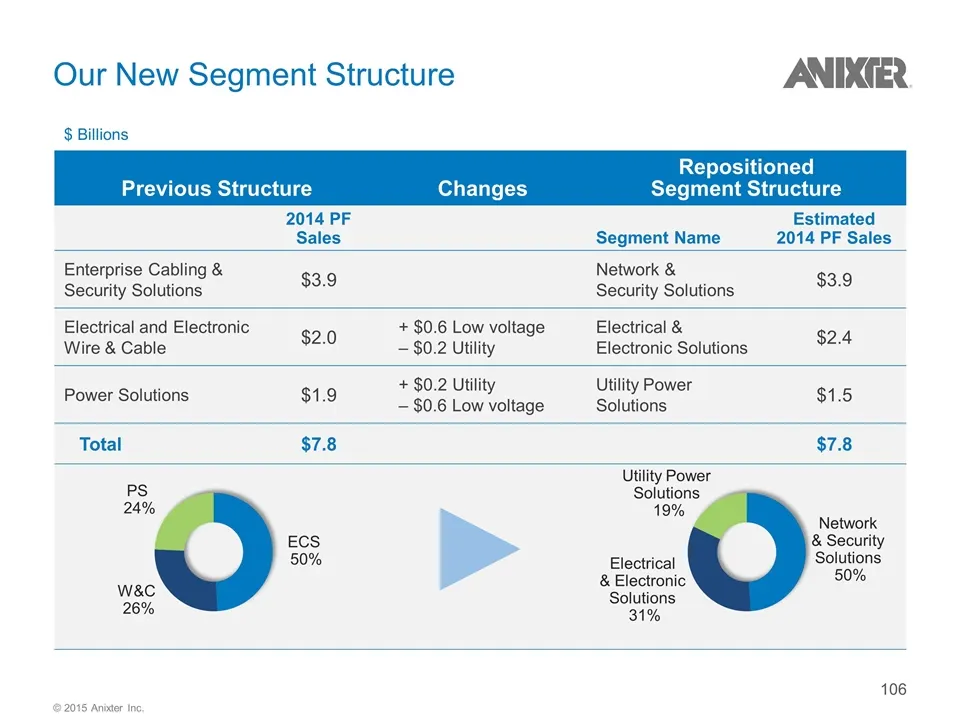
Slide 106: Our New Segment Structure
Our New Segment Structure Previous Structure Changes Repositioned Segment Structure 2014 PF Sales Segment Name Estimated 2014 PF Sales Enterprise Cabling & Security Solutions $3.9 Network & Security Solutions $3.9 Electrical and Electronic Wire & Cable $2.0 + $0.6 Low voltage – $0.2 Utility Electric
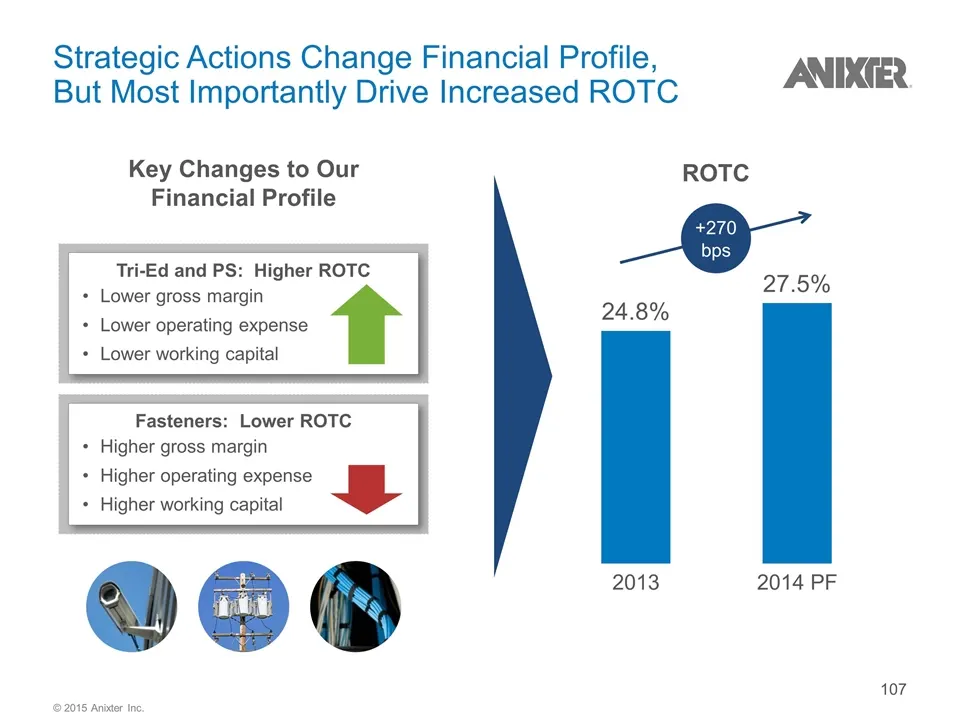
Slide 107: Strategic Actions Change Financial Profile, Drive Increased ROTC
Strategic Actions Change Financial Profile, But Most Importantly Drive Increased ROTC 107 ROTC Tri-Ed and PS: Higher ROTC Lower gross margin Lower operating expense Lower working capital Key Changes to Our Financial Profile Fasteners: Lower ROTC Higher gross margin Higher operating expense Higher wo
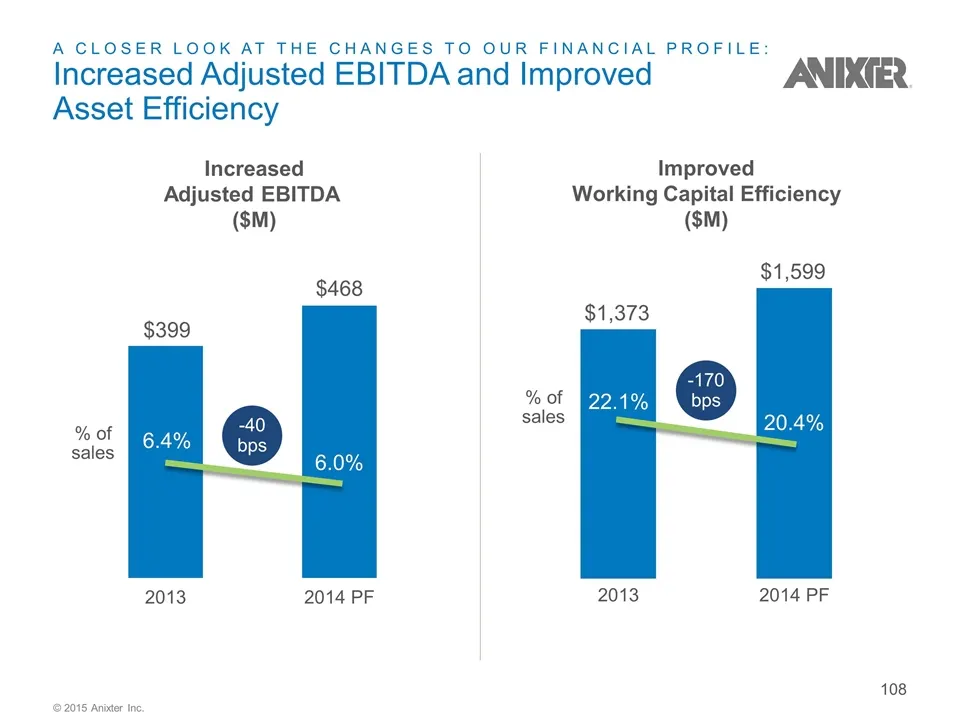
Slide 108: A Closer Look at the Changes to Our Financial Profile
A CLOSER LOOK AT THE CHANGES TO OUR FINANCIAL PROFILE: Increased Adjusted EBITDA and Improved Asset Efficiency Improved Working Capital Efficiency ($M) Increased Adjusted EBITDA ($M) 6.4% 6.0% % of sales 20.4% 22.1% -170 bps % of sales 108 -40 bps © 2015 Anixter Inc.
Slide 109: Strategic Actions Create Synergy and Accretion Opportunities
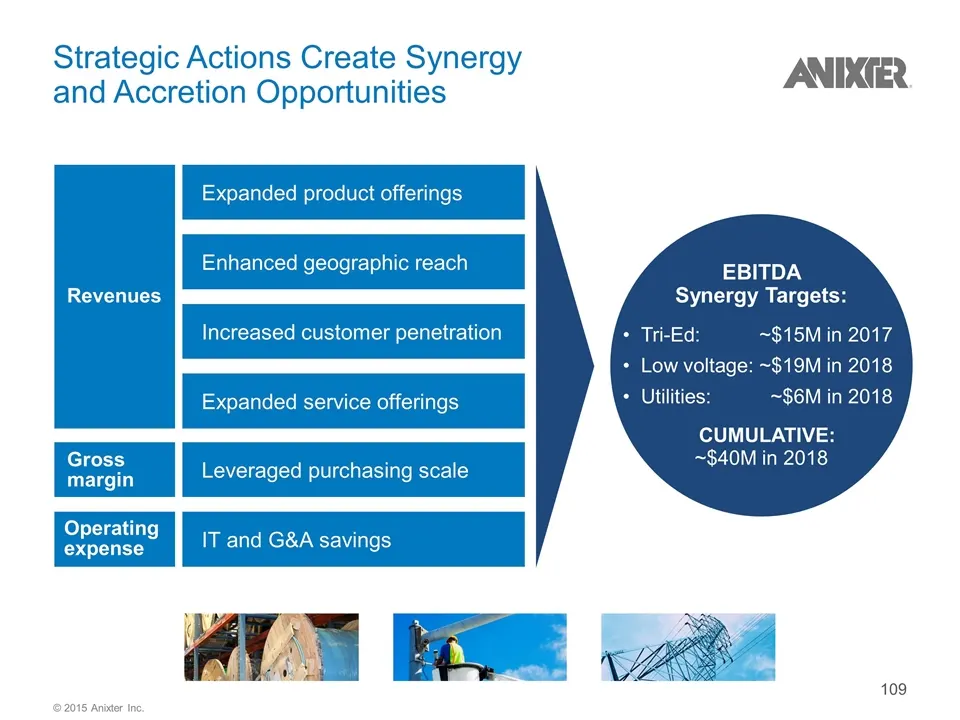
Enhanced geographic reach Increased customer penetration Leveraged purchasing scale IT and G&A savings Expanded service offerings Expanded product offerings Strategic Actions Create Synergy and Accretion Opportunities Revenues Gross margin Operating expense 109 EBITDA Synergy Targets: Tri-Ed: ~$15M
Slide 110: Agenda
Agenda 110 Driving Excellence in Execution Repositioned and Strengthened the Business Attractive Financial Profile © 2015 Anixter Inc.
Slide 111: Attractive Financial Profile
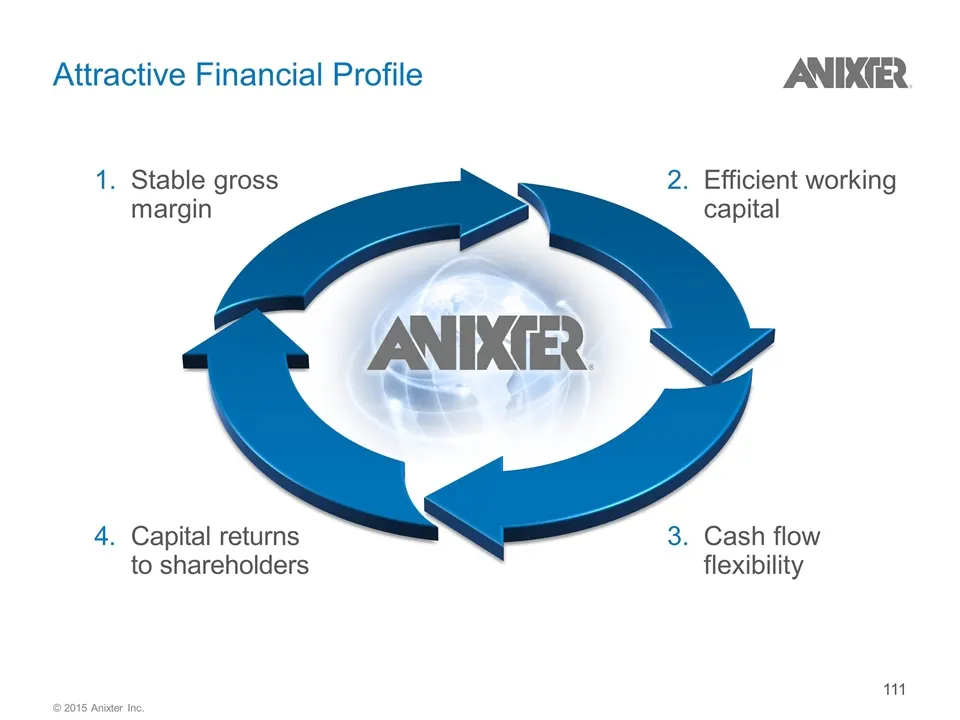
Attractive Financial Profile 2. Efficient working capital 1. Stable gross margin 4. Capital returns to shareholders 3. Cash flow flexibility 111 © 2015 Anixter Inc.
Slide 112: Stable Gross Margin Despite Copper Cost Volatility
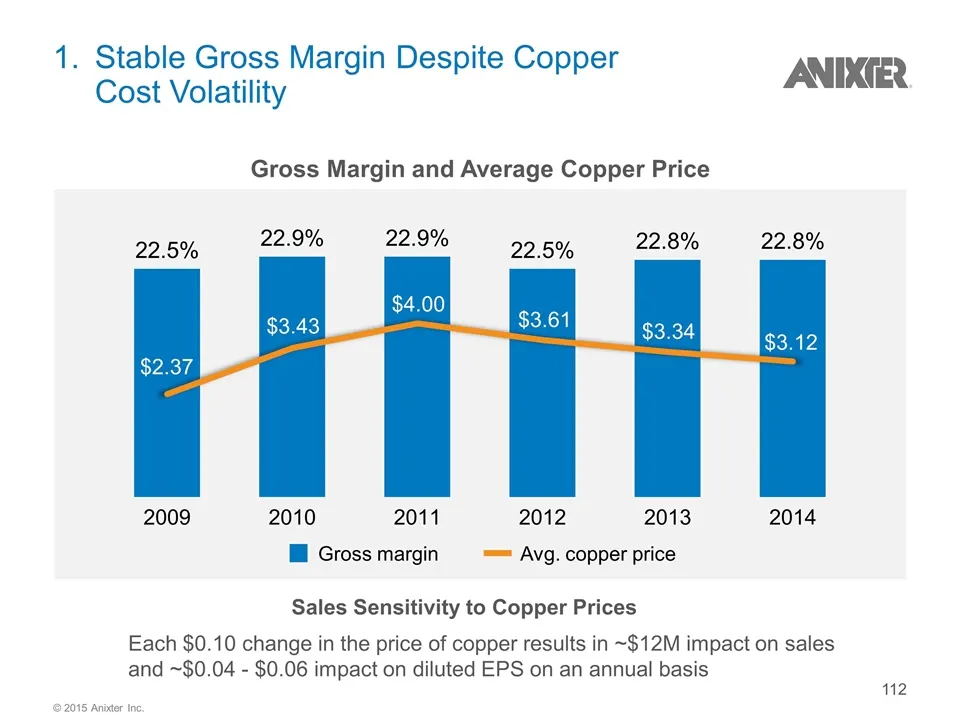
1.Stable Gross Margin Despite Copper Cost Volatility Gross Margin and Average Copper Price Each $0.10 change in the price of copper results in ~$12M impact on sales and ~$0.04 - $0.06 impact on diluted EPS on an annual basis Sales Sensitivity to Copper Prices Avg. copper price Gross margin © 2015 An
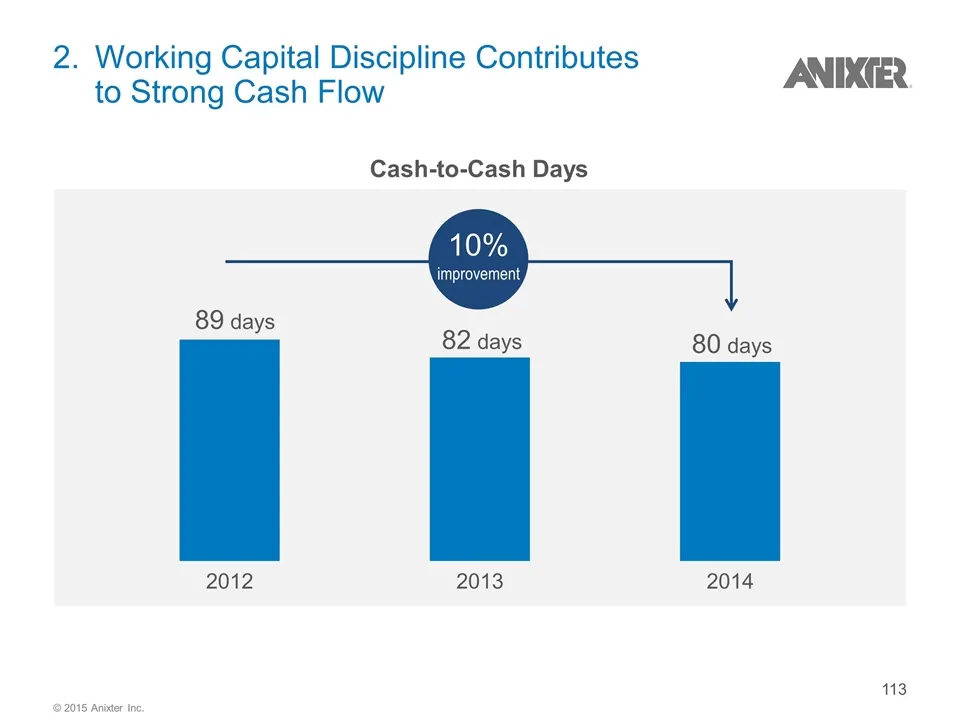
Slide 113: Working Capital Discipline Contributes to Strong Cash Flow
2. Working Capital Discipline Contributes to Strong Cash Flow Cash-to-Cash Days 89 days 82 days 80 days 10% improvement © 2015 Anixter Inc.
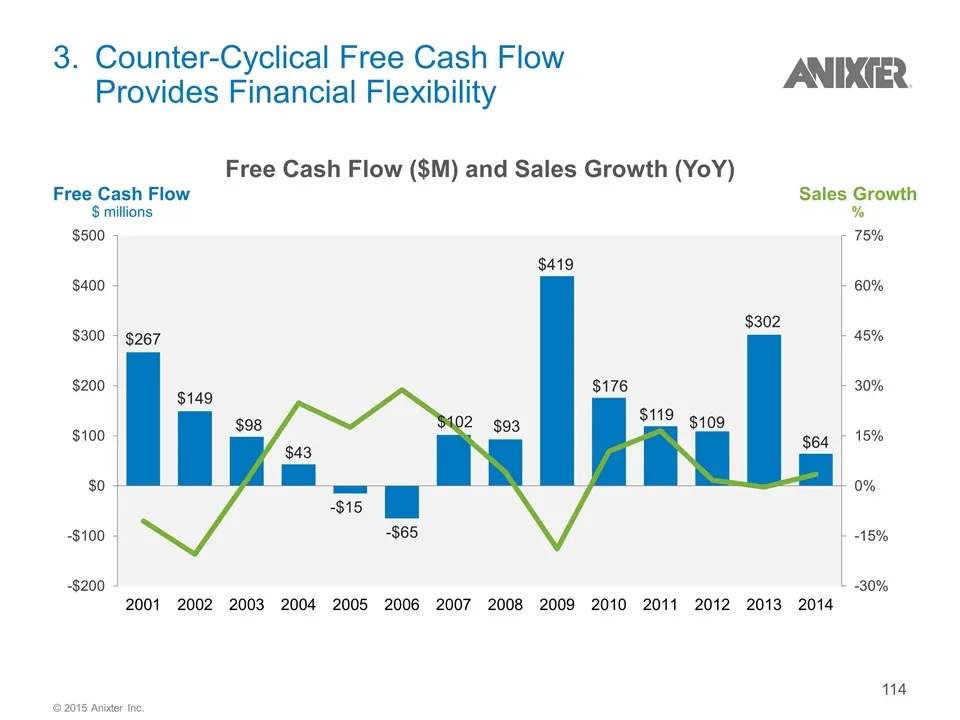
Slide 114: Counter-Cyclical Free Cash Flow Provides Financial Flexibility
3. Counter-Cyclical Free Cash Flow Provides Financial Flexibility Free Cash Flow ($M) and Sales Growth (YoY) (20.5)% YOY % (10.5)% 1.7% 24.9% 17.6% 28.8% 17.7% 4.1% (18.9)% 10.4% 16.5% 1.7% (0.4)% 3.5% Free Cash Flow $ millions Sales Growth % © 2015 Anixter Inc.
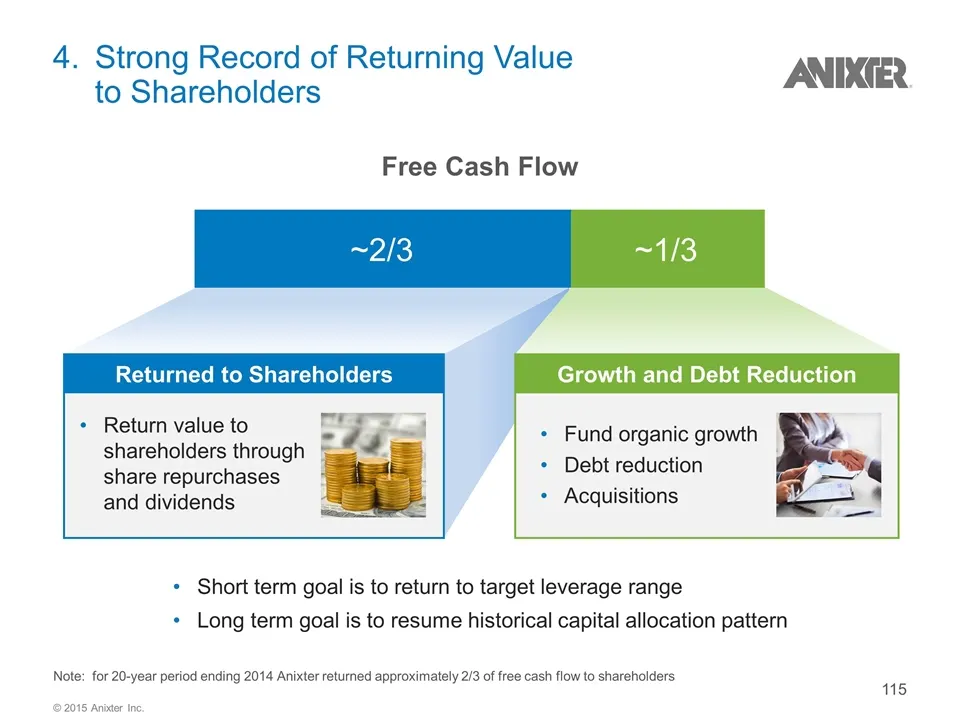
Slide 115: Strong Record of Returning Value to Shareholders
Free Cash Flow 4. Strong Record of Returning Value to Shareholders Growth and Debt Reduction Returned to Shareholders Fund organic growth Debt reduction Acquisitions Return value to shareholders through share repurchases and dividends Short term goal is to return to target leverage range Long term g
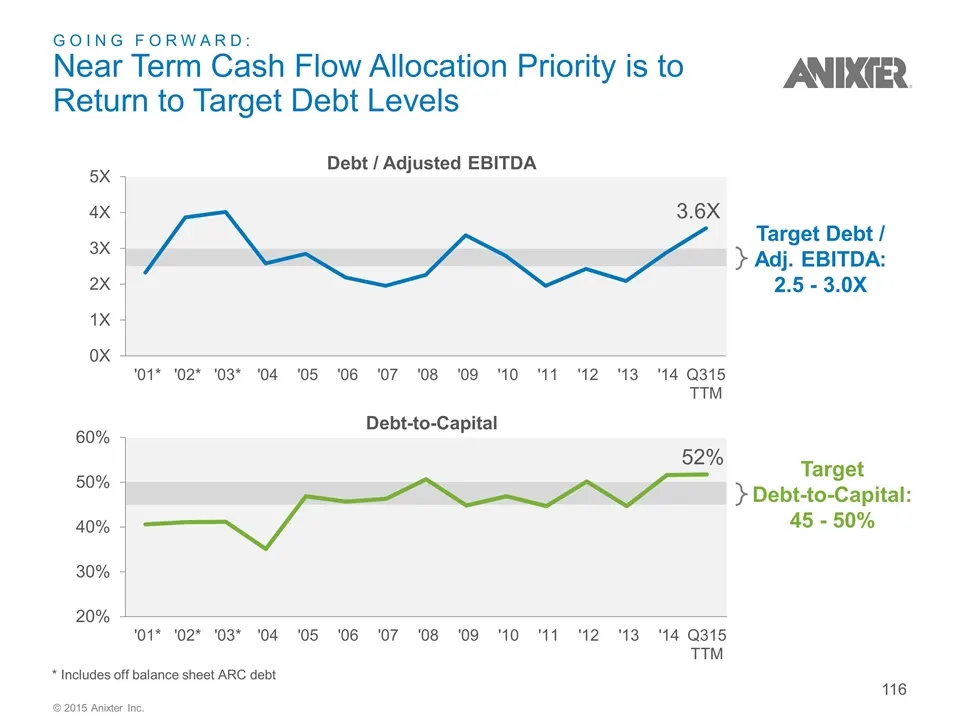
Slide 116: Near Term Cash Flow Allocation Priority is to Return to Target Debt Levels
GOING FORWARD: Near Term Cash Flow Allocation Priority is to Return to Target Debt Levels Target Debt-to-Capital: 45 - 50% Target Debt / Adj. EBITDA: 2.5 - 3.0X Debt / Adjusted EBITDA Debt-to-Capital 3.6X 52% * Includes off balance sheet ARC debt © 2015 Anixter Inc.
Slide 117: Agenda
Agenda Driving Excellence in Execution Repositioned and Strengthened the Business Attractive Financial Profile © 2015 Anixter Inc.
Slide 118: Driving Excellence in Execution – Our Priorities
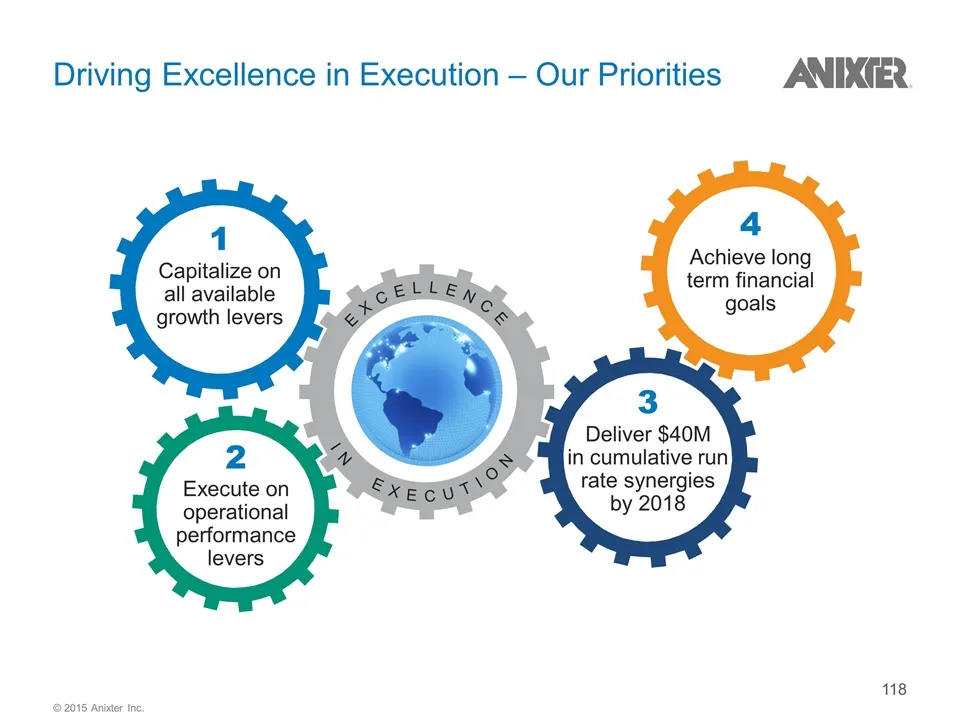
Driving Excellence in Execution – Our Priorities Capitalize on all available growth levers Deliver $40M in cumulative run rate synergies by 2018 Achieve long term financial goals EXCELLENCE IN EXECUTION Execute on operational performance levers 1 2 3 4 © 2015 Anixter Inc.
Slide 119: Capitalize on Multiple Long Term Revenue Growth Opportunities
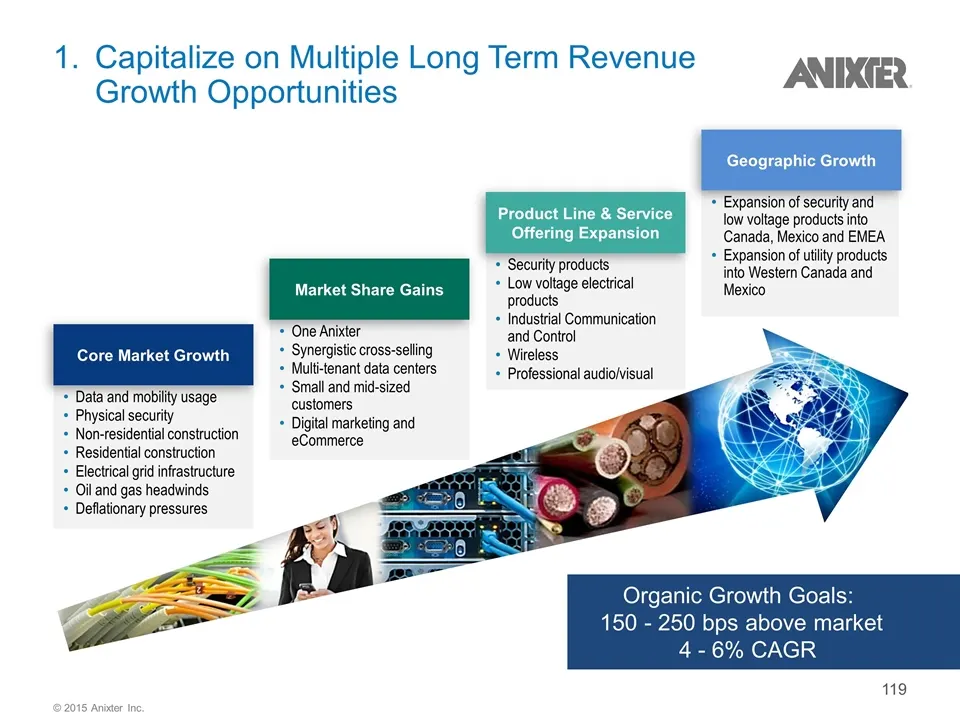
1.Capitalize on Multiple Long Term Revenue Growth Opportunities Security products Low voltage electrical products Industrial Communication and Control Wireless Professional audio/visual Data and mobility usage Physical security Non-residential construction Residential construction Electrical grid in
Slide 120: Execute on Operational Performance Levers
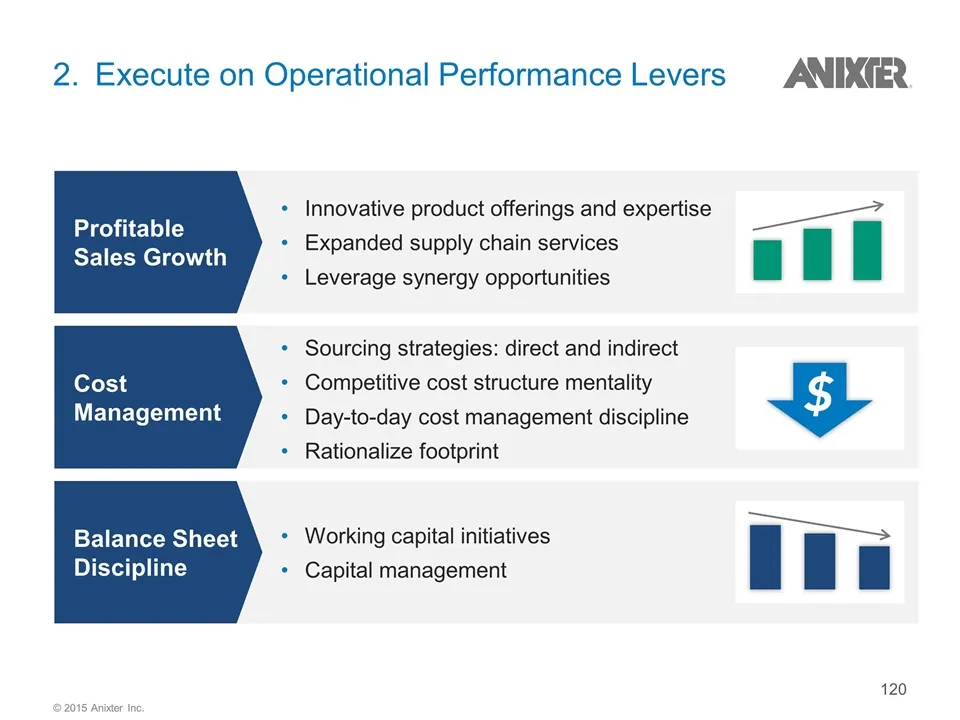
Balance Sheet Discipline 2. Execute on Operational Performance Levers Profitable Sales Growth Cost Management Innovative product offerings and expertise Expanded supply chain services Leverage synergy opportunities Sourcing strategies: direct and indirect Competitive cost structure mentality Day-to-
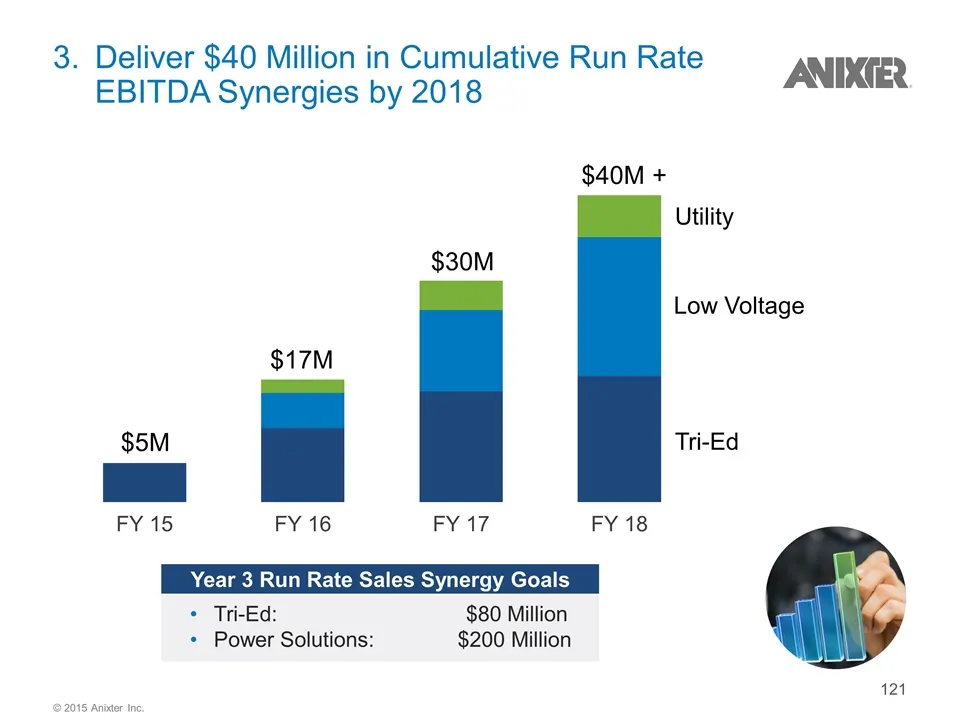
Slide 121: Deliver $40 Million in Cumulative Run Rate EBITDA Synergies by 2018
3.Deliver $40 Million in Cumulative Run Rate EBITDA Synergies by 2018 Tri-Ed Low Voltage Utility $40M + $30M $17M $5M Tri-Ed: $80 Million Power Solutions: $200 Million Year 3 Run Rate Sales Synergy Goals © 2015 Anixter Inc.
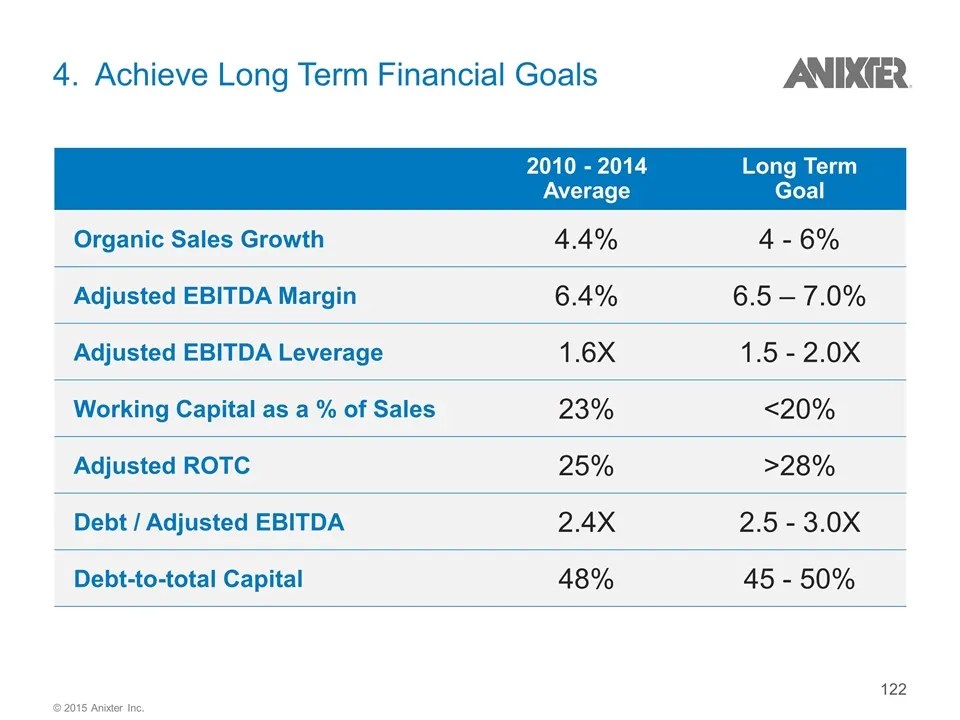
Slide 122: Achieve Long Term Financial Goals
4. Achieve Long Term Financial Goals 2010 - 2014 Average Long Term Goal Organic Sales Growth 4.4% 4 - 6% Adjusted EBITDA Margin 6.4% 6.5 – 7.0% Adjusted EBITDA Leverage 1.6X 1.5 - 2.0X Working Capital as a % of Sales 23% <20% Adjusted ROTC 25% >28% Debt / Adjusted EBITDA 2.4X 2.5 - 3.0X Debt-to-tota
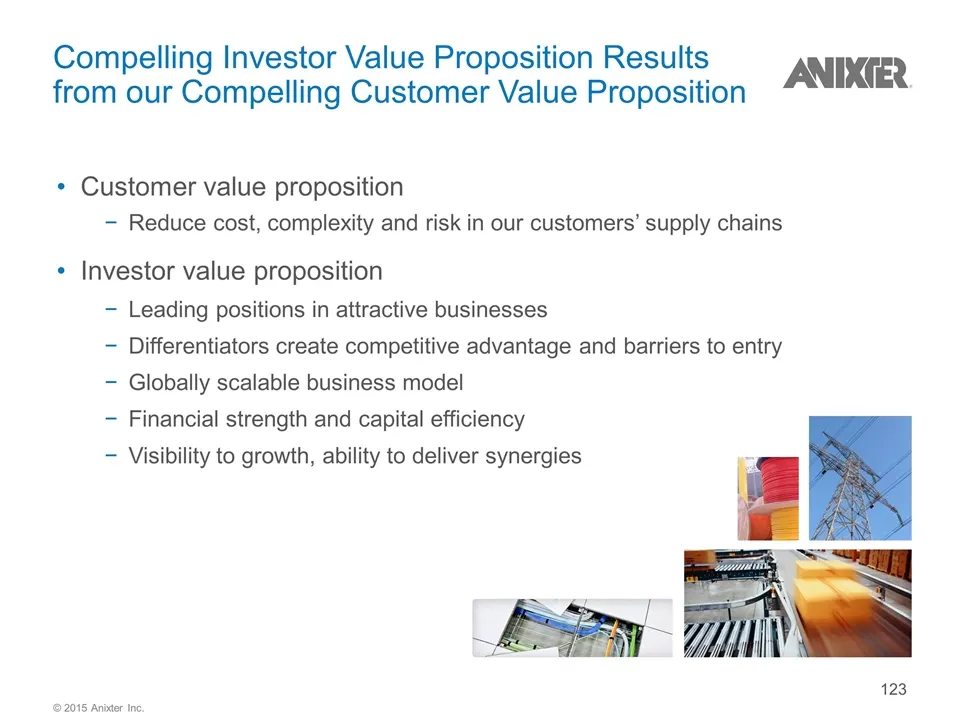
Slide 123: Compelling Investor Value Proposition
Compelling Investor Value Proposition Results from our Compelling Customer Value Proposition Customer value proposition Reduce cost, complexity and risk in our customers’ supply chains Investor value proposition Leading positions in attractive businesses Differentiators create competitive advantage
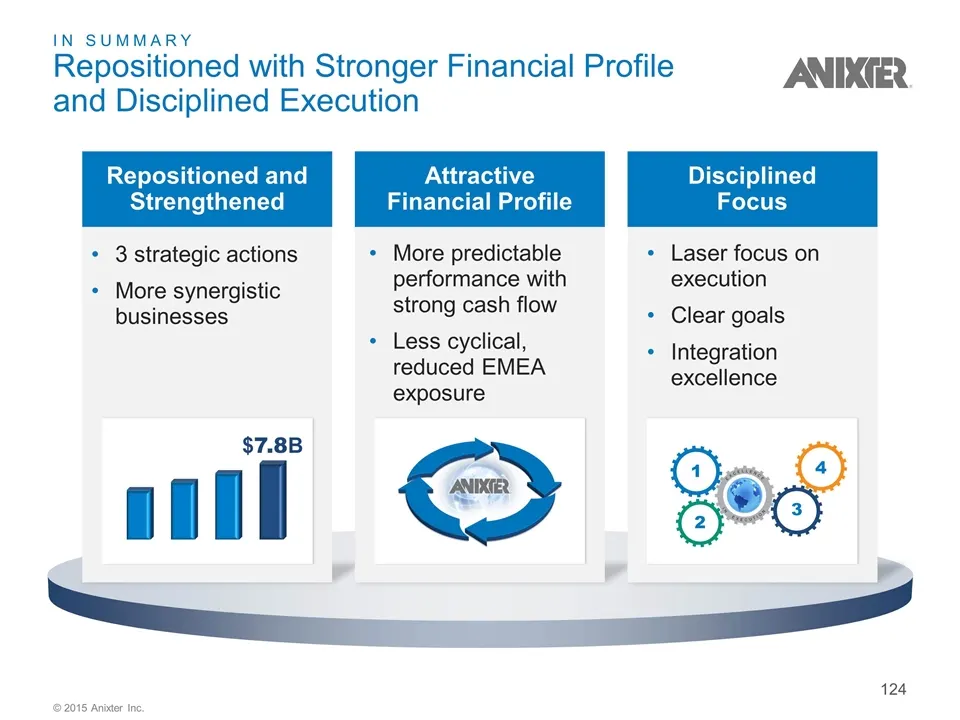
Slide 124: In Summary: Repositioned with Stronger Financial Profile
IN SUMMARY Repositioned with Stronger Financial Profile and Disciplined Execution Repositioned and Strengthened Attractive Financial Profile Disciplined Focus 3 strategic actions More synergistic businesses More predictable performance with strong cash flow Less cyclical, reduced EMEA exposure Laser
Slide 125: Q&A
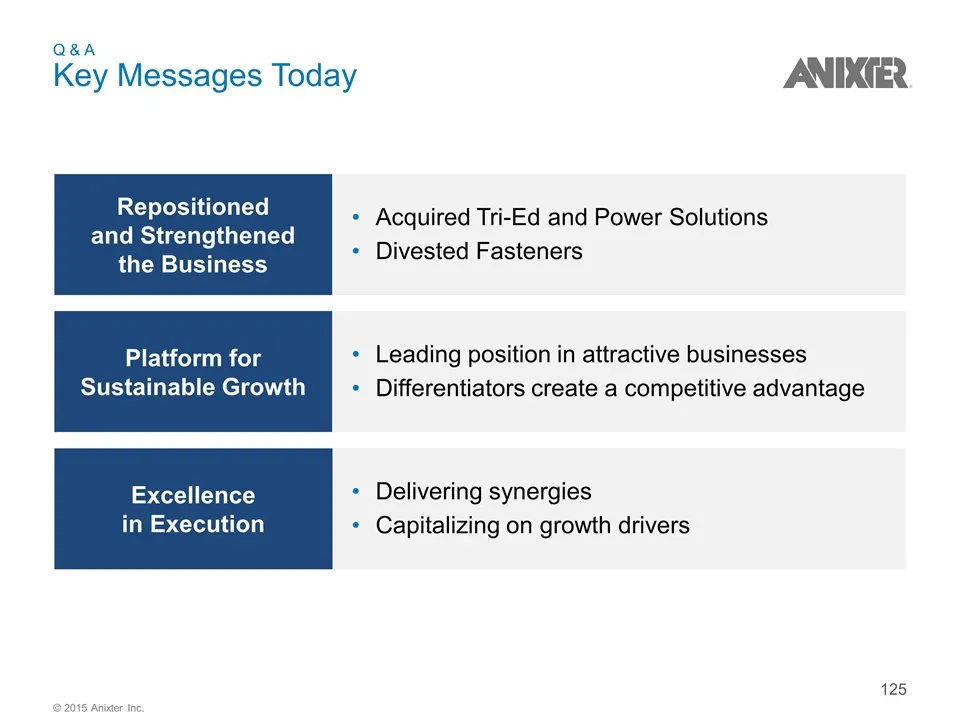
Q&A Key Messages Today Acquired Tri-Ed and Power Solutions Divested Fasteners Repositioned and Strengthened the Business Leading position in attractive businesses Differentiators create a competitive advantage Platform for Sustainable Growth Delivering synergies Capitalizing on growth drivers Excell
Slide 126: Appendix
Appendix
Slide 127: Appendix
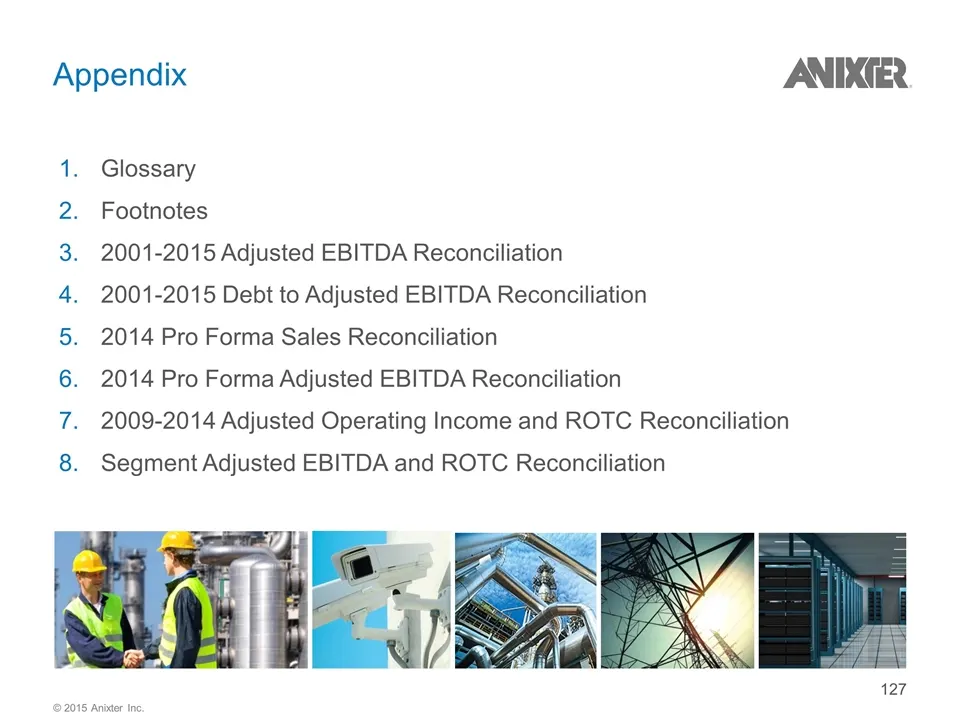
Appendix Glossary Footnotes 2001-2015 Adjusted EBITDA Reconciliation 2001-2015 Debt to Adjusted EBITDA Reconciliation 2014 Pro Forma Sales Reconciliation 2014 Pro Forma Adjusted EBITDA Reconciliation 2009-2014 Adjusted Operating Income and ROTC Reconciliation Segment Adjusted EBITDA and ROTC Reconci
Slide 128: Glossary
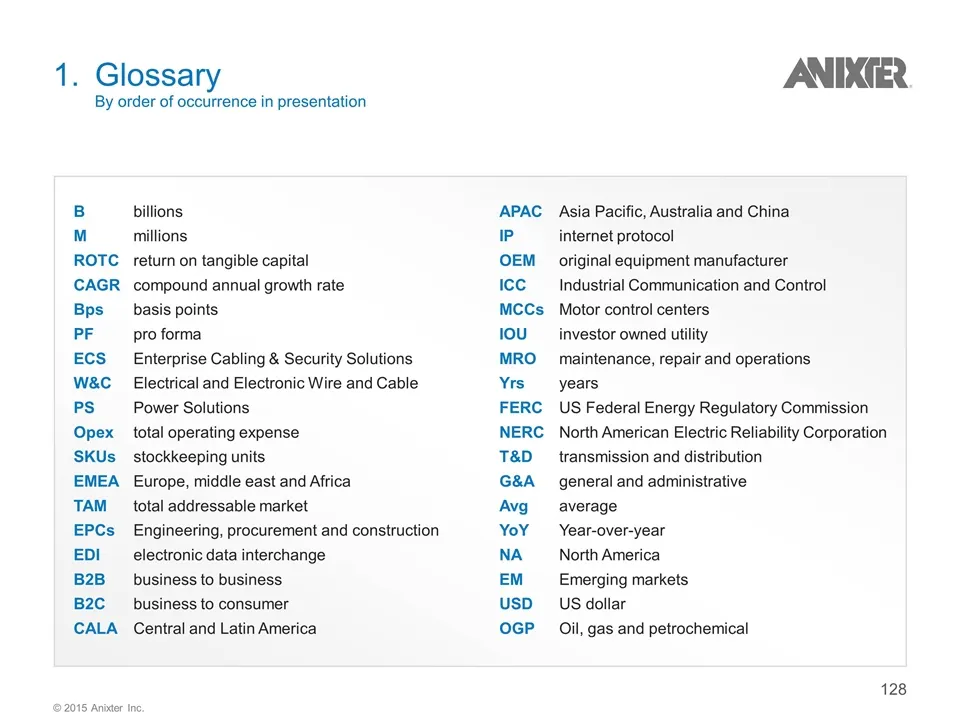
1. Glossary By order of occurrence in presentation B billions Mmillions ROTCreturn on tangible capital CAGRcompound annual growth rate Bpsbasis points PFpro forma ECSEnterprise Cabling & Security Solutions W&C Electrical and Electronic Wire and Cable PSPower Solutions Opex total operating expense SK
Slide 129: Footnotes
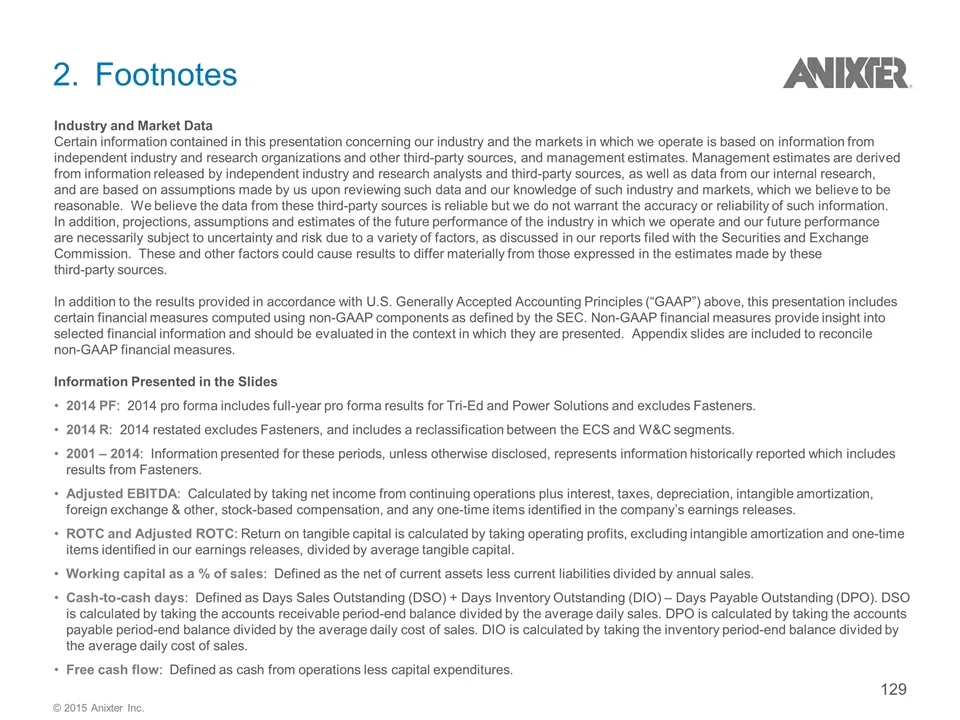
2. Footnotes Industry and Market Data Certain information contained in this presentation concerning our industry and the markets in which we operate is based on information from independent industry and research organizations and other third-party sources, and management estimates. Management estima
Slide 130: 2001-2015 Adjusted EBITDA Reconciliation
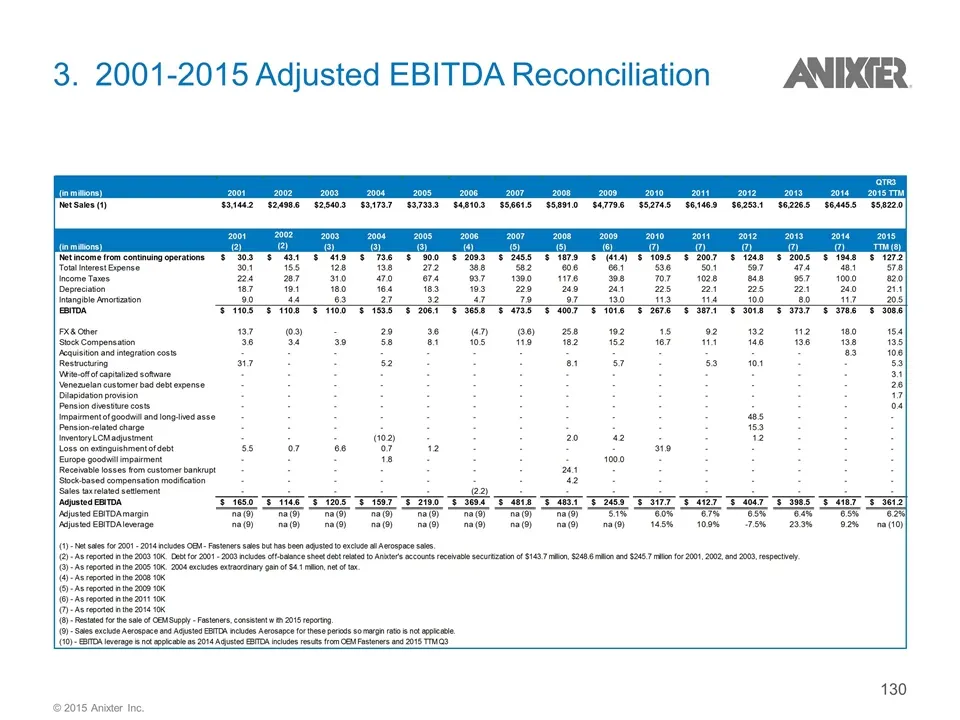
3.2001-2015 Adjusted EBITDA Reconciliation © 2015 Anixter Inc.
Slide 131: 2001–2015 Debt to Adjusted EBITDA Reconciliation
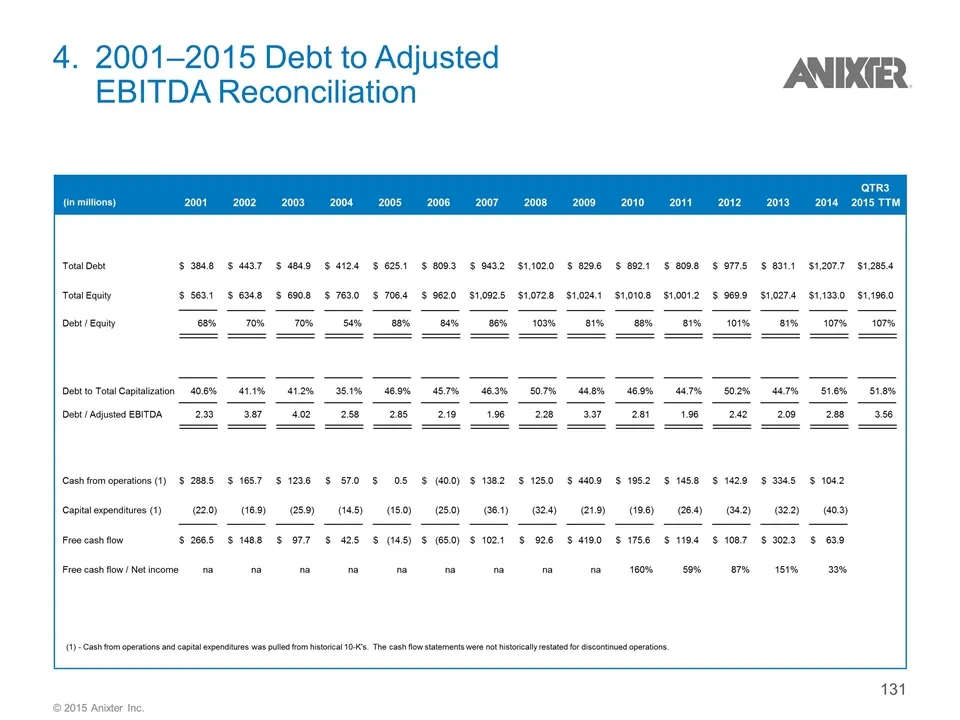
4. 2001–2015 Debt to Adjusted EBITDA Reconciliation (1) - Cash from operations and capital expenditures was pulled from historical 10-K's. The cash flow statements were not historically restated for discontinued operations. (in millions) 2001 2002 2003 2004 2005 2006 2007 2008 2009 2010 2011 2012 20
Slide 132: 2014 Pro Forma Sales Reconciliation
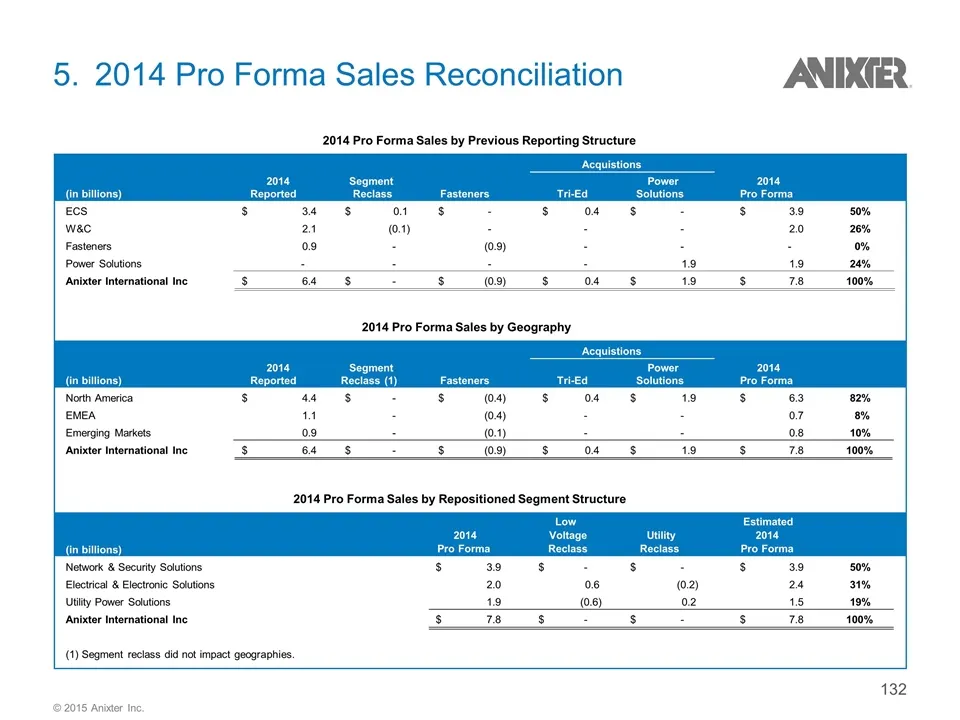
5. 2014 Pro Forma Sales Reconciliation 2014 Pro Forma Sales by Previous Reporting Structure (in billions) ECS W&C Fasteners Power Solutions Anixter International Inc (in billions) North America EMEA Emerging Markets Anixter International Inc (in billions) Network & Security Solutions Electrical & El
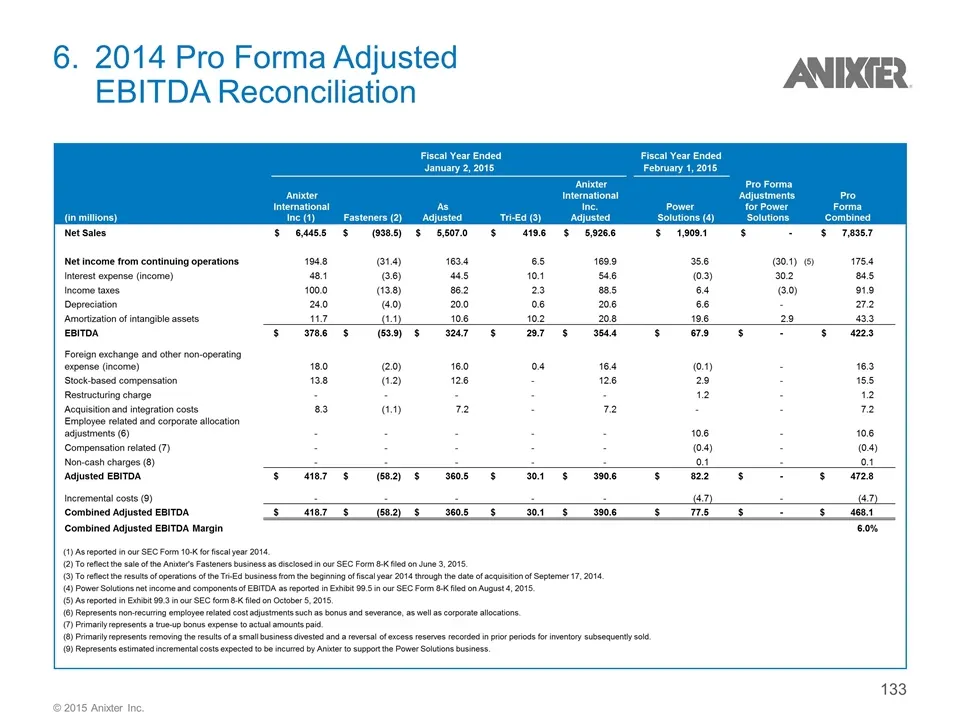
Slide 133: 2014 Pro Forma Adjusted EBITDA Reconciliation
6. 2014 Pro Forma Adjusted EBITDA Reconciliation Fiscal Year Ended February 1, 2015 (in millions) Anixter International Inc (1) Fasteners (2) As Adjusted Tri-Ed (3) Anixter International Inc. Adjusted Power Solutions (4) Pro Forma Adjustments for Power Solutions Pro Forma Combined Net Sales $ 6,445.
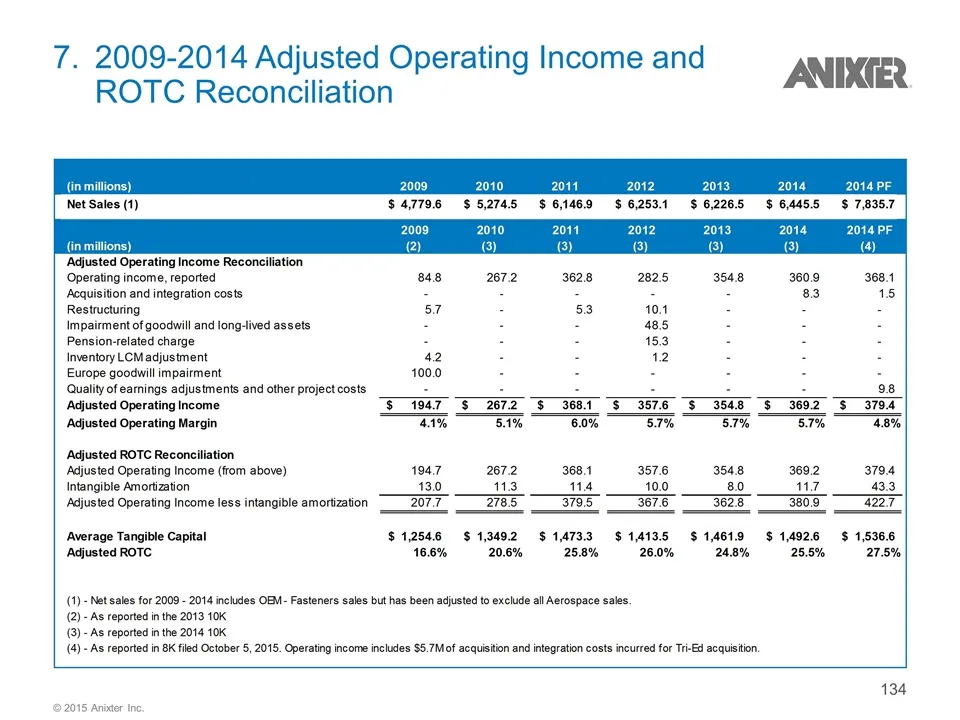
Slide 134: 2009-2014 Adjusted Operating Income and ROTC Reconciliation
7. 2009-2014 Adjusted Operating Income and ROTC Reconciliation © 2015 Anixter Inc.
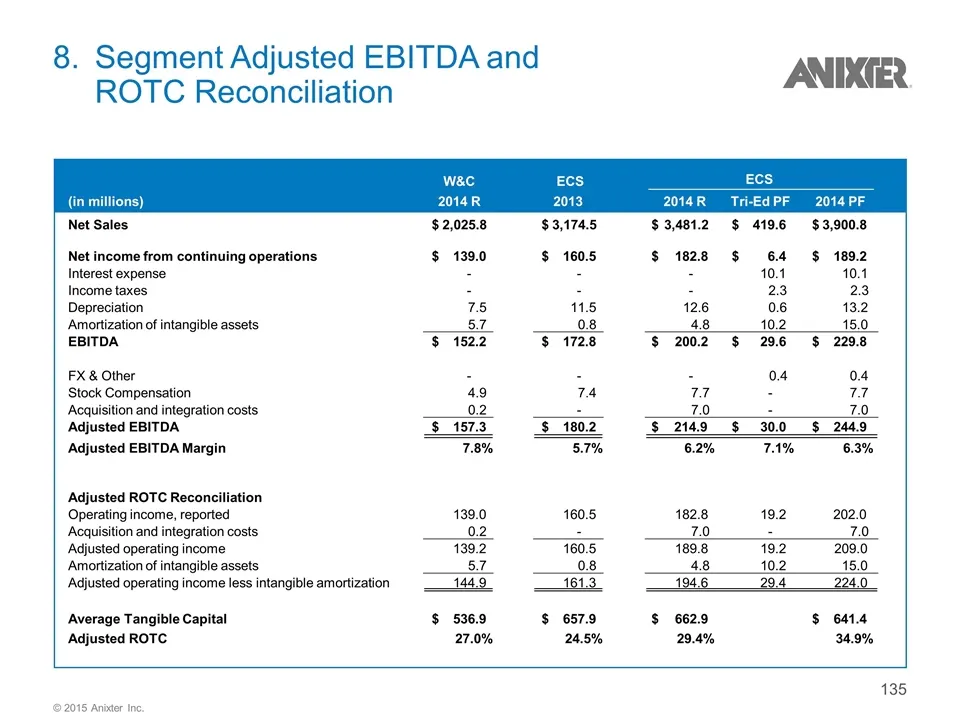
Slide 135: Segment Adjusted EBITDA and ROTC Reconciliation
8. Segment Adjusted EBITDA and ROTC Reconciliation W&C ECS (in millions) 2014 R 2013 2014 R Tri-Ed PF 2014 PF Net Sales 2,025.8 $ 3,174.5 $ 3,481.2 $ 419.6 $ 3,900.8 $ Net income from continuing operations 139.0 $ 160.5 $ 182.8 $ 6.4 $ 189.2 $ Interest expense - - - 10.1 10.1 Income taxes - - - 2.3

Slide 136: Biographies
Biographies
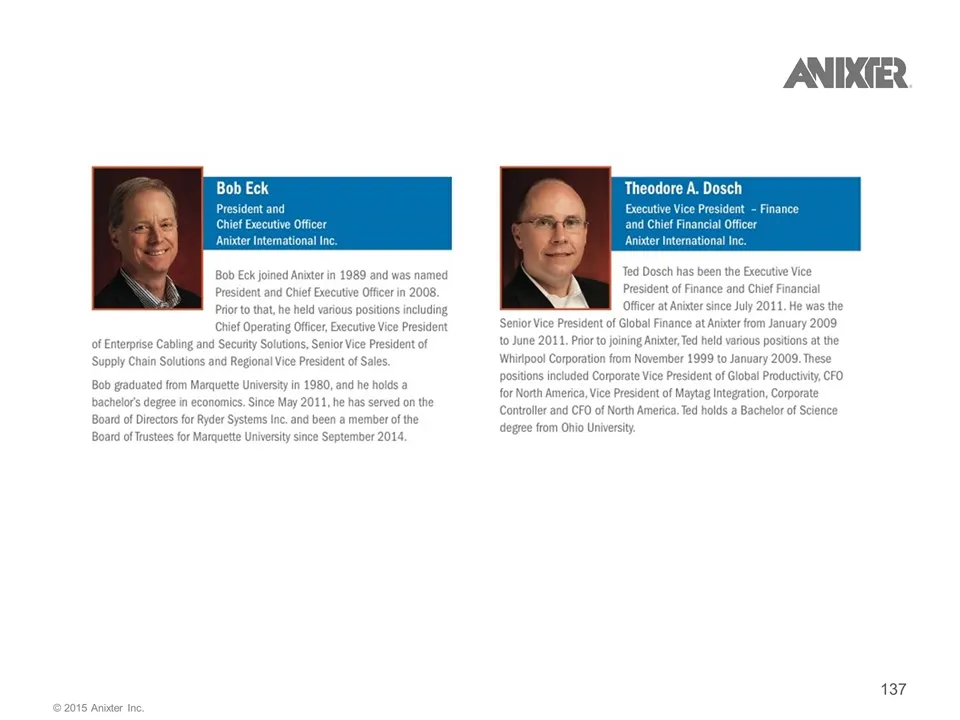
Slide 137: Bob Eck and Ted Dosch Biographies
Bob Eck President and Chief Executive Officer Anixter Intemational Inc Eck joined Anister in 1989 and was named President and Chit Execute Offer in 2008, Prior to that, he held various positions including Theodore A. Dosch Executive Vice President and Chief Financial Officer Finance Anixter Internat
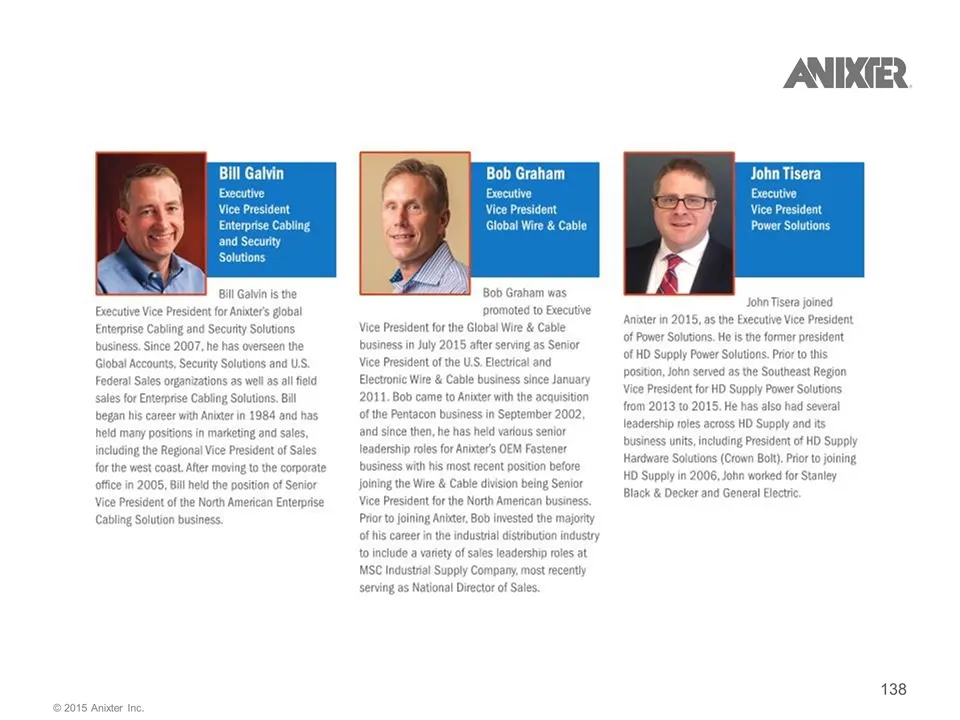
Slide 138: Bill Galvin, Bob Graham and John Tisera Biographies
Bill Galvin Solution: Bill Galvin is the {secutive Vee Presiden for Anitrs gobal Bob Graham Executi dent Global Wire & Cable Bob Graham was promoted to Executive business. Since 2007, he has Giobal Accounts, Security selon S Federal Sales organizations as wel as all field business in July 2015 after
Source: SEC EDGAR · 8-K filed Nov 9, 2015
More decks from Anixter International Inc
 Merger or Acquisition (March 2020)19 slides · Mar 3, 2020
 Q4 2019 Earnings Presentation22 slides · Jan 30, 2020
 Merger or Acquisition (January 2020)15 slides · Jan 13, 2020
 2016 Global High Yield & Leveraged Finance Conference22 slides · Mar 2, 2016
 Merger or Acquisition (July 2015)15 slides · Jul 17, 2015
 Investor Presentation (September 2014)46 slides · Sep 9, 2014