Alpha Natural Resources — Foundation Coal Holdings — Howard Weil 36th Annual Energy Conference 2008
21 slides from Alpha Natural Resources's conference presentation, Apr 7, 2008
Slide 1: Mining the Past…Powering the Future
Exhibit 99.1 Mining the Past…Powering the Future Howard Weil 36th Annual Energy Conference New Orleans, LA April 7, 2008 1
Slide 2: Forward-Looking Statements and Reconciliation of Non-GAAP Measures
FORWARD-LOOKING STATEMENTS AND RECONCILIATION OF NON-GAAP MEASURES Statements in this presentation which are not statements of historical fact are “forward-looking statements” within the “safe harbor” provision of the Private Securities Litigation Reform Act of 1995. These forward-looking statements
Slide 3: Presentation Overview
PRESENTATION OVERVIEW Industry Overview Global Demand Growth U.S. Market Projections Foundation Coal Investment Highlights Strong Safety Record Attractive Asset Base Positive Outlook for Organic Growth Significant Leverage to Rising Price Environment Track Record of Financial Performance Summary 3
Slide 4: World Energy Consumption Expected to Increase Dramatically
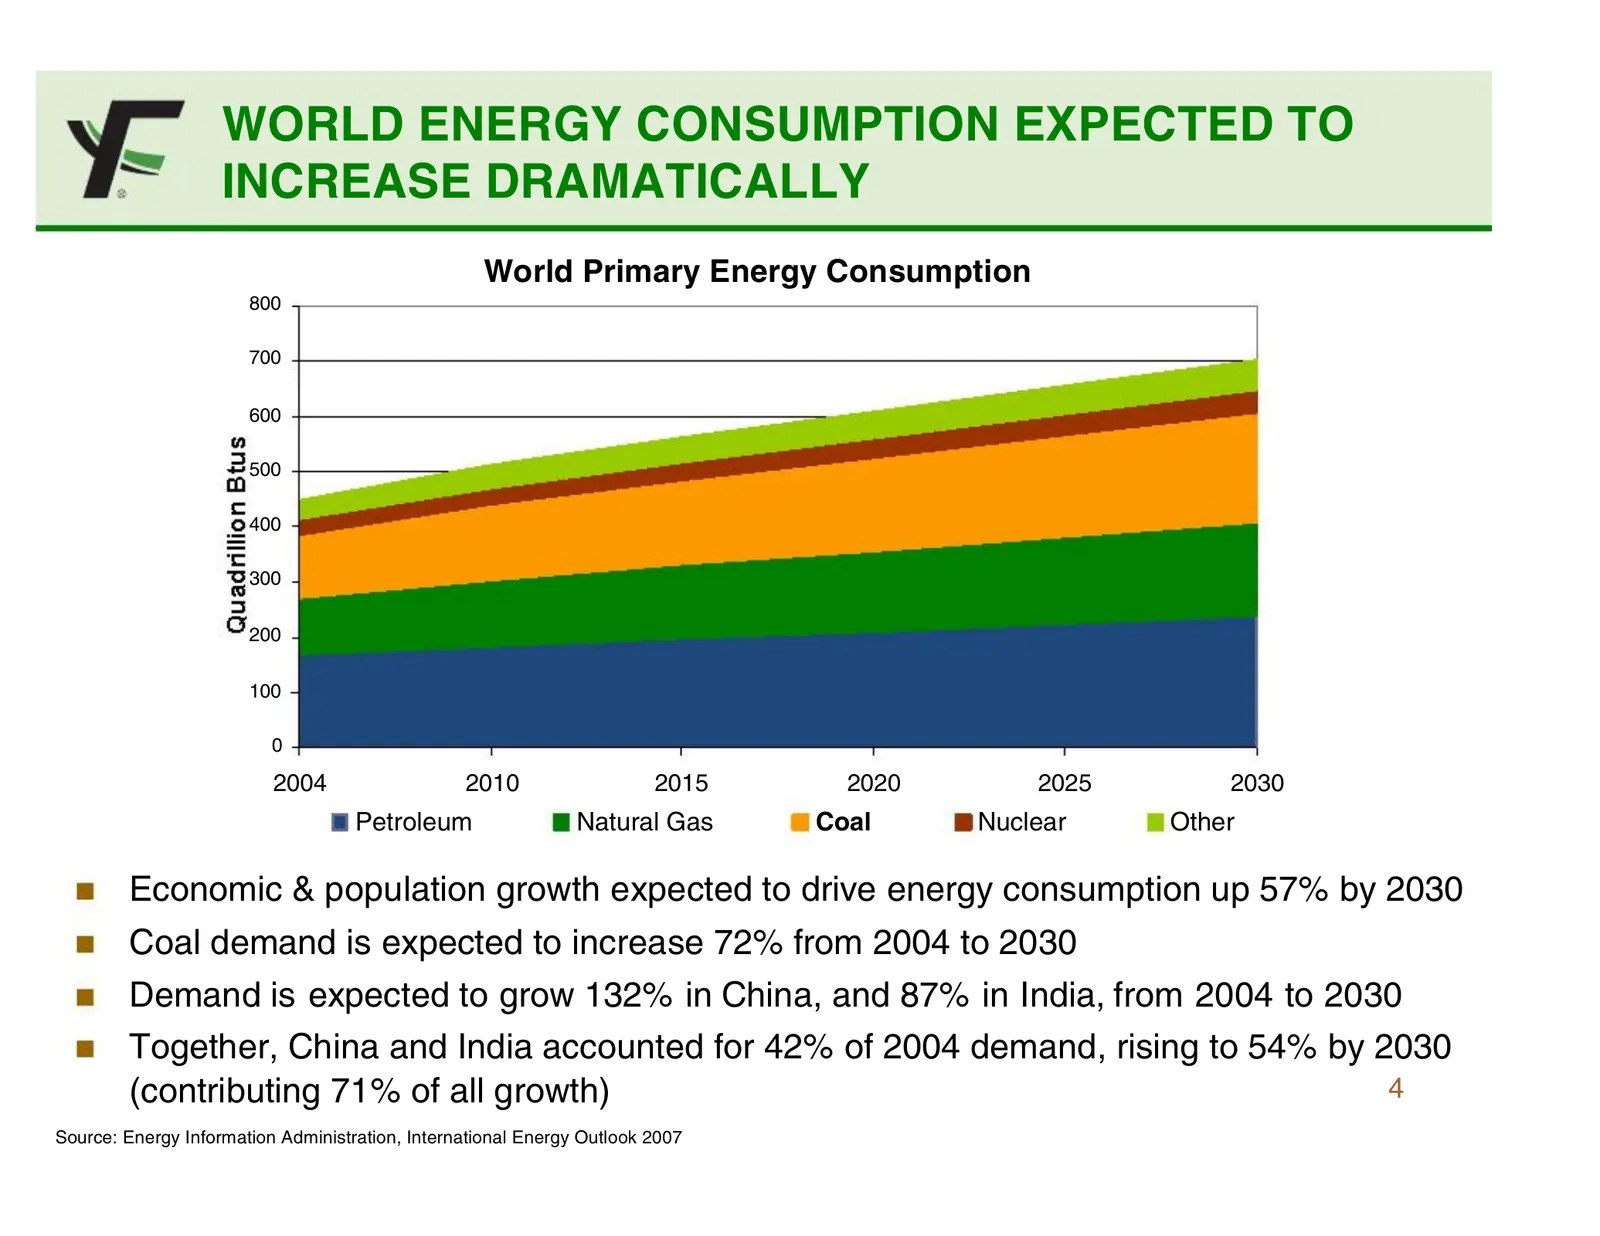
WORLD ENERGY CONSUMPTION EXPECTED TO INCREASE DRAMATICALLY World Primary Energy Consumption 800 700 600 500 400 300 200 100 0 2004 2010 2015 2020 2025 2030 Petroleum Natural Gas Coal Nuclear Other Economic & population growth expected to drive energy consumption up 57% by 2030 Coal demand is expecte
Slide 5: Catalysts Driving the Market
CATALYSTS DRIVING THE MARKET Current Market Fundamentals • Favorable US currency • Relatively high natural gas prices • Favorable ocean freight rates • Close to normal domestic stockpiles • Lead time to increase U.S. production Recent Events Have Accelerated International Market Tightness • China –
Slide 6: Impact of Increasing Global Demand
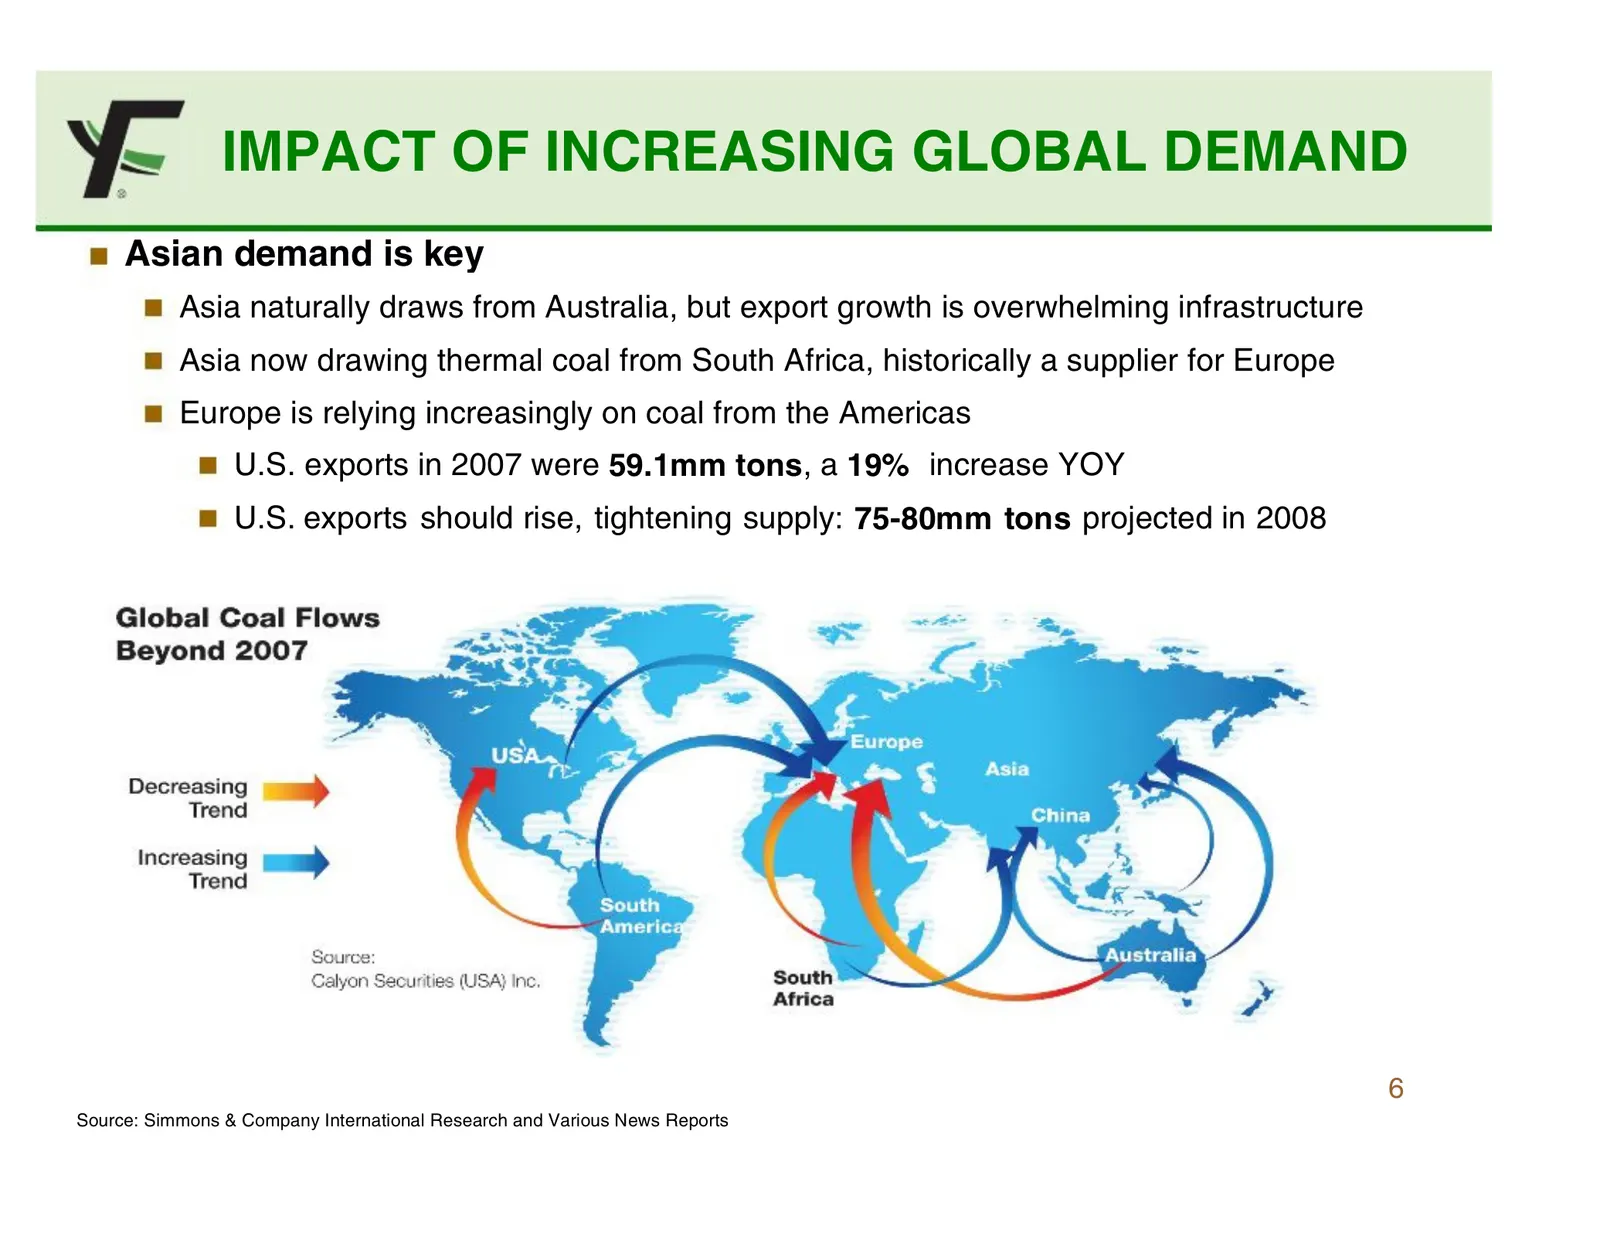
IMPACT OF INCREASING GLOBAL DEMAND Asian demand is key Asia naturally draws from Australia, but export growth is overwhelming infrastructure Asia now drawing thermal coal from South Africa, historically a supplier for Europe Europe is relying increasingly on coal from the Americas U.S. exports in 20
Slide 7: U.S. Electricity Generation
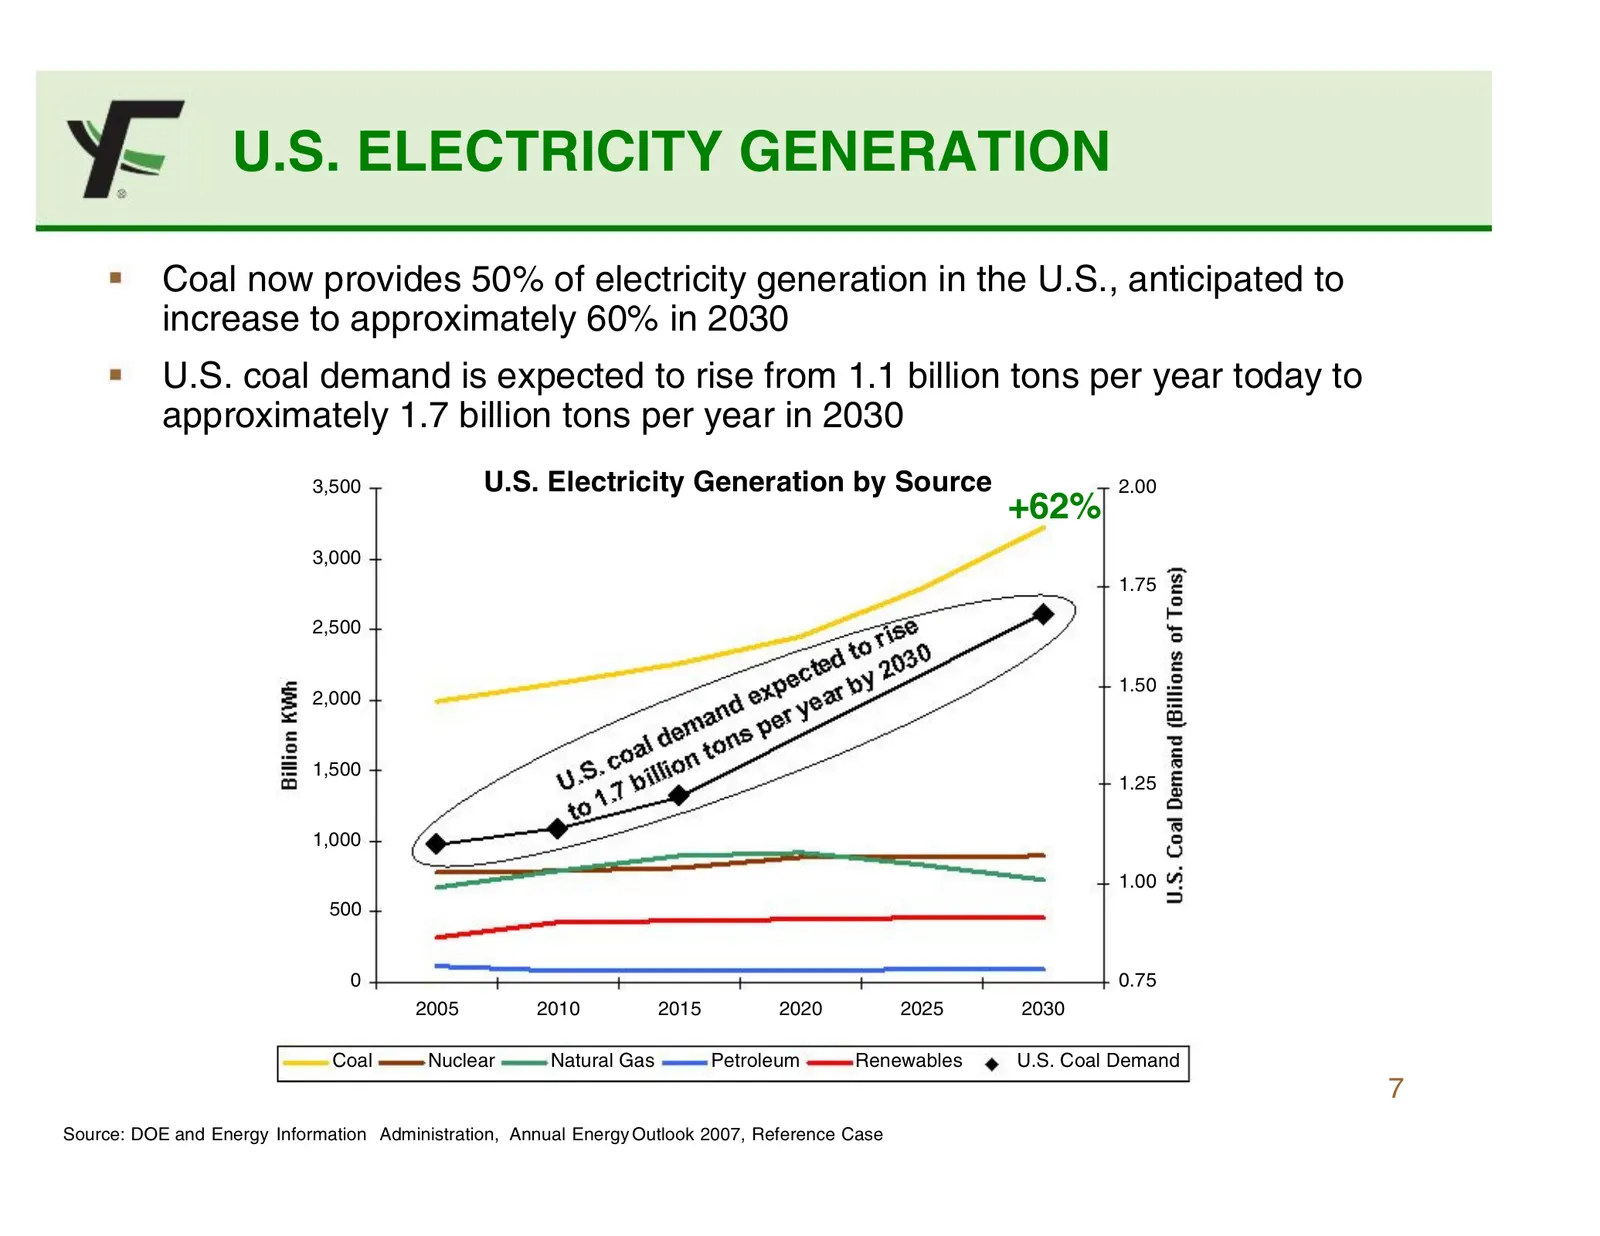
U.S. ELECTRICITY GENERATION Coal now provides 50% of electricity generation in the U.S., anticipated to increase to approximately 60% in 2030 U.S. coal demand is expected to rise from 1.1 billion tons per year today to approximately 1.7 billion tons per year in 2030 3,500 U.S. Electricity Generation
Slide 8: U.S. Coal-Fired Generation Growth
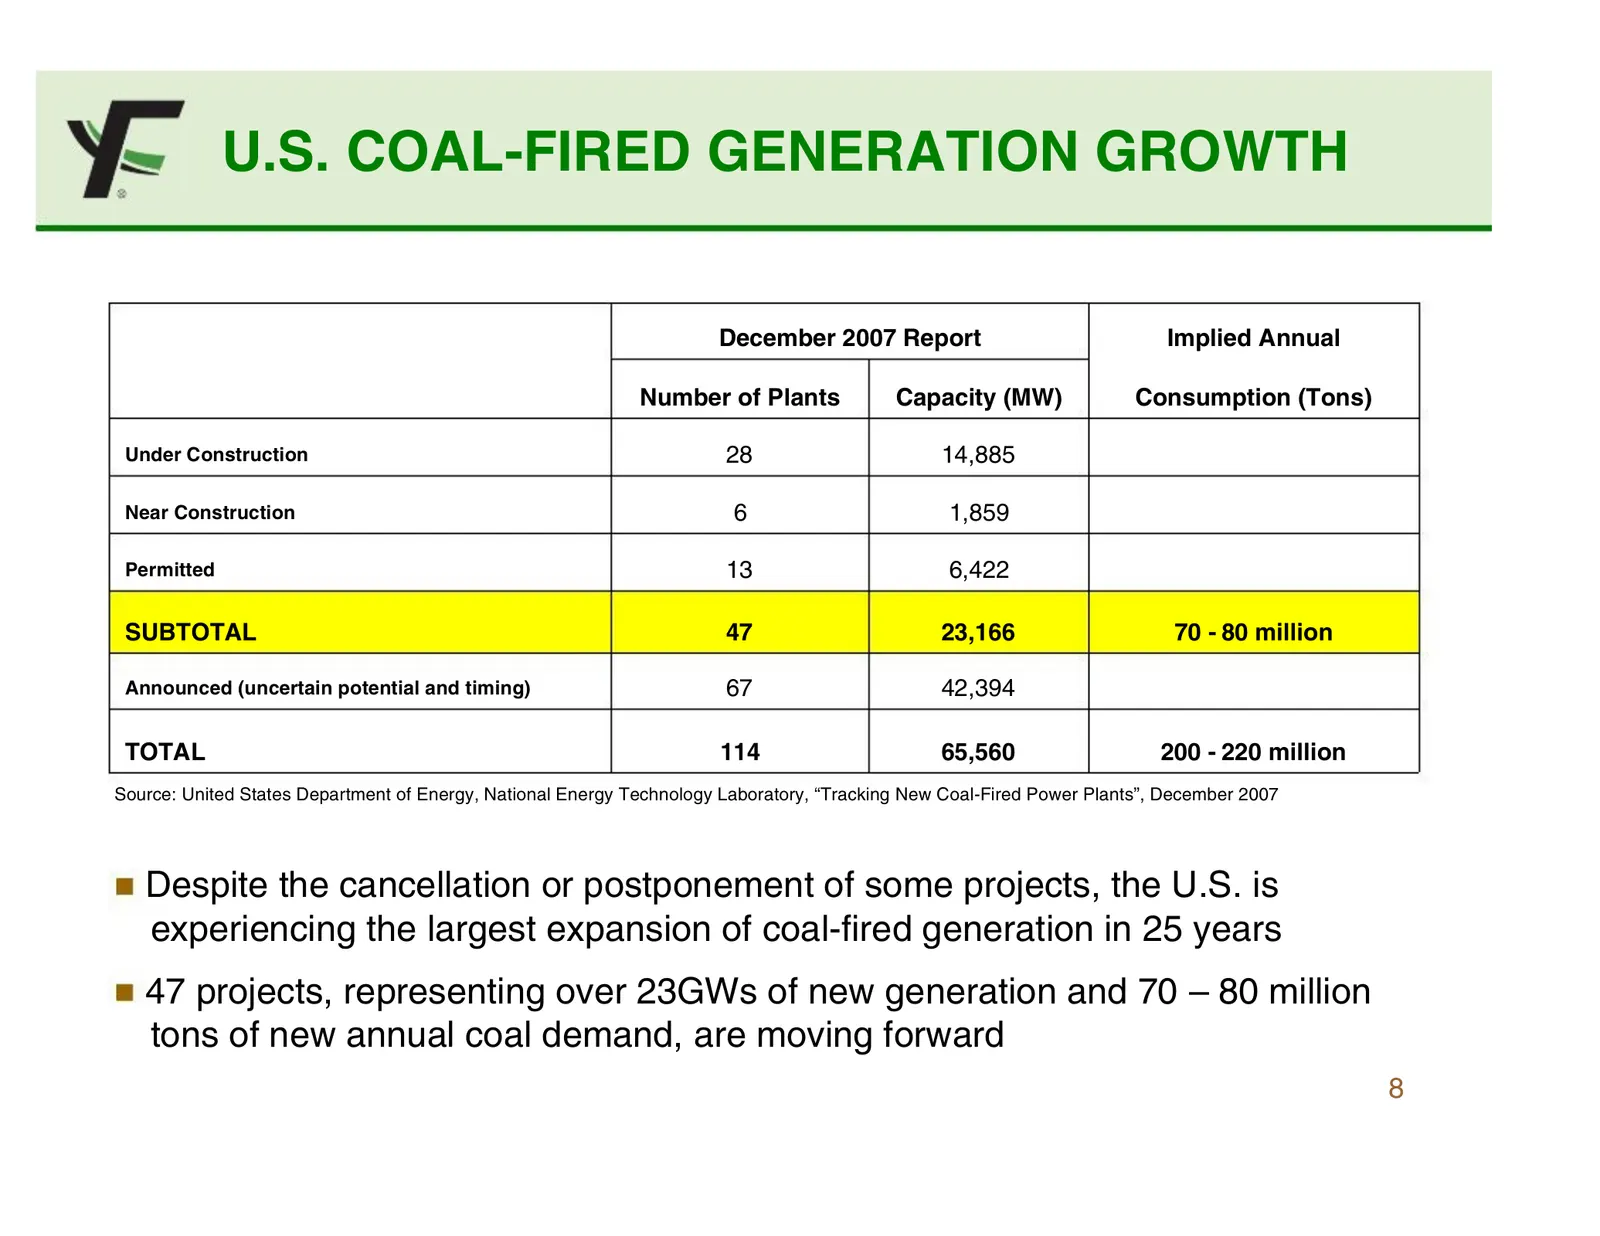
U.S. COAL-FIRED GENERATION GROWTH December 2007 Report Implied Annual Number of Plants Capacity (MW) Consumption (Tons) Under Construction 28 14,885 Near Construction 6 1,859 Permitted 13 6,422 SUBTOTAL 47 23,166 70 - 80 million Announced (uncertain potential and timing) 67 42,394 TOTAL 114 65,560 2
Slide 9: Prices Have Increased in All Regions
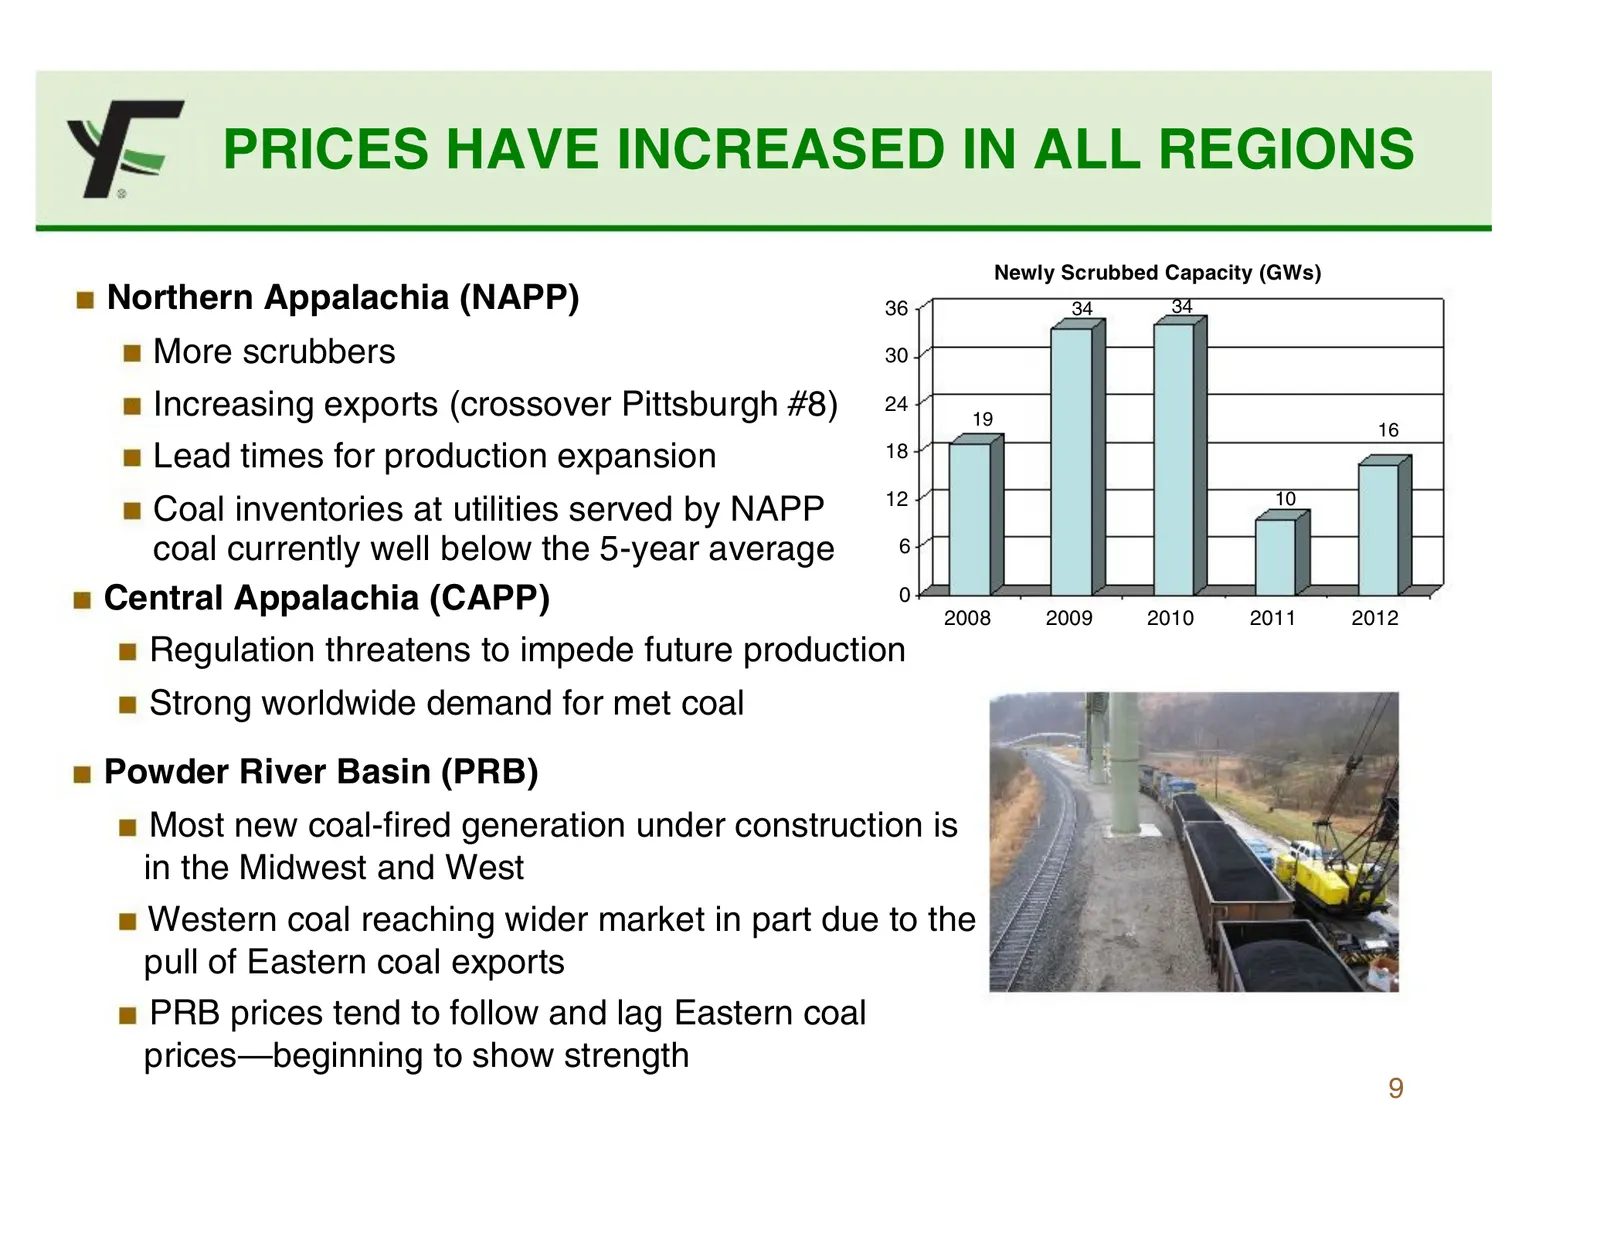
PRICES HAVE INCREASED IN ALL REGIONS Newly Scrubbed Capacity (GWs) Northern Appalachia (NAPP) 36 34 34 More scrubbers 30 Increasing exports (crossover Pittsburgh #8) 24 19 16 Lead times for production expansion 18 12 10 Coal inventories at utilities served by NAPP coal currently well below the 5-yea
Slide 10: Foundation Coal Overview
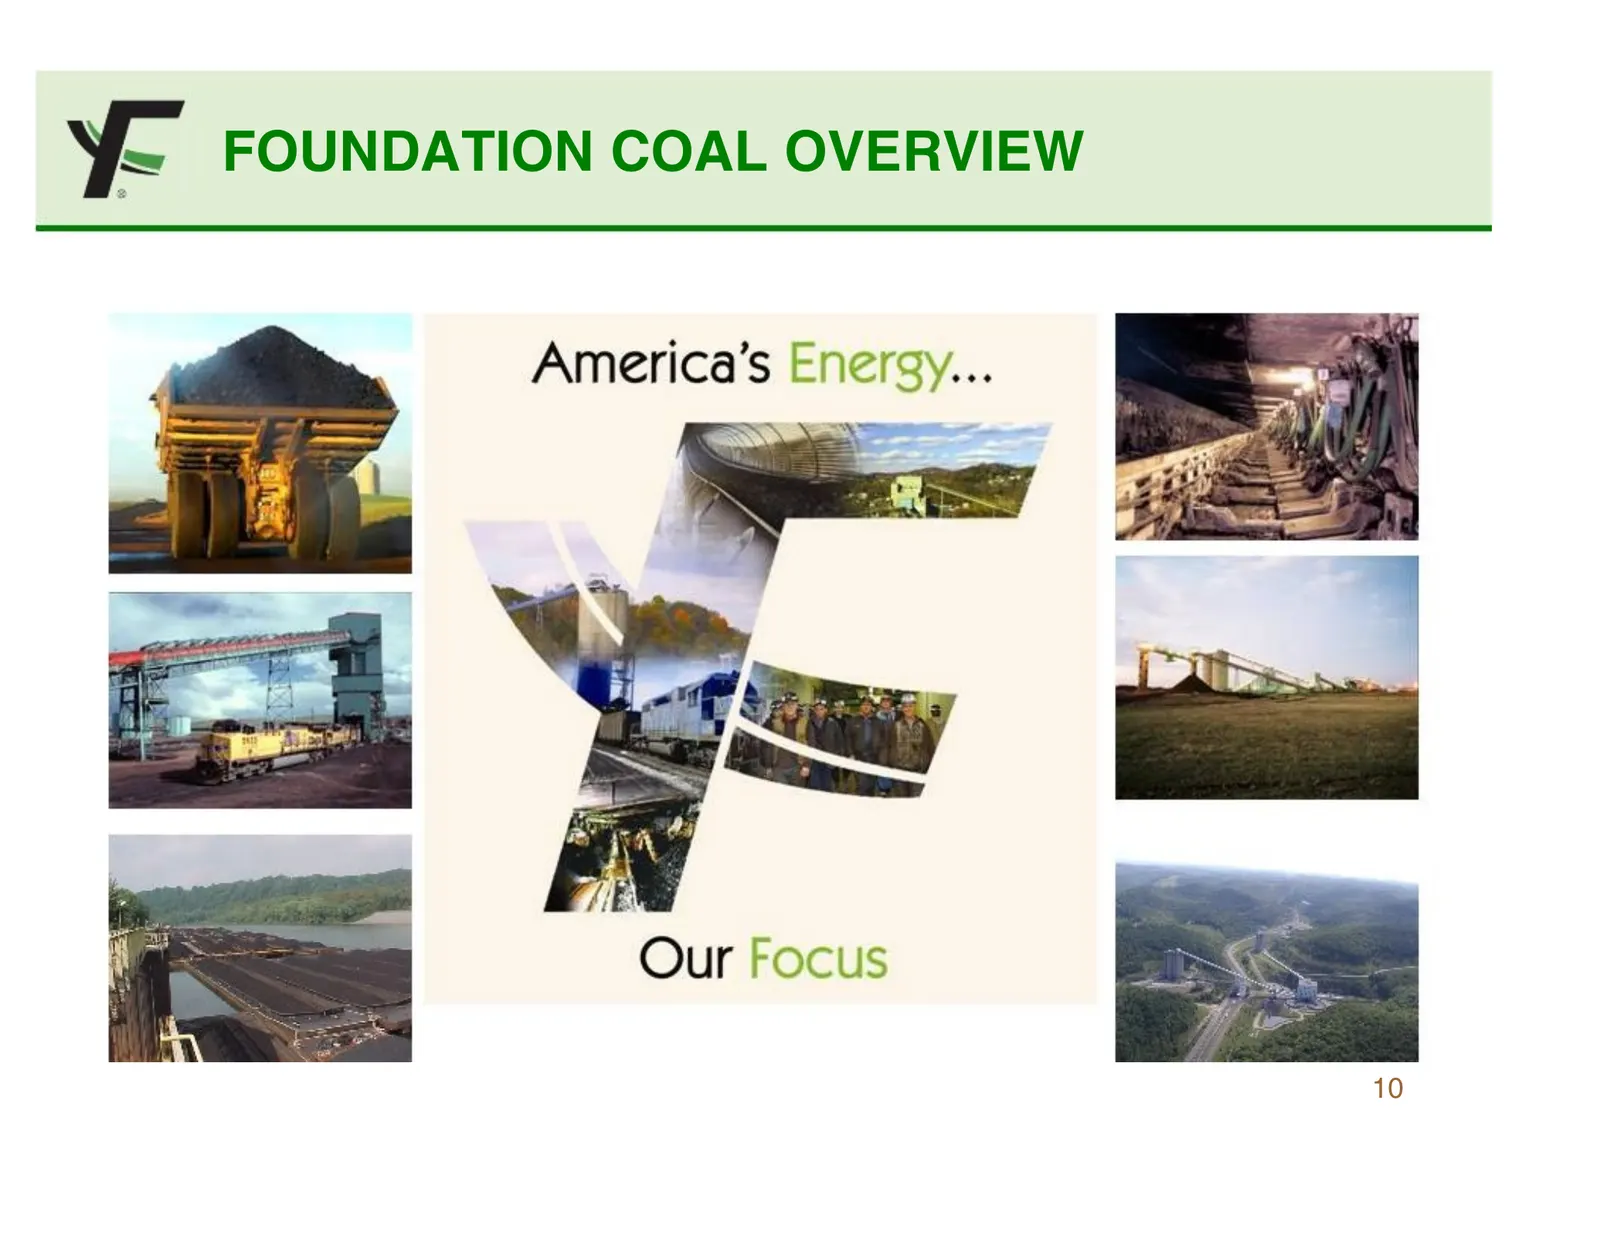
ye FOUNDATION COAL OVERVIEW America’s Energy... ERO hs — Our Focus
Slide 11: A Commitment to Safety
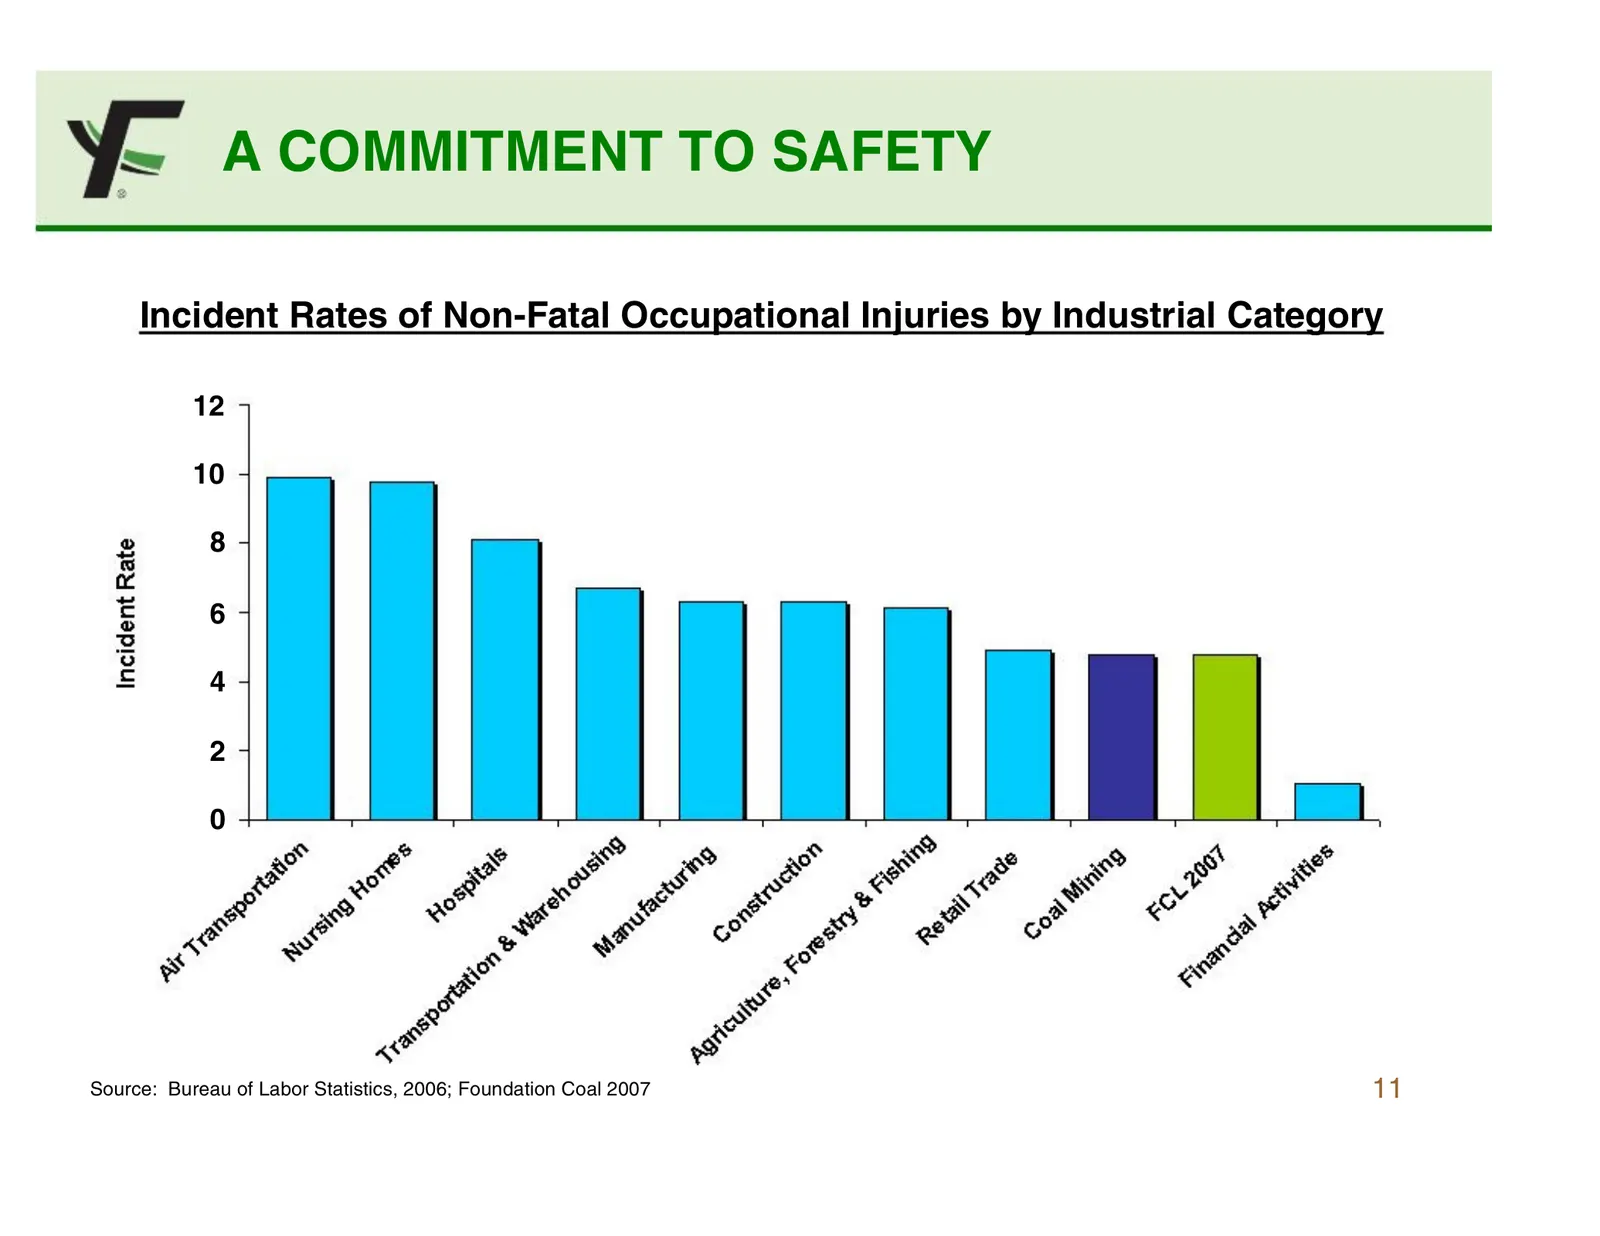
A COMMITMENT TO SAFETY Incident Rates of Non-Fatal Occupational Injuries by Industrial Category 12 10 8 6 4 2 0 Source: Bureau of Labor Statistics, 2006; Foundation Coal 2007 11
Slide 12: Diversified Operations
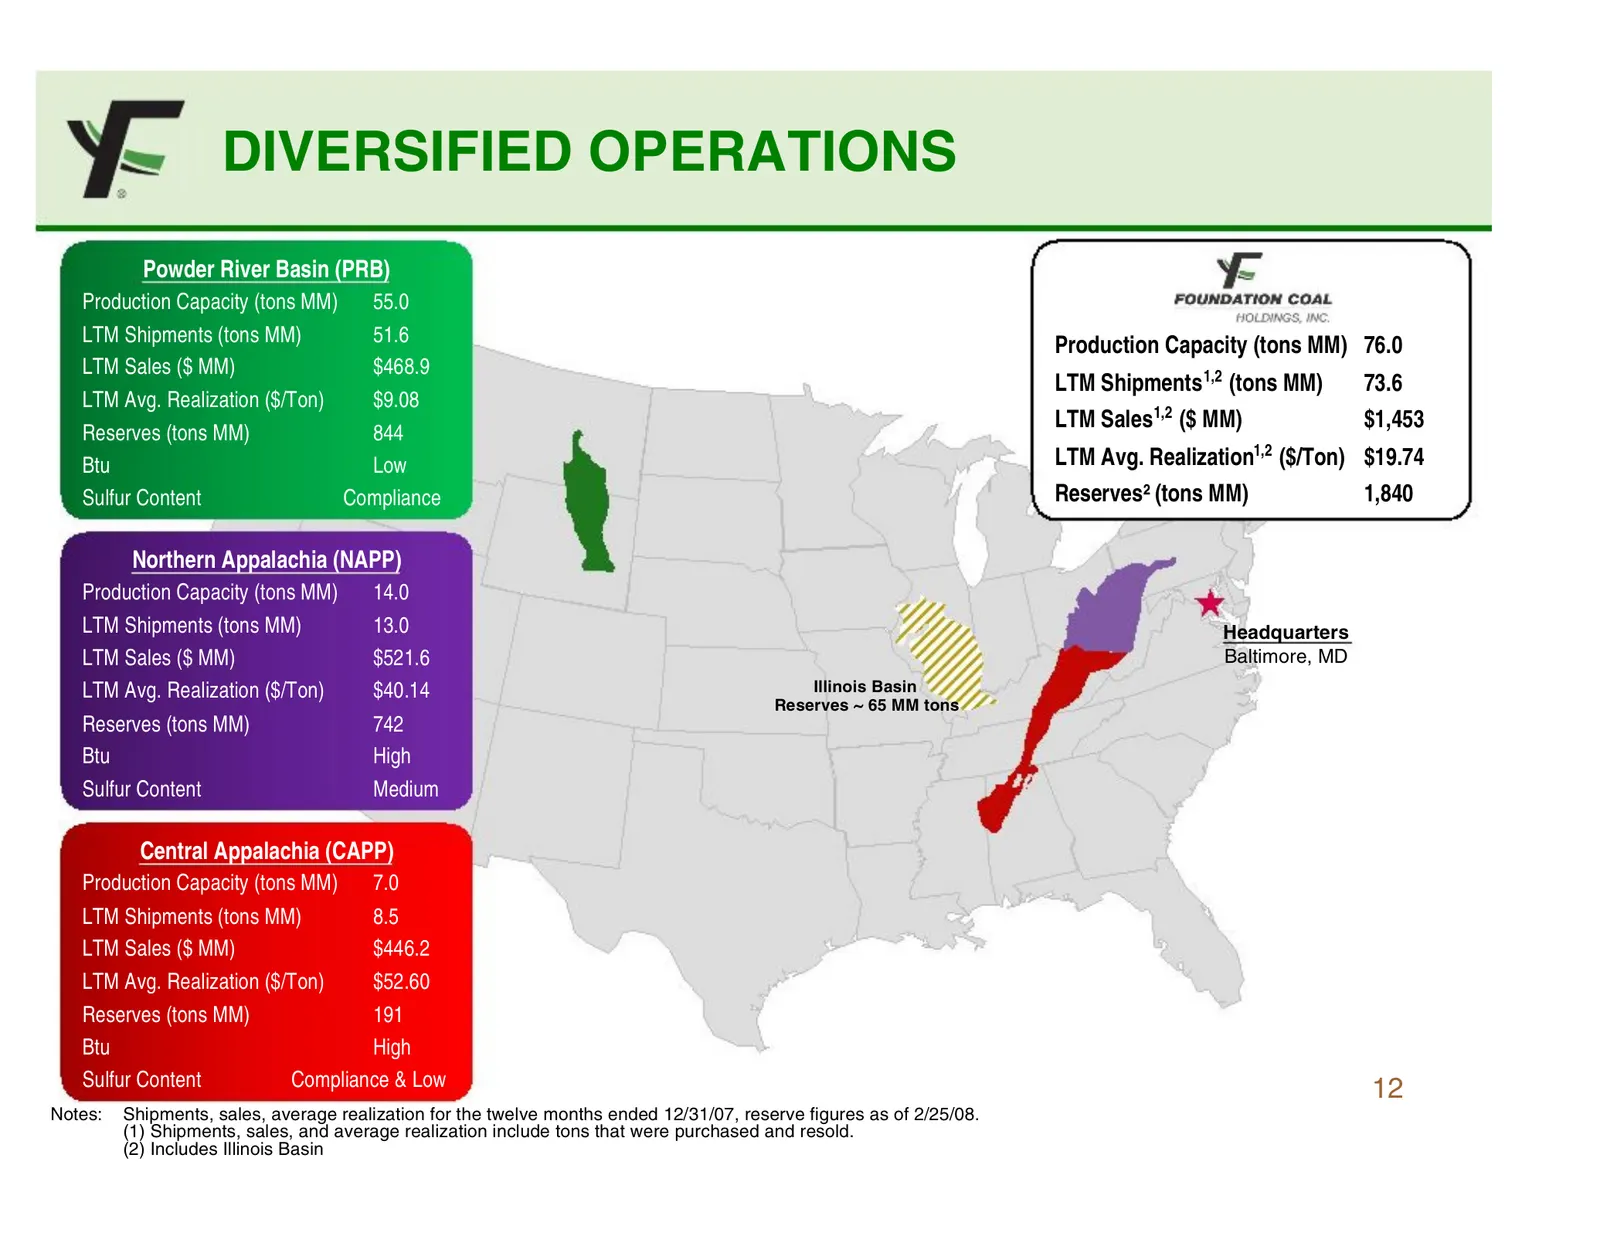
DIVERSIFIED OPERATIONS Powder River Basin (PRB) Production Capacity (tons MM) 55.0 LTM Shipments (tons MM) 51.6 Production Capacity (tons MM) 76.0 LTM Sales ($ MM) $468.9 LTM Shipments 1,2 (tons MM) 73.6 LTM Avg. Realization ($/Ton) $9.08 1,2 LTM Sales ($ MM) $1,453 Reserves (tons MM) 844 Btu Low LT
Slide 13: Future Production Potential
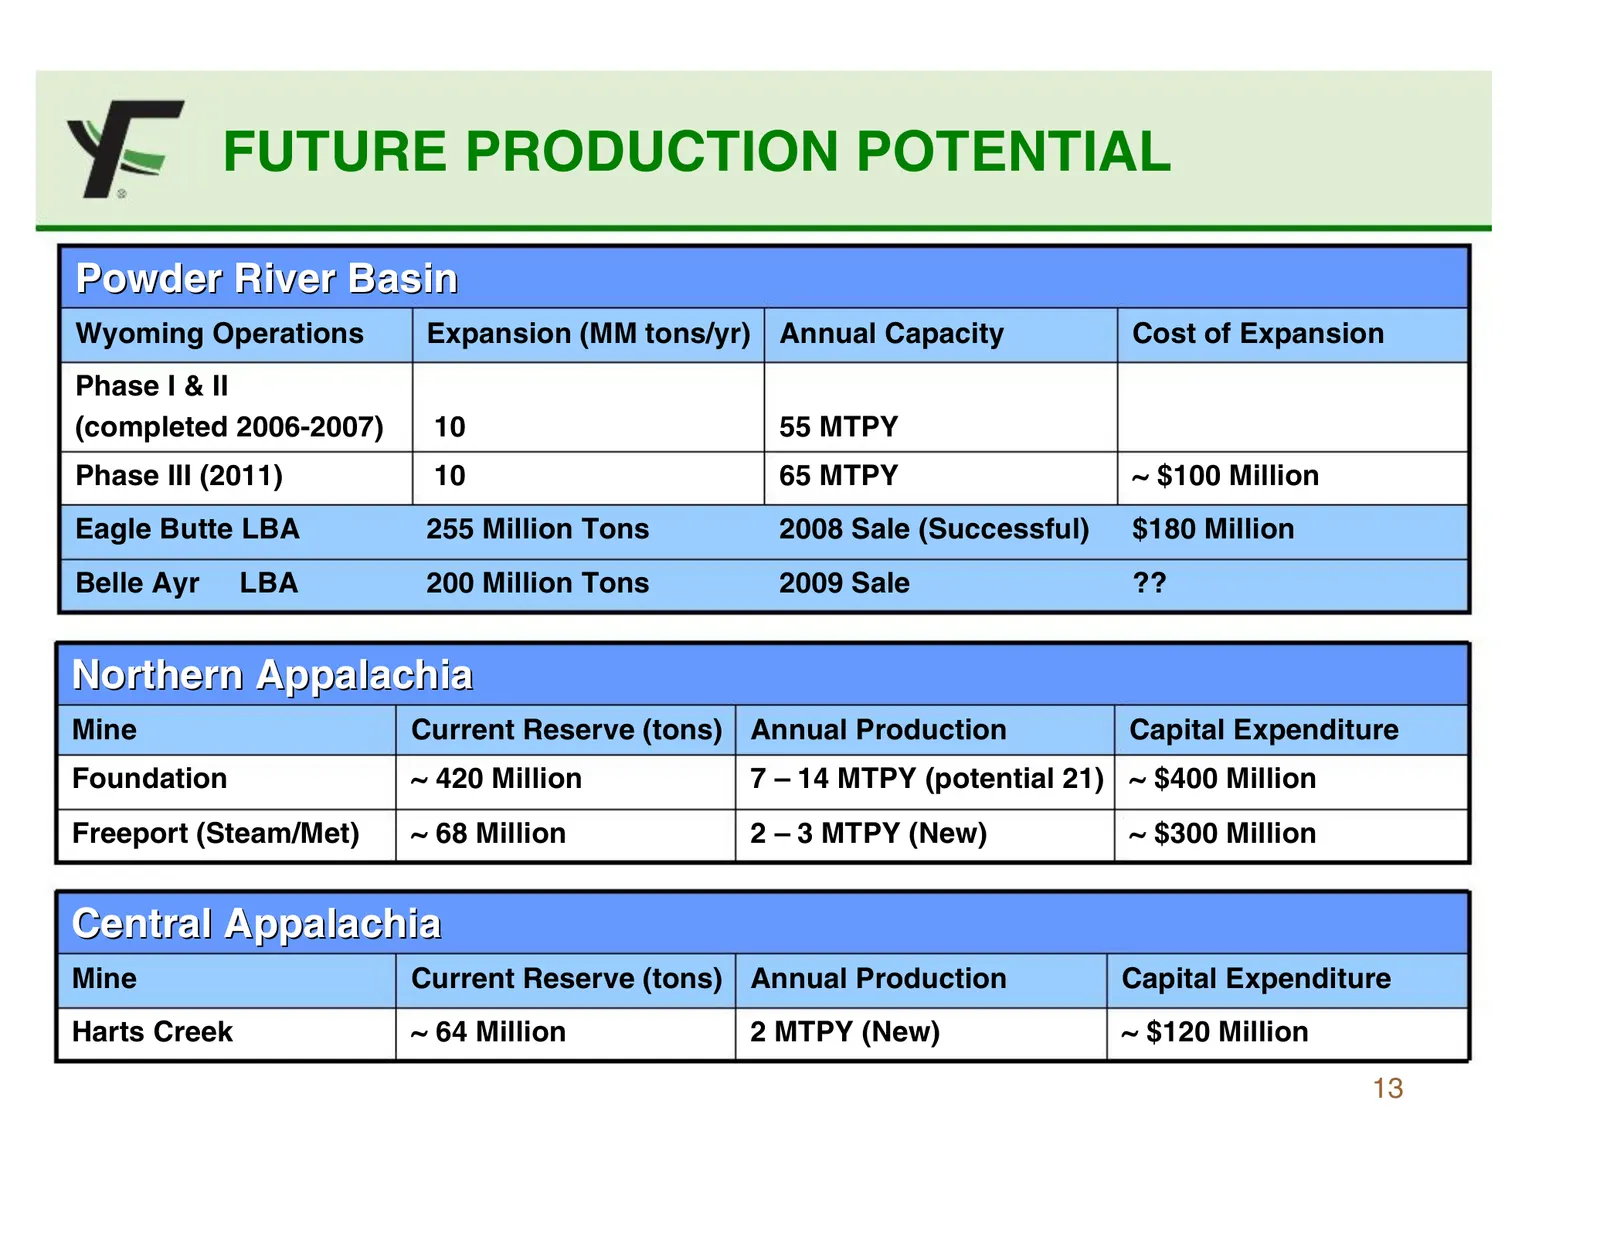
FUTURE PRODUCTION POTENTIAL Powder River Basin Wyoming Operations Expansion (MM tons/yr) Annual Capacity Cost of Expansion Phase I & II (completed 2006-2007) 10 55 MTPY Phase III (2011) 10 65 MTPY ~ $100 Million Eagle Butte LBA 255 Million Tons 2008 Sale (Successful) $180 Million Belle Ayr LBA 200 M
Slide 14: Recent Sales Activity Reflective of Current Market Tightness
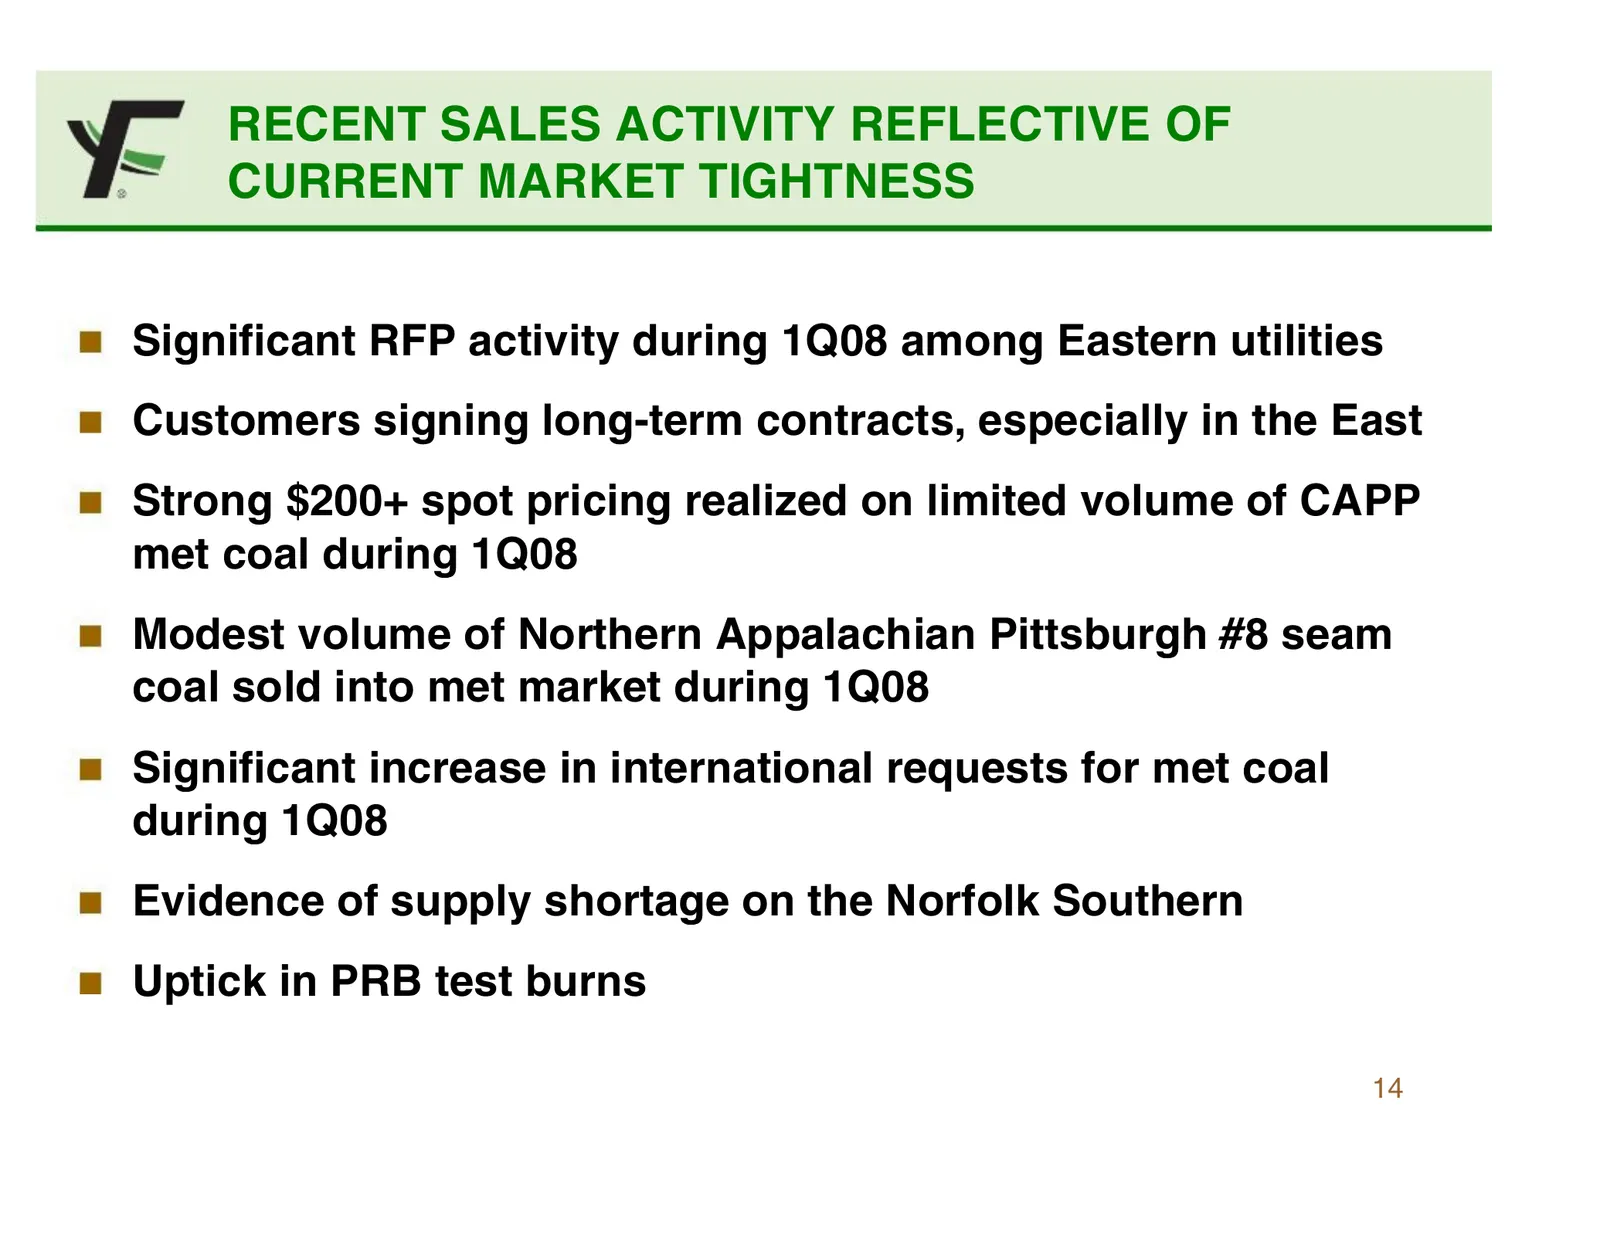
RECENT SALES ACTIVITY REFLECTIVE OF CURRENT MARKET TIGHTNESS Significant RFP activity during 1Q08 among Eastern utilities Customers signing long-term contracts, especially in the East Strong $200+ spot pricing realized on limited volume of CAPP met coal during 1Q08 Modest volume of Northern Appalach
Slide 15: Proven Market Strategy Provides Opportunity in Rising Price Environment
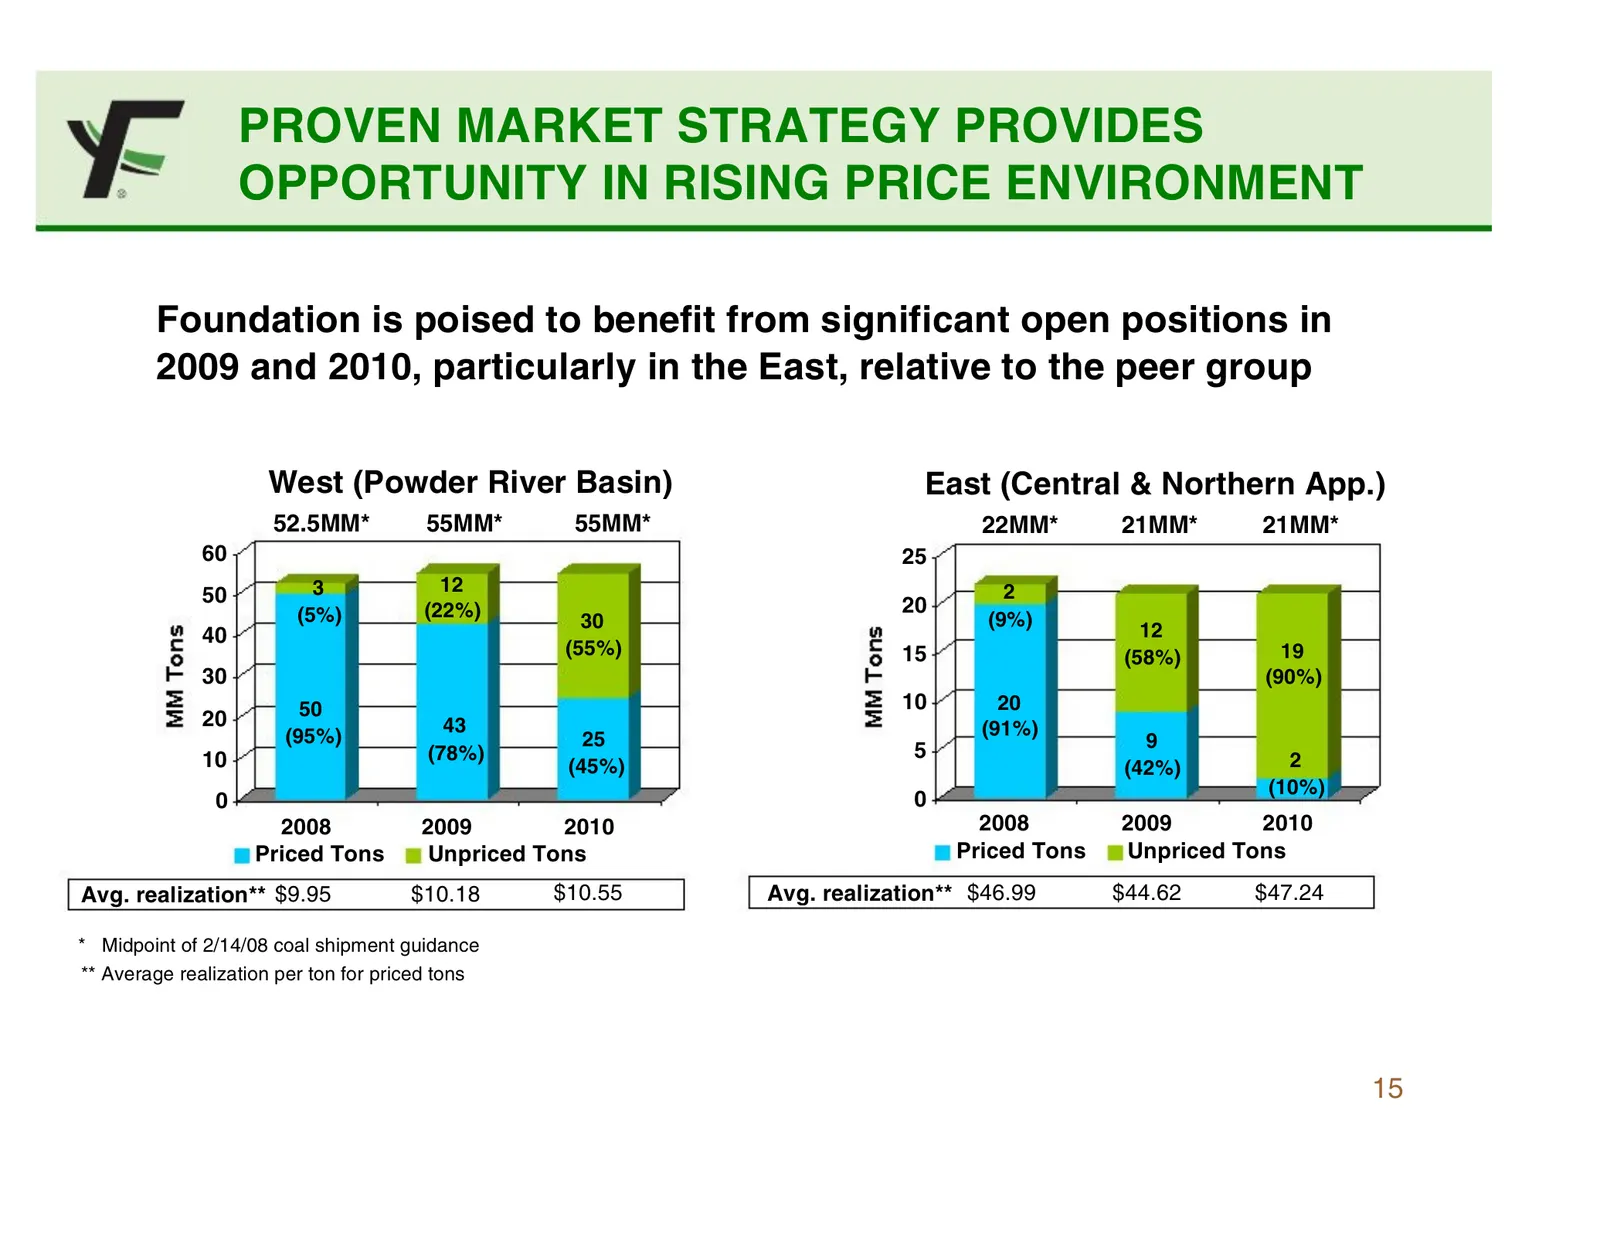
PROVEN MARKET STRATEGY PROVIDES OPPORTUNITY IN RISING PRICE ENVIRONMENT Foundation is poised to benefit from significant open positions in 2009 and 2010, particularly in the East, relative to the peer group West (Powder River Basin) East (Central & Northern App.) 52.5MM* 55MM* 55MM* 22MM* 21MM* 21MM
Slide 16: Unpriced Tons & Recent Spot Prices
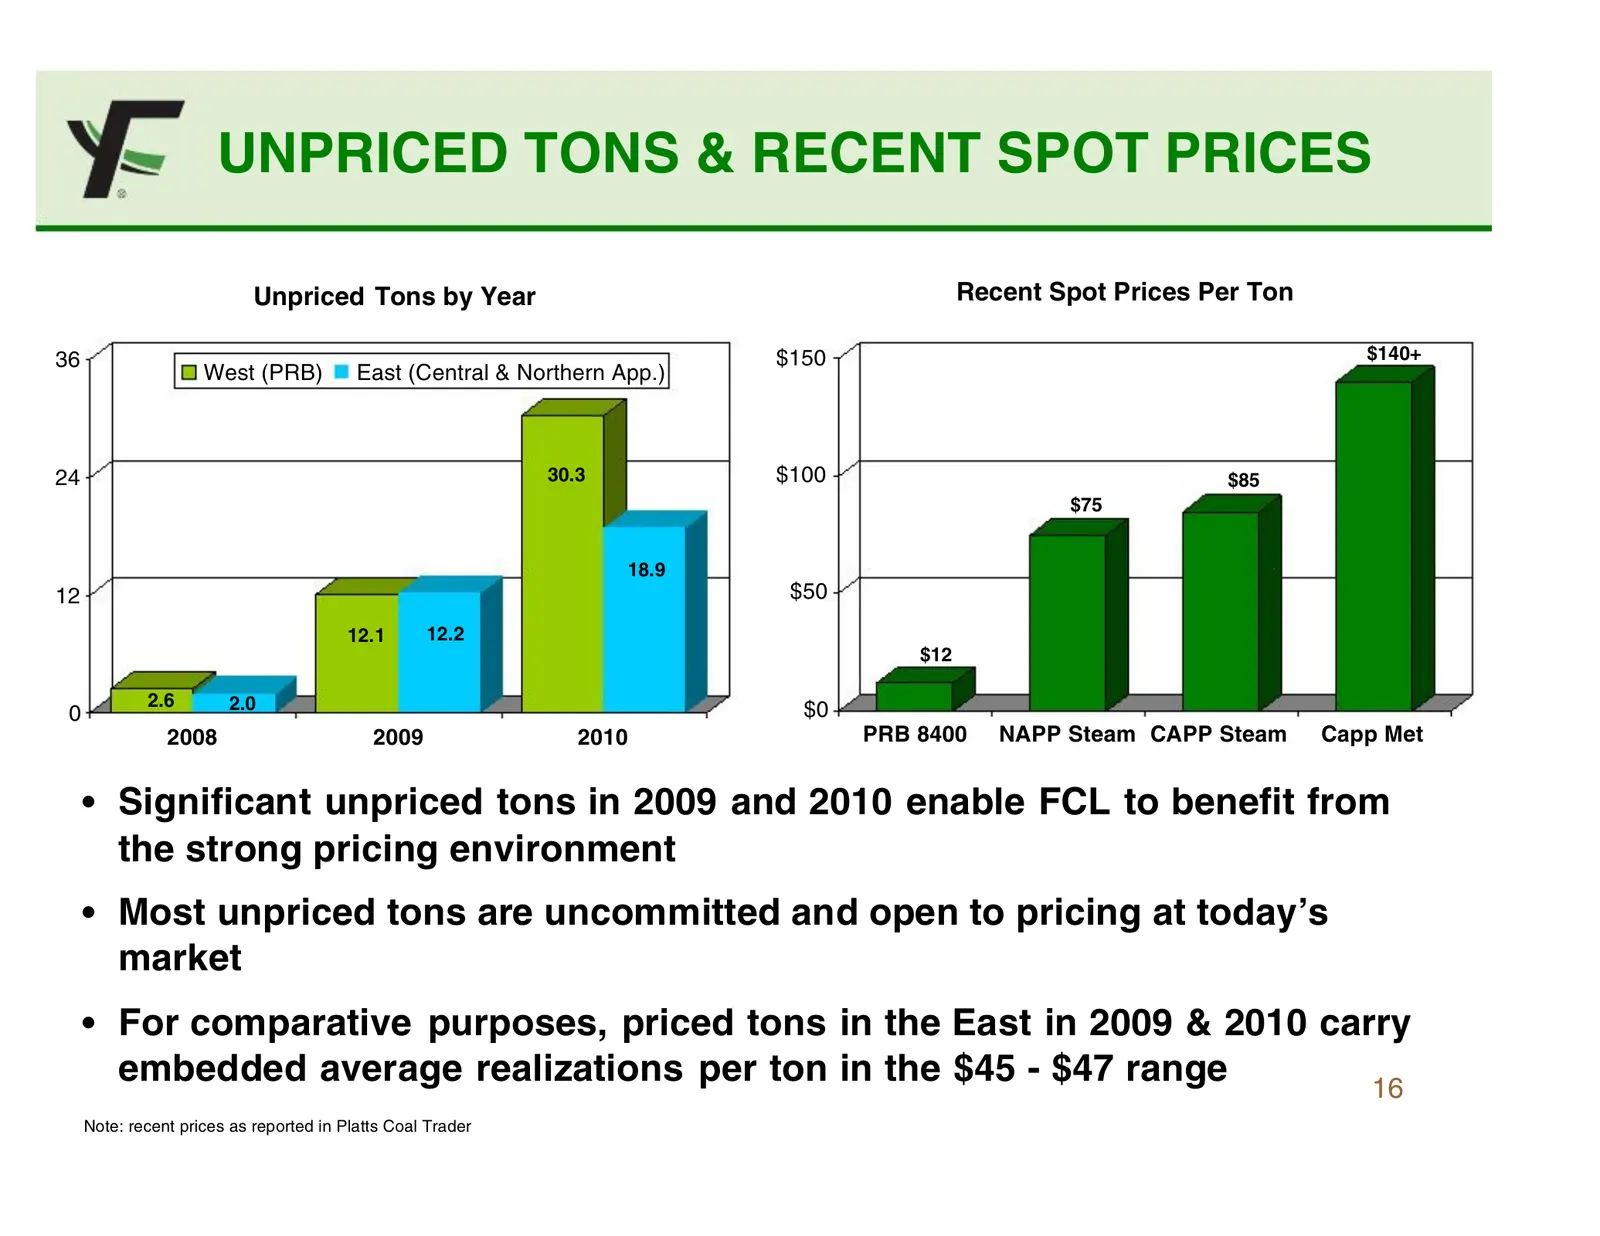
UNPRICED TONS & RECENT SPOT PRICES Unpriced Tons by Year Recent Spot Prices Per Ton 36 $150 $140+ West (PRB) East (Central & Northern App.) 24 30.3 $100 $85 $75 18.9 12 $50 12.1 12.2 $12 2.6 2.0 0 $0 2008 2009 2010 PRB 8400 NAPP Steam CAPP Steam Capp Met • Significant unpriced tons in 2009 and 2010
Slide 17: Significant EBITDA Opportunity
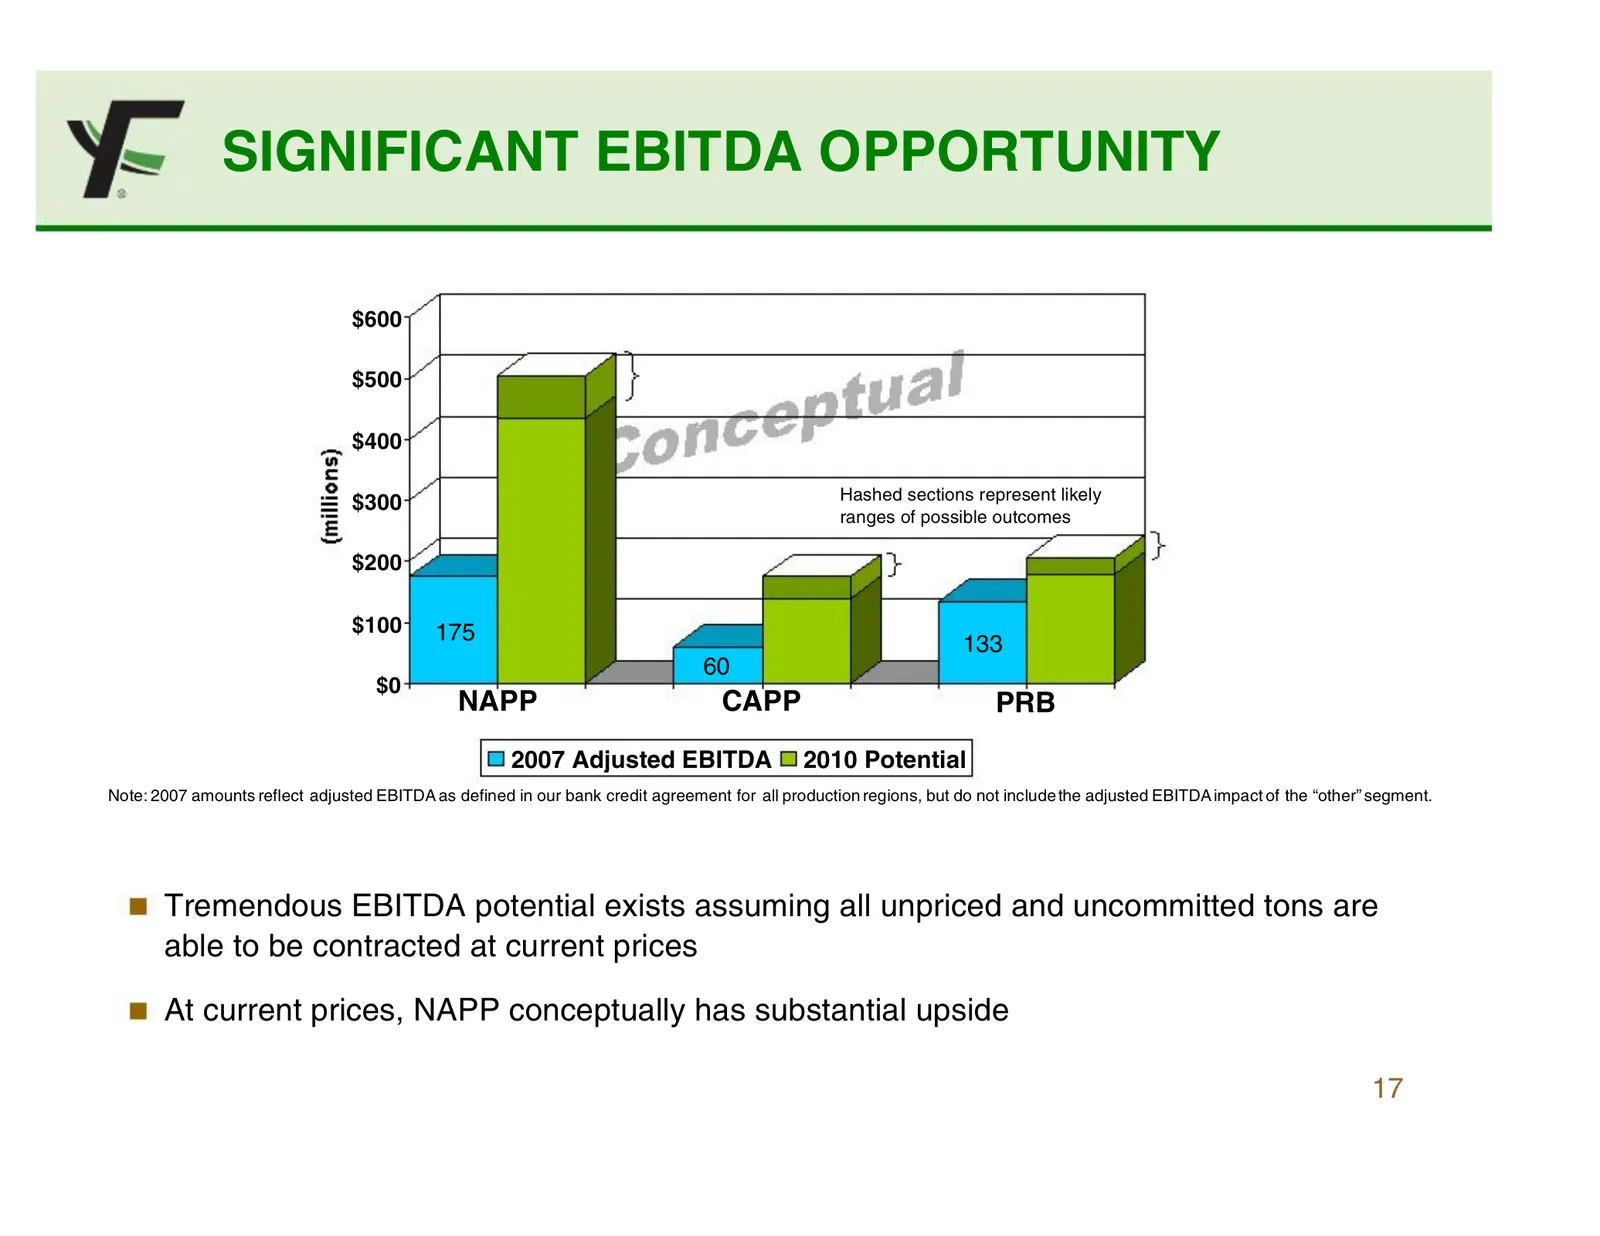
SIGNIFICANT EBITDA OPPORTUNITY $600 $500 $400 Hashed sections represent likely $300 ranges of possible outcomes $200 $100 175 133 60 $0 NAPP CAPP PRB 2007 Adjusted EBITDA 2010 Potential Note: 2007 amounts reflect adjusted EBITDA as defined in our bank credit agreement for all production regions, but
Slide 18: Key Performance Highlights
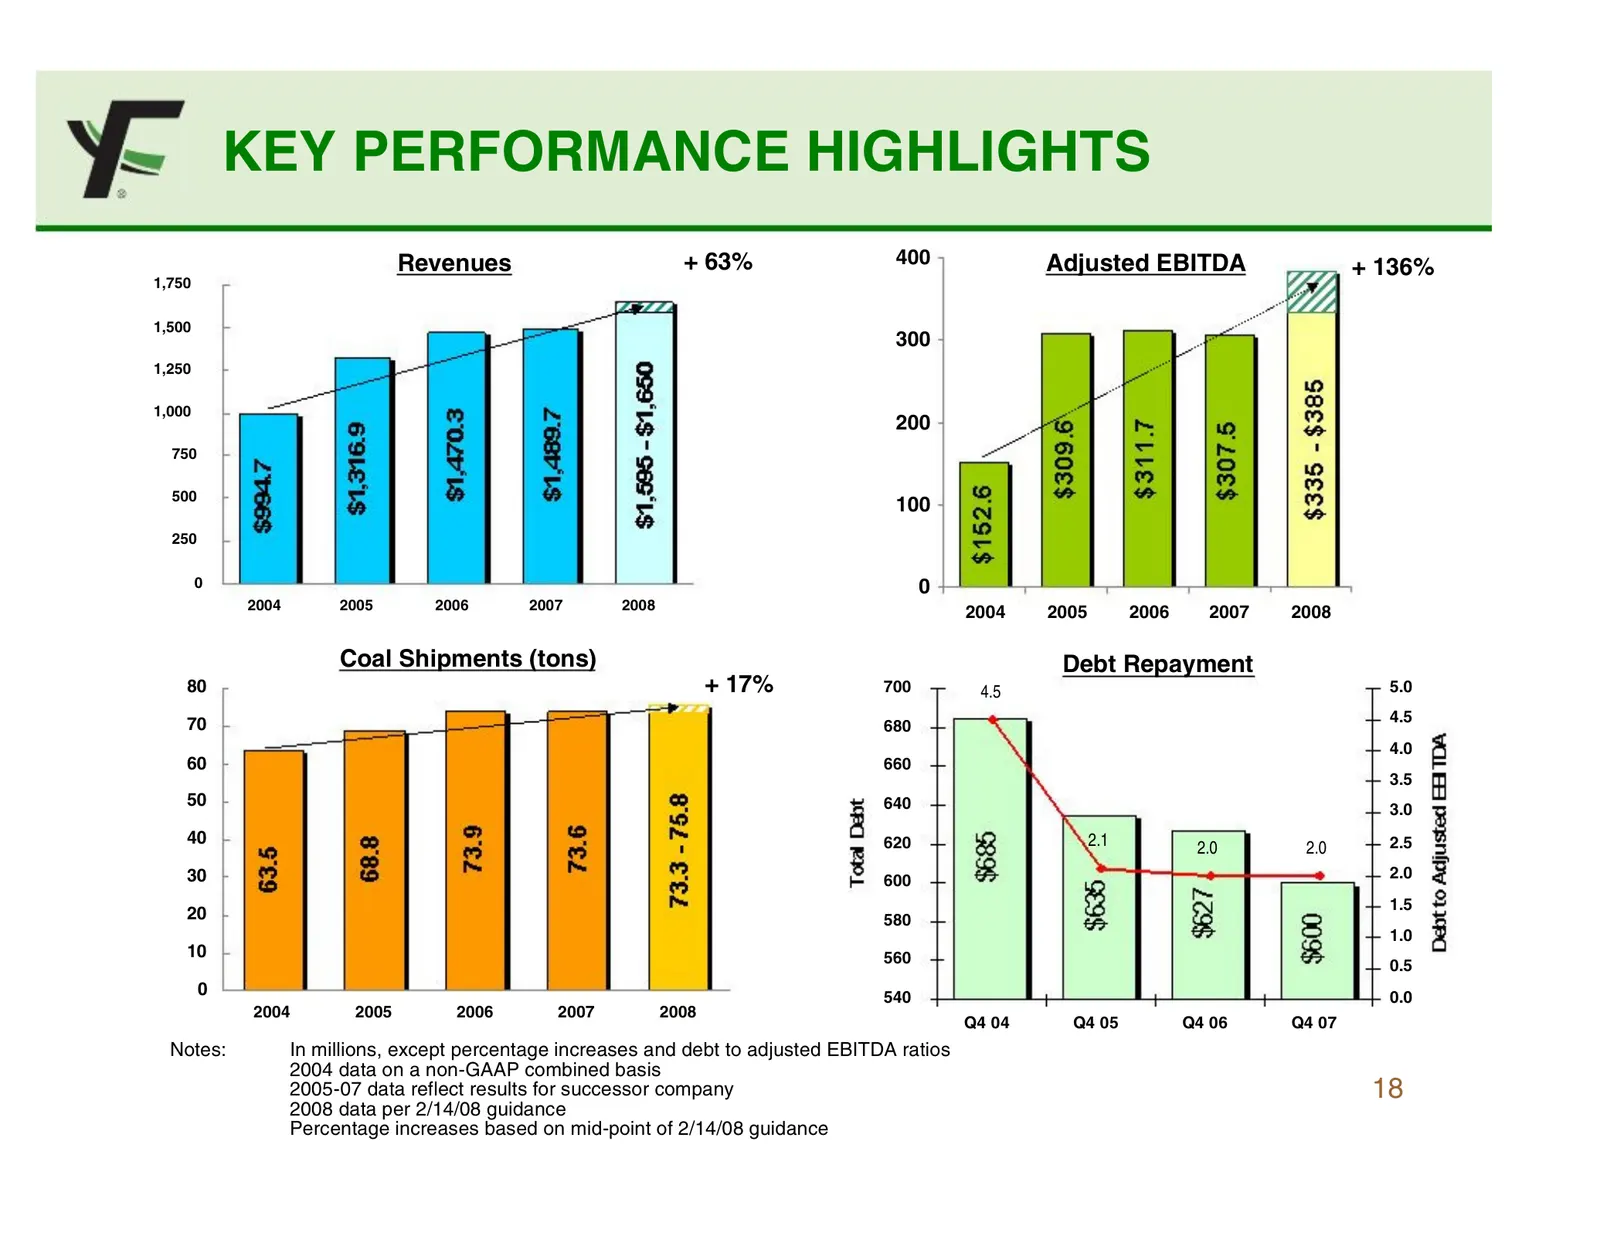
KEY PERFORMANCE HIGHLIGHTS Revenues + 63% 400 Adjusted EBITDA + 136% 1,750 1,500 300 1,250 1,000 200 750 500 100 250 0 0 2004 2005 2006 2007 2008 2004 2005 2006 2007 2008 Coal Shipments (tons) Debt Repayment 80 + 17% 700 4.5 5.0 70 4.5 680 4.0 60 660 3.5 50 640 3.0 40 620 2.1 2.5 2.0 2.0 30 600 2.0
Slide 19: Industry-Leading Margins
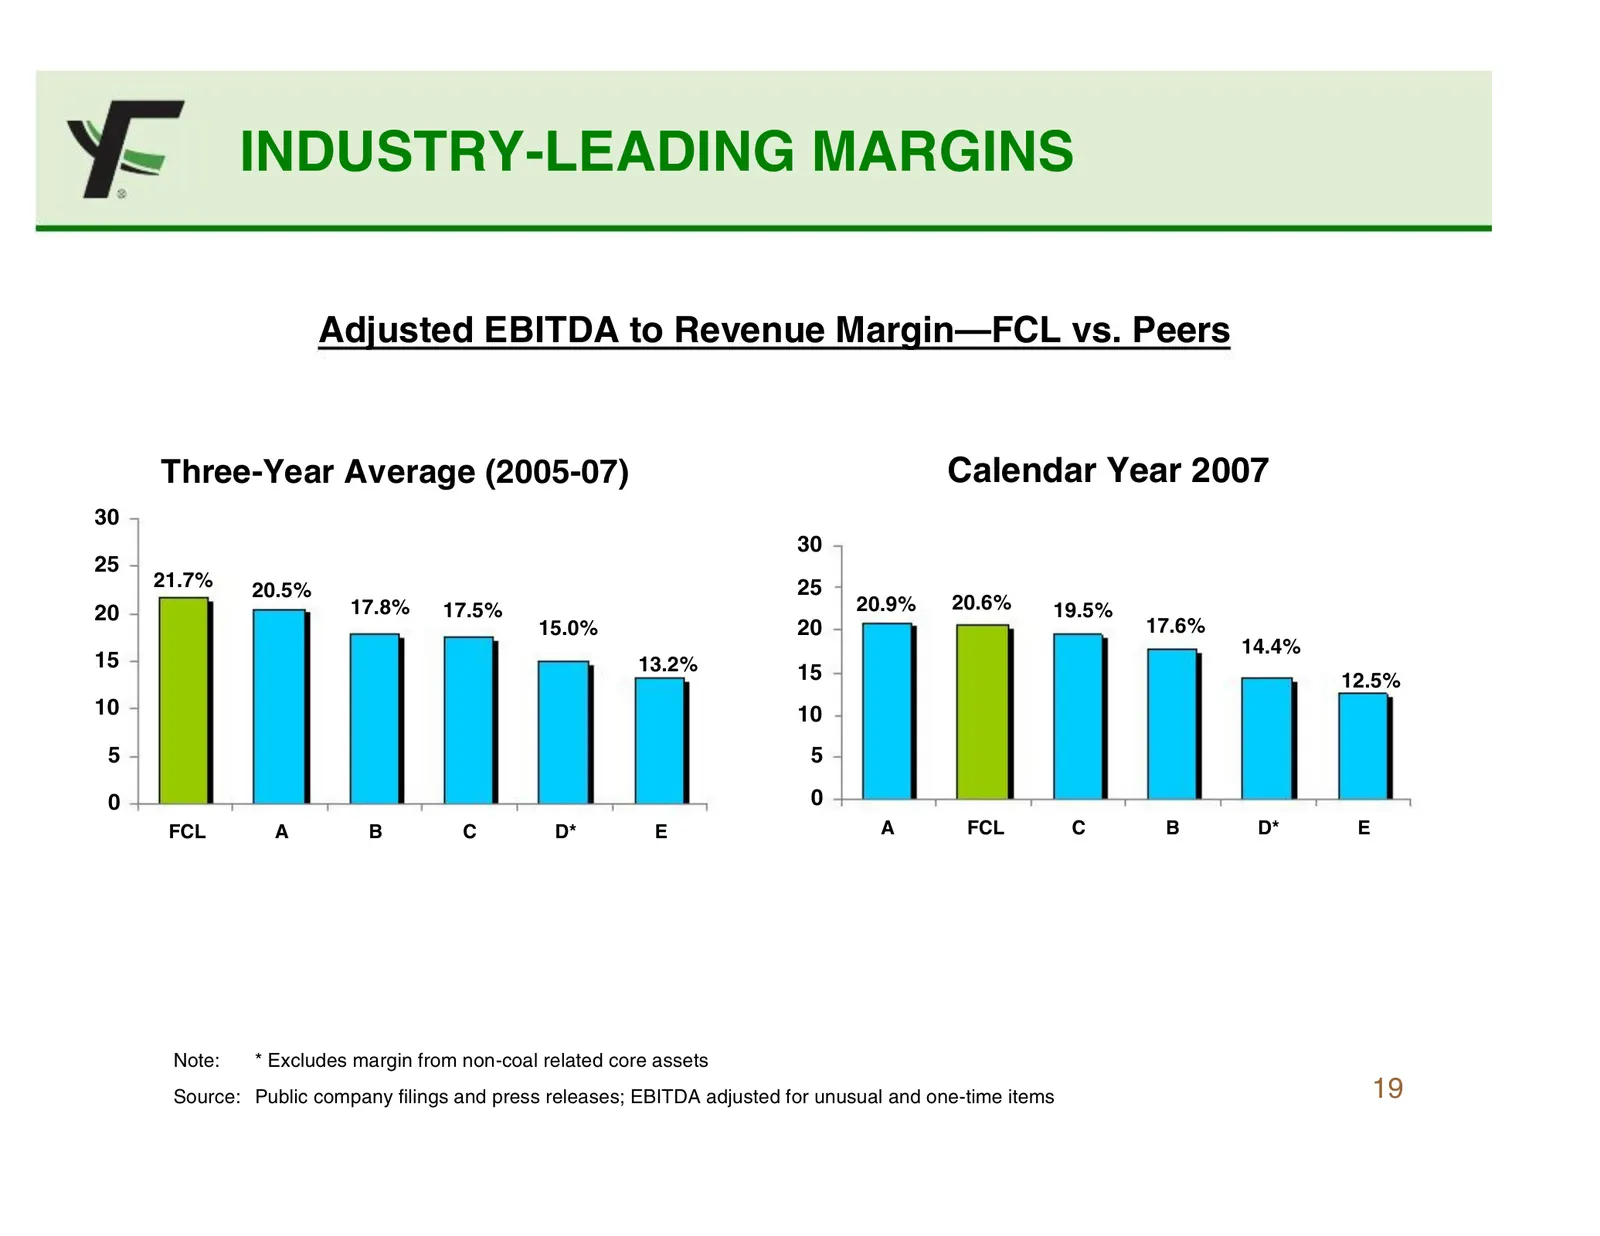
INDUSTRY-LEADING MARGINS Adjusted EBITDA to Revenue Margin—FCL vs. Peers Three-Year Average (2005-07) Calendar Year 2007 30 30 25 21.7% 25 20.5% 17.8% 17.5% 20.9% 20.6% 19.5% 20 15.0% 20 17.6% 14.4% 15 13.2% 15 12.5% 10 10 5 5 0 0 FCL A B C D* E A FCL C B D* E Note: * Excludes margin from non-coal r
Slide 20: Summary of Investment Highlights
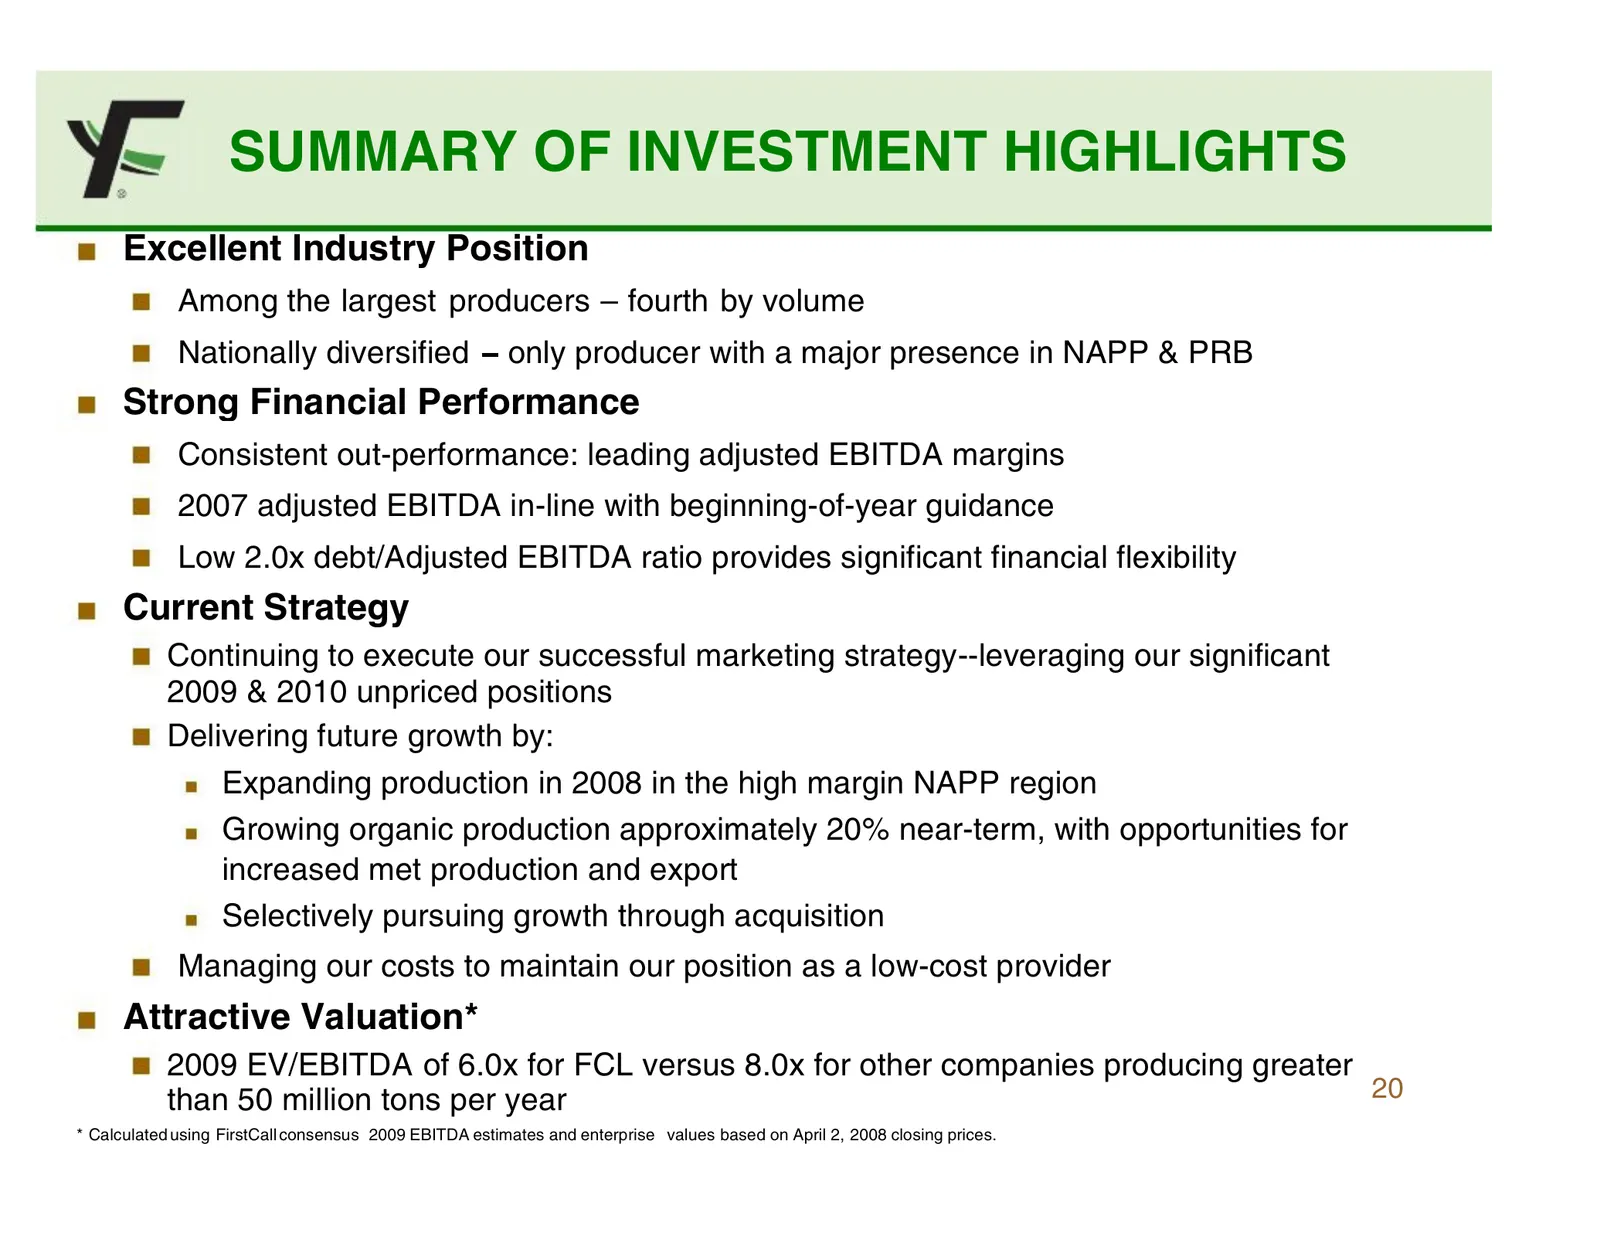
SUMMARY OF INVESTMENT HIGHLIGHTS Excellent Industry Position Among the largest producers – fourth by volume Nationally diversified – only producer with a major presence in NAPP & PRB Strong Financial Performance Consistent out-performance: leading adjusted EBITDA margins 2007 adjusted EBITDA in-line

Slide 21: Mining the Past…Powering the Future
Mining the Past…Powering the Future
Source: SEC EDGAR · 8-K filed Apr 7, 2008
More decks from Alpha Natural Resources Inc
 J.P. Morgan Global High Yield & Leveraged Finance Conference (February 2015)36 slides · Feb 23, 2015
 Barclays CEO Energy-Power Conference 201435 slides · Sep 2, 2014
 2014 BMO 23rd Global Metals and Mining Conference; Sterne Agee 2014 Boston Executive Summi33 slides · Jun 17, 2014
 2014 BMO 23rd Global Metals and Mining Conference / Brean Capital 2014 Global Resources &30 slides · May 28, 2014
 2014 BMO 23rd Global Metals and Mining Conference30 slides · Feb 24, 2014
 Tuohy Brothers' 4th Annual Energy Conference (August 2013)26 slides · Aug 5, 2013