Accuride — Deutsche Bank 2015 Leveraged Finance Conference
31 slides from Accuride's conference presentation, Sep 29, 2015

Slide 1: Industry-Leading Commercial Vehicle Products
Industry-Leading Commercial Vehicle Products Deutsche Bank 2015 Leveraged Finance Conference September 2015 accuridecorp.com
Slide 2: Forward Looking Statements
Forward Looking Statements Statements contained in this news release that are not purely historical are forward-looking statements within the meaning of Section 27A of the Securities Act of 1933, as amended, and Section 21E of the Securities Exchange Act of 1934, as amended, including statements reg
Slide 3: Opening Comments
> Opening Comments © Q2 2015 Overview e Industry Conditions ¢ Brillion Update e Accuride 2015 Priorities > Financial Results & Outlook © Q2 & YTD 2015 Results e 2015 Outlook >Summary FQKA
Slide 4: Q2 2015 Overview
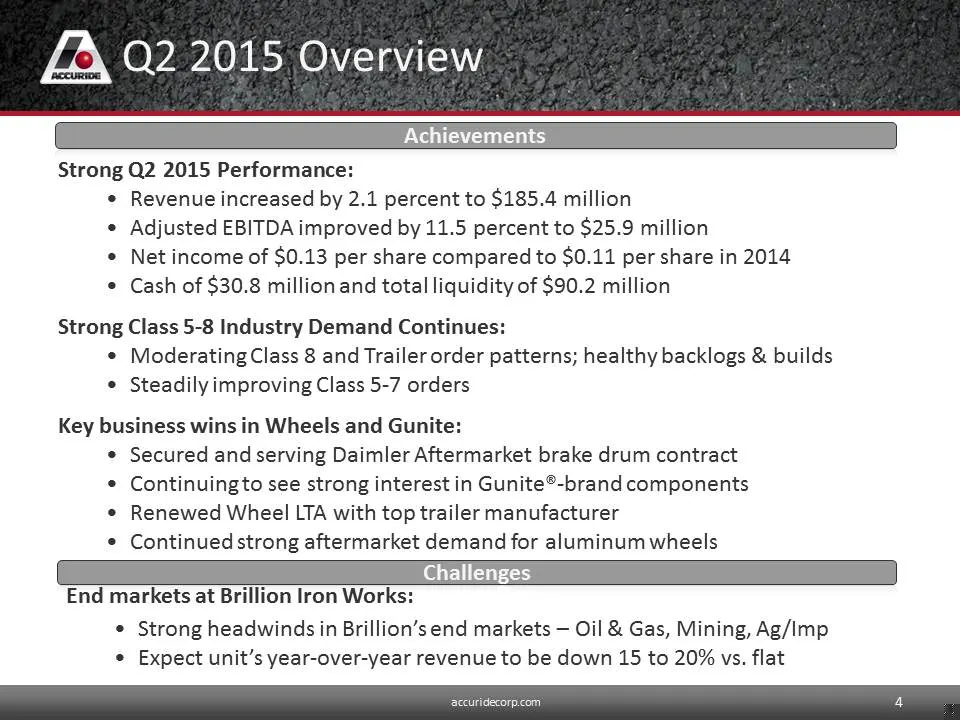
ZA Q2 2015 Overview Strong Q2 2015 Performance: © Revenue increased by 2.1 percent to $185.4 million © Adjusted EBITDA improved by 11.5 percent to $25.9 million * Net income of $0.13 per share compared to $0.11 per share in 2014 © Cash of $30.8 million and total liquidity of $90.2 million Strong Cla
Slide 5: Class 5-8 Industry Indicators are Positive
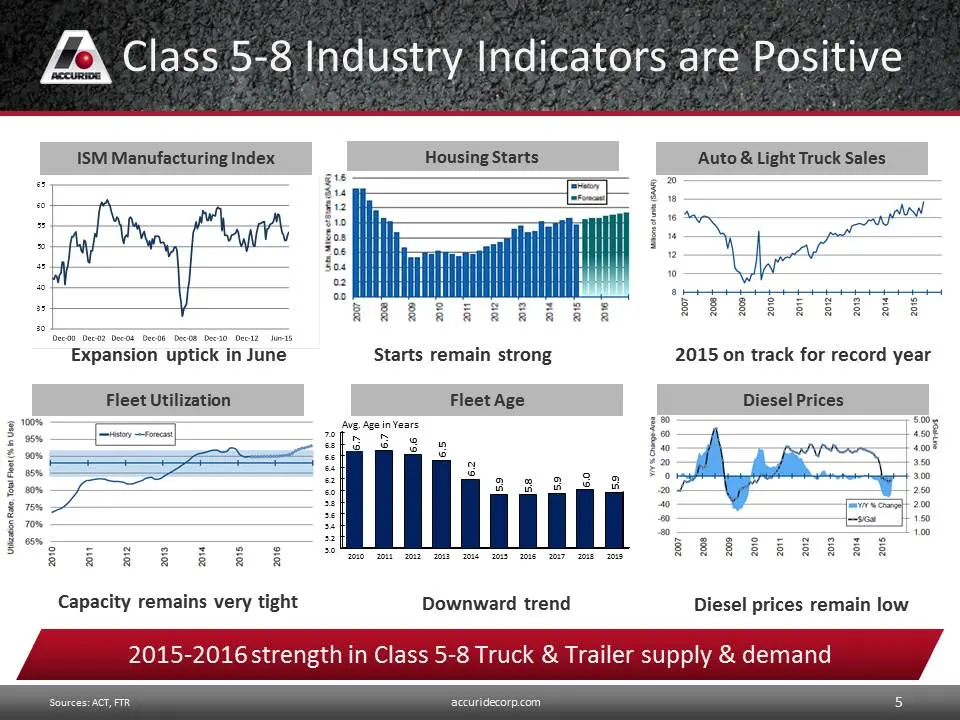
ZB Class 5-8 Industry Indicators are Positive ISM Manufacturing Index Housing Starts Auto & Light Truck Sales "T if mal ‘pp bi abe? sz ee Expansion uptick in June Starts remain strong 2015 on track for record year Fleet Utilization Fleet Age Diesel Prices z avg. Age in Years a soe : ie tar H "3 2 :
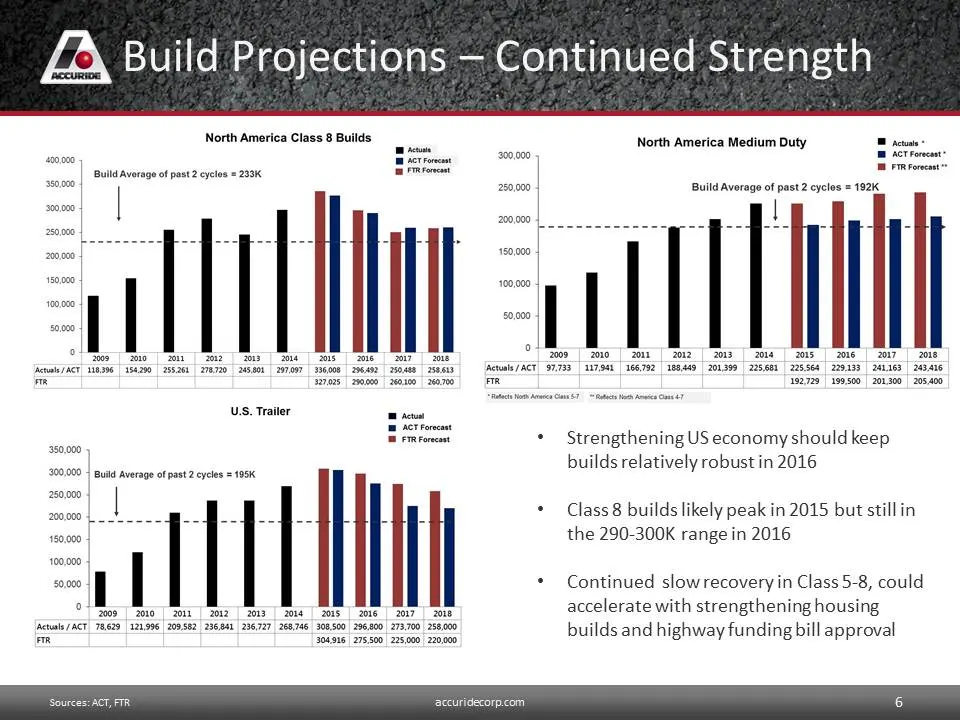
Slide 6: Build Projections — Continued Strength
Build Projections — Continued Strength North America Class 8 Builds Bult Average of past 2 cycles = 298K TULL US. Trailer 1 setrerent 250000 SEEN ecer 300.000 | gud Average of past 2eyces = 198K 250.000 | 200000 | 180.000 | “ALM ep | 2010 | 2011 | 2012 | 2019 | 2014 | 2015 | 2016 | 2017 | me ‘Atuls/
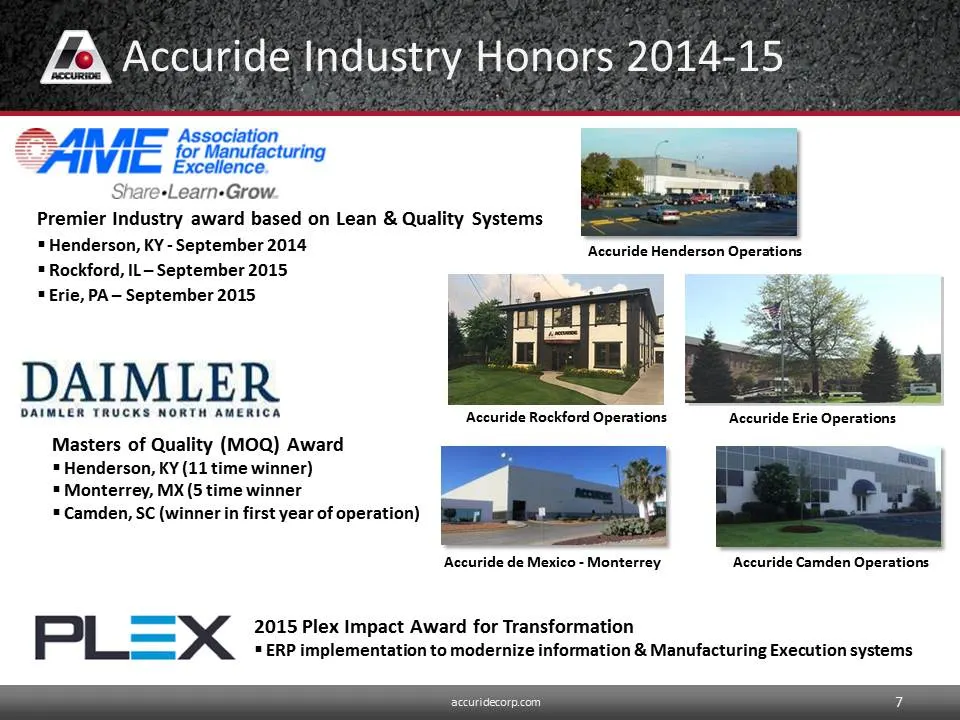
Slide 7: Accuride Industry Honors 2014-15
ZB Accuride Industry Honors 2014-15 Share+Learn-Grow. Premier Industry award based on Lean & Quality Systems = Henderson, KY - September 2014 * Rockford, IL—- September 2015 Erie, PA— September 2015 DAIMLER DAIMLER TRUCKS NORTH AMERICA Accuride Henderson Operations ‘Accuride Rockford Operations Accu
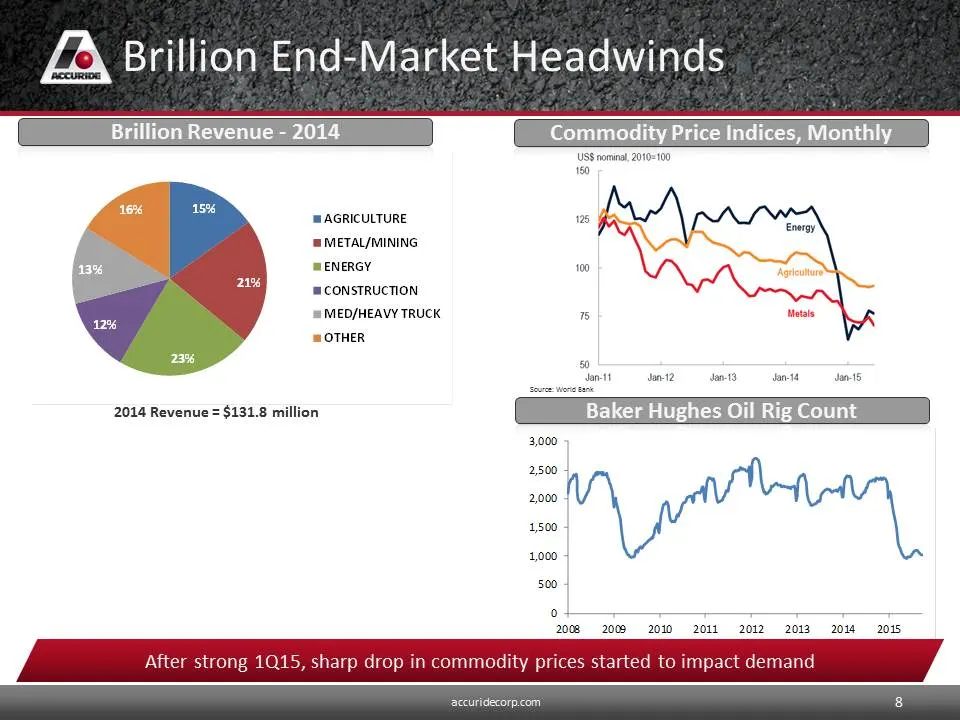
Slide 8: Brillion End-Market Headwinds
AA Brillion End-Market Headwinds Bi in Revenue - 2014 Commo: Price Indices, Monthly USS nominal, 2010100, 160 ‘AGRICULTURE us | BMETAL/MINING mENERGY wo ‘CONSTRUCTION | MED/HEAVY TRUCK 1% OTHER # ee 2014 Revenue = $131.8 million Baker Hughes Oil Rig Count 3,000 2500 4 2,000 1500 | 1000 4 500 2008 20
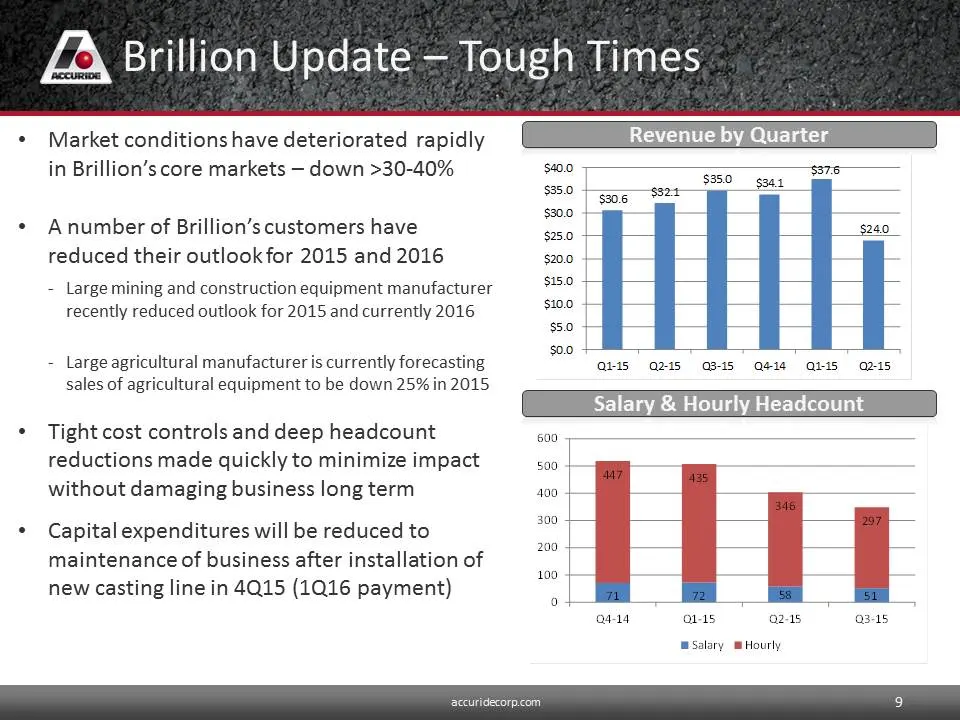
Slide 9: Brillion Update — Tough Times
Brillion Update — Tough Times * Market conditions have deteriorated rapidly in Brillion’s core markets — down >30-40% * Anumber of Brillion’s customers have reduced their outlook for 2015 and 2016 - Large mining and construction equipment manufacturer recently reduced outlook for 2015 and currently
Slide 10: New Disa 250-C
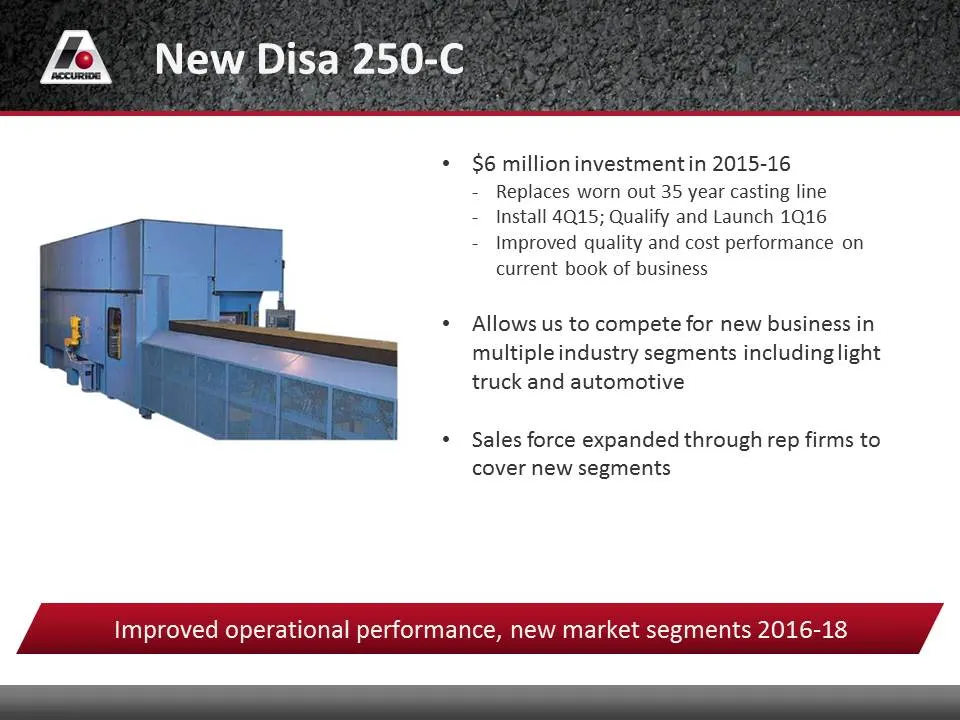
New Disa 250-C * $6 millioninvestmentin 2015-16 - Replaces worn out 35 year casting line - Install 4Q15; Qualify and Launch 1Q16 - Improved quality and cost performance on current book of business « Allows us to compete for new business in multiple industry segments including light truck and automot
Slide 11: 2015 Priorities
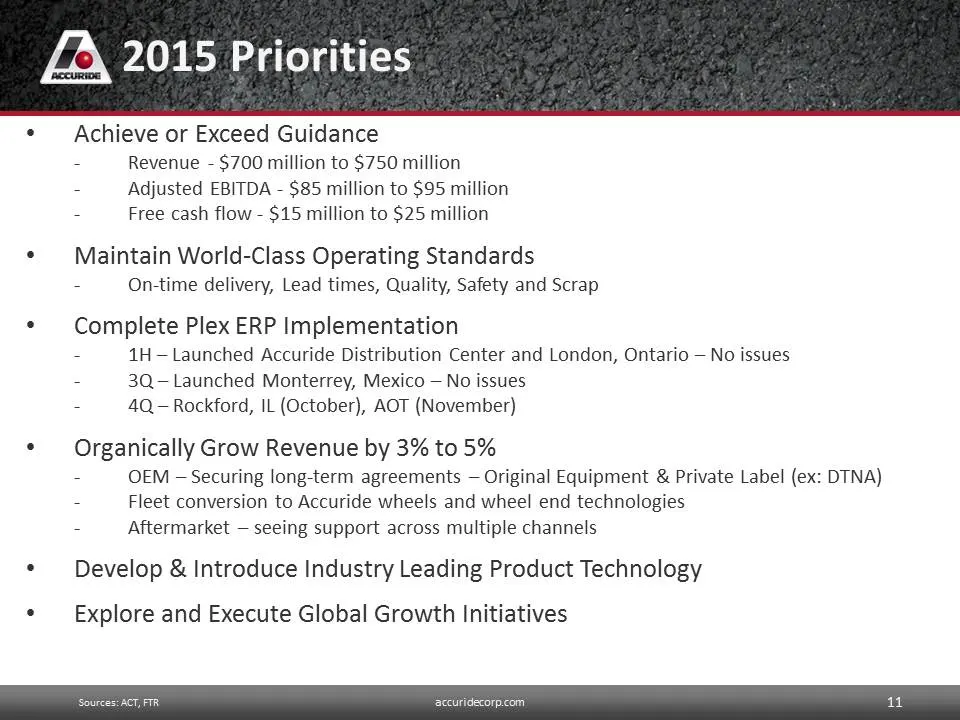
2015 Priorities Achieve or Exceed Guidance s Revenue - $700 million to $750 million 2 Adjusted EBITDA - $85 million to $95 million © Free cash flow - $15 million to $25 million Maintain World-Class Operating Standards - On-time delivery, Lead times, Quality, Safety and Scrap Complete Plex ERP Implem
Slide 12: Q2 2015 Results
Q2 2015 Results
Slide 13: 2nd Quarter Results
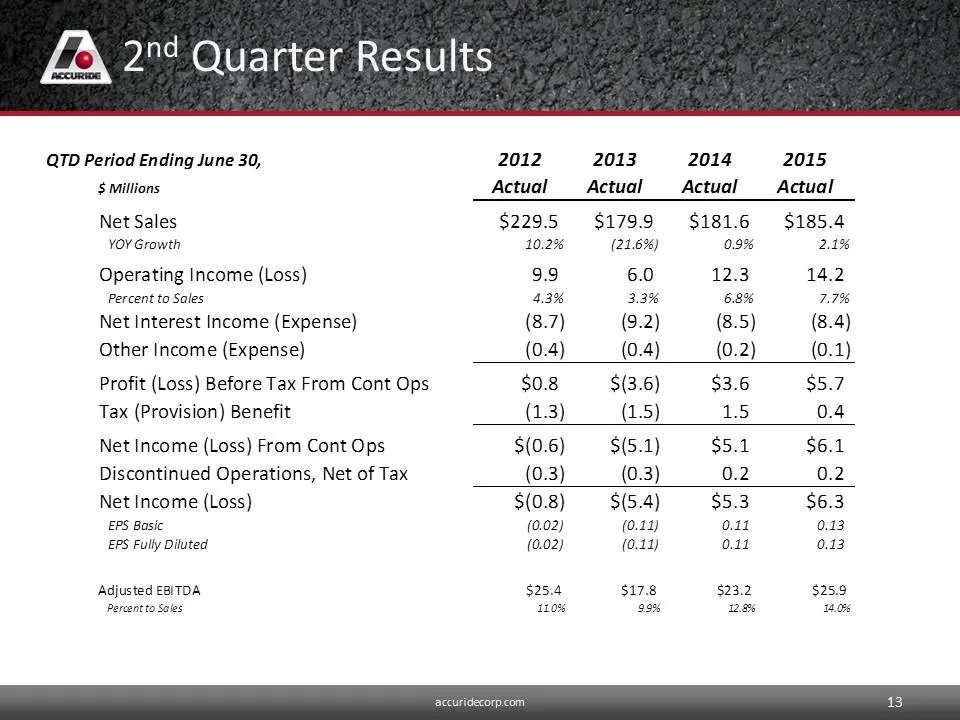
2°¢ Quarter Results QTD Period Ending June 30, 2012 2013 2014 2015 $ Millions Actual Actual Actual Actual Net Sales $229.5 $1799 $181.6 $185.4 YOY Growth 10.2% (21.6%) 0.9% 2.1% Operating Income (Loss) 99 6.0 12.3 14.2 Percent to Sales 4.3% 3.3% 6.8% 7.7% Net Interest Income (Expense) (8.7) (9.2) (8
Slide 14: YTD Results
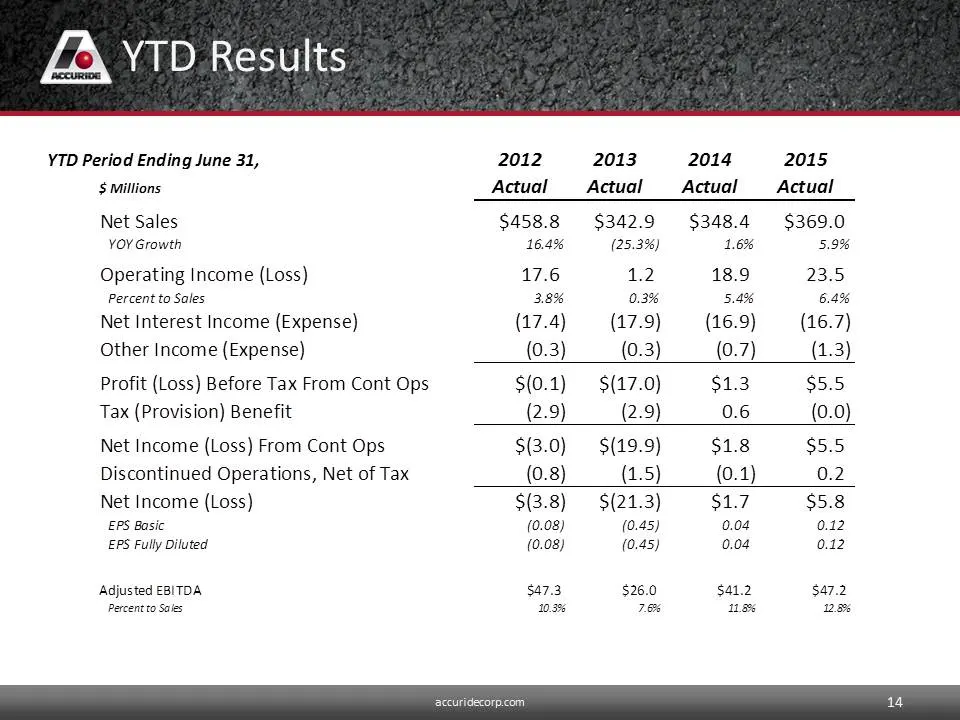
YTD Results YTD Period Ending June 31, 2012 2013 2014 2015 $ Millions Actual Actual Actual Actual Net Sales $458.8 $342.9 $348.4 $369.0 YOY Growth 16.4% (25.3%) 1.6% 5.9% Operating Income (Loss) 17.6 12 18.9 23.5; Percent to Sales 3.8% 0.3% 5.4% 6.4% Net Interest Income (Expense) (17.4) (17.9) (16.9
Slide 15: Consolidated Results
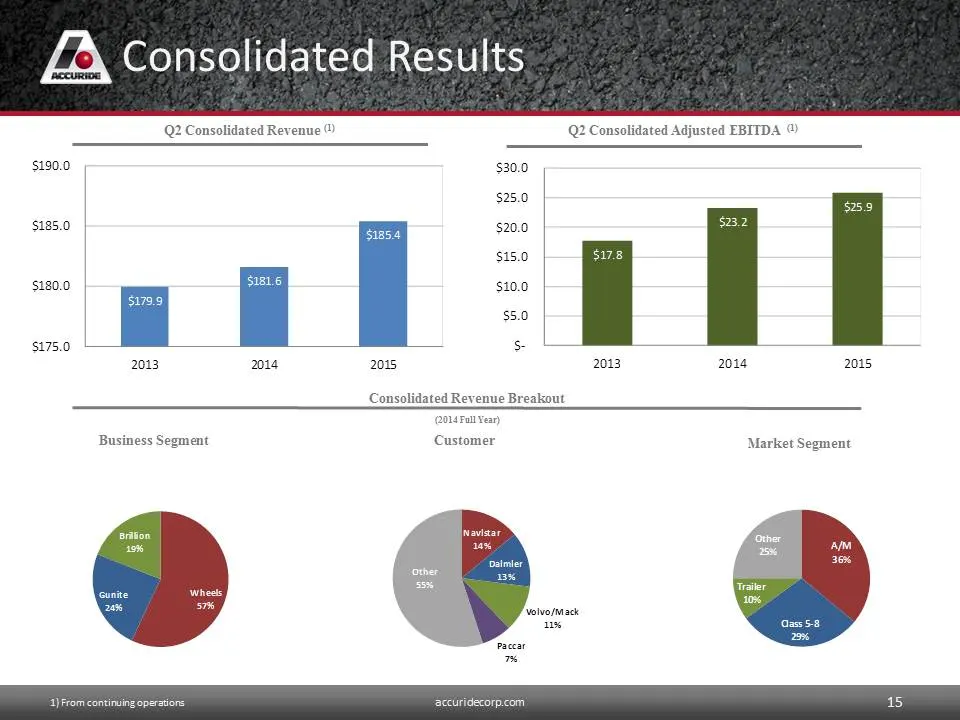
Consolidated Results Q2 Consolidated Revenue ® Q2 Consolidated Adjusted EBITDA ©) $190.0 $30.0 $25.0 $185.0 r ] $20.0 $15.0 si8o.0 | A $10.0 $5.0 $175.0 L LL 2013 2014 2015 2013 2014 2015 Consolidated Revenue Breakout (2014 Fall Year) Business Segment Customer Market Segment 15
Slide 16: Wheels & Gunite Segments
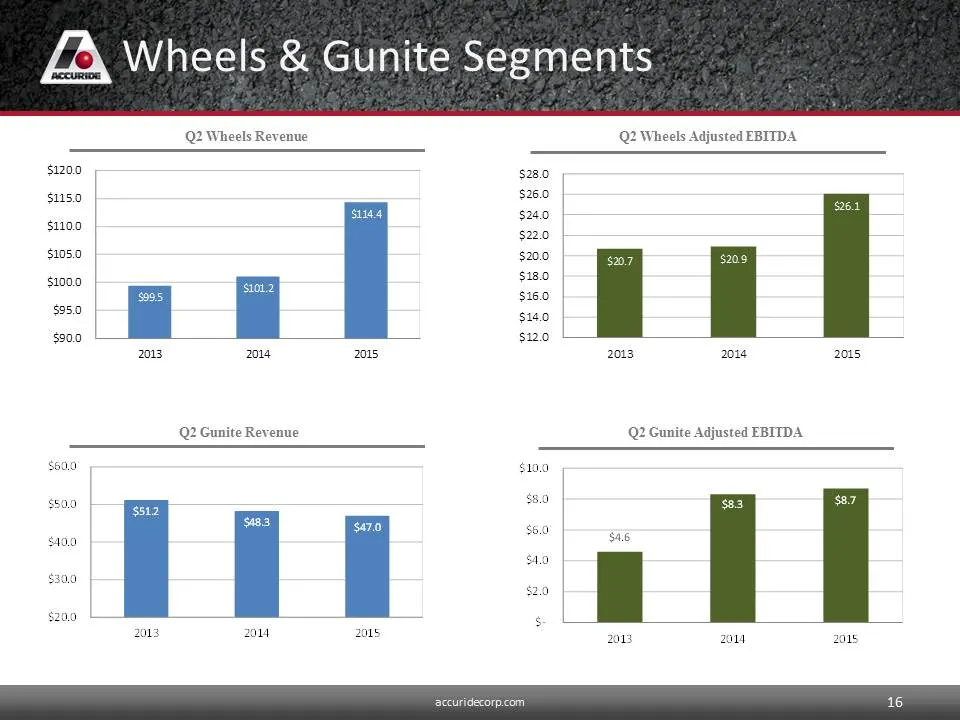
Wheels & Gunite Segments Q2 Wheels Revenue Q2 Wheels Adjusted EBITDA $1209 $28.0 suso $26.0 s $240 $110.9 eo $1089 $200 sio00 : $180 $160 50 $140 $09 i . $120 2013 204 2015 2013 2014 2018 Q2 Gunite Revenue Q2 Gunite Adjusted EBITDA S199 ‘ sso nes $87 a $6.0 : S48 so 201s ou 2ais 16
Slide 17: Brillion Segment
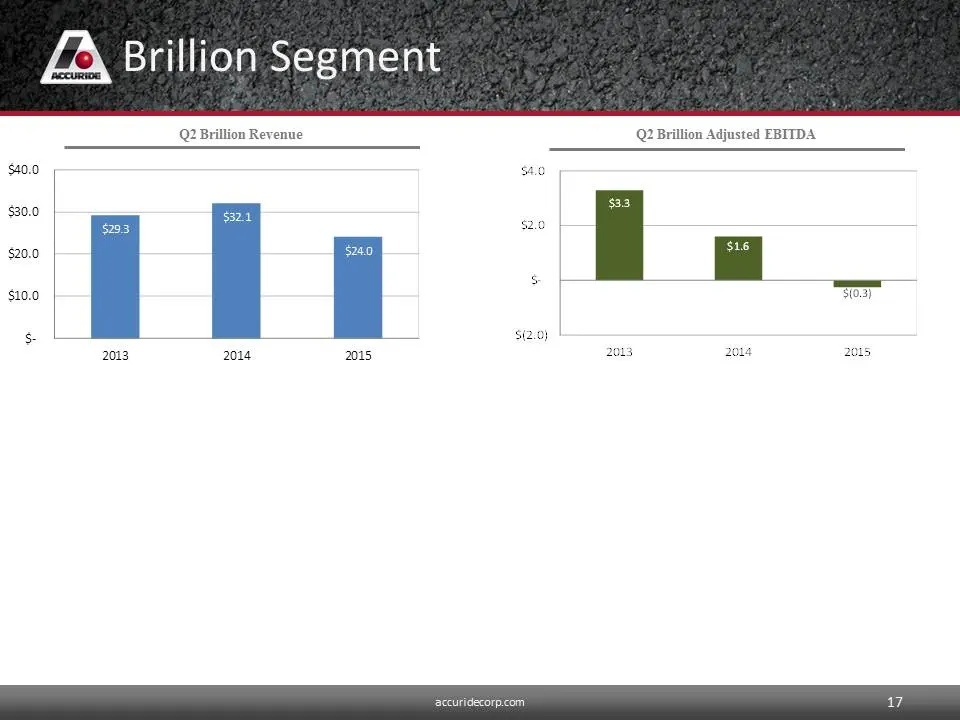
Brillion Segment Q2 Brillion Revenue Q2 Brillion Adjusted EBITDA $40.0 $30.0 s200 | + — $10.0 S02) S 2013 2014 2015 2013, 2018 2013 17
Slide 18: Trade Working Capital
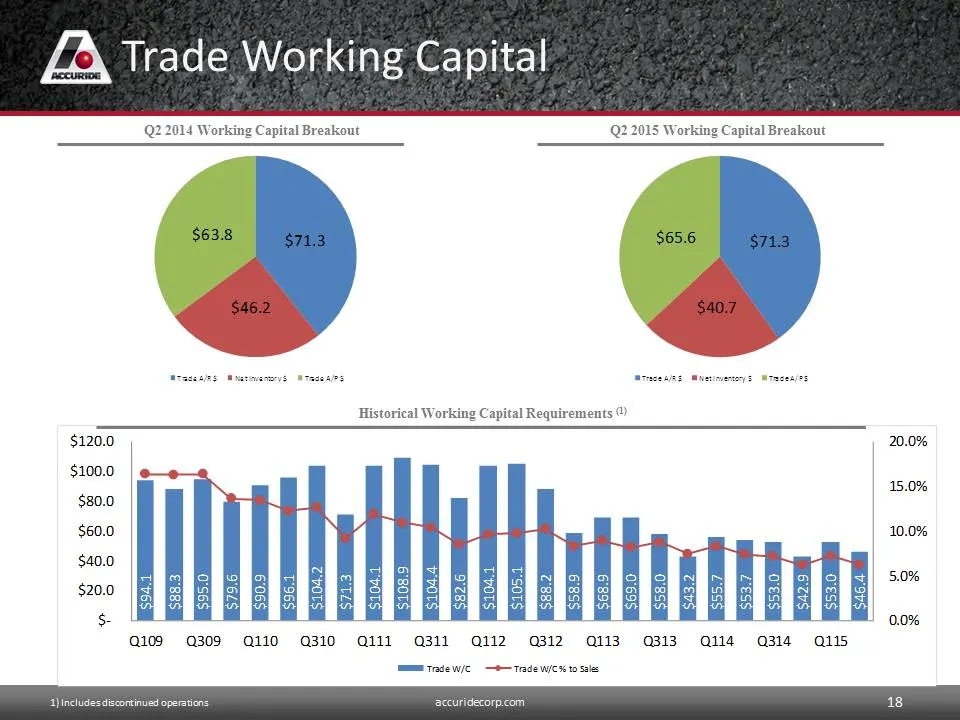
AA Trade Working Capital 2 2014 Wor g Capital Breakout Q2.2015 Working Capital Breakout Q109 Q309 Q110 Q310 Q111 311 Q1i2 312 113. 0313 Qil4 a314_ quis mm Trade w/c —#— Trade wick to Sale 1) Includes discontinued operat pcom 20.0% 15.0% 10.0% 5.0%
Slide 19: Free Cash Flow
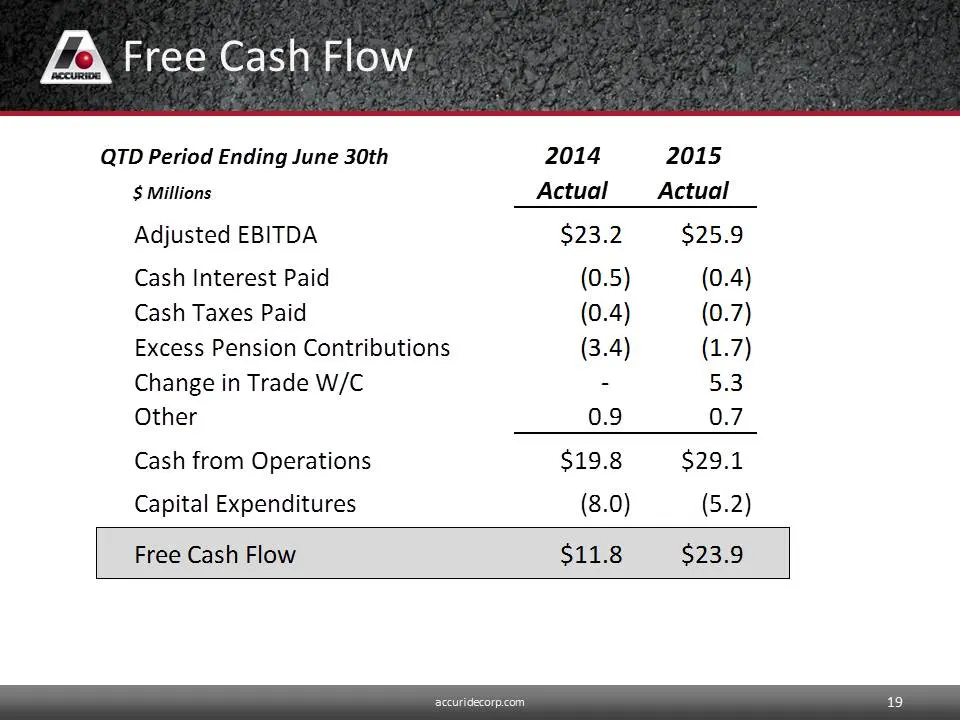
Free Cash Flow QTD Period Ending June 30th 2014 2015 $ Millions Actual Actual Adjusted EBITDA $23.2 $25.9 Cash Interest Paid (0.5) (0.4) Cash Taxes Paid (0.4) (0.7) Excess Pension Contributions (3.4) (1.7) Change in Trade W/C - 5:3 Other 0.9 0.7 Cash from Operations $19.8 $29.1 Capital Expenditures
Slide 20: 2015 Outlook
2015 Outlook
Slide 21: 2015 Full Year Guidance
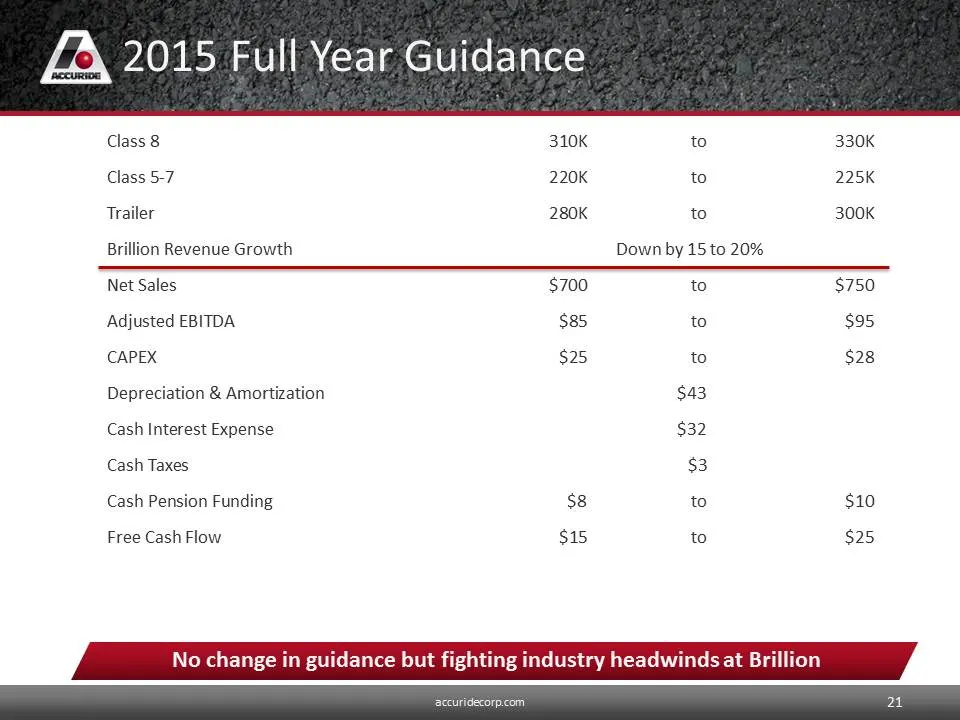
ZA 2015 Full Year Guidance Class 8 310K to 330K Class 5-7 220K to 225K Trailer 280K to 300K Brillion Revenue Growth Down by 15 to 20% Net Sales $700 to $750 Adjusted EBITDA $85 to $95 CAPEX $25 to $28 Depreciation & Amortization $43 Cash Interest Expense $32 Cash Taxes $3 Cash Pension Funding $8 to
Slide 22: Summary
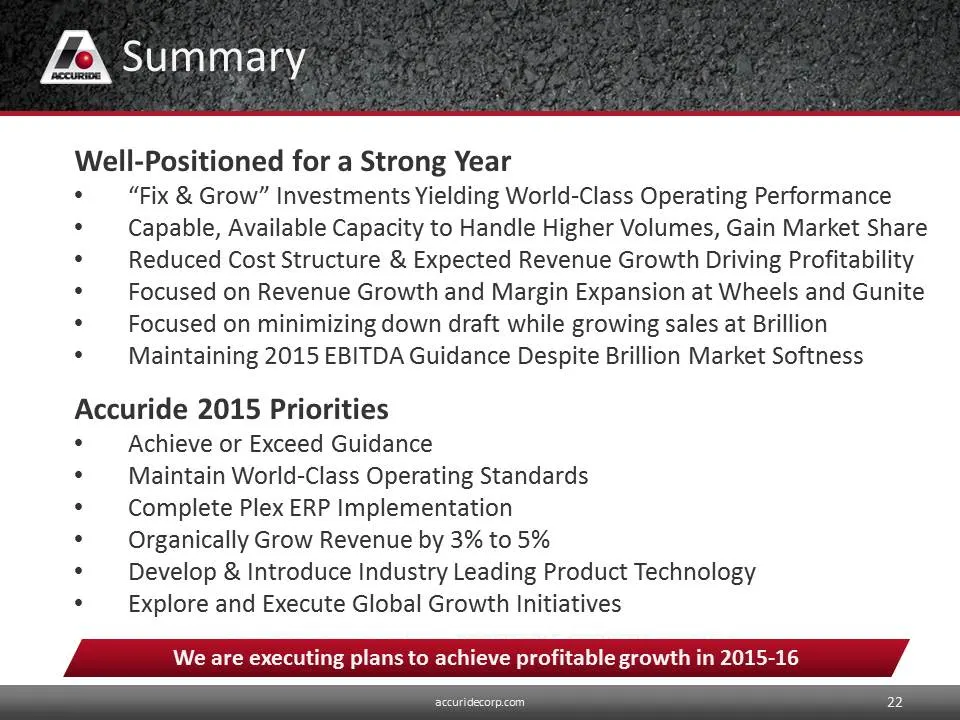
ZA Summary Well-Positioned for a Strong Year “Fix & Grow” Investments Yielding World-Class Operating Performance Capable, Available Capacity to Handle Higher Volumes, Gain Market Share Reduced Cost Structure & Expected Revenue Growth Driving Profitability Focused on Revenue Growth and Margin Expansi
Slide 23: Questions
Questions
Slide 24: Appendix
Appendix
Slide 25: Segment Revenue
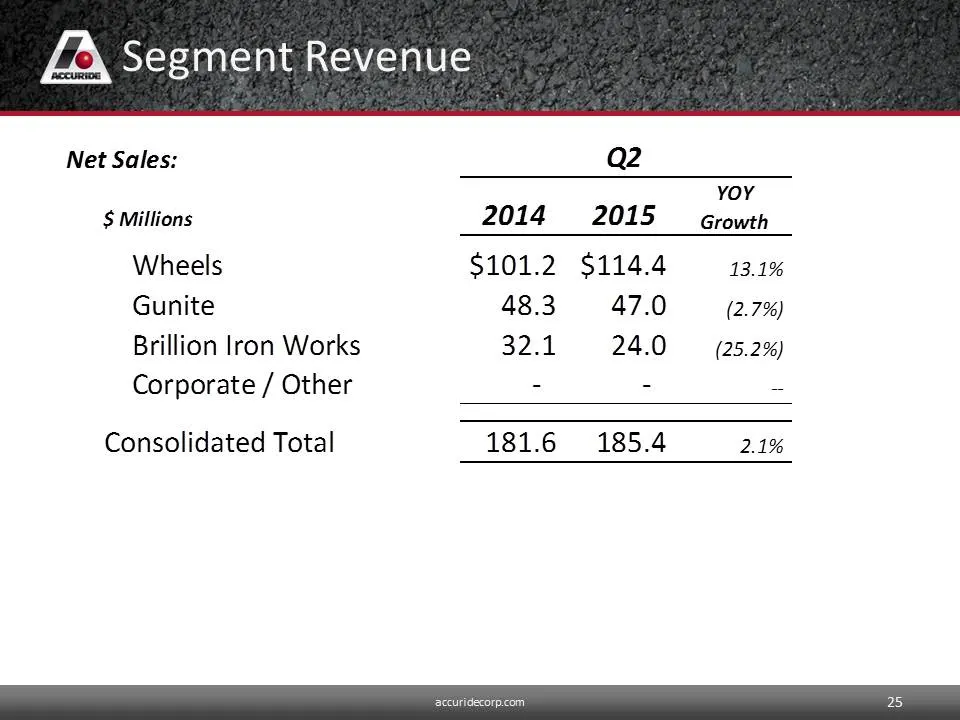
Segment Revenue Net Sales: Q2 yoy $ Millions 2014 2015 Growth Wheels $101.2 $114.4 13.1% Gunite 48.3 47.0 (2.7%) Brillion lron Works 32.1 24.0 = (25.2%) Corporate / Other - - Consolidated Total 181.6 185.4 2.1% accuridecorp.com 25
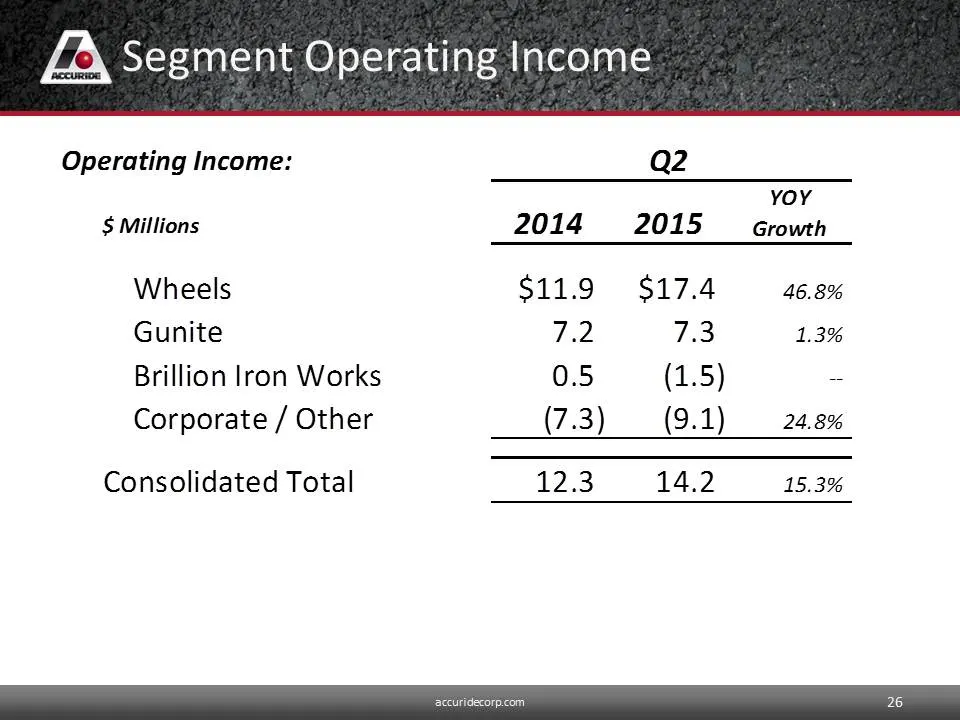
Slide 26: Segment Operating Income
Segment Operating Income Operating Income: Q2 YOY $ Millions 2014 2015 Growth Wheels $11.9 $17.4 46.8% Gunite Wad, 7.3 1.3% Brillion Iron Works 0.5 (1.5) = Corporate / Other (7.3) (9.1) 24.8% Consolidated Total 123 14.2 15.3%
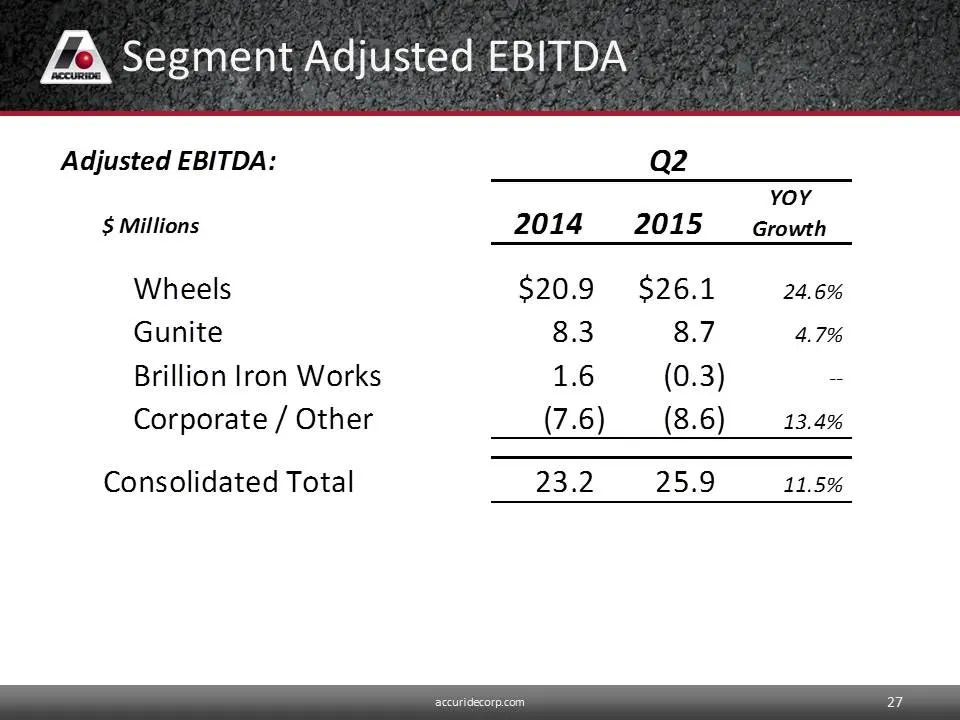
Slide 27: Segment Adjusted EBITDA
Segment Adjusted EBITDA Adjusted EBITDA: Q2 YOY $ Millions 2014 2015 Growth Wheels $20.9 $26.1 24.6% Gunite 8.3 8.7 4.7% Brillion Iron Works 1.6 (0.3) = Corporate / Other (7.6) (8.6) 13.4% Consolidated Total 23.2 25.9 11.5%
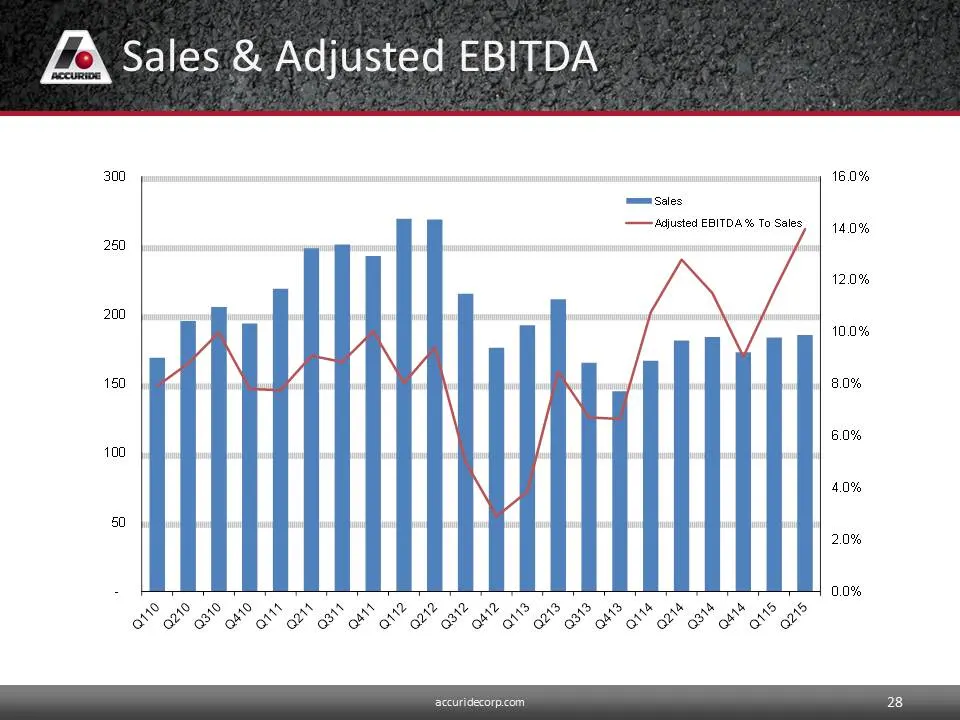
Slide 28: Sales & Adjusted EBITDA
Sales & Adjusted EBITDA 300 16.0% Sales | Adjusted EBITDA % To Sales, | 14 996 250 120% 200 10.0% 160 8.0% 6.0% 100 4.0% 60 2.0% : 0.0%
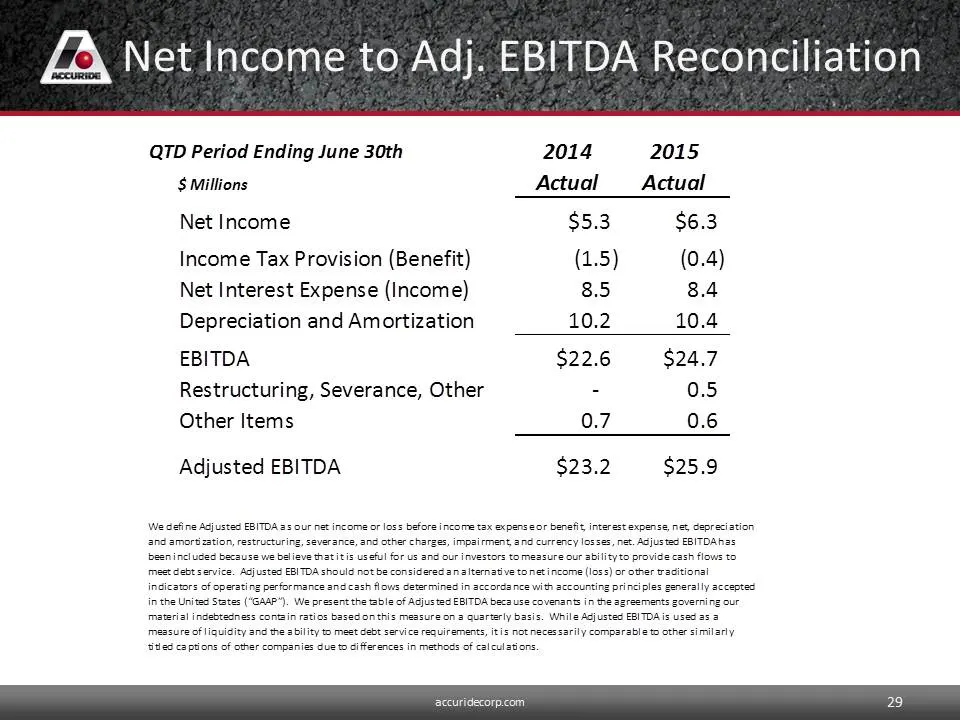
Slide 29: Net Income to Adj. EBITDA Reconciliation
Net Income to Adj. EBITDA Reconciliation QTD Period Ending June 30th 2014 2015 $ Millions Actual Actual Net Income $5.3 $6.3 Income Tax Provision (Benefit) (1.5) (0.4) Net Interest Expense (Income) 8.5 8.4 Depreciation and Amortization 10.2 10.4 EBITDA $22.6 $24.7 Restructuring, Severance, Other - 0
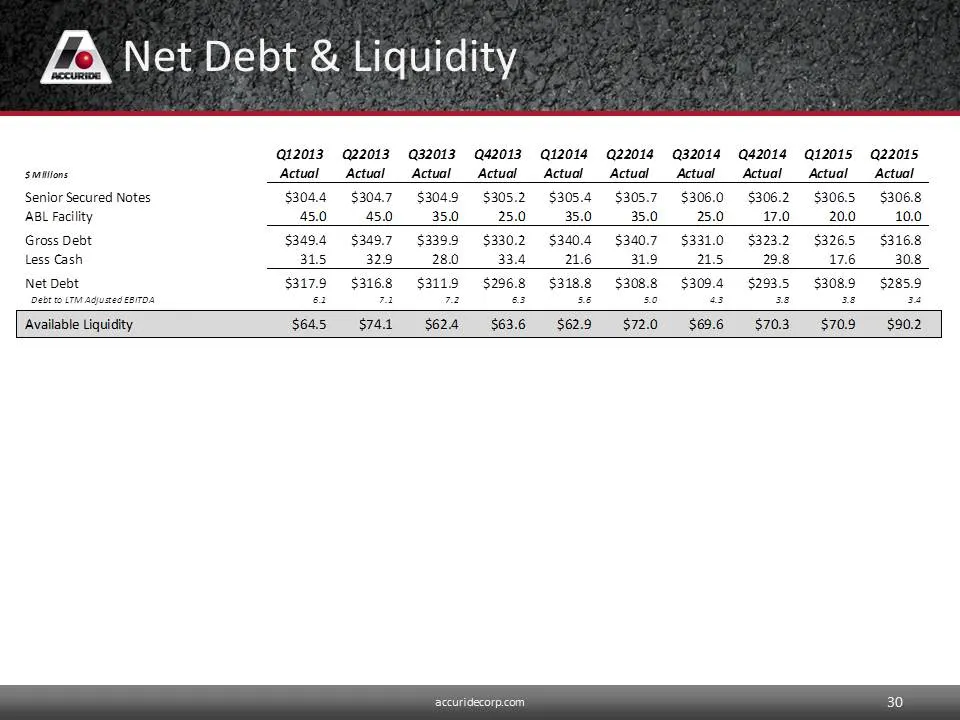
Slide 30: Net Debt & Liquidity
Net Debt & Liquidity Q12013 922013 32013 _Q42013 Q12014 Q22014 Q32014 Q42014 Q12015 Q22015 Smttions Actual Actual _Actual__Actual__Actual__Actual__Actual__Actual__Actual_Actual Senior Secured Notes $3044 $3047 $304.9 $305.2 $305.4 $305.7 $306.0 $306.2 $3065 $306.8 ABL Facility 45.0 45.0 35.0 25.0 35
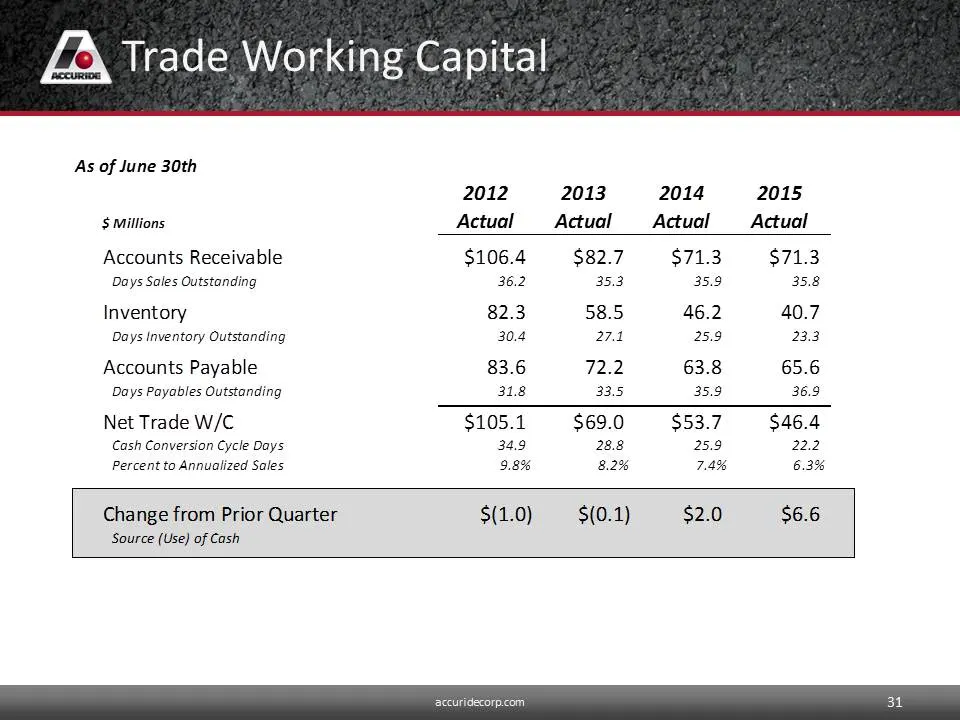
Slide 31: Trade Working Capital
AA Trade Working Capital As of June 30th 2012 2013 2014 2015 $ Millions Actual Actual —Actual_~—_—Actuall Accounts Receivable $106.4 $82.7 $71.3 $71.3 Days Sales Outstanding 36.2 35.3 35.9 35.8 Inventory 82.3 58.5 46.2 40.7 Days Inventory Outstanding 30.4 274 25.9 233 Accounts Payable 83.6 72.2 63.8
Source: SEC EDGAR · 8-K filed Sep 29, 2015
More decks from Accuride Corp
 Proxy Contest (October 2016)17 slides · Oct 26, 2016
 Q2 2016 Earnings Presentation20 slides · Jul 26, 2016
 Q1 2016 Earnings Presentation21 slides · May 3, 2016
 Q4 2015 Earnings Presentation22 slides · Feb 26, 2016
 BB&T Capital Markets 31st Annual Transportation Services Conference (February 2016)19 slides · Feb 10, 2016
 Gabelli & Co. Annual Automotive Aftermarket Symposium (November 2015)23 slides · Nov 3, 2015