Fednat — FEDERATED NATIONAL HOLDING — 22nd Annual CFANY Insurance Industry Conference (March 2018)
31 slides from Fednat's conference presentation, Mar 19, 2018
Slide 1: 22nd Annual CFANY Insurance Industry Conference
Federated National(Nasdaq: FNHC) 22ND ANNUAL CFANY INSURANCE industry conference March 19, 2018
Slide 2: Safe Harbor Statement
SAFE HARBOR STATEMENT Safe harbor statement under the Private Securities Litigation Reform Act of 1995:Statements that are not historical fact are forward-looking statements that are subject to certain risks and uncertainties that could cause actual events and results to differ materially from those
Slide 3: FNHC corporate profile
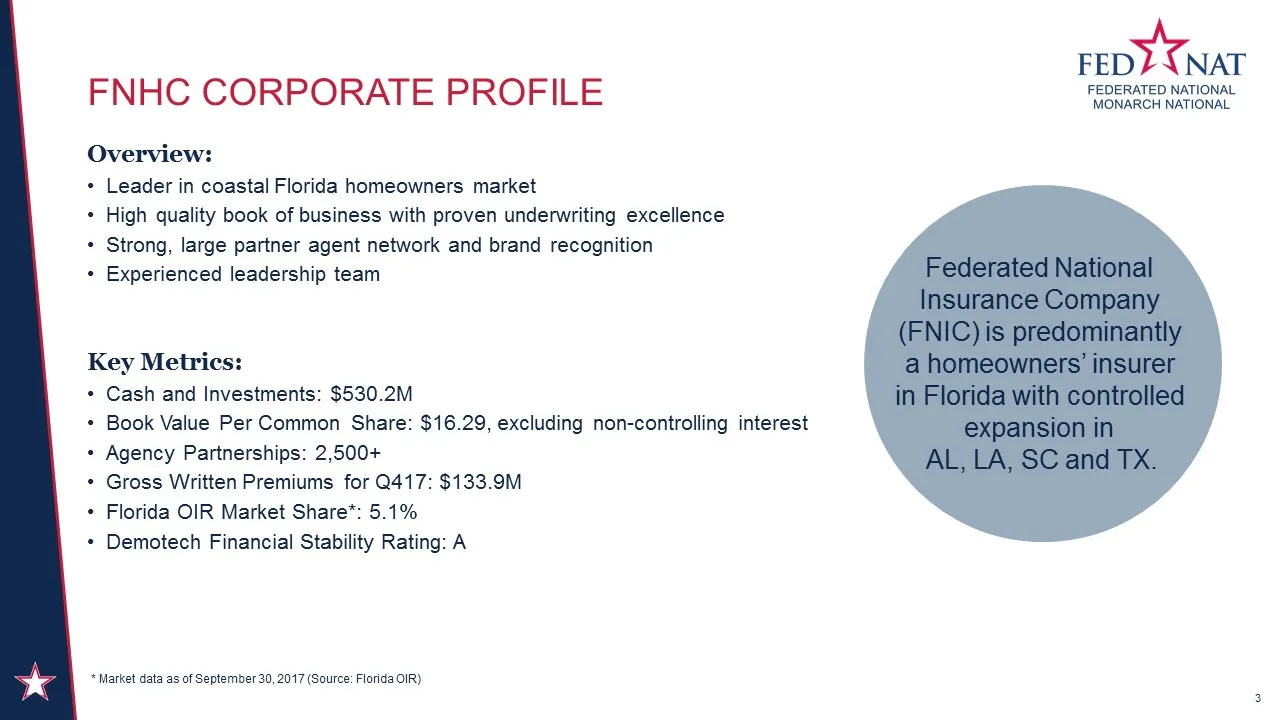
FNHC corporate profile Overview:Leader in coastal Florida homeowners marketHigh quality book of business with proven underwriting excellenceStrong, large partner agent network and brand recognitionExperienced leadership team Key Metrics:Cash and Investments: $530.2M Book Value Per Common Share: $16.
Slide 4: Long-term track record of book value growth
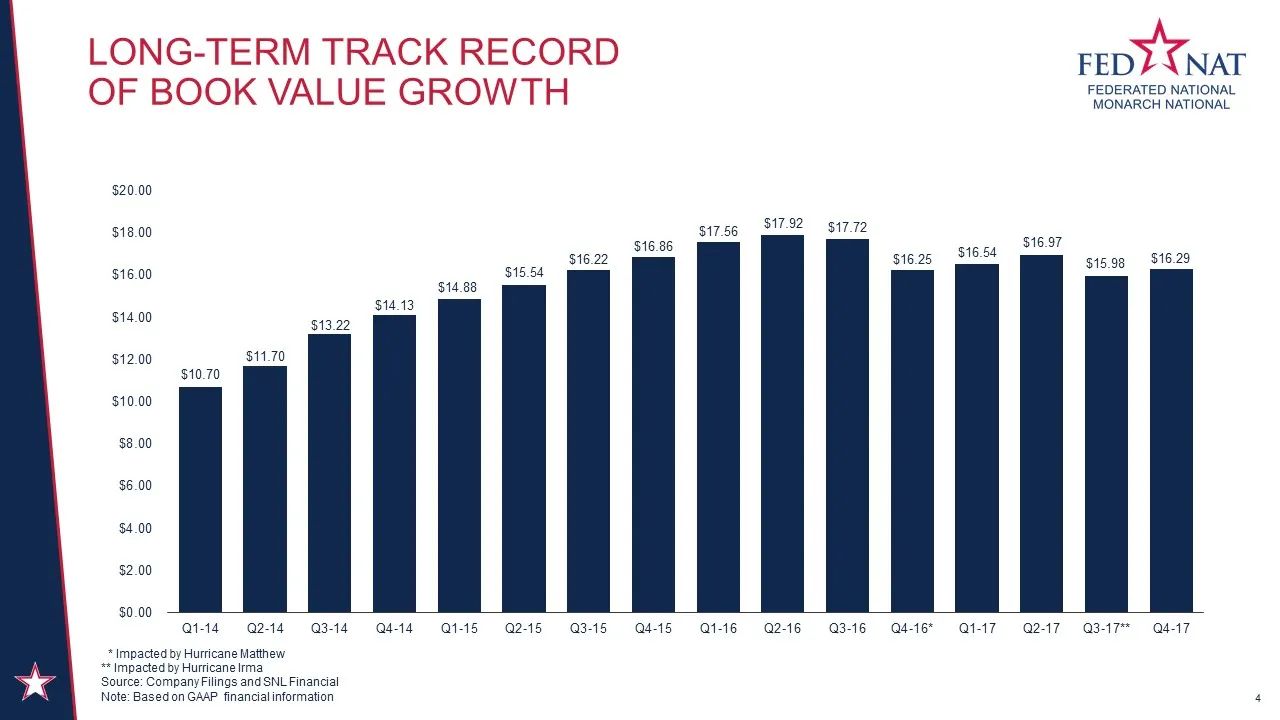
Long-term track record of book value growth 4 * Impacted by Hurricane Matthew** Impacted by Hurricane IrmaSource: Company Filings and SNL FinancialNote: Based on GAAP financial information
Slide 5: Investment Considerations
Top five position in attractive Florida market Favorable track record of GWP Significant opportunity to expand market share and diversify book Recent refocus on homeowners market Industry experience and market savvy executive team Investment Considerations 5
Slide 6: Growing Florida market share
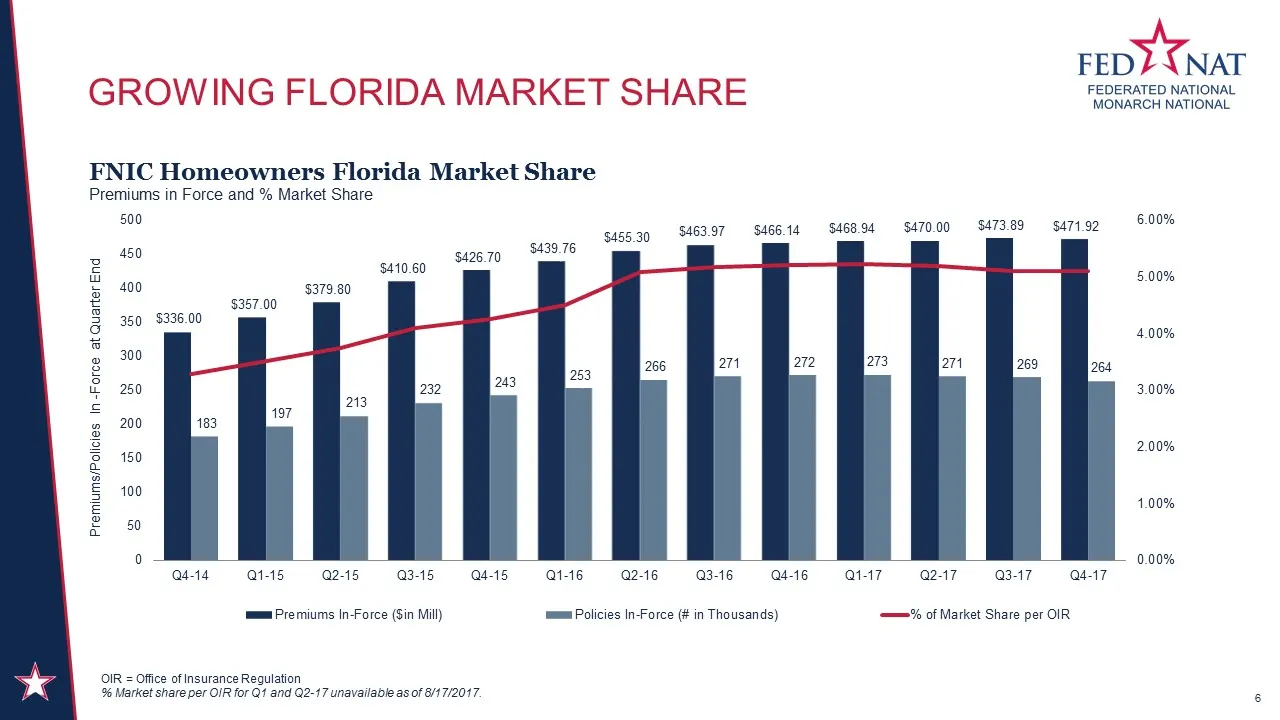
GROWING Florida MARKET SHARE 6 OIR = Office of Insurance Regulation% Market share per OIR for Q1 and Q2-17 unavailable as of 8/17/2017.
Slide 7: Florida Homeowners Market overview
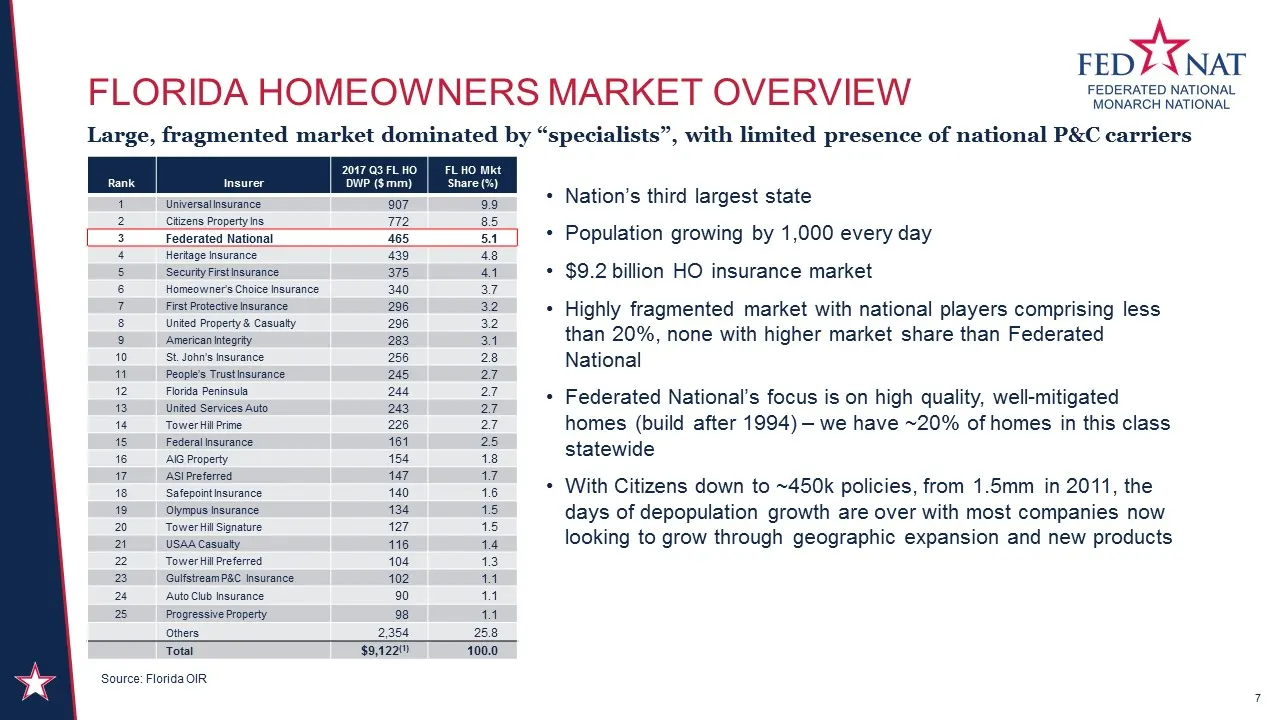
Source: Florida OIR Florida Homeowners Market overview Nation’s third largest statePopulation growing by 1,000 every day$9.2 billion HO insurance marketHighly fragmented market with national players comprising less than 20%, none with higher market share than Federated NationalFederated National’s f
Slide 8: Distribution network & strategy
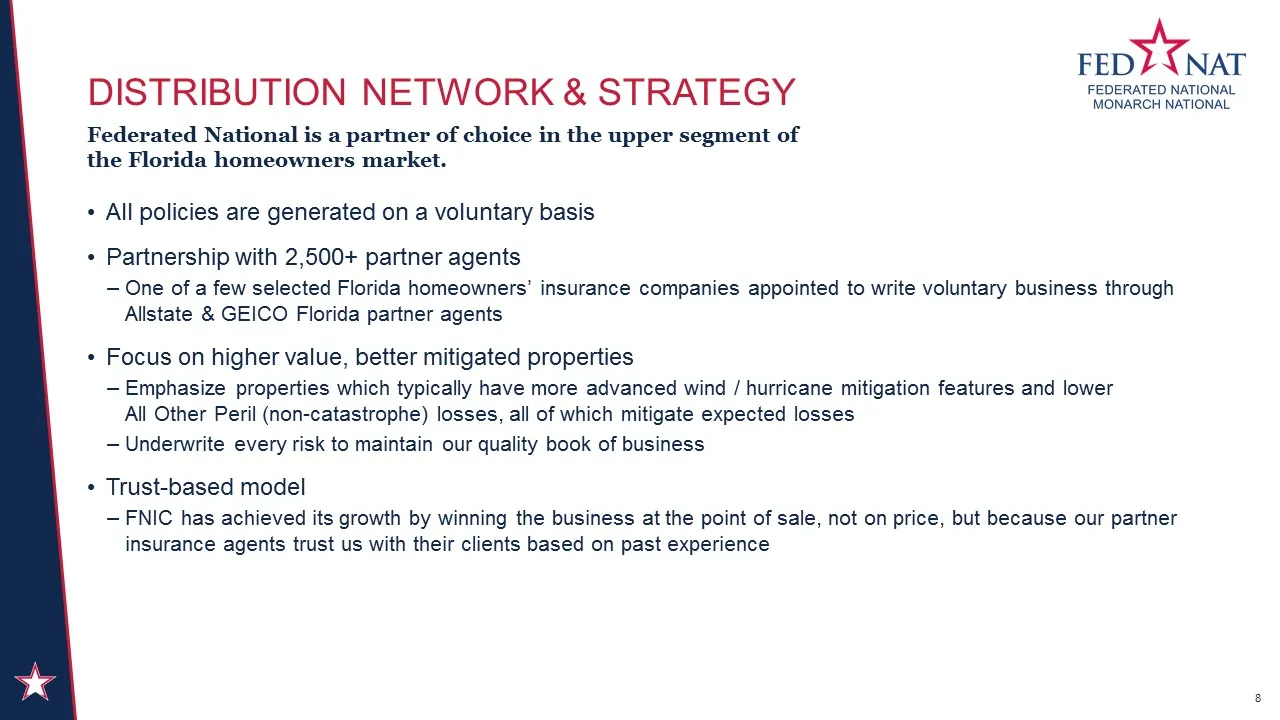
Distribution network & strategy All policies are generated on a voluntary basisPartnership with 2,500+ partner agentsOne of a few selected Florida homeowners’ insurance companies appointed to write voluntary business through Allstate & GEICO Florida partner agentsFocus on higher value, better mitiga
Slide 9: Disciplined Underwriting Approach
DISCIPLINED Underwriting Approach Focus on higher value properties with an emphasis on more advanced wind / hurricane mitigation features and lower All Other Peril (non-catastrophe) lossesUtilize a front-end Generalized Linear Model (“GLM”) to calculate each risk’s associated expenses, CAT and non-C
Slide 10: Quality Florida Homeowners' Portfolio
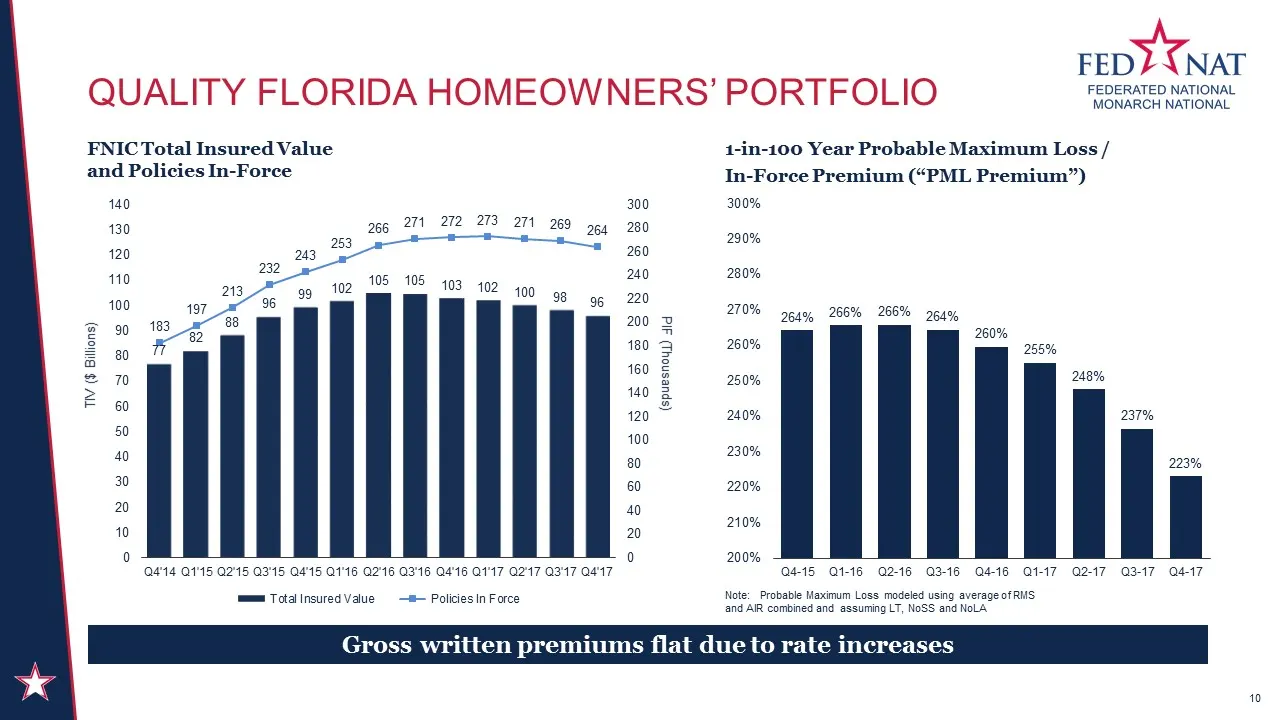
Quality FLORIDA Homeowners’ Portfolio 10 1-in-100 Year Probable Maximum Loss /In-Force Premium (“PML Premium”) Note: Probable Maximum Loss modeled using average of RMS and AIR combined and assuming LT, NoSS and NoLA FNIC Total Insured Value and Policies In-Force Gross written premiums flat due to ra
Slide 11: The Assignment of Benefits (AOB) Challenge
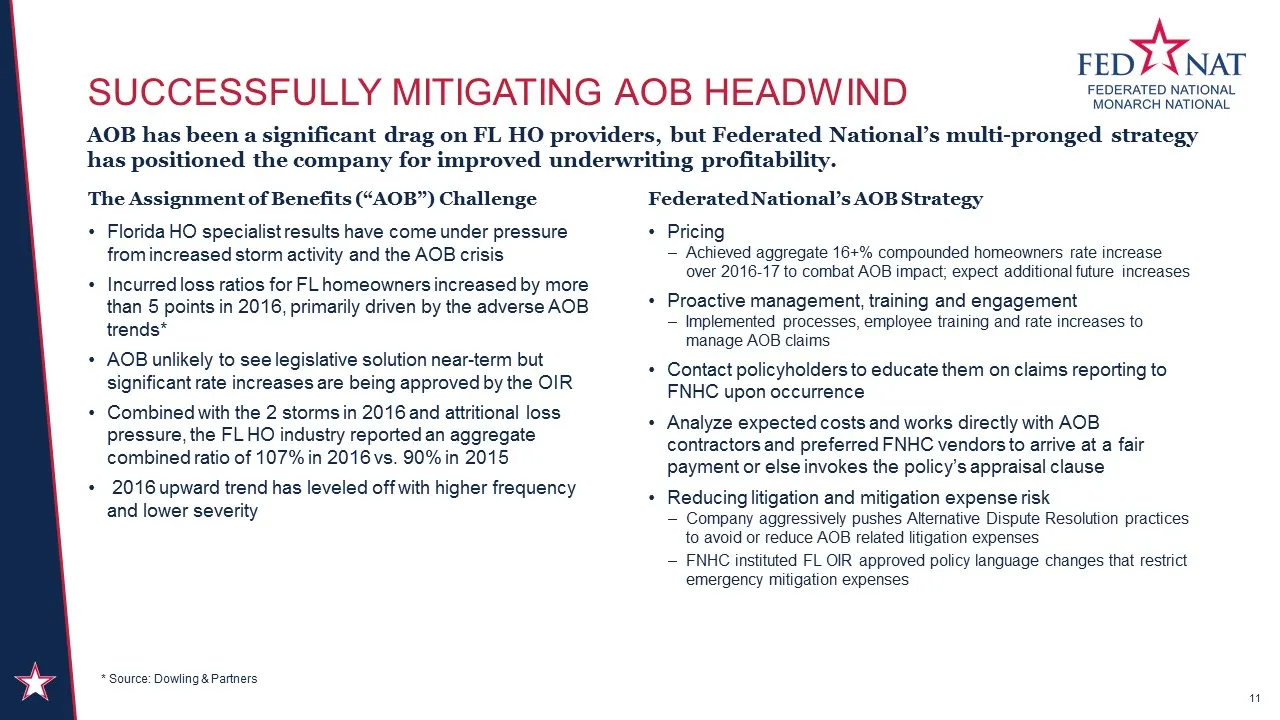
The Assignment of Benefits (“AOB”) Challenge Florida HO specialist results have come under pressure from increased storm activity and the AOB crisis Incurred loss ratios for FL homeowners increased by more than 5 points in 2016, primarily driven by the adverse AOB trends*AOB unlikely to see legislat
Slide 12: 2017-2018 Reinsurance Structure
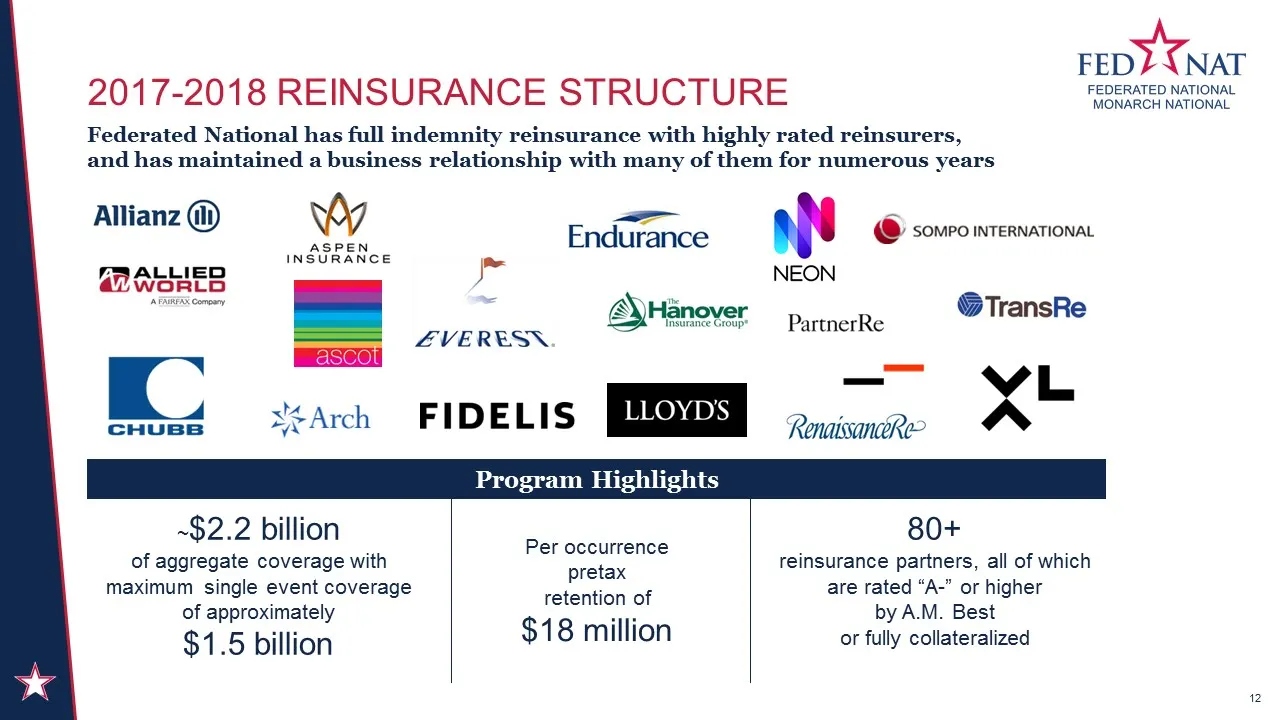
2017-2018 REINSURANCE STRUCTURE Program Highlights 12 Federated National has full indemnity reinsurance with highly rated reinsurers, and has maintained a business relationship with many of them for numerous years ~$2.2 billion of aggregate coverage with maximum single event coverage of approximatel
Slide 13: Robust claims capabilities and tenured staff
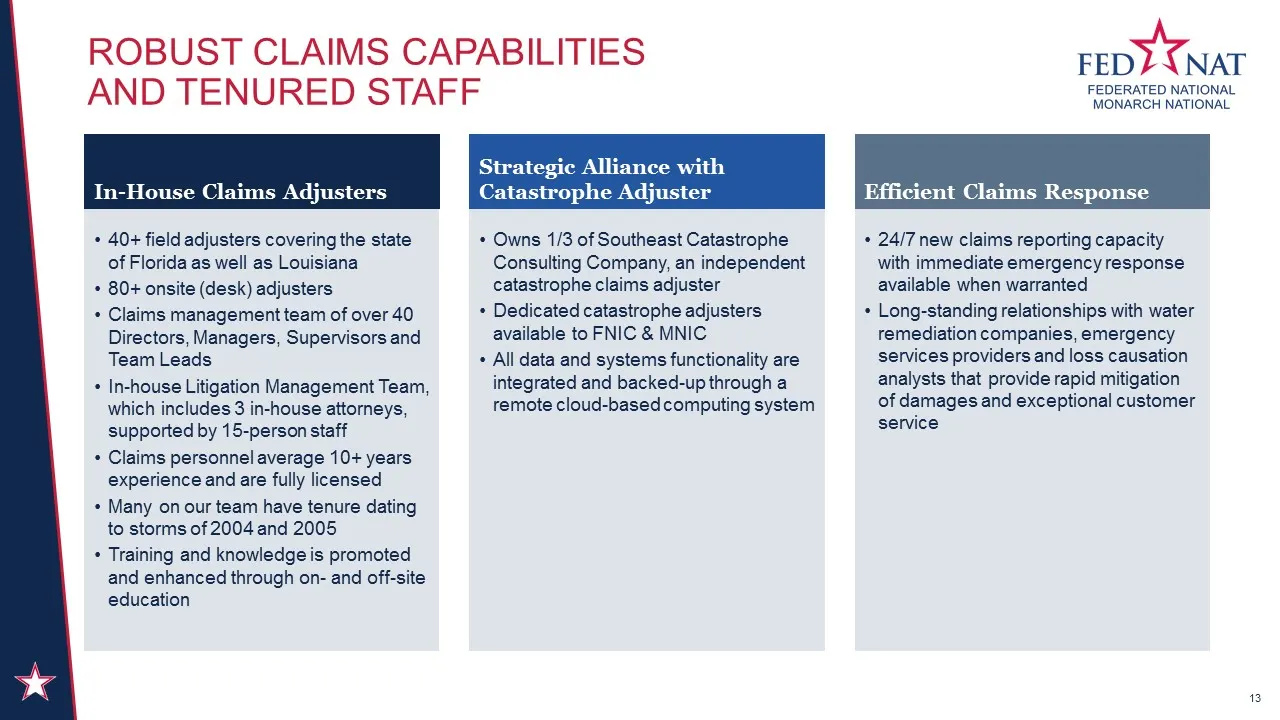
Robust claims capabilities and tenured staff 40+ field adjusters covering the state of Florida as well as Louisiana 80+ onsite (desk) adjustersClaims management team of over 40 Directors, Managers, Supervisors and Team LeadsIn-house Litigation Management Team, which includes 3 in-house attorneys, su
Slide 14: Re-focusing on FNHC's core strengths
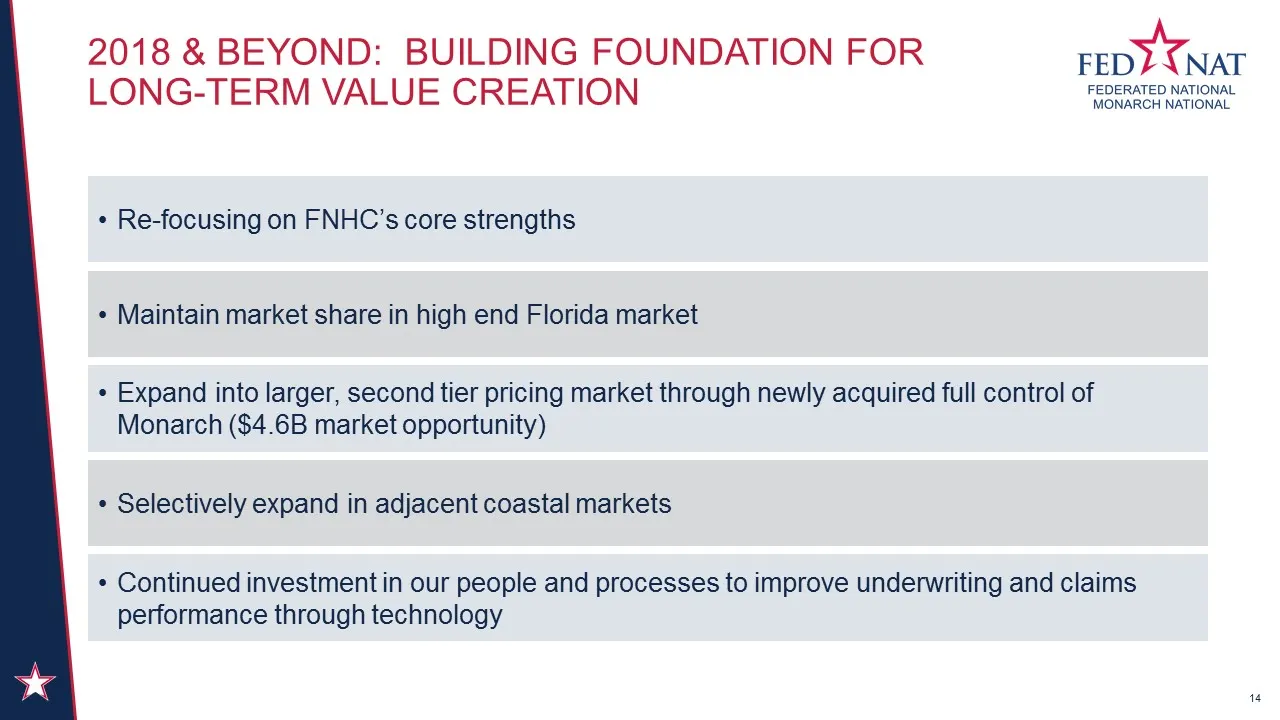
Re-focusing on FNHC’s core strengths Maintain market share in high end Florida market Expand into larger, second tier pricing market through newly acquired full control of Monarch ($4.6B market opportunity) Selectively expand in adjacent coastal markets Continued investment in our people and process
Slide 15: Key Recent Events chart our future path
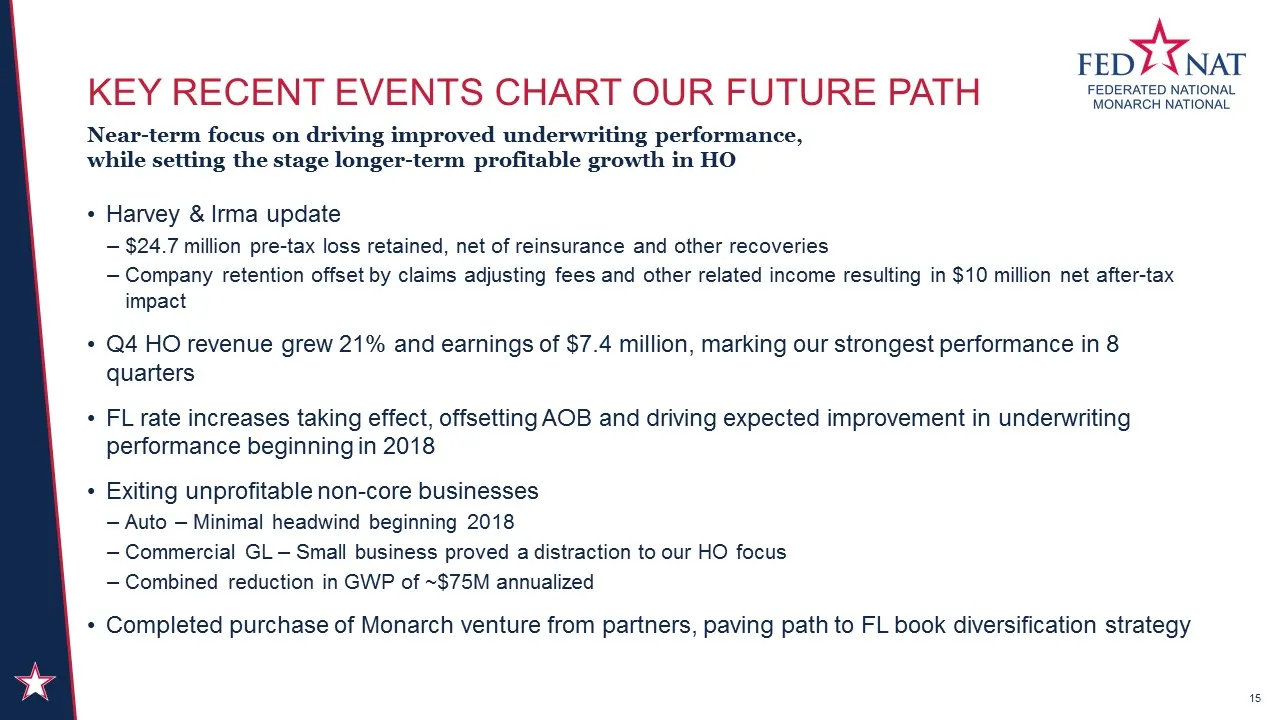
KEY Recent Events chart our future path Harvey & Irma update$24.7 million pre-tax loss retained, net of reinsurance and other recoveriesCompany retention offset by claims adjusting fees and other related income resulting in $10 million net after-tax impactQ4 HO revenue grew 21% and earnings of $7.4
Slide 16: Diversifying Florida book – regional penetration
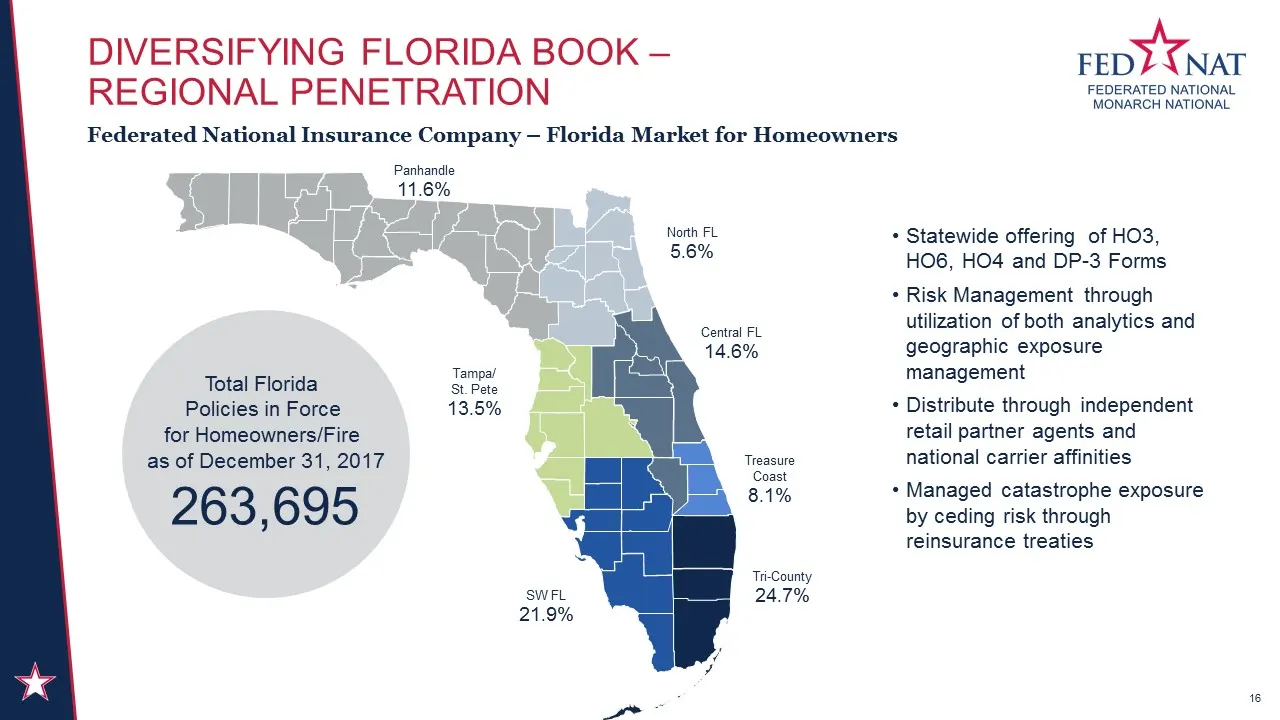
Diversifying Florida book – regional penetration 16 Federated National Insurance Company – Florida Market for Homeowners Panhandle11.6% North FL5.6% Tampa/St. Pete13.5% Central FL14.6% Treasure Coast8.1% SW FL21.9% Tri-County24.7% Total Florida Policies in Force for Homeowners/Fire as of December 31
Slide 17: Monarch National Insurance Overview
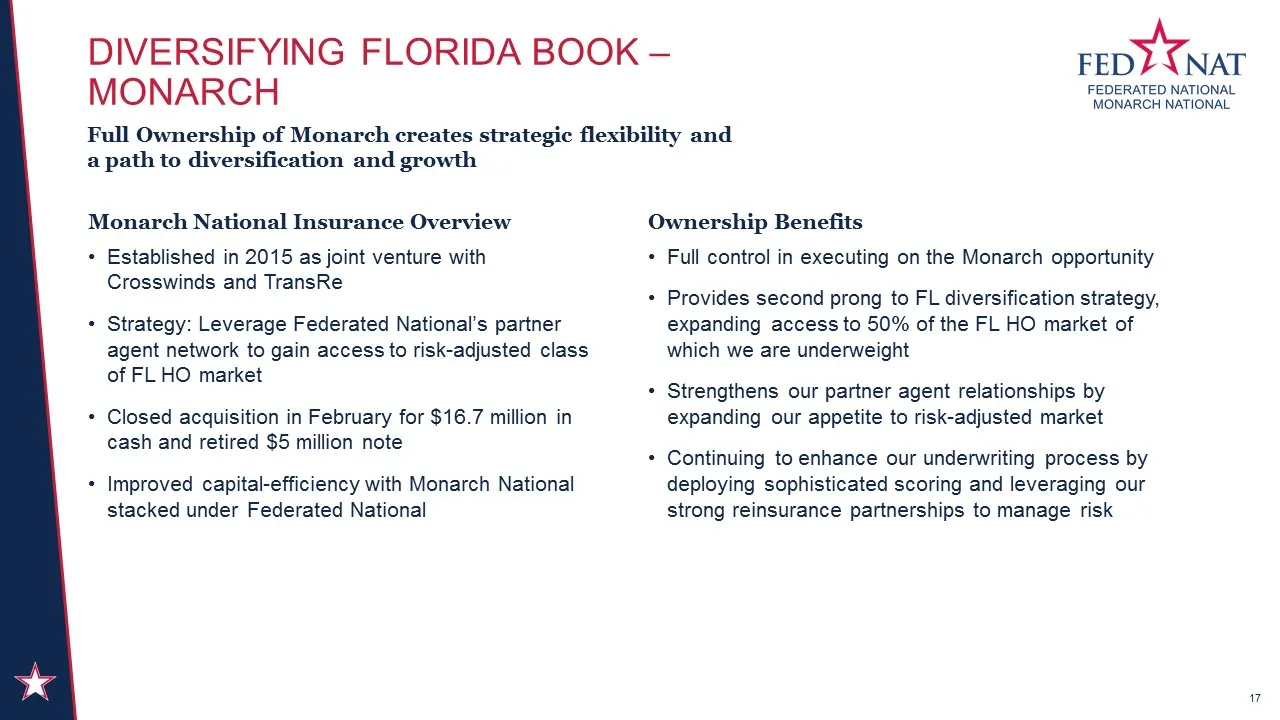
Monarch National Insurance Overview Established in 2015 as joint venture with Crosswinds and TransReStrategy: Leverage Federated National’s partner agent network to gain access to risk-adjusted class of FL HO marketClosed acquisition in February for $16.7 million in cash and retired $5 million noteI
Slide 18: Middle Market Opportunity
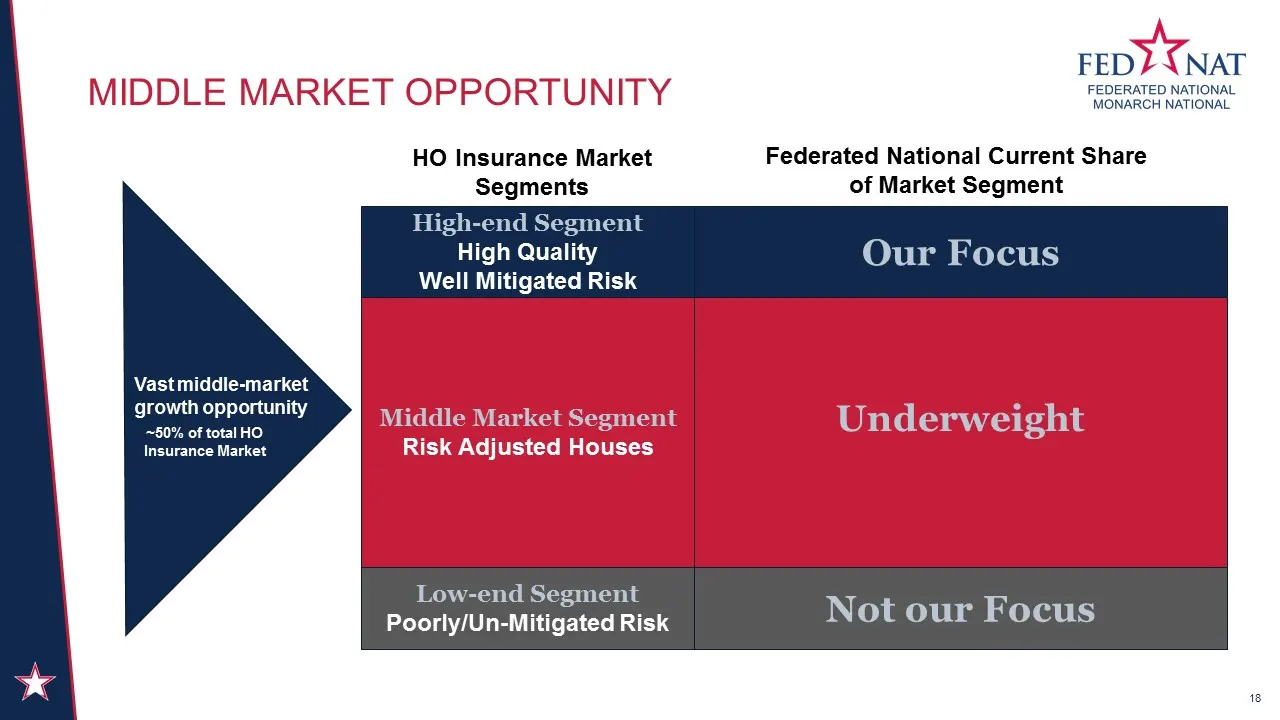
MIDDLE MARKET Opportunity 18 High-end SegmentHigh Quality Well Mitigated Risk Middle Market SegmentRisk Adjusted Houses Low-end SegmentPoorly/Un-Mitigated Risk HO Insurance Market Segments Federated National Current Share of Market Segment Our Focus Underweight Not our Focus Vast middle-market growt
Slide 19: Coastal state diversification
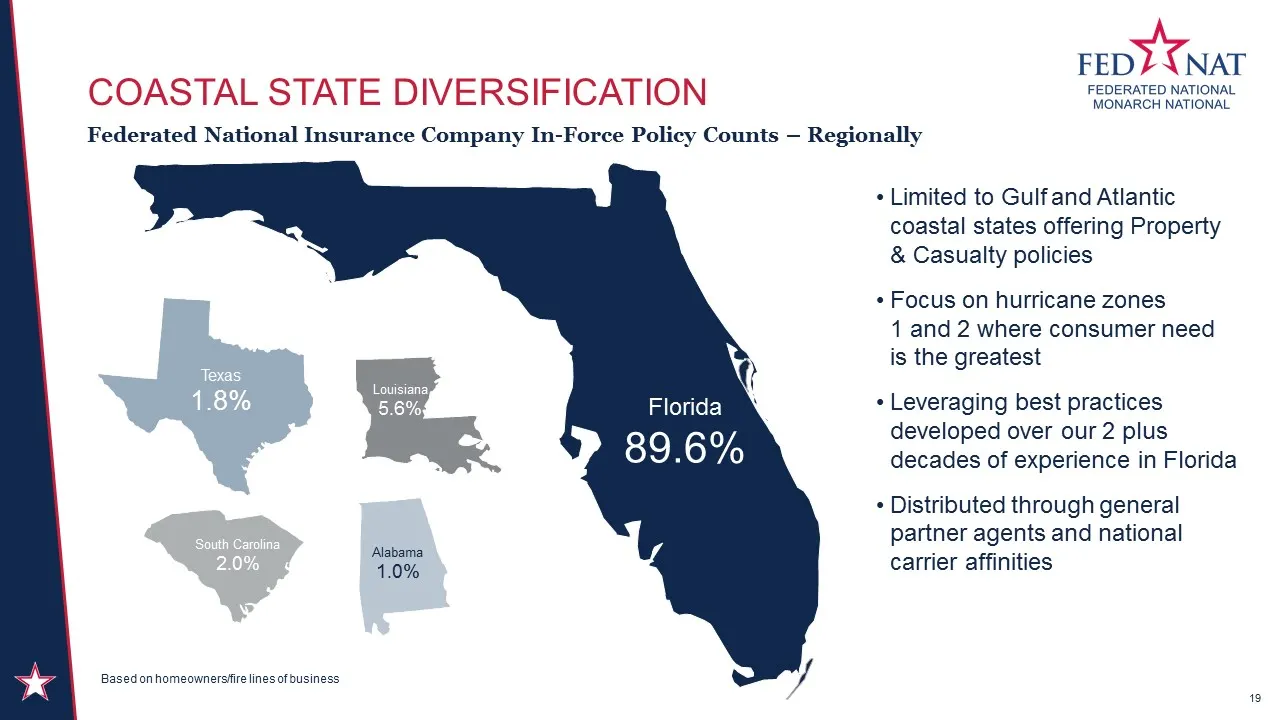
Coastal state diversification 19 Federated National Insurance Company In-Force Policy Counts – Regionally Limited to Gulf and Atlantic coastal states offering Property & Casualty policiesFocus on hurricane zones 1 and 2 where consumer need is the greatestLeveraging best practices developed over our
Slide 20: Why we are well positioned to succeed
Why we are well positioned To Succeed 20 Strong mindshare, partner agent network in Florida supports diversified regional penetration Ownership of Monarch gives us control in tailoring product for new Florida insurance classes Continued expansion as we take our model to neighboring states Multiple o
Slide 21: Experienced Management Team
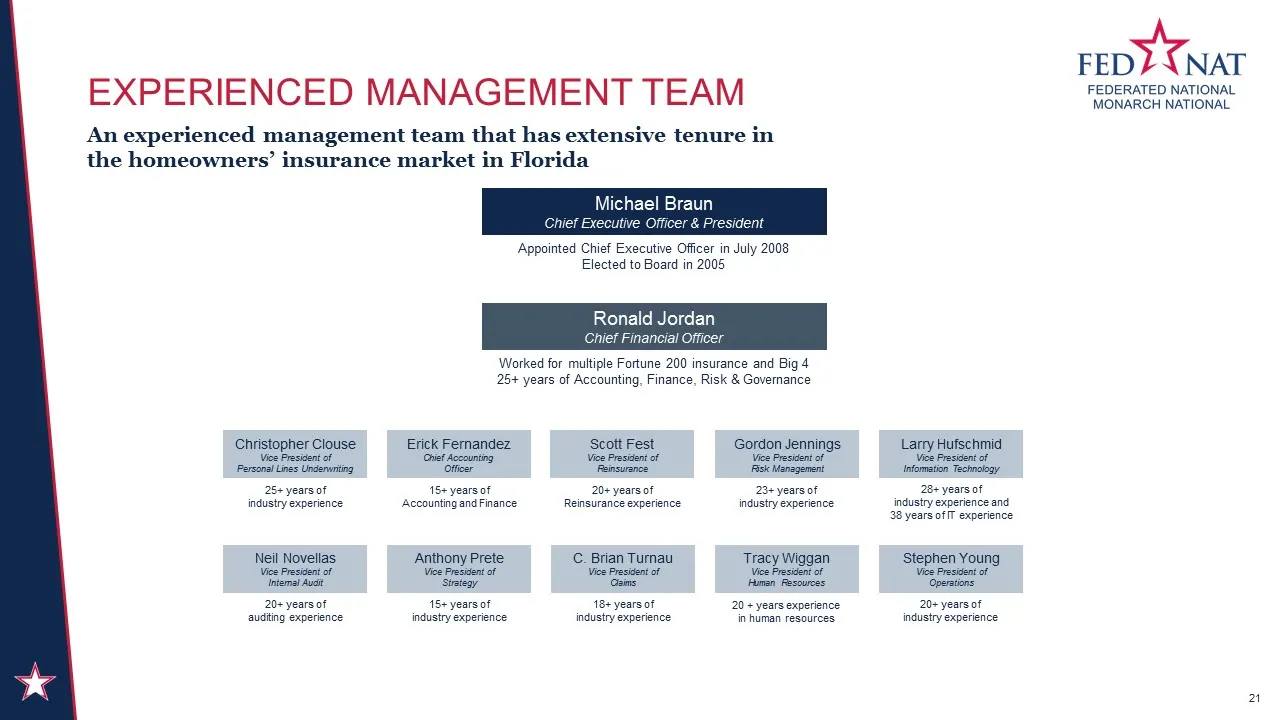
Experienced MANAGEMENT TEAM An experienced management team that has extensive tenure in the homeowners’ insurance market in Florida Michael BraunChief Executive Officer & President Appointed Chief Executive Officer in July 2008Elected to Board in 2005 Ronald JordanChief Financial Officer Worked for

Slide 22: Financial Overview
FINANCIAL OVERVIEW EDERATED NATIONA\ MONARCH NATIONAL
Slide 23: Premiums
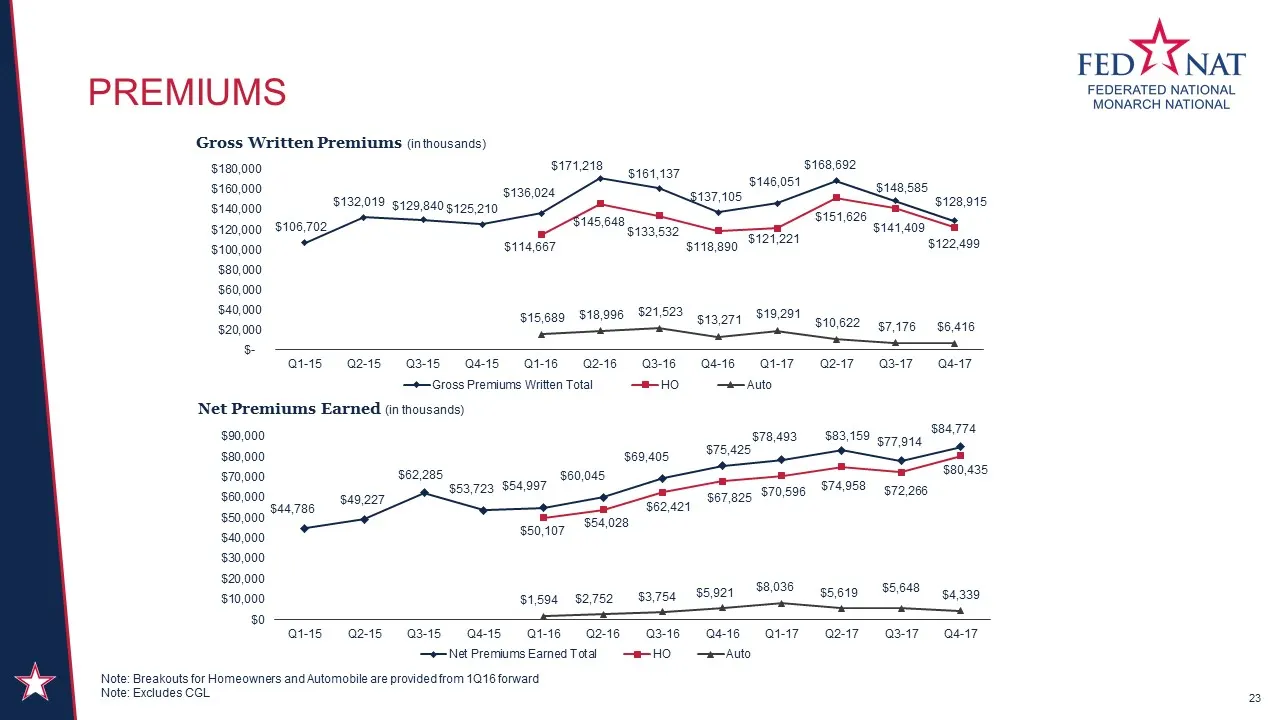
Premiums 23 Note: Breakouts for Homeowners and Automobile are provided from 1Q16 forwardNote: Excludes CGL
Slide 24: Revenue and Expenses
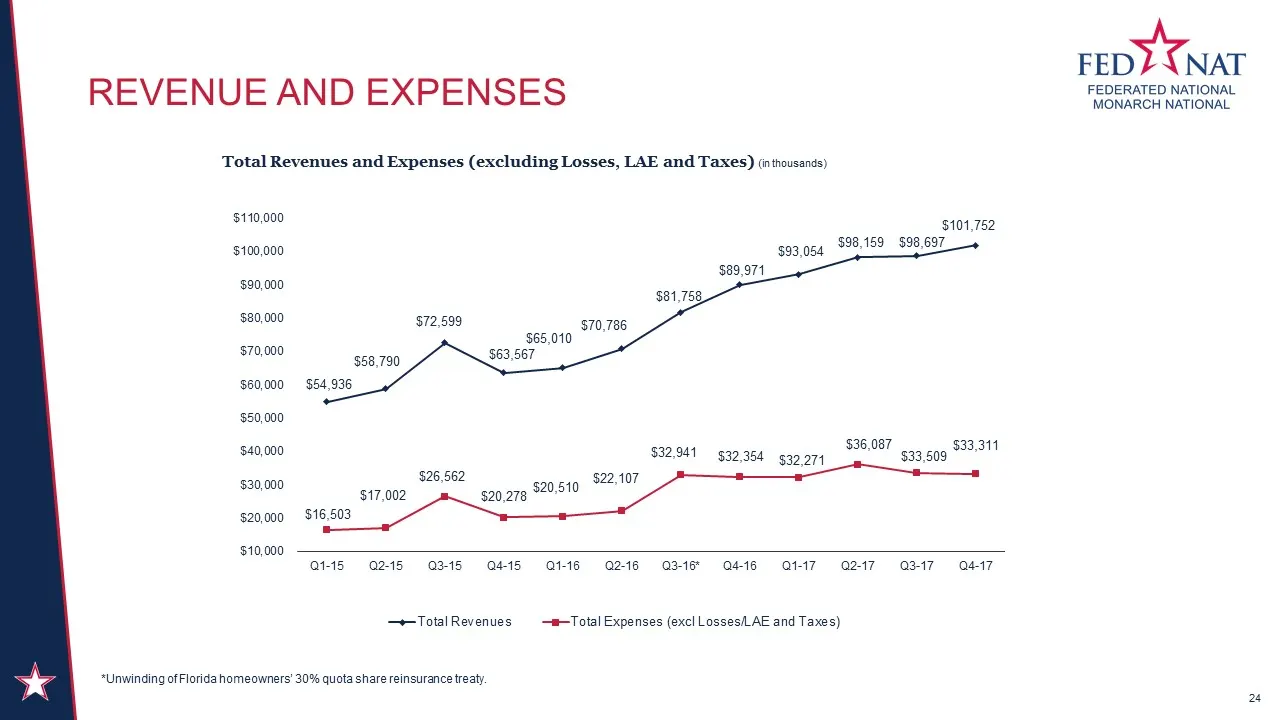
Revenue and Expenses 24 *Unwinding of Florida homeowners’ 30% quota share reinsurance treaty.
Slide 25: 4Q17 Results by line of business
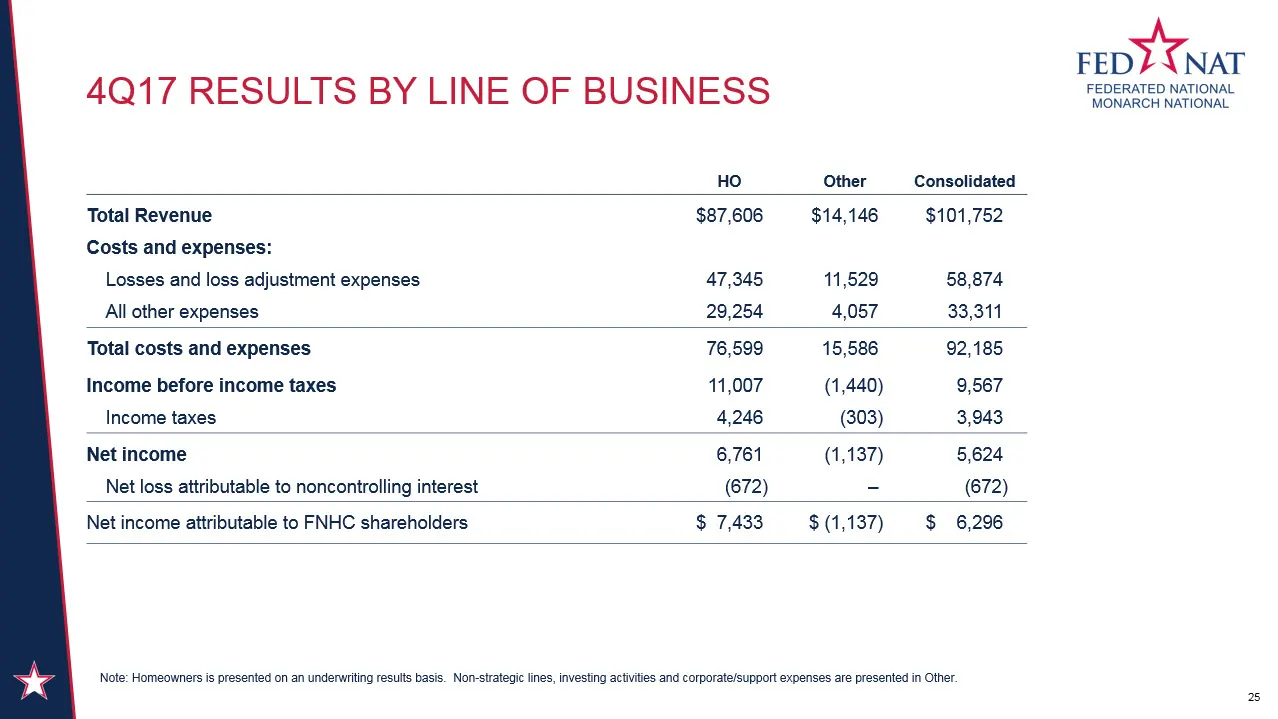
4Q17 Results by line of business 25 HO Other Consolidated Total Revenue $87,606 $14,146 $101,752 Costs and expenses: Losses and loss adjustment expenses 47,345 11,529 58,874 All other expenses 29,254 4,057 33,311 Total costs and expenses 76,599 15,586 92,185 Income before income taxes 11,007 (1,440)
Slide 26: Net income bridge
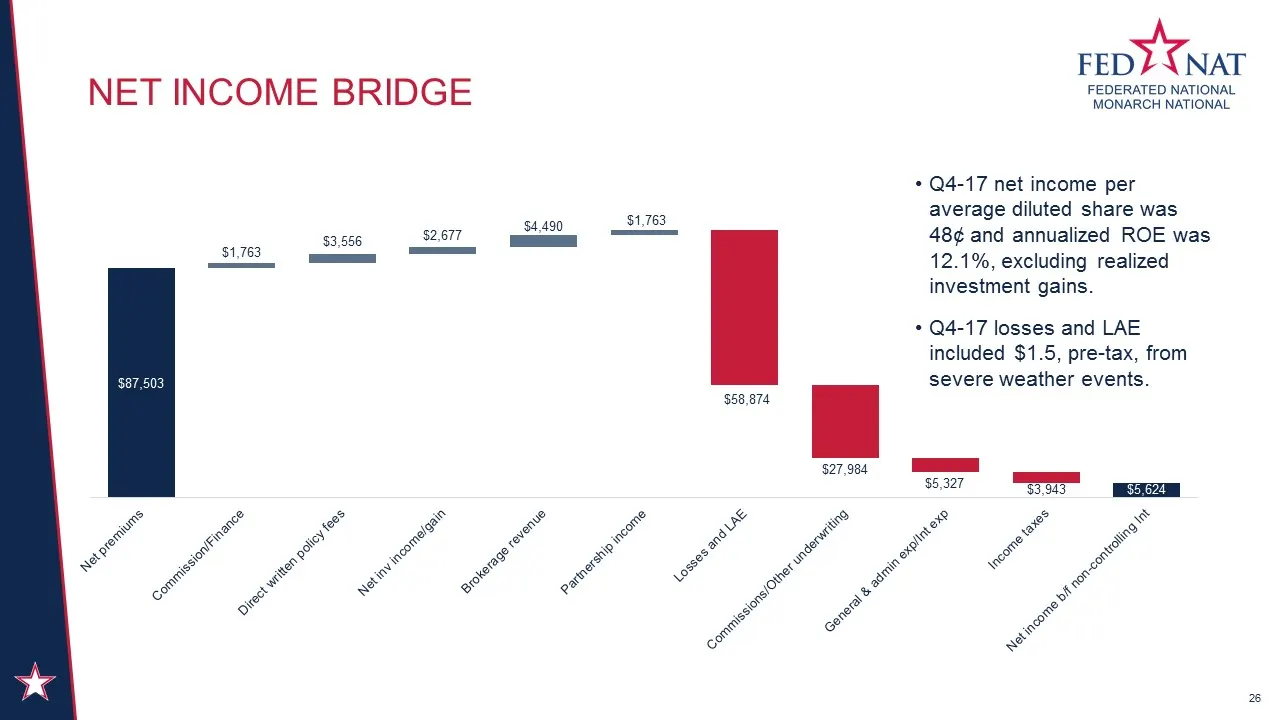
Net income bridge 26 Q4-17 net income per average diluted share was 48¢ and annualized ROE was 12.1%, excluding realized investment gains. Q4-17 losses and LAE included $1.5, pre-tax, from severe weather events.
Slide 27: Losses and LAE
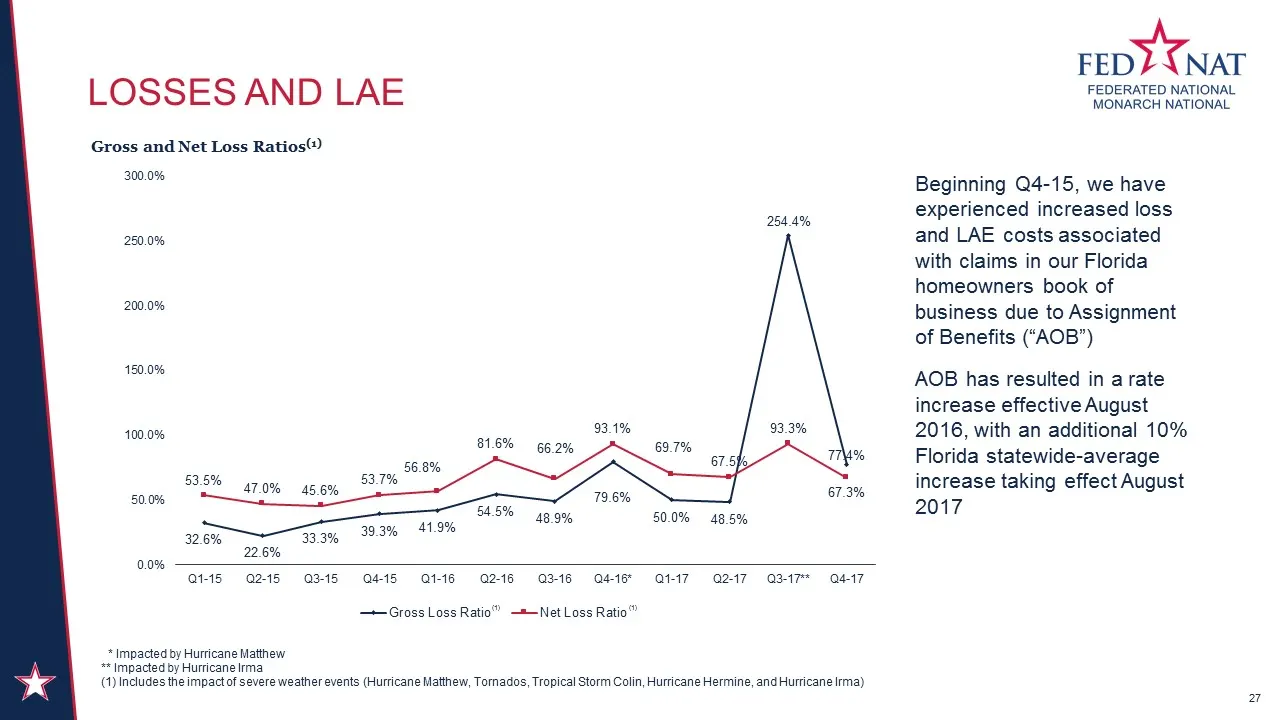
Losses and lae 27 Beginning Q4-15, we have experienced increased loss and LAE costs associated with claims in our Florida homeowners book of business due to Assignment of Benefits (“AOB”) AOB has resulted in a rate increase effective August 2016, with an additional 10% Florida statewide-average incr
Slide 28: Balance Sheet Strength
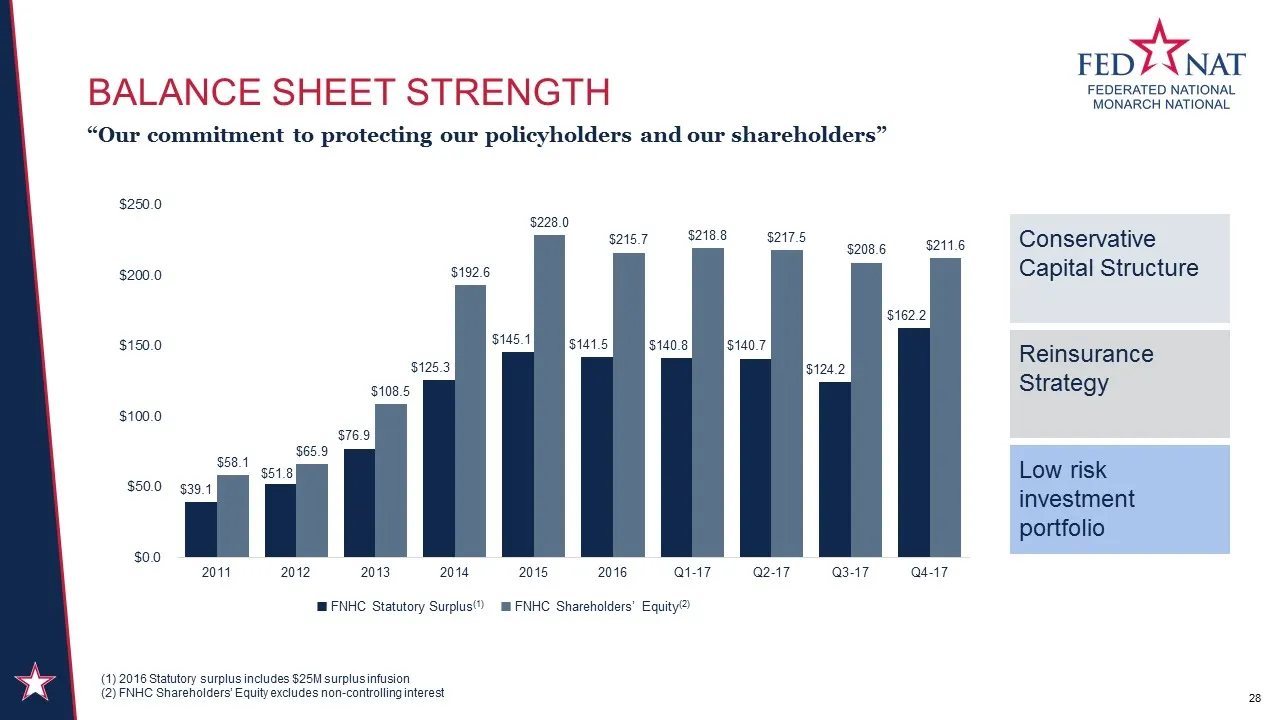
BALANCE SHEET STRENGTH 28 “Our commitment to protecting our policyholders and our shareholders” (1) 2016 Statutory surplus includes $25M surplus infusion(2) FNHC Shareholders’ Equity excludes non-controlling interest Conservative Capital Structure Reinsurance Strategy Low risk investment portfolio
Slide 29: Federated National Investment Portfolio
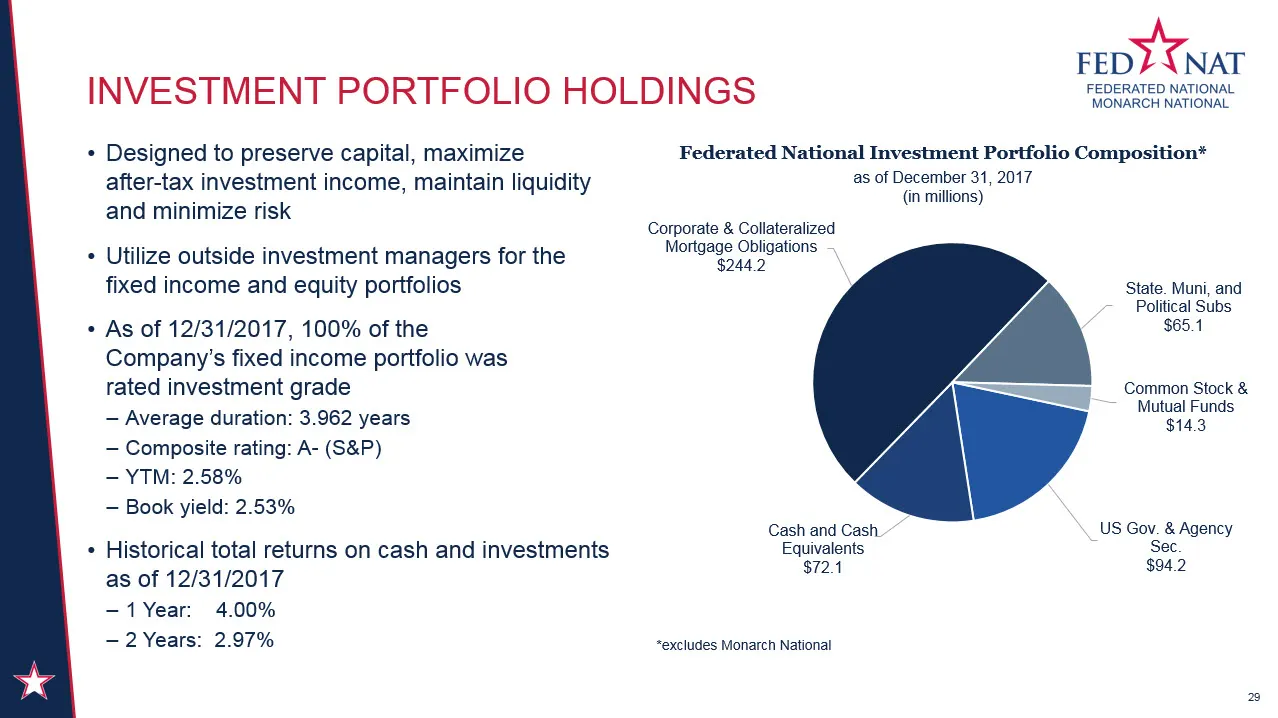
Federated National Investment Portfolio Composition* as of December 31, 2017(in millions) Investment Portfolio Holdings 29 Designed to preserve capital, maximize after-tax investment income, maintain liquidity and minimize riskUtilize outside investment managers for the fixed income and equity portf
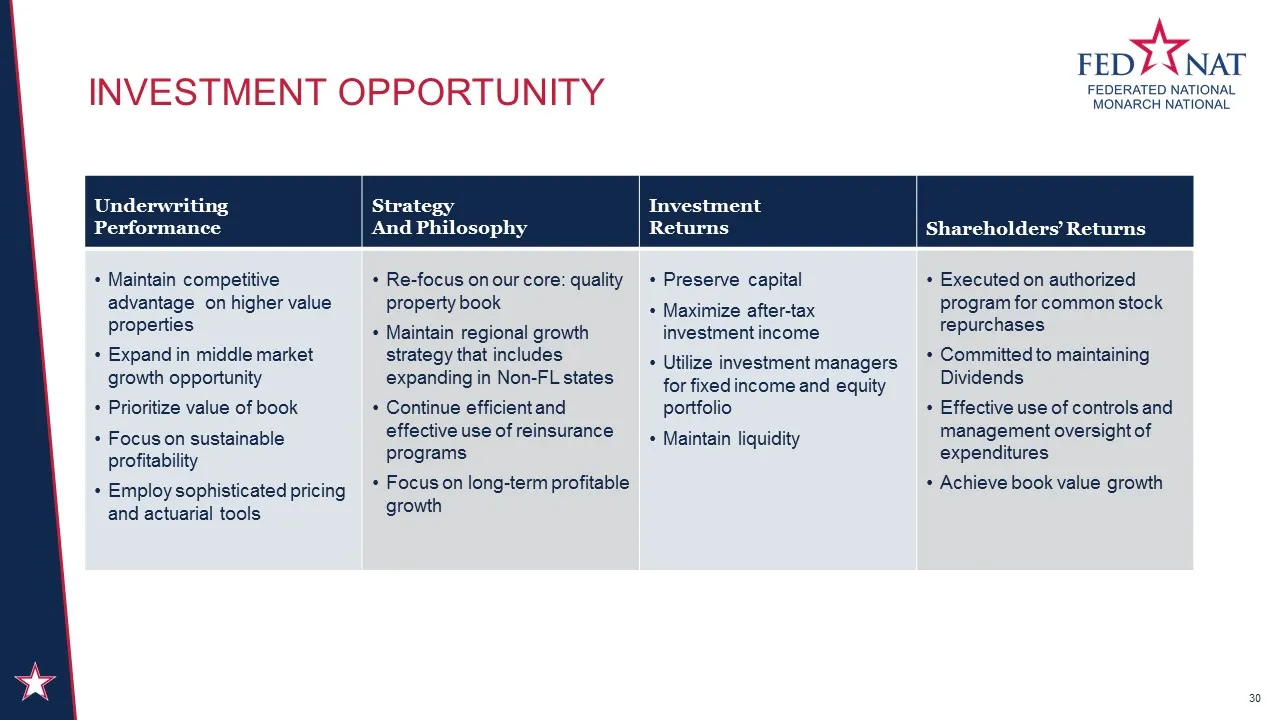
Slide 30: Investment opportunity
Investment opportunity 30 UnderwritingPerformance Strategy And Philosophy Investment Returns Shareholders’ Returns Maintain competitive advantage on higher value propertiesExpand in middle market growth opportunityPrioritize value of bookFocus on sustainable profitabilityEmploy sophisticated pricing

Slide 31: Thank You!
Fl ED) Cyat MONARCH NATIONAI THANK YOU!
Source: SEC EDGAR · 8-K filed Mar 19, 2018
More decks from Fednat Holding Co
 IPO Roadshow (March 2021)26 slides · Mar 5, 2021
 Q3 2020 Earnings Presentation20 slides · Nov 9, 2020
 Q1 2020 Earnings Presentation30 slides · May 12, 2020
 Q4 2019 Earnings Presentation30 slides · Mar 2, 2020
 Q3 2019 Earnings Presentation33 slides · Nov 26, 2019
 Investor Presentation (September 2019)32 slides · Sep 16, 2019