Air Transport Services Group Inc
Air Transport Services — BB&T Capital Markets Transportation Services Conference 2014
15 slides from Air Transport Services's conference presentation, Feb 12, 2014
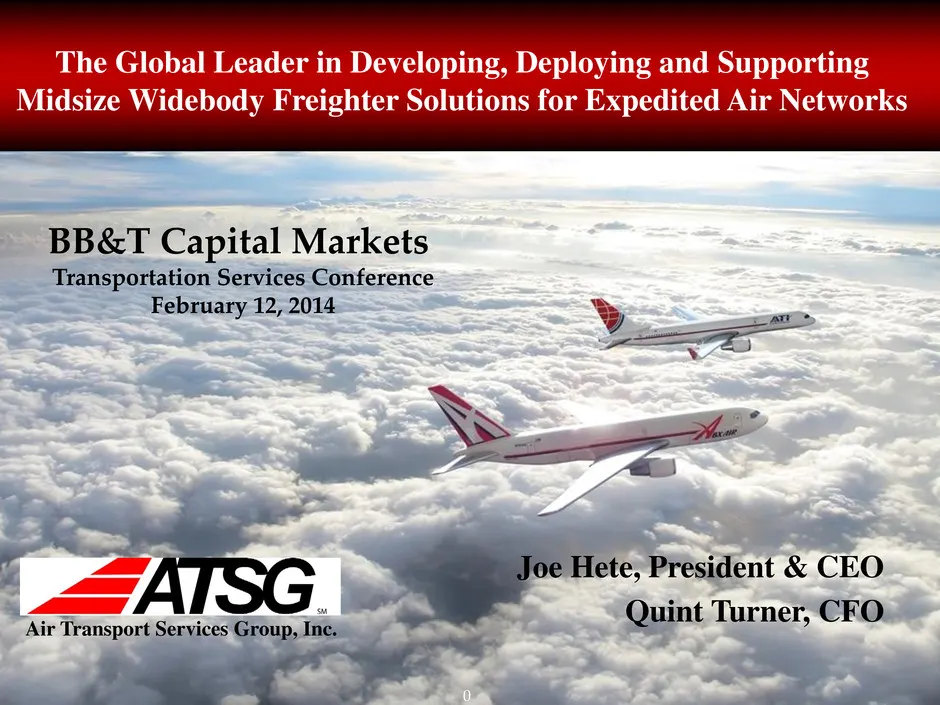
Slide 1: The Global Leader in Developing, Deploying and Supporting Midsize Widebody Freighter Solutions
0 Air Transport Services Group, Inc. The Global Leader in Developing, Deploying and Supporting Midsize Widebody Freighter Solutions for Expedited Air Networks Joe Hete, President & CEO Quint Turner, CFO BB&T Capital Markets Transportation Services Conference February 12, 2014
Slide 2: Safe Harbor Statement
1 Except for historical information contained herein, the matters discussed in this presentation contain forward- looking statements that involve risks and uncertainties. There are a number of important factors that could cause Air Transport Services Group's ("ATSG's") actual results to differ mater
Slide 3: Investment Highlights
2 Investment Highlights Unique model augments leasing-driven base return on owned aircraft assets with complete packaged air cargo solutions Dominant market share in midsize freighter class key to ‘spoke’ transport among global and regional air cargo hubs Reduced cost structure through 2013 fleet
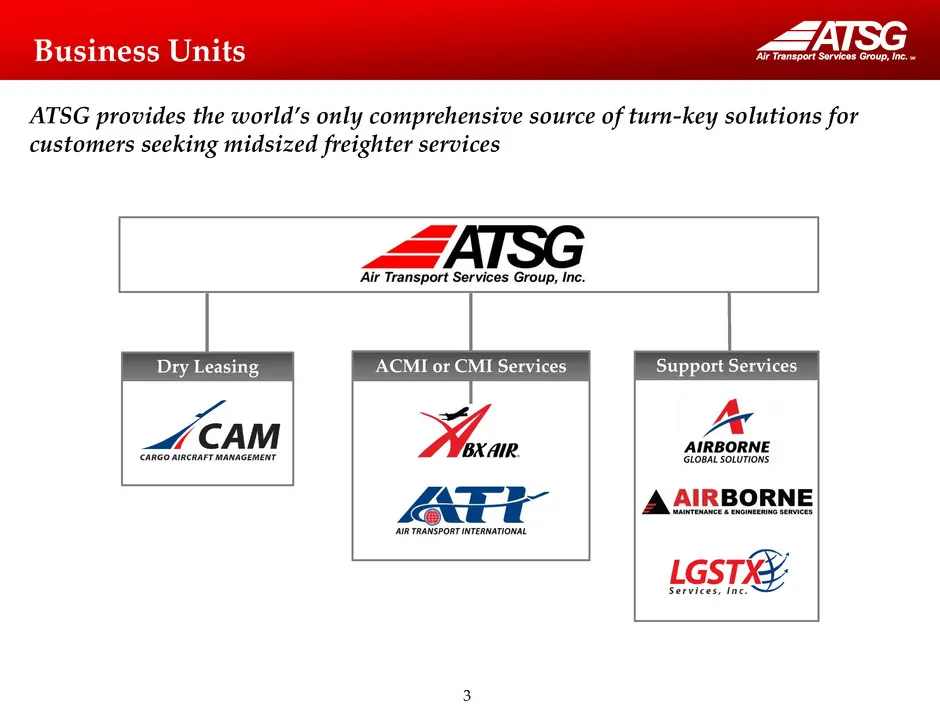
Slide 4: Business Units
3 Dry Leasing ACMI or CMI Services Support Services Business Units ATSG provides the world’s only comprehensive source of turn-key solutions for customers seeking midsized freighter services
Slide 5: Value Creation Begins with Conversions
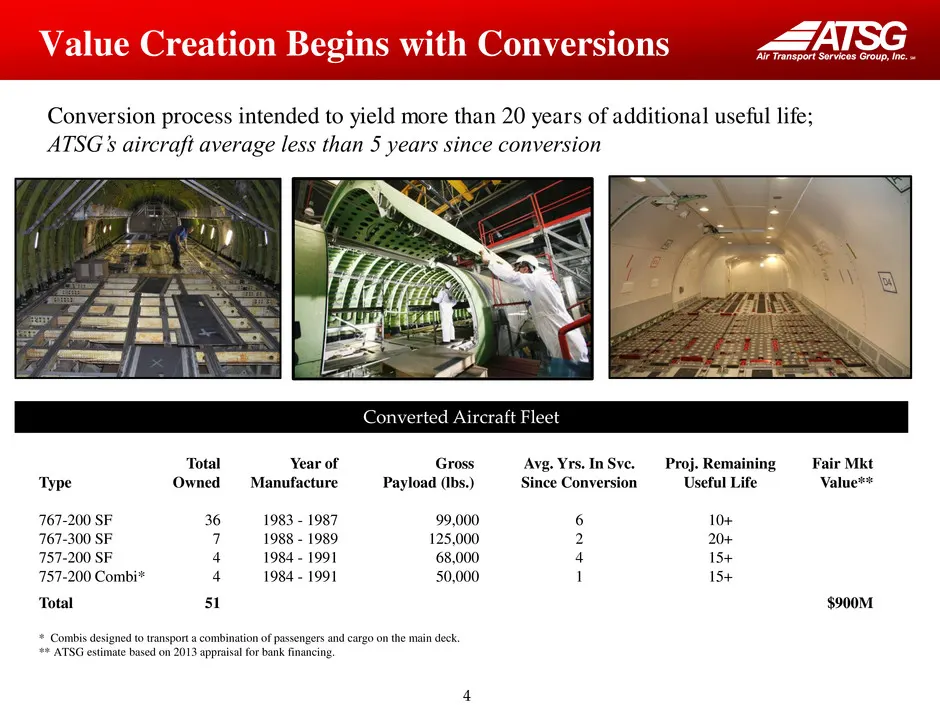
4 Value Creation Begins with Conversions Converted Aircraft Fleet Total Year of Gross Avg. Yrs. In Svc. Proj. Remaining Fair Mkt Type Owned Manufacture Payload (lbs.) Since Conversion Useful Life Value** 767-200 SF 36 1983 - 1987 99,000 6 10+ 767-300 SF 7 1988 - 1989 125,000 2 20+ 757-200 SF 4 1984
Slide 6: ACMI Airline, Fleet Transitions Completed
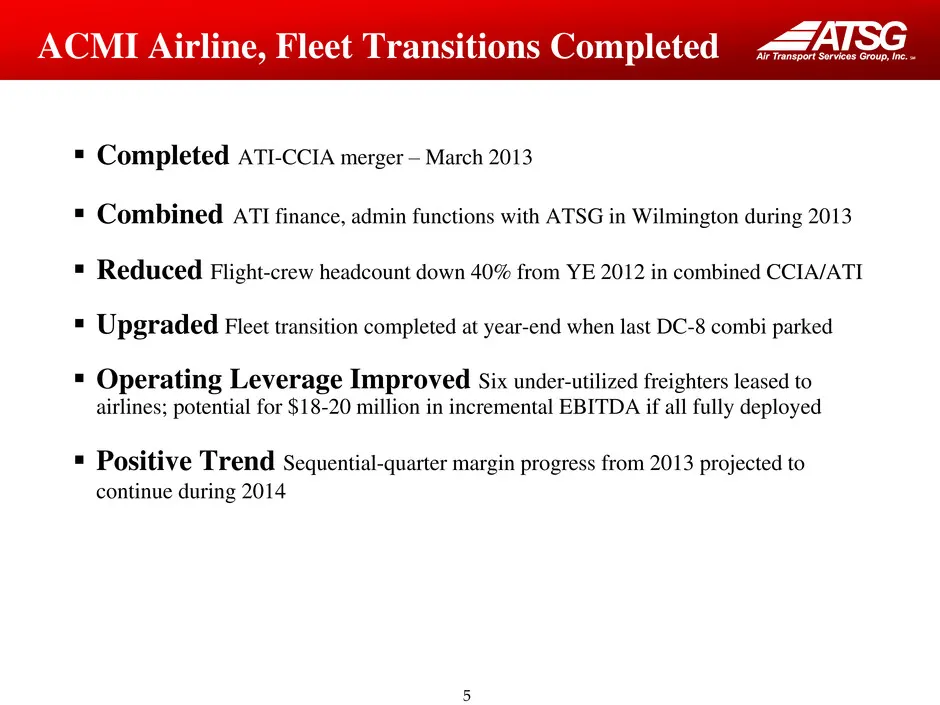
5 ACMI Airline, Fleet Transitions Completed Completed ATI-CCIA merger – March 2013 Combined ATI finance, admin functions with ATSG in Wilmington during 2013 Reduced Flight-crew headcount down 40% from YE 2012 in combined CCIA/ATI Upgraded Fleet transition completed at year-end when last DC-8
Slide 7: ROIC Driven Business Model
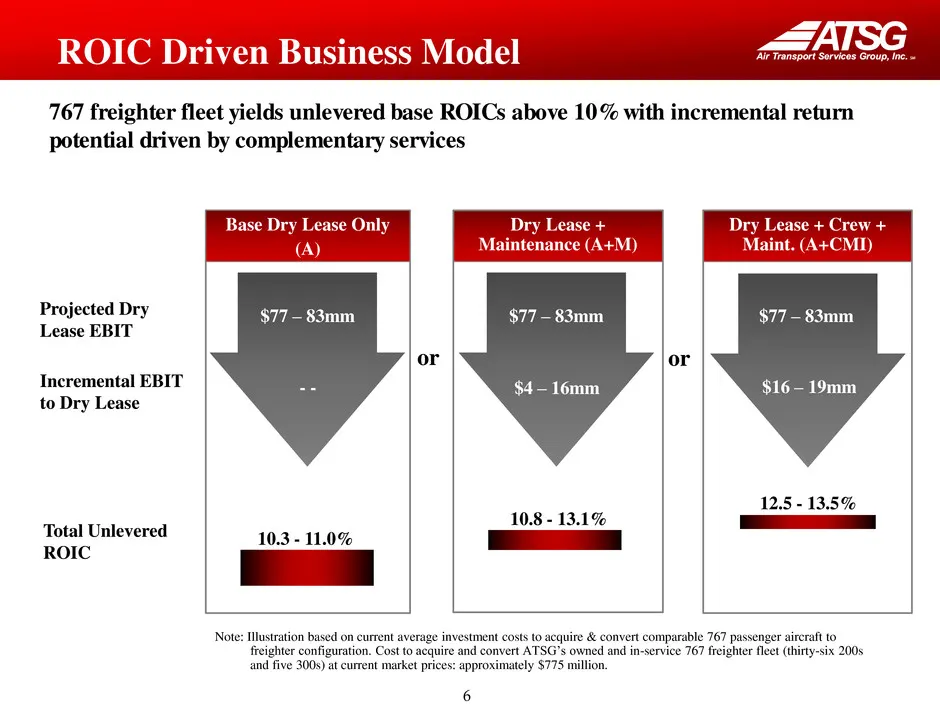
6 767 freighter fleet yields unlevered base ROICs above 10% with incremental return potential driven by complementary services Base Dry Lease Only (A) Dry Lease + Crew + Maint. (A+CMI) Dry Lease + Maintenance (A+M) Projected Dry Lease EBIT Incremental EBIT to Dry Lease Total Unlevered ROIC 12.5 - 13
Slide 8: West Atlantic – Strategic Foothold in Europe
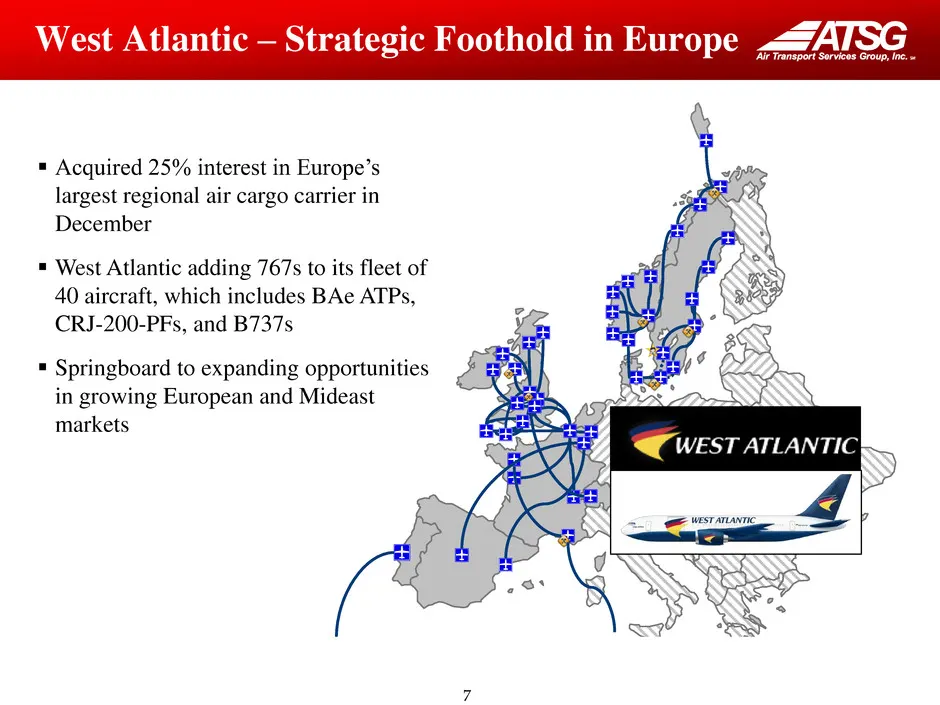
7 West Atlantic – Strategic Foothold in Europe Acquired 25% interest in Europe’s largest regional air cargo carrier in December West Atlantic adding 767s to its fleet of 40 aircraft, which includes BAe ATPs, CRJ-200-PFs, and B737s Springboard to expanding opportunities in growing European and
Slide 9: Unrivaled Leader in Medium Wide-body
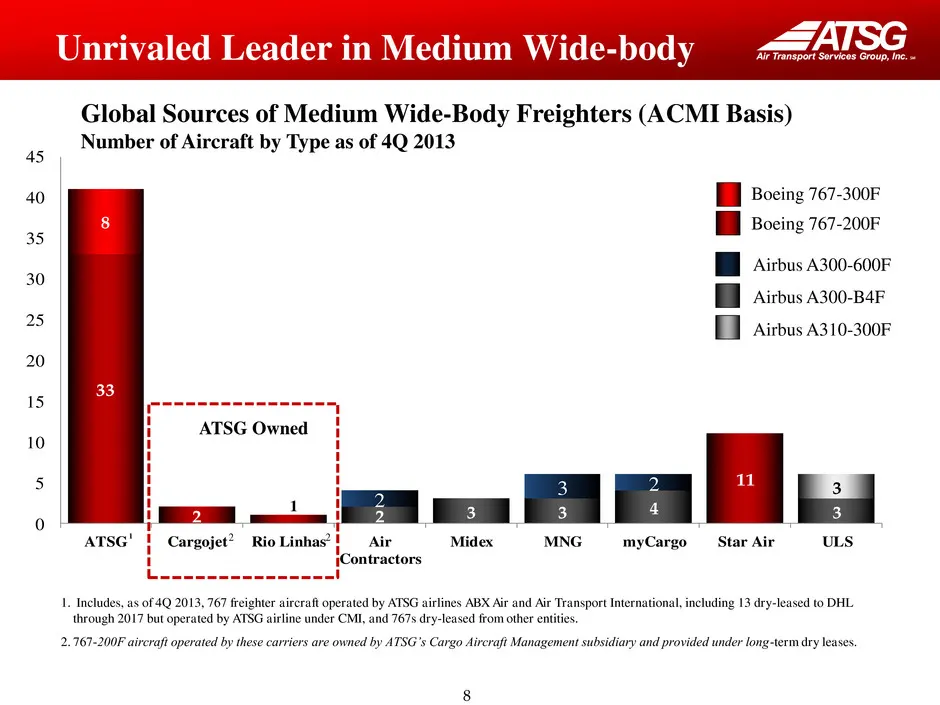
8 33 2 11 8 2 3 3 4 3 2 3 2 3 0 5 10 15 20 25 30 35 40 45 ATSG Cargojet Rio Linhas Air Contractors Midex MNG myCargo Star Air ULS 1. Includes, as of 4Q 2013, 767 freighter aircraft operated by ATSG airlines ABX Air and Air Transport International, including 13 dry-leased to DHL through 2017 but oper
Slide 10: Current Aircraft Deployments
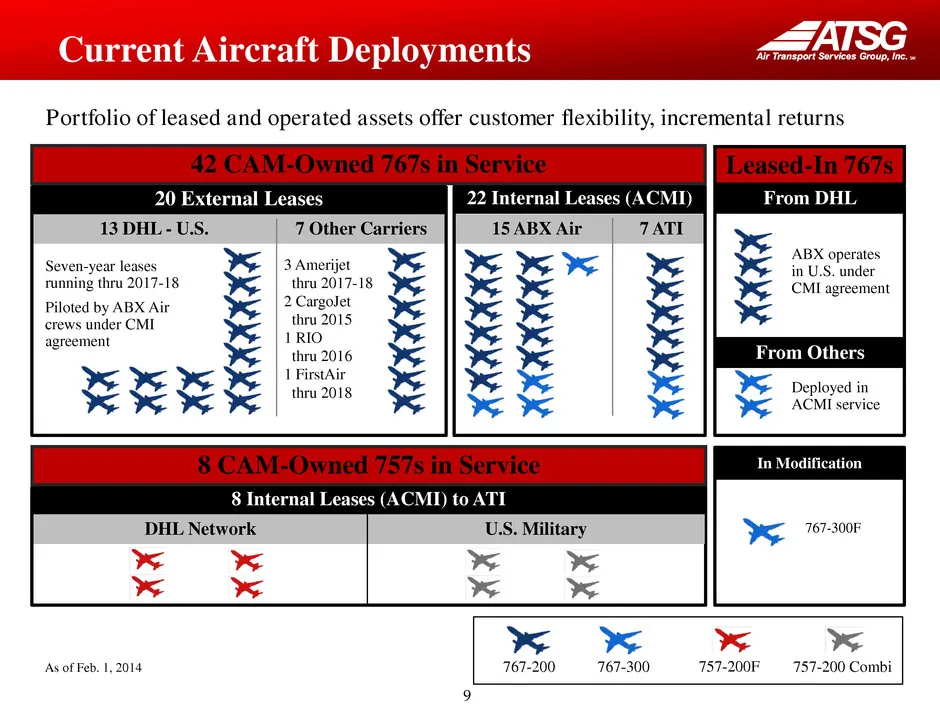
9 Current Aircraft Deployments 20 External Leases 22 Internal Leases (ACMI) 13 DHL - U.S. 7 ATI 15 ABX Air 7 Other Carriers ABX operates in U.S. under CMI agreement Deployed in ACMI service 767-300F 767-200 767-300 Leased-In 767s In Modification Seven-year leases running thru 2017-18 Piloted by ABX
Slide 11: Combi Transition Update
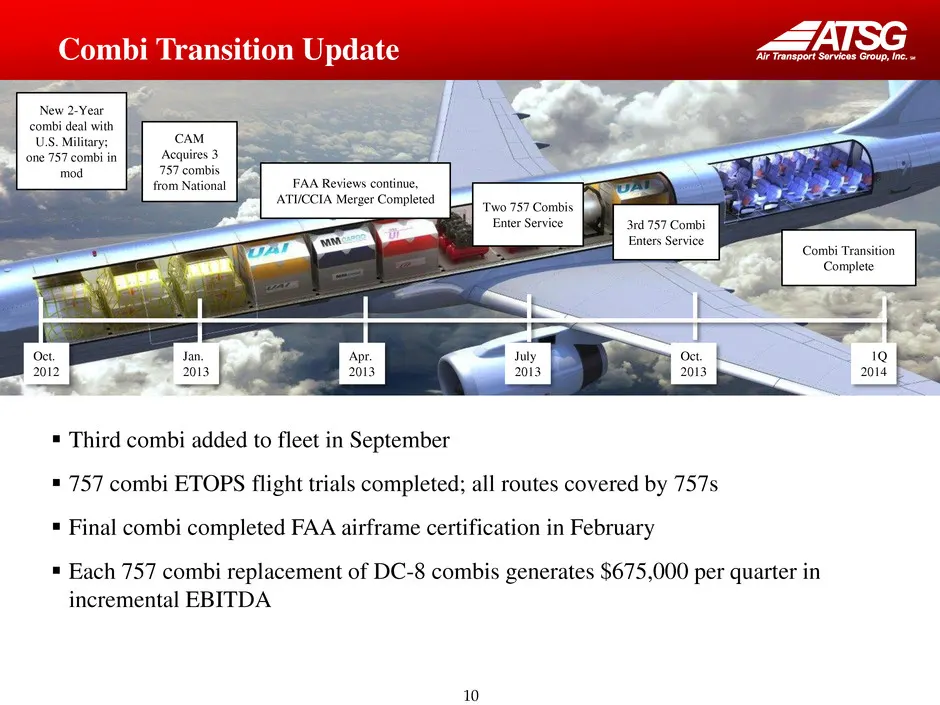
10 Combi Transition Update New 2-Year combi deal with U.S. Military; one 757 combi in mod CAM Acquires 3 757 combis from National FAA Reviews continue, ATI/CCIA Merger Completed Two 757 Combis Enter Service 3rd 757 Combi Enters Service Combi Transition Complete Oct. 2012 1Q 2014 Jan. 2013 Apr. 2013
Slide 12: Summary Financials
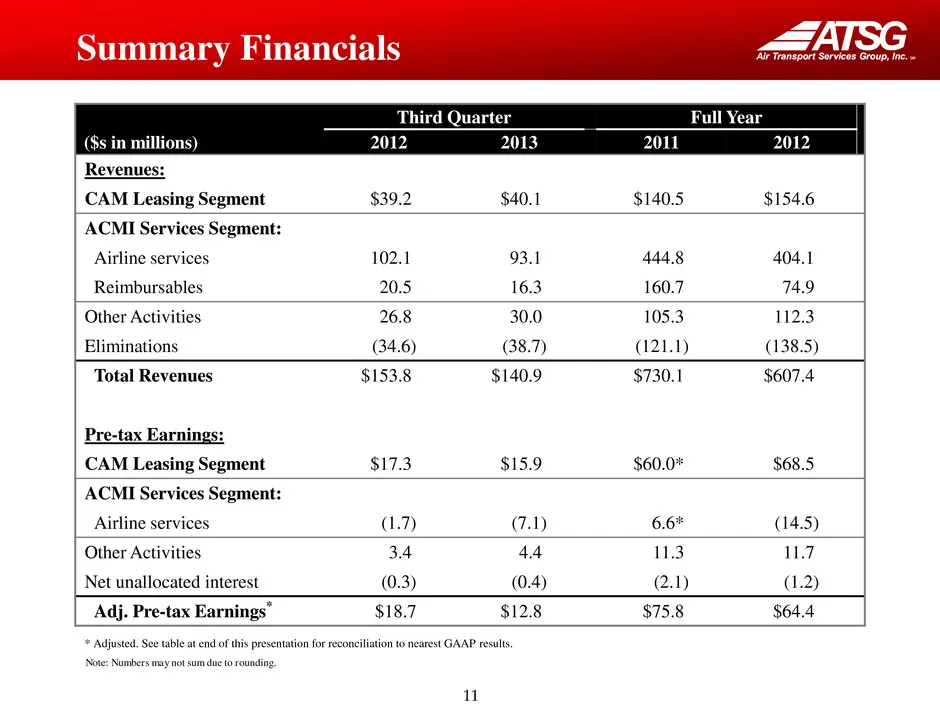
11 Summary Financials Third Quarter Full Year ($s in millions) 2012 2013 2011 2012 Revenues: CAM Leasing Segment $39.2 $40.1 $140.5 $154.6 ACMI Services Segment: Airline services 102.1 93.1 444.8 404.1 Reimbursables 20.5 16.3 160.7 74.9 Other Activities 26.8 30.0 105.3 112.3 Eliminations (34.6) (38.
Slide 13: Strong Capital Base
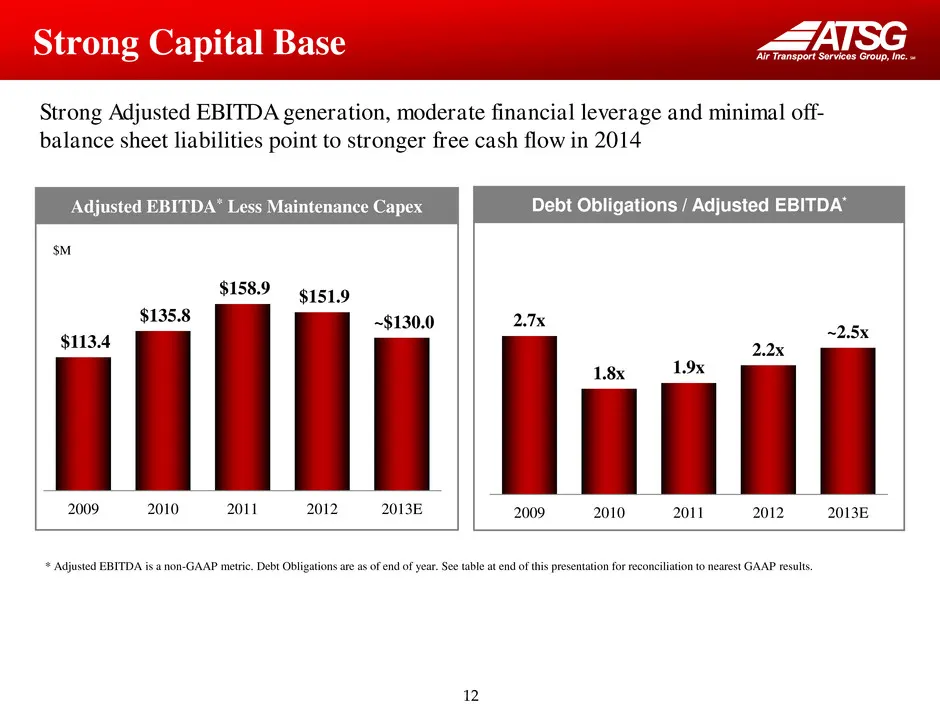
12 $113.4 $135.8 $158.9 $151.9 ~$130.0 2009 2010 2011 2012 2013E 2.7x 1.8x 1.9x 2.2x ~2.5x 2009 2010 2011 2012 2013E Strong Capital Base Strong Adjusted EBITDA generation, moderate financial leverage and minimal off- balance sheet liabilities point to stronger free cash flow in 2014 Debt Obligations
Slide 14: 2014 Cash Flow Outlook
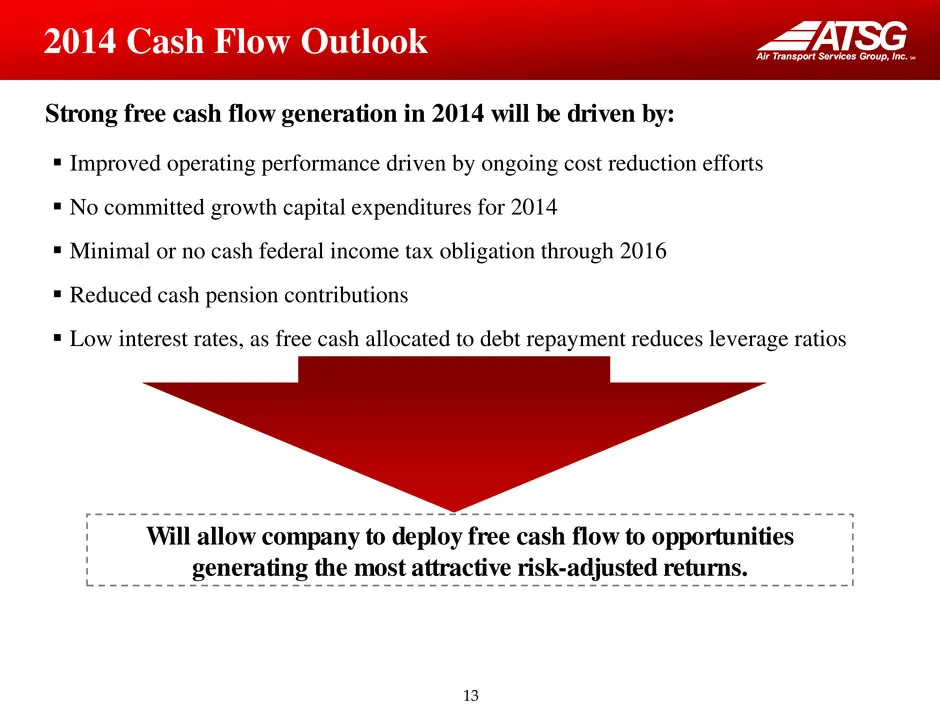
13 2014 Cash Flow Outlook Improved operating performance driven by ongoing cost reduction efforts No committed growth capital expenditures for 2014 Minimal or no cash federal income tax obligation through 2016 Reduced cash pension contributions Low interest rates, as free cash allocated to
Slide 15: Non-GAAP Reconciliation Statement
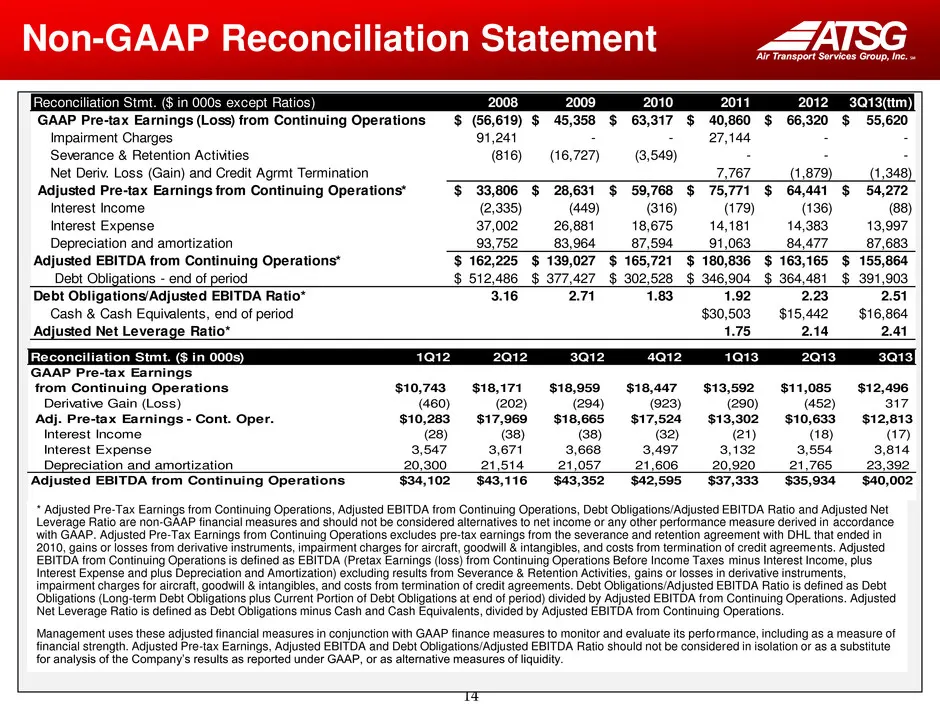
14 Non-GAAP Reconciliation Statement * Adjusted Pre-Tax Earnings from Continuing Operations, Adjusted EBITDA from Continuing Operations, Debt Obligations/Adjusted EBITDA Ratio and Adjusted Net Leverage Ratio are non-GAAP financial measures and should not be considered alternatives to net income or a
Source: SEC EDGAR · 8-K filed Feb 12, 2014
More decks from Air Transport Services Group Inc
 Shareholder Meeting (May 2024)26 slides · May 23, 2024
 Stephens Annual Investment Conference 202321 slides · Nov 14, 2023
 Investor Day (September 2023)68 slides · Sep 27, 2023
 Shareholder Meeting (May 2023)25 slides · May 26, 2023
 Stifel conference (February 2023)15 slides · Feb 6, 2023
 Stifel 2020 Transportation & Logistics Conference18 slides · Feb 11, 2020