Synovus Financial — 2021 Raymond James Institutional Investors Conference
15 slides from Synovus Financial's conference presentation, Mar 2, 2021
Slide 1: 2021 Raymond James Institutional Investors Conference
2021 Raymond James Institutional Investors Conference March 2, 2021 Kevin Blair President and COO Exhibit 99.1
Slide 2: Forward Looking Statements
Forward Looking Statements 2 This slide presentation and certain other Synovus Financial Corp.’s filings with the Securities and Exchange Commission contain statements that constitute "forward-looking statements" within the meaning of, and subject to the protections of, Section 27A of the Securities
Slide 3: Committed to Deliver Sustainable, Top-Quartile Performance
3 Committed to Deliver Sustainable, Top-Quartile Performance Positioned for Success Delivering a Superior Customer Experience Committed to Profitable Growth
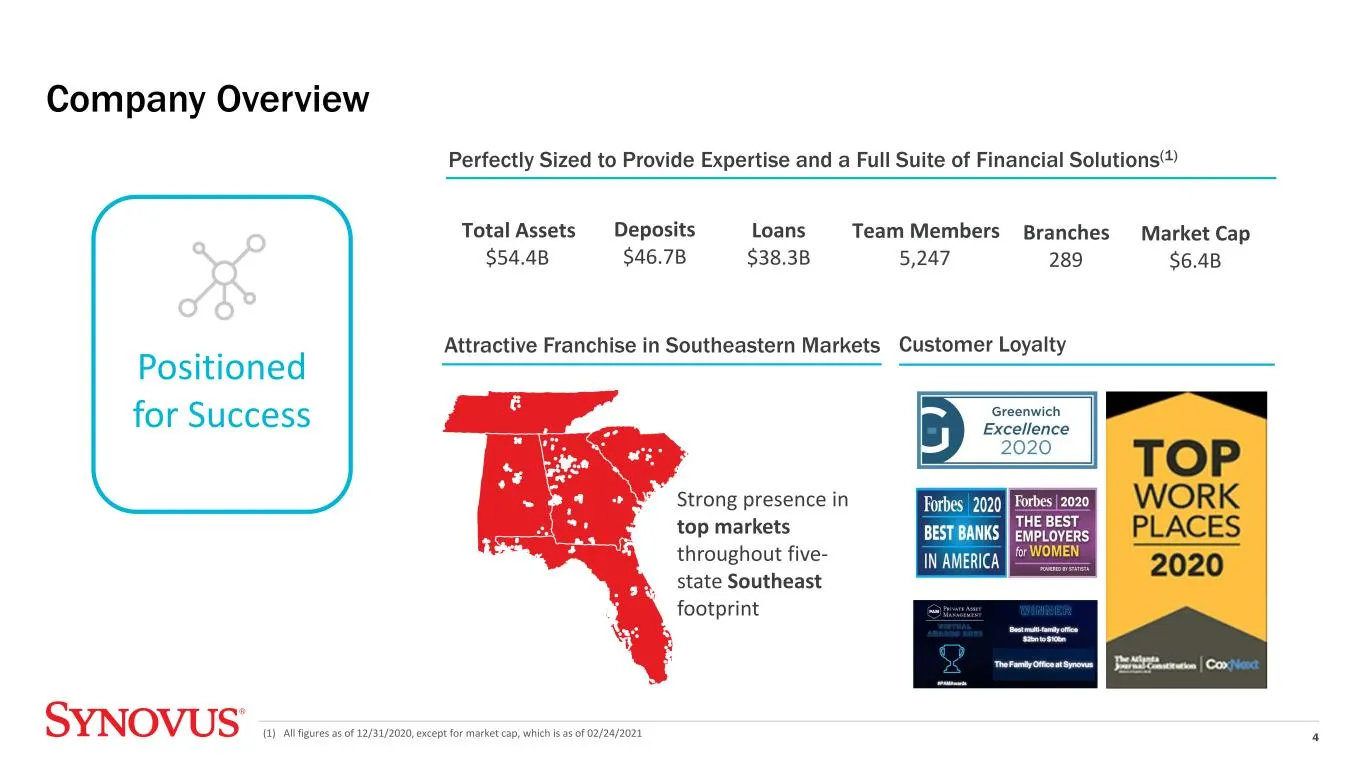
Slide 4: Attractive Franchise in Southeastern Markets
Attractive Franchise in Southeastern Markets Company Overview (1) All figures as of 12/31/2020, except for market cap, which is as of 02/24/2021 Perfectly Sized to Provide Expertise and a Full Suite of Financial Solutions(1) Total Assets $54.4B Loans $38.3B Deposits $46.7B Branches 289 Team Members
Slide 5: Strong and Stable Foundation
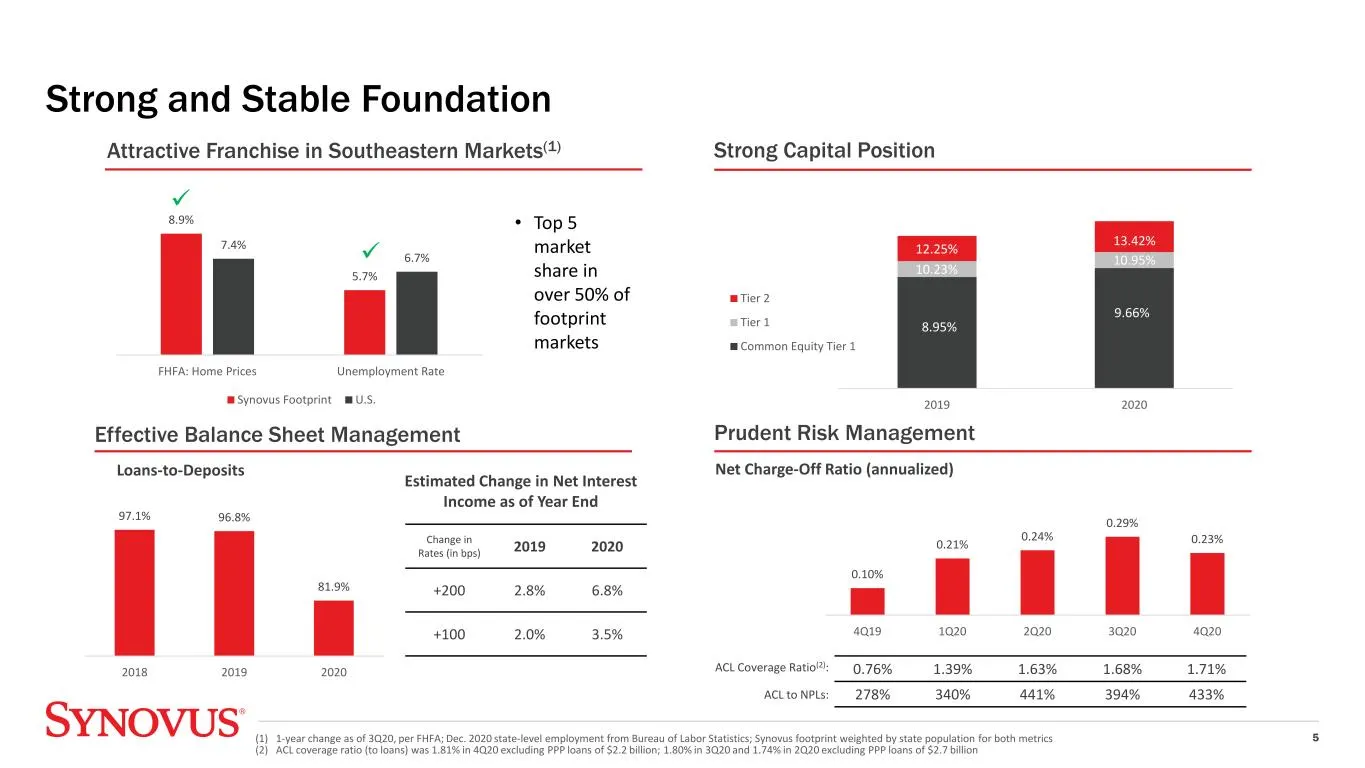
Strong and Stable Foundation 5 Effective Balance Sheet Management Strong Capital Position Prudent Risk Management 8.9% 5.7% 7.4% 6.7% FHFA: Home Prices Unemployment Rate Synovus Footprint U.S. 2019 2020 Tier 2 Tier 1 Common Equity Tier 1 8.95% 9.66% 10.23% 10.95% 12.25% 13.42% (1) 1-year change as
Slide 6: Delivering a Superior Customer Experience
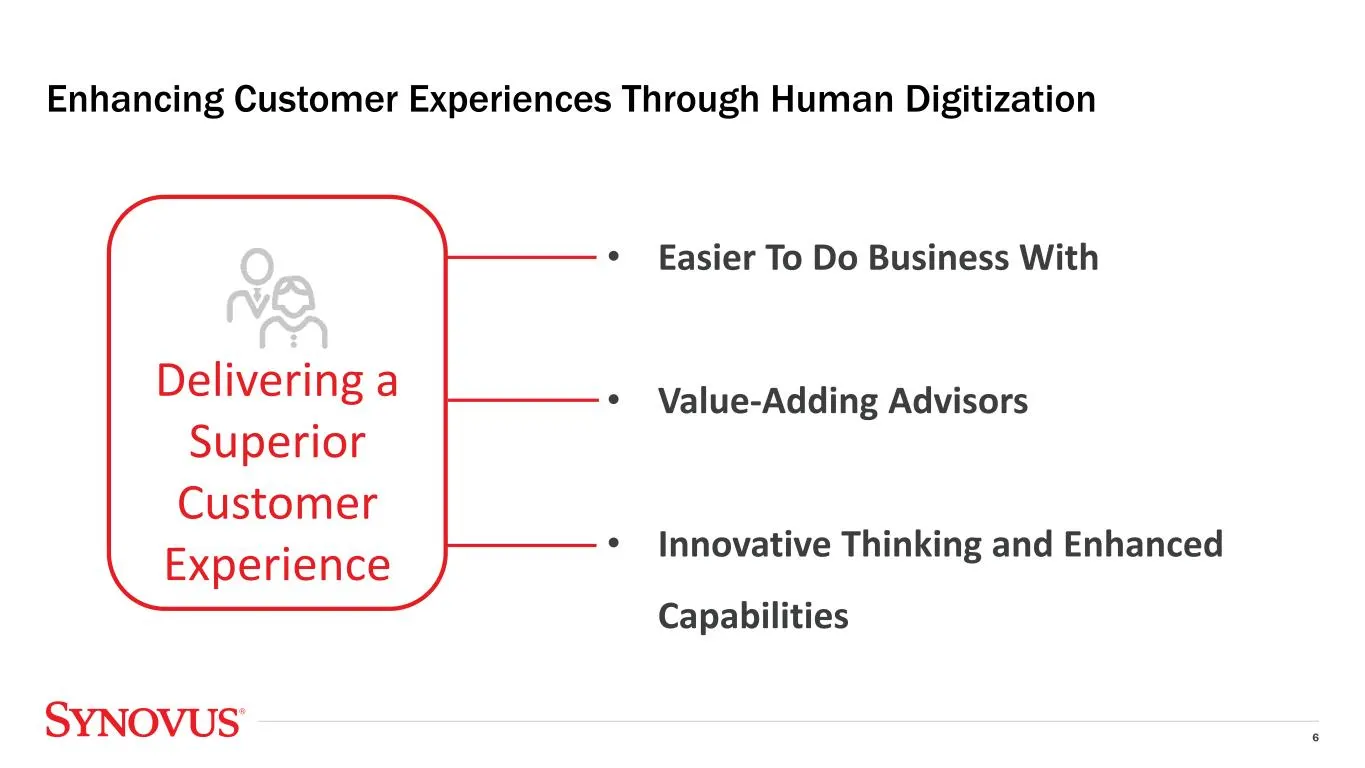
6 Enhancing Customer Experiences Through Human Digitization • Easier To Do Business With • Value-Adding Advisors • Innovative Thinking and Enhanced Capabilities Delivering a Superior Customer Experience
Slide 7: Enhancing Customer Experiences Through Human Digitization
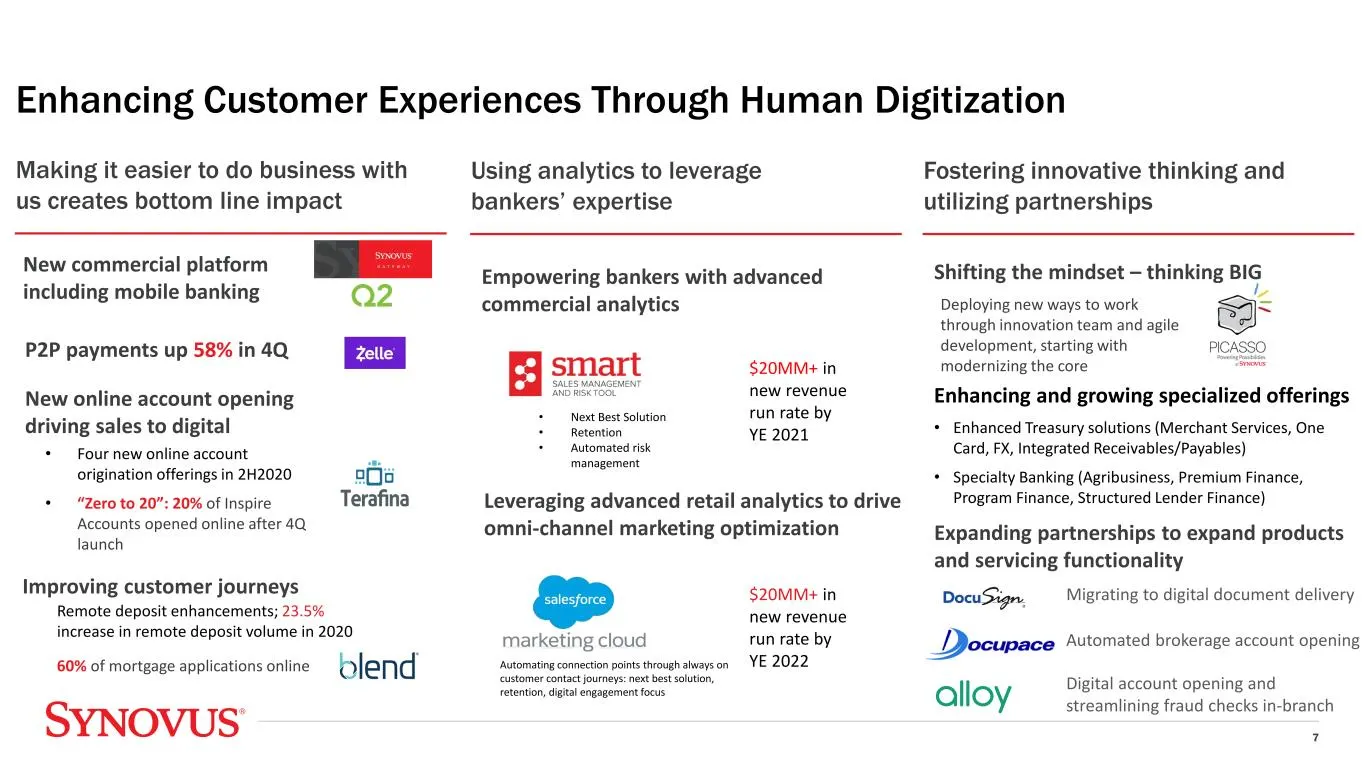
Enhancing and growing specialized offerings • Enhanced Treasury solutions (Merchant Services, One Card, FX, Integrated Receivables/Payables) • Specialty Banking (Agribusiness, Premium Finance, Program Finance, Structured Lender Finance) 7 Making it easier to do business with us creates bottom line i
Slide 8: Committed to Profitable Growth
Delivering Top-Quartile Growth and Returns 8 Sources of and Investments in Growth Efficiency with Growth Committed to Profitable Growth
Slide 9: Well-Positioned for Profitable Growth
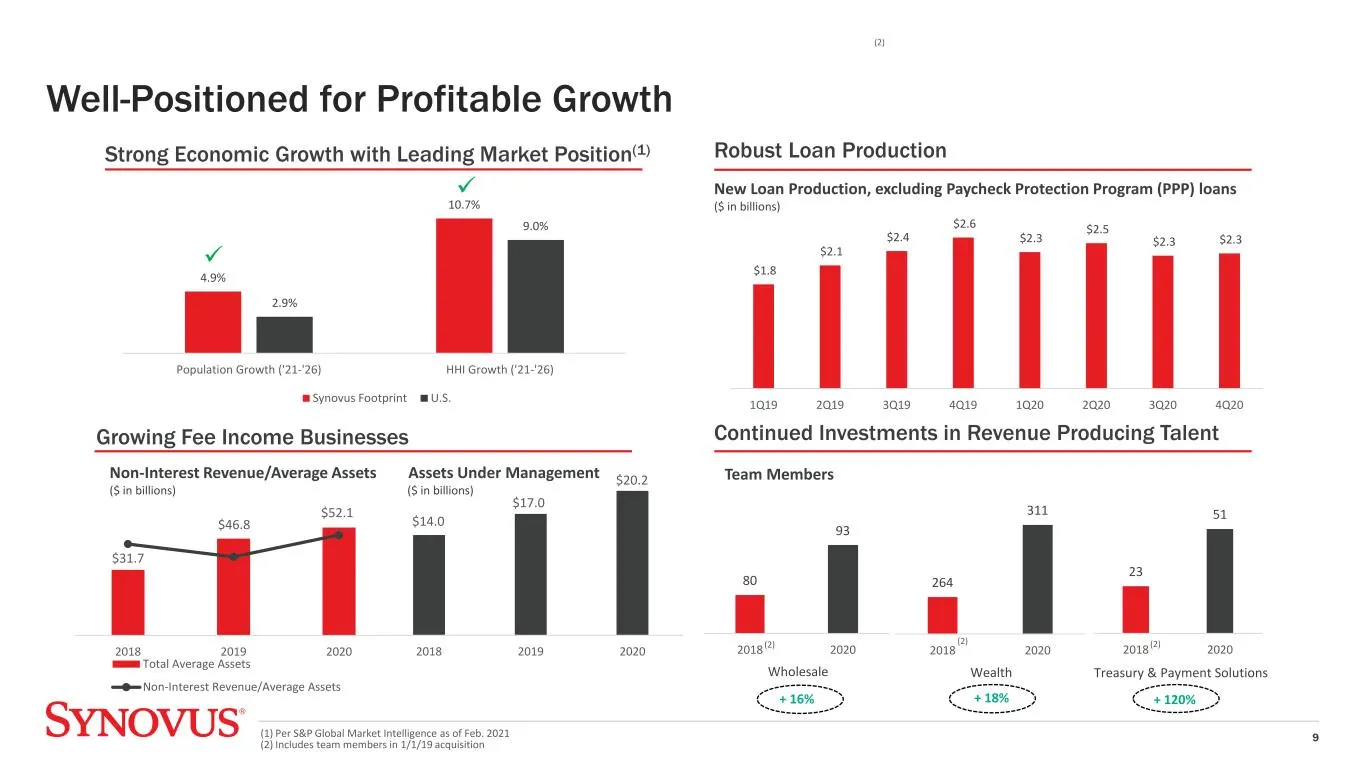
Well-Positioned for Profitable Growth 9 Growing Fee Income Businesses Robust Loan Production Continued Investments in Revenue Producing Talent 2018 2019 2020 Total Average Assets Non-Interest Revenue/Average Assets Non-Interest Revenue/Average Assets ($ in billions) $52.1 $46.8 $31.7 0.97% 0.76% 0.8
Slide 10: Committed to Expense Discipline
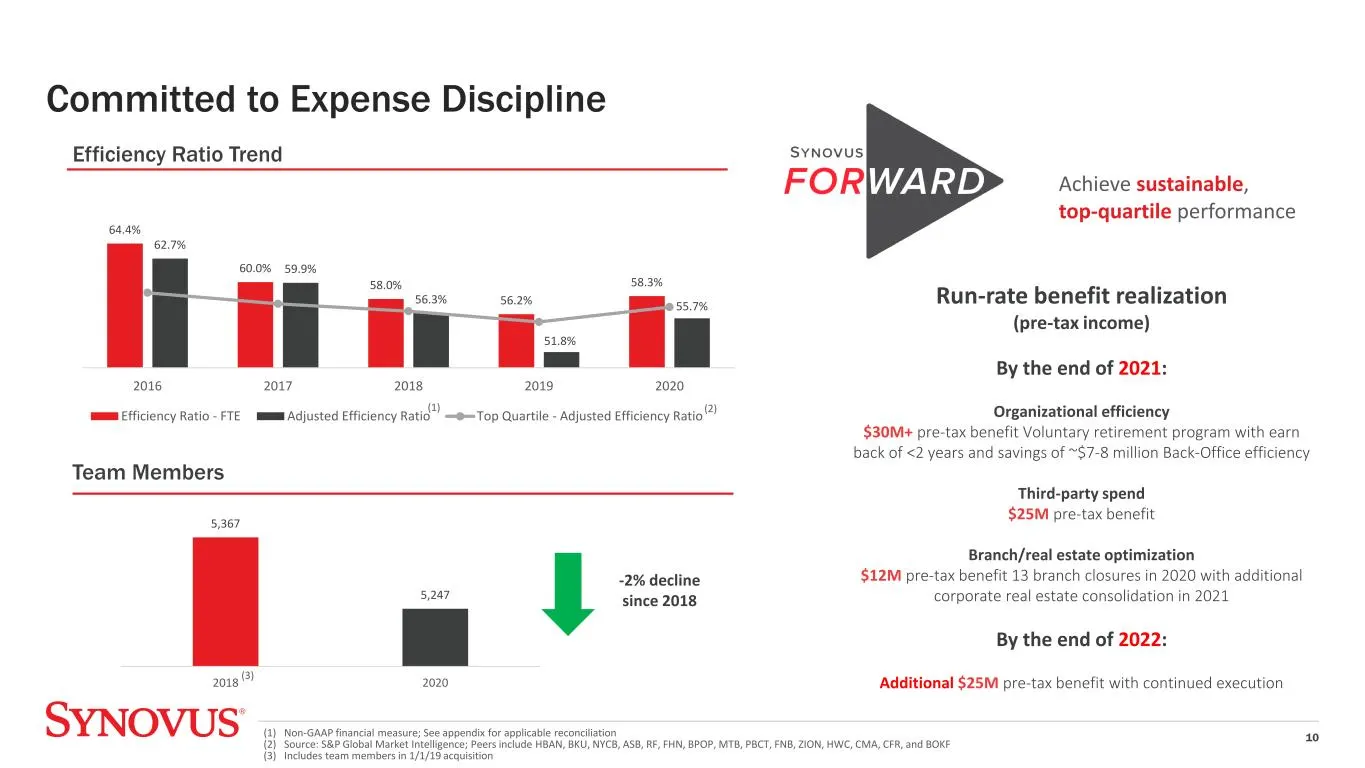
Committed to Expense Discipline 10 (2) (1) Non-GAAP financial measure; See appendix for applicable reconciliation (2) Source: S&P Global Market Intelligence; Peers include HBAN, BKU, NYCB, ASB, RF, FHN, BPOP, MTB, PBCT, FNB, ZION, HWC, CMA, CFR, and BOKF (3) Includes team members in 1/1/19 acquisiti
Slide 11: Our Focused Strategy Gives Us the Right to Win
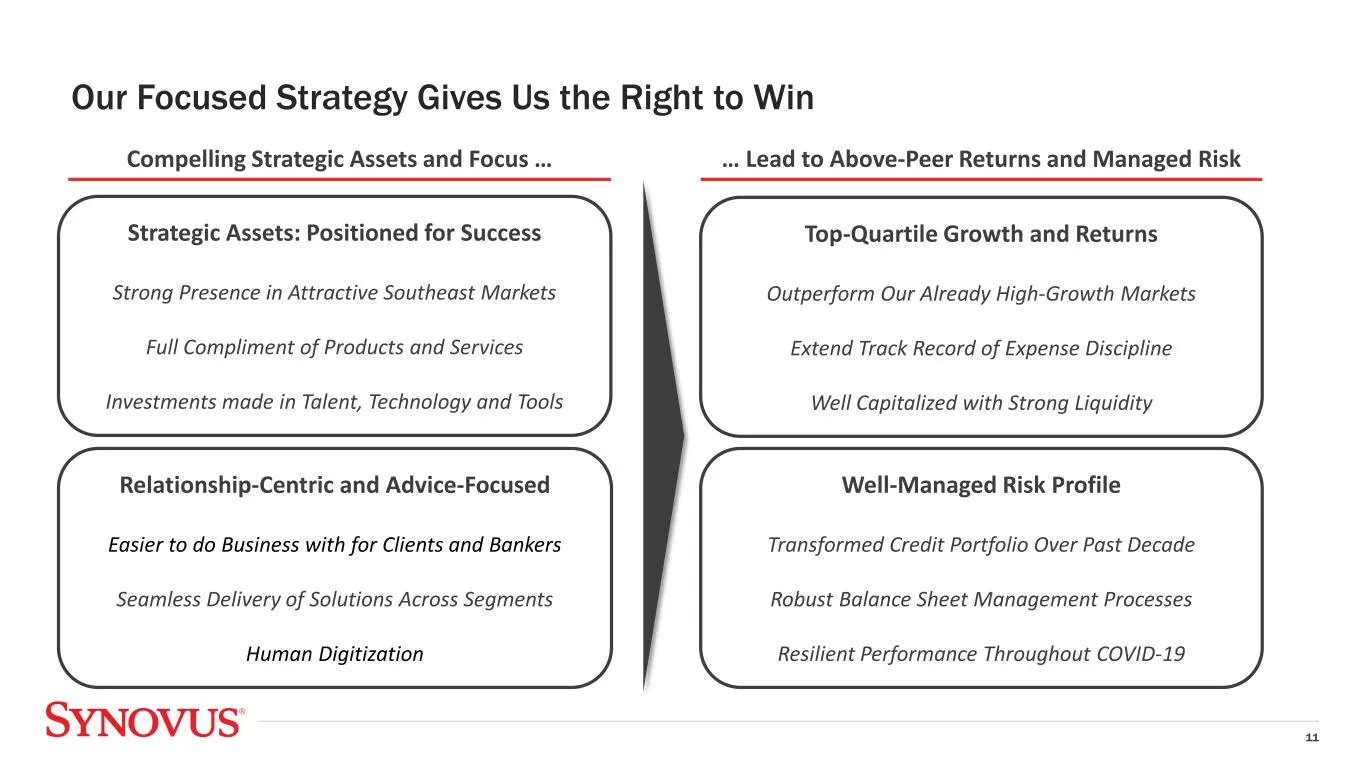
11 Our Focused Strategy Gives Us the Right to Win Compelling Strategic Assets and Focus … … Lead to Above-Peer Returns and Managed Risk Strategic Assets: Positioned for Success Strong Presence in Attractive Southeast Markets Full Compliment of Products and Services Investments made in Talent, Techno

Slide 12: Appendix
Appendix
Slide 13: COVID-19 Impact on Cash Flows
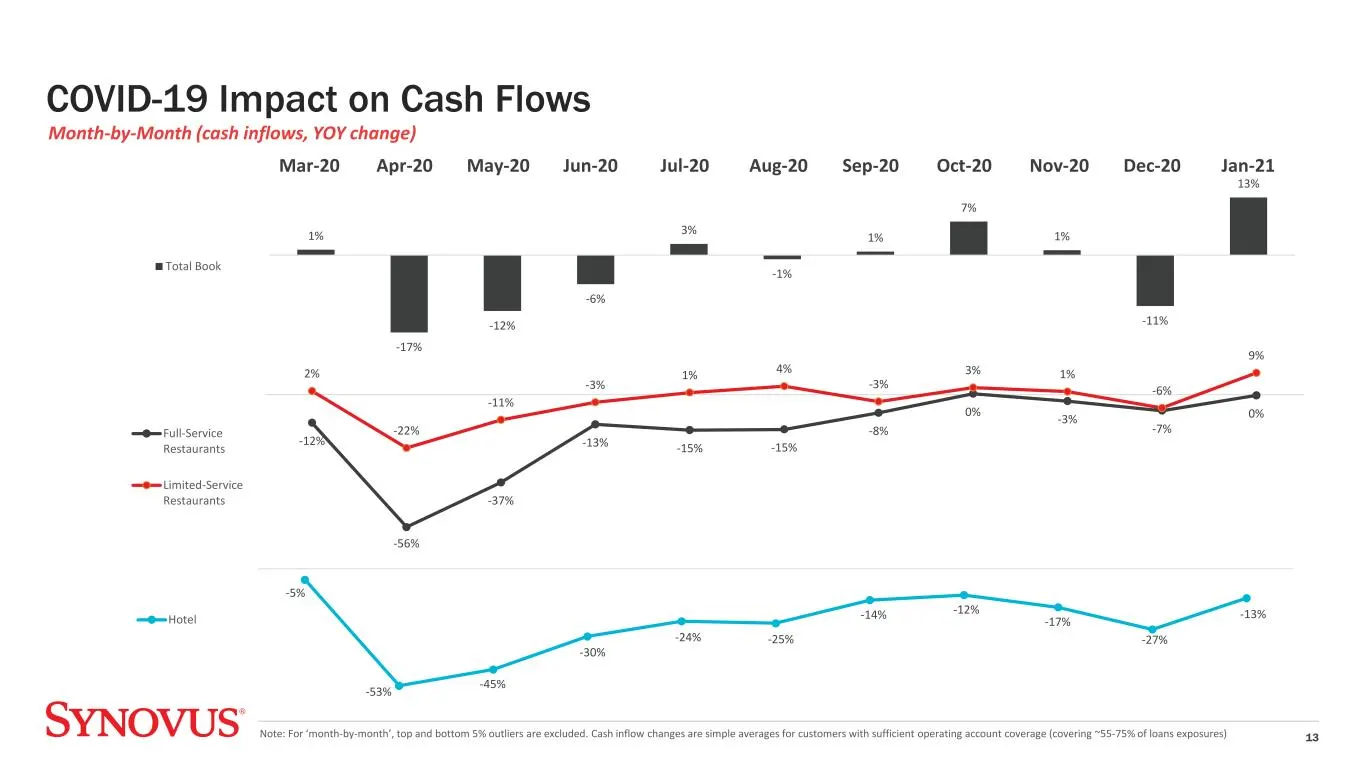
COVID-19 Impact on Cash Flows 13Note: For ‘month-by-month’, top and bottom 5% outliers are excluded. Cash inflow changes are simple averages for customers with sufficient operating account coverage (covering ~55-75% of loans exposures) 1% -17% -12% -6% 3% -1% 1% 7% 1% -11% 13% Total Book -12% -56% -
Slide 14: Paycheck Protection Program (PPP)
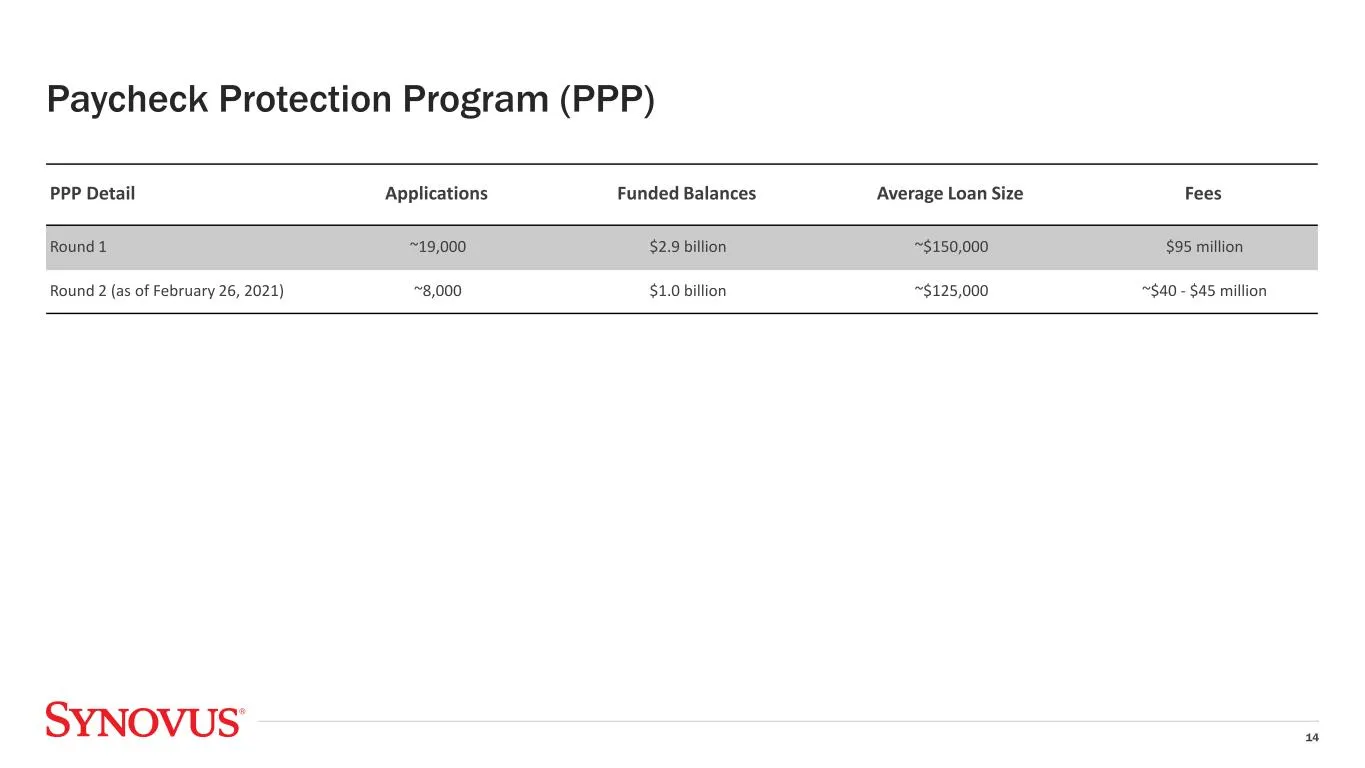
14 Paycheck Protection Program (PPP) PPP Detail Applications Funded Balances Average Loan Size Fees Round 1 ~19,000 $2.9 billion ~$150,000 $95 million Round 2 (as of February 26, 2021) ~8,000 $1.0 billion ~$125,000 ~$40 - $45 million
Slide 15: Non-GAAP Financial Measures
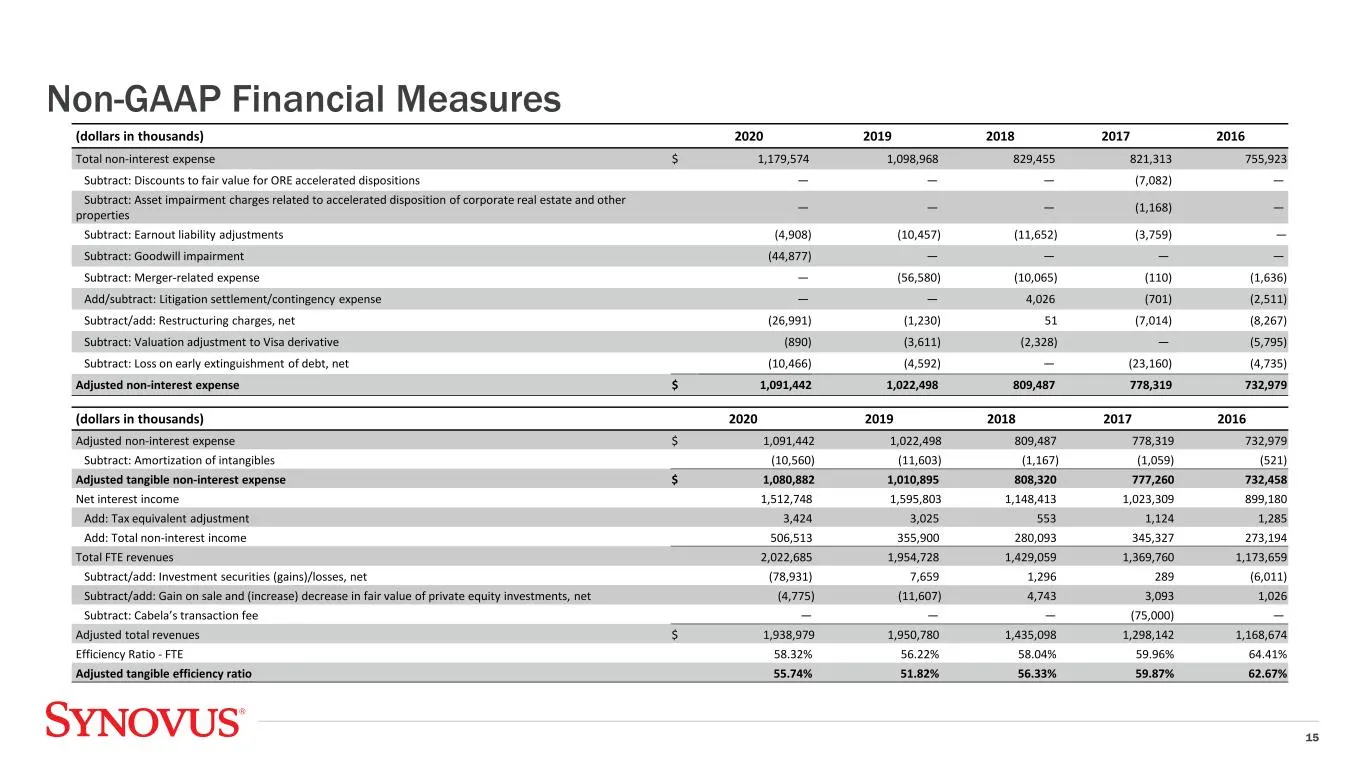
Non-GAAP Financial Measures 15 (dollars in thousands) 2020 2019 2018 2017 2016 Total non-interest expense $ 1,179,574 1,098,968 829,455 821,313 755,923 Subtract: Discounts to fair value for ORE accelerated dispositions — — — (7,082) — Subtract: Asset impairment charges related to accelerated disposi
Source: SEC EDGAR · 8-K filed Mar 2, 2021
More decks from Synovus Financial Corp
 Goldman Sachs 2025 Financial Services Conference15 slides · Dec 8, 2025
 Debt Investor Presentation (December 2025)9 slides · Dec 1, 2025
 Merger or Acquisition (November 2025)5 slides · Nov 26, 2025
 Merger or Acquisition (November 2025)6 slides · Nov 6, 2025
 Q3 2025 Earnings Presentation47 slides · Oct 16, 2025
 Merger or Acquisition (August 2025)27 slides · Aug 28, 2025