Allegheny Energy — Edison Electric Institute Financial Conference 2006
46 slides from Allegheny Energy's conference presentation, Nov 3, 2006
Slide 1: Allegheny Energy
Allegheny Energy Edison Electric Institute Financial Conference November 5-8, 2006
Slide 2: Forward-Looking Statements
Forward-Looking Statements In addition to historical information, this presentation contains a number of "forward-looking statements" as defined in the Private Securities Litigation Reform Act of 1995. Words such as anticipate, expect, project, intend, plan, believe and words and terms of similar su
Slide 3: Non-GAAP Financial Measures
Non-GAAP Financial Measures This presentation includes non-GAAP financial measures as defined in the Securities and Exchange Commission’s Regulation G. Where noted, the presentation shows certain financial information on an “as adjusted” basis, to exclude the effect of certain items as described her
Slide 4: Generation Delivery
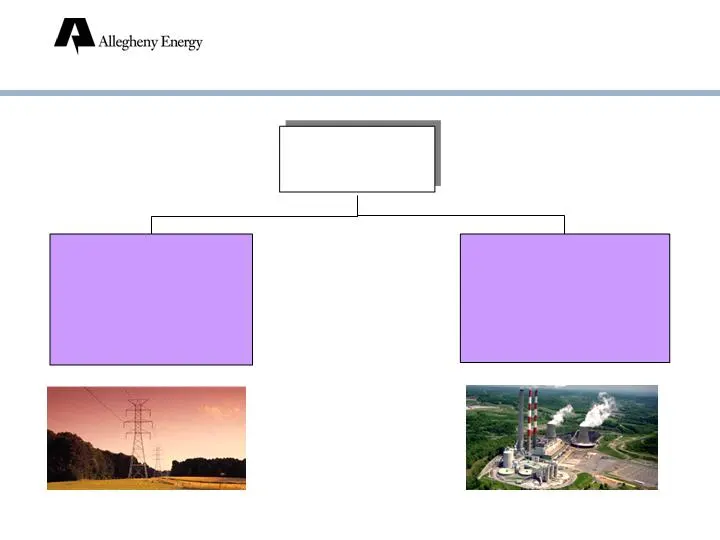
Generation Delivery Allegheny Energy Allegheny Energy Coal-fired, PJM 48.1 million MWH* 1.6 million customers, PA-MD-WV-VA * 12 months ended December 31, 2005
Slide 5: Earnings Growth Drivers
Earnings Growth Drivers Increase generation rates Improve plant availability Control O&M expense Complete West Virginia rate case Expand transmission system Other growth catalysts
Slide 6: Pennsylvania POLR Rate
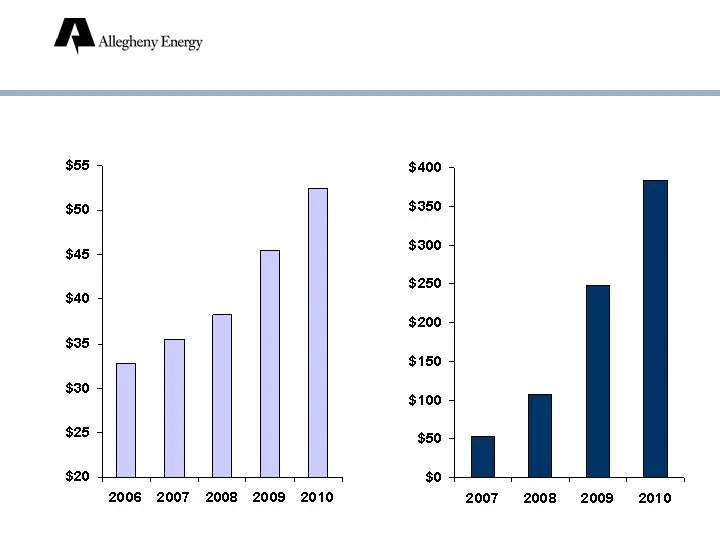
Pennsylvania POLR Rate $ per MWH Cumulative Increase in Pre-Tax Operating Income $ millions; estimates Growth Driver: Increase Generation Rates
Slide 7: Growth Driver: Increase Generation Rates
Growth Driver: Increase Generation Rates July January 2007 2009 State Virginia Maryland MWH transitioning 1.0 - 3.2 million* 3.5 million to market-based rates Increase in pre-tax income $20-60 million* $60 million * annualized
Slide 8: Growth Driver: Improve Plant Availability
Goal Supercritical Coal Units Each 1% improvement provides benefit >$10 million Est. Growth Driver: Improve Plant Availability Goal
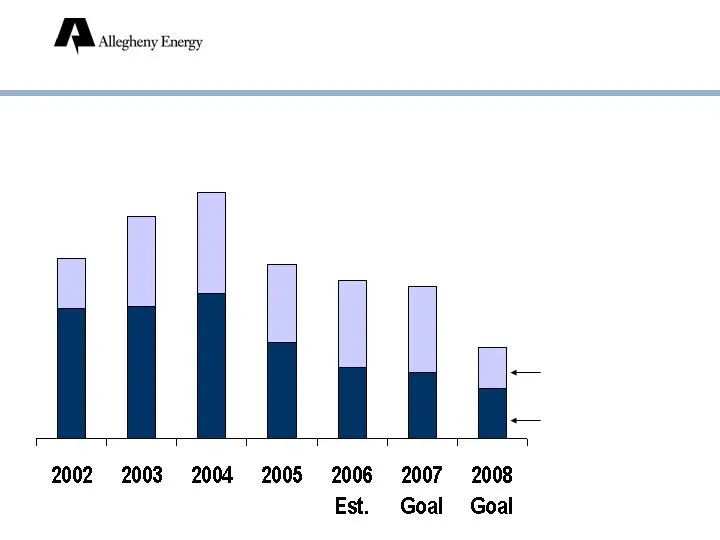
Slide 9: Achieve 91% Availability
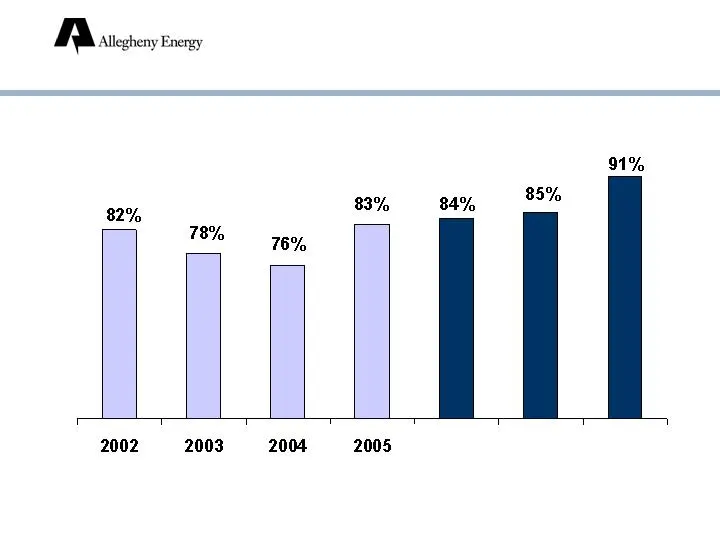
Achieve 91% Availability Outage Factor (supercritical units) 22% 24% 17% 16% 15% 9% Reduce planned outages Reduce unplanned outages 18%
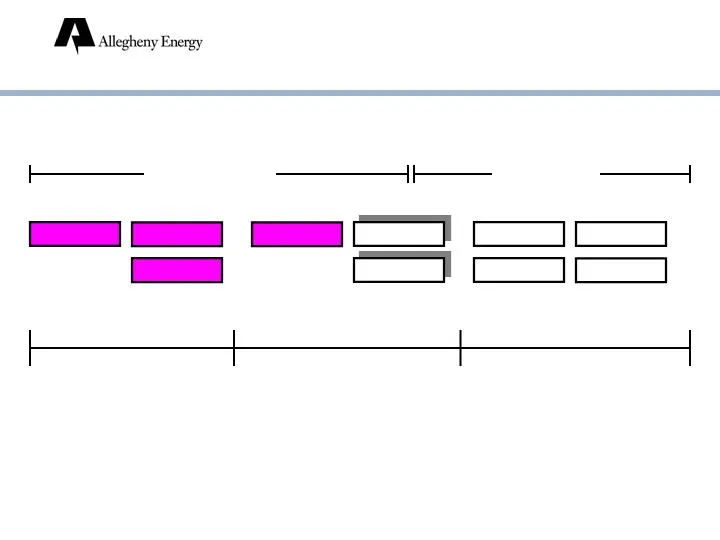
Slide 10: Improving Availability: Conducting Extended Planned Outages
Ft. Martin 2 COMPLETED PLANNED Harrison 1 Harrison 3 Hatfield 1 Hatfield 3 Pleasants 2 Ft. Martin 1 Hatfield 2 Harrison 2 Pleasants 1 Improving Availability: Conducting Extended Planned Outages
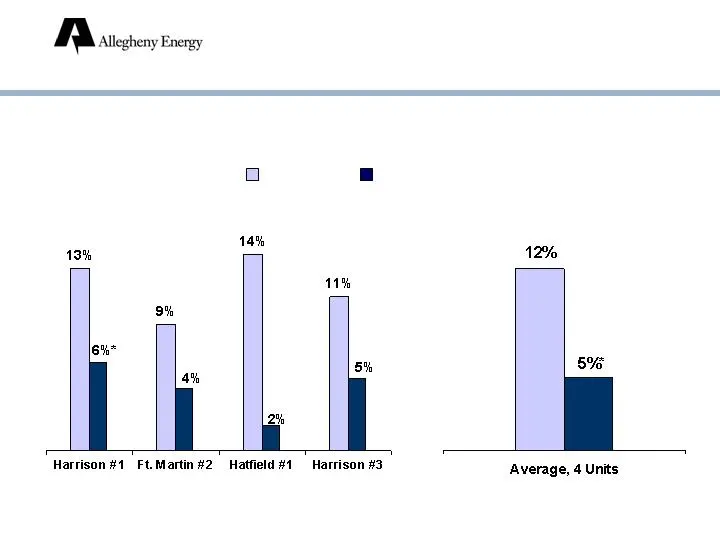
Slide 11: Unplanned Outage Factor
Unplanned Outage Factor Units Which Completed Extended Outages Planned Outages: Results Pre-outage Post-outage * Including transformer failure: Harrison 1 = 10%, average = 6%. Post-outage average is time weighted.
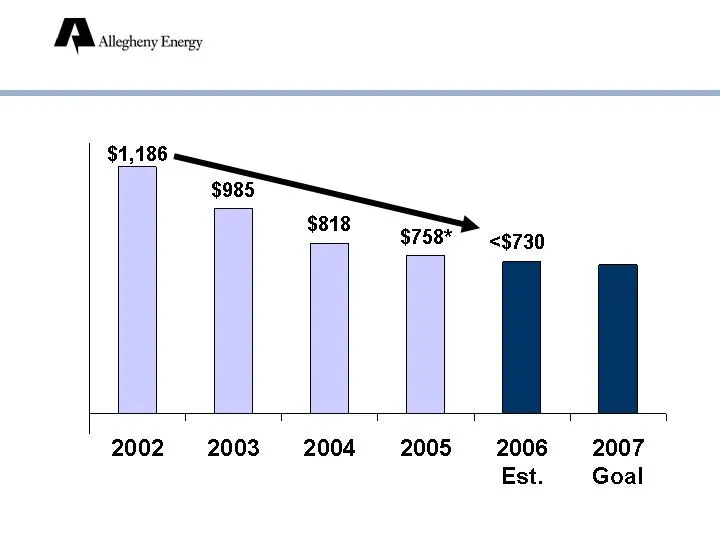
Slide 12: Growth Driver: Control O&M Expense
$700-730 Growth Driver: Control O&M Expense * 2005 = $775 after adjustment ($ millions)
Slide 13: Growth Driver: West Virginia Rate Case
Requested $100 million net increase Fuel, purchased power: $126 million increase Base rates: $26 million decrease 10% net increase (residential) Requested reinstatement of fuel cost adjustment Proposed ROE: 11.75% Probable effective date: late May 2007 Growth Driver: West Virginia Rate Case
Slide 14: Growth Driver: Expand Transmission System
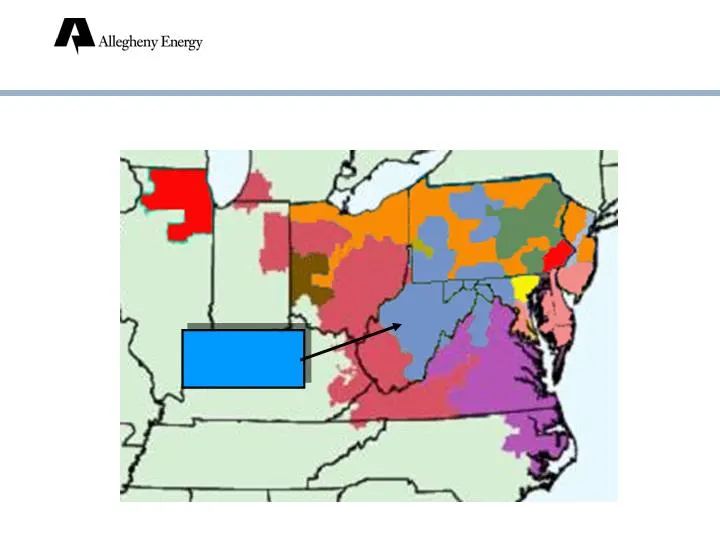
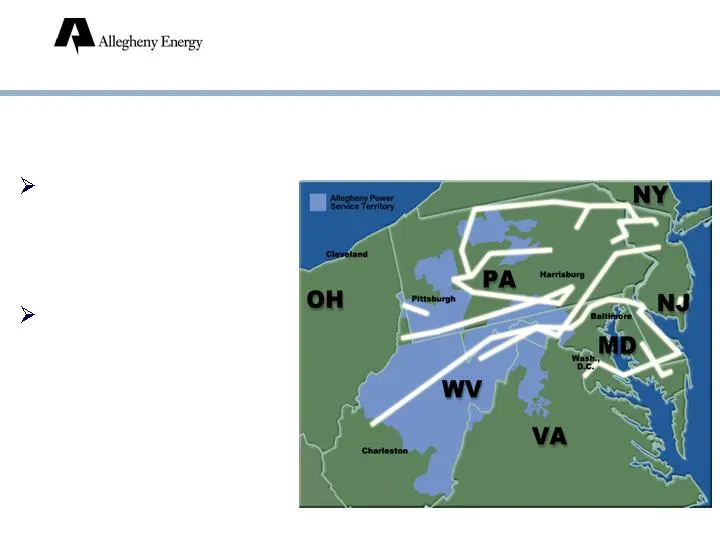
Growth Driver: Expand Transmission System Allegheny Energy Located In the Heart of PJM
Slide 15: Growth Driver: Expand Transmission System
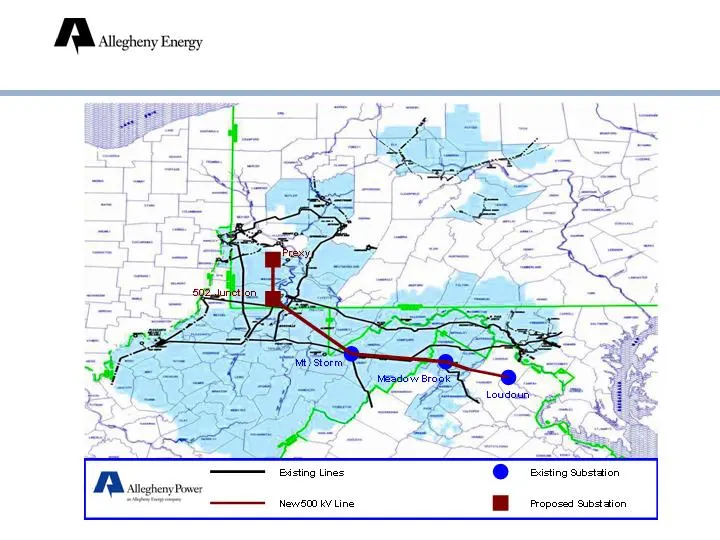
Growth Driver: Expand Transmission System 2007: enhance near-term reliability Cost: $70 million By 2011: construct ~210-mile line Cost: over $850 million (preliminary estimate) FERC approved incentive rate treatment, including return during construction Separate legal entity to own, construct 85% of
Slide 16: Existing Lines and Proposed 500 kV Line
isting Lines Existing Substation Neww600 kV Line Proposed Substation
Slide 17: Potential for Additional Transmission Investment
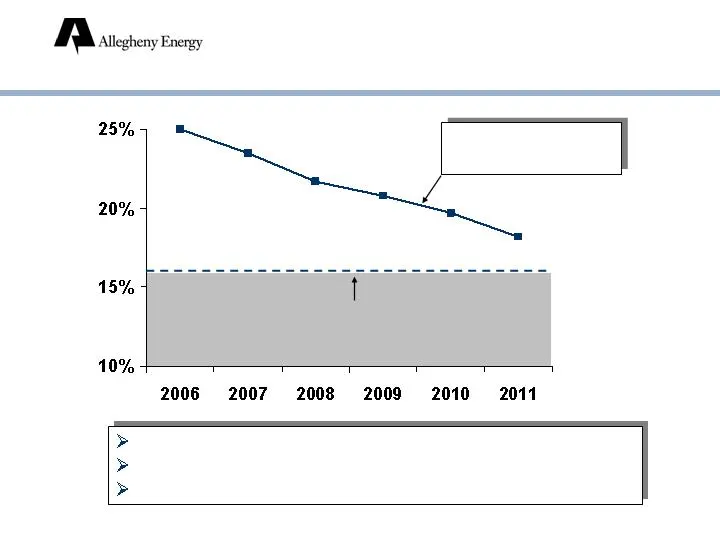
Potential for Additional Transmission Investment Most projects under consideration pass through Allegheny’s service area PJM to select best solutions in early Under Consideration by PJM for 2012-2021 Plan
Slide 18: Other Growth Catalysts
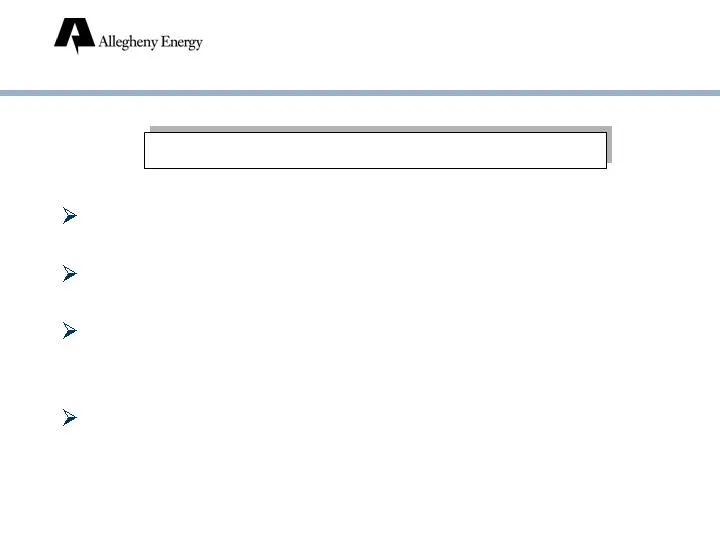
Other Growth Catalysts Projected PJM Reserve Margin Increasing marginal heat rate Gas will more frequently impact PJM energy prices Improving capacity values 16% PJM Target
Slide 19: Proposed PJM Regional Pricing Model
Provides advance price signal for capacity needs 3-year forward auction market Potentially significant benefits to Allegheny as POLR contracts expire FERC decision requested by late December 2006 Other Growth Catalysts Proposed PJM Regional Pricing Model
Slide 20: Improve Environmental Performance
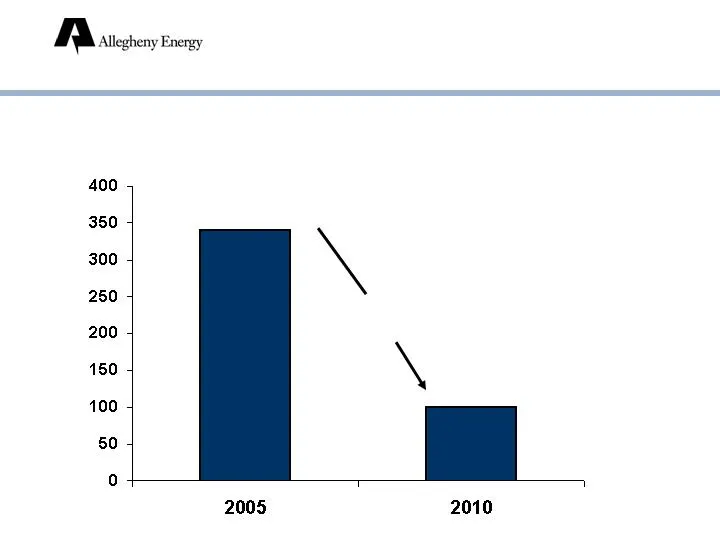
Improve Environmental Performance By 2010: One of the cleanest coal fleets in the U.S. $500 – 550 Ft. Martin Scrubbers ~$650 Hatfield Scrubbers $110 Pleasants Bypass IN SERVICE ESTIMATED COST ($ Millions)
Slide 21: Improve Environmental Performance
Improve Environmental Performance SO 2 Emissions (thousands of tons) 70% reduction
Slide 22: Financial Review
Improving financial results Reduced debt Improving credit statistics Contracting generation and coal 2007 earnings growth drivers Financial Review
Slide 23: Improving Financial Results
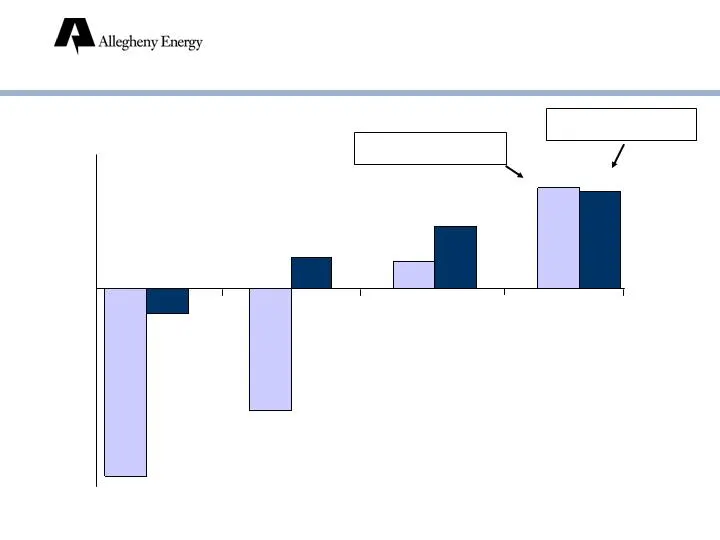
Improving Financial Results Earnings per Share 9 mos. ($2.80) ($0.37) ($1.83) $0.47 $0.40 $0.94 $1.51 $1.46 As Reported As Adjusted
Slide 24: Cash Flow
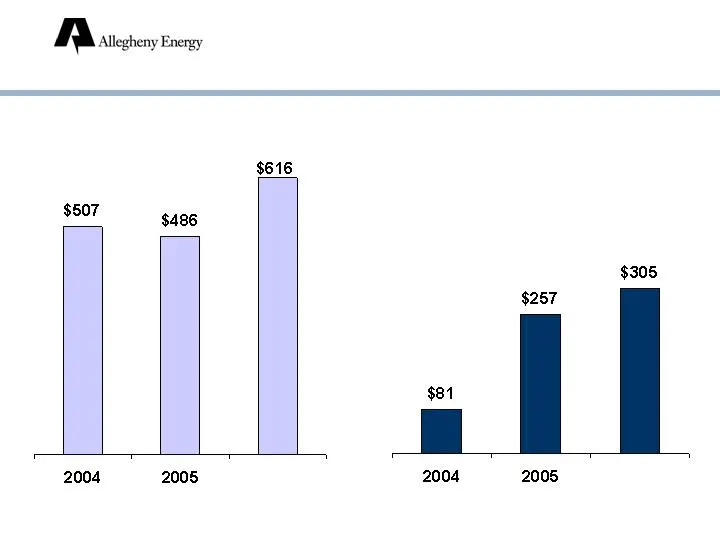
Cash Flow ($ millions) Cash from Operations as reported Free Cash Flow (adjusted cash from operations net of capital expenditures) 9 mos. 9 mos.
Slide 25: Debt Outstanding
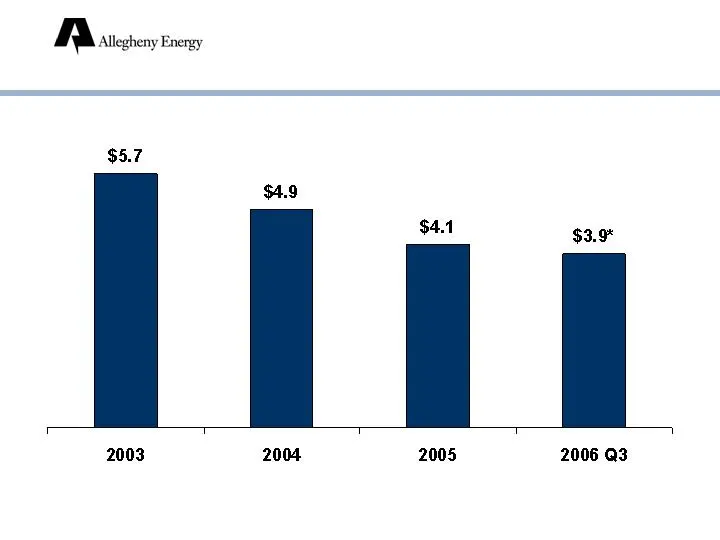
Debt Outstanding ($ billions) * $3.6 billion after $300 million maturity on October 1, 2006
Slide 26: Capital Expenditures
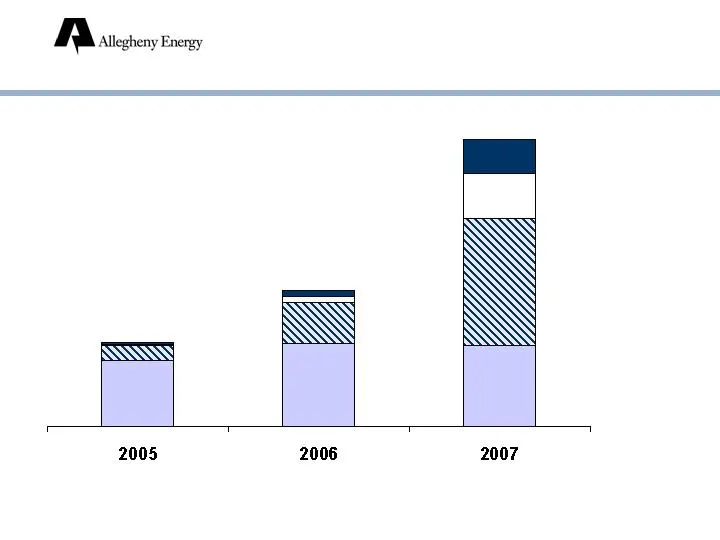
Capital Expenditures ($ millions) $307 ~$1,000 ~$500 Environmental – other Environmental – securitized All other Transmission
Slide 27: Credit Statistics: Targets Remain Unchanged
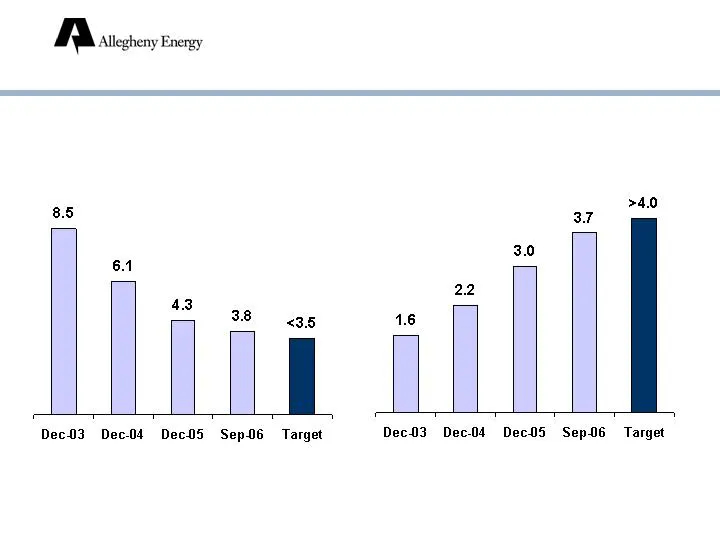
Debt/EBITDA * EBITDA/Interest * * Based on adjusted EBITDA and adjusted interest for 12-month periods. Excludes securitized debt and interest. Credit Statistics: Targets Remain Unchanged
Slide 28: Contracting Generation and Coal
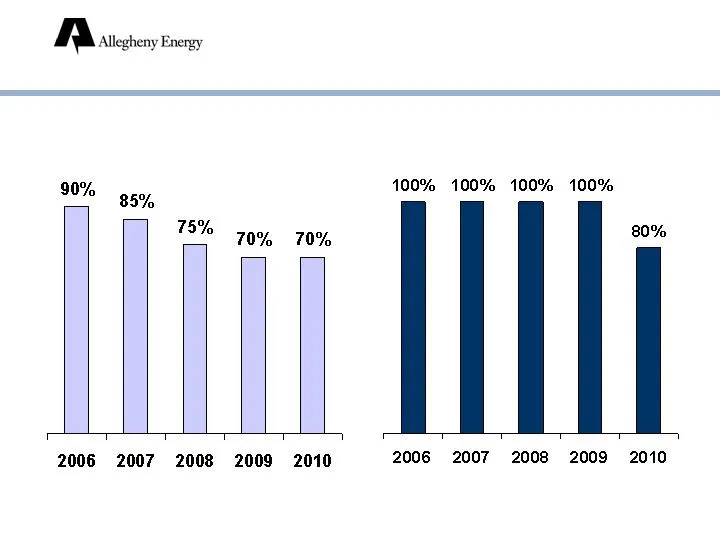
Contracting Generation and Coal Generation Under Contract % of Total Projected Output Coal Under Contract % of Fixed-Price Commitments* * Excludes West Virginia
Slide 29: 2007 Earnings Growth: Key Drivers
2007 Earnings Growth: Key Drivers *2007 vs. 2006 as adjusted positive/negative Other factors Interest expense (30) Higher SO 2 allowance costs (45) Higher coal prices -- O&M expense Plant availability positive/negative Market prices Maryland customer credit Virginia rates West Virginia rate case $50
Slide 30: Supplemental Information
Supplemental Information
Slide 31: Earnings (Loss) Per Share
Earnings (Loss) Per Share 0.56 0.65 Q3 0.22 0.18 Q2 $0.68 $0.67 2006: Q1 0.94 0.40 Year 0.02 0.02 Q4 0.45 0.21 Q3 0.08 (0.12) Q2 $0.39 $0.29 2005: Q1 0.47 (1.83) Year 0.22 0.48 Q4 0.37 (2.40) Q3 (0.21) (0.31) Q2 $(0.03) $0.25 2004: Q1 (0.37) (2.80) Year (0.14) (0.11) Q4 0.11 (0.40) Q3 $(0.23) (1.82)
Slide 32: EBITDA
EBITDA 286.3 286.3 Q3 193.6 193.6 Q2 $322.1 $322.1 2006: Q1 890.2 888.6 Year 162.1 162.1 Q4 274.2 254.7 Q3 192.7 210.6 Q2 $261.3 $261.3 2005: Q1 762.5 914.0 Year 221.8 312.7 Q4 243.2 243.2 Q3 122.0 110.3 Q2 $175.5 $247.8 2004: Q1 634.9 156.8 Year 185.6 197.4 Q4 225.3 117.3 Q3 150.1 (203.5) Q2 $92.9
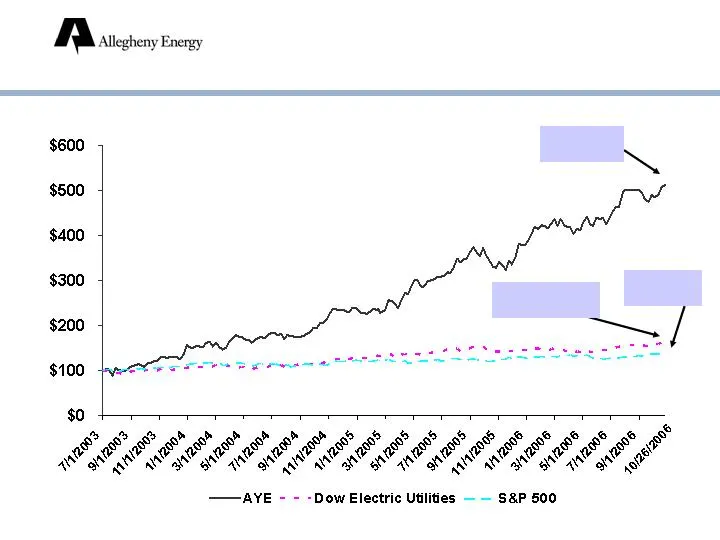
Slide 33: Stock Price Performance
Stock Price Performance $100 Invested on July 1, 2003 AYE: $512 Dow Electrics: $164 S&P: $141 The Road to Growth
Slide 34: Enhance Operating Performance
Financial Performance Engaged Employees Environmental Stewardship Shareholder Value Operational Excellence Customer Satisfaction Enhance Operating Performance VISION: “To Be a Top Performing Utility by Year-End 2007”
Slide 35: Generation and Marketing: Overview
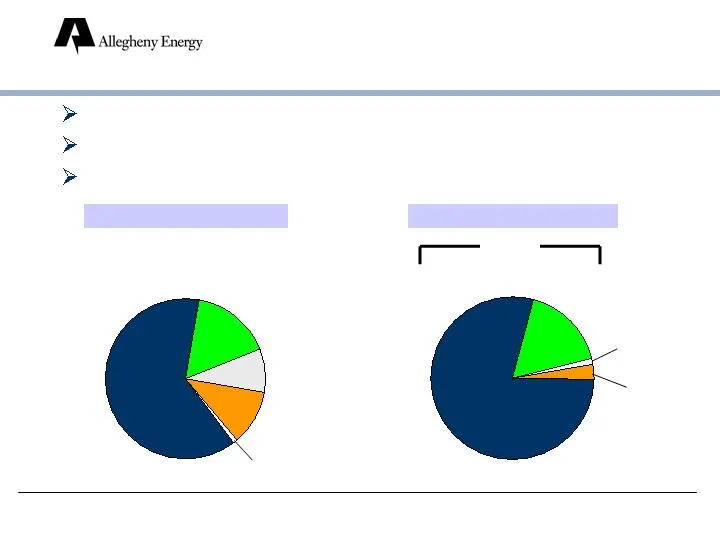
Generation and Marketing: Overview Capacity* * Excludes Gleason peaking unit (held for sale). Output for year ended December 31, 2005. Capacity: over 9,600 MW* Primarily base load coal-fired plants Located in PJM (13 states) MWH Output* Hydro 11% Gas 9% Supercritical Coal 63% Other Coal 16% Oil 1% S
Slide 36: Low-Cost Generation Fleet
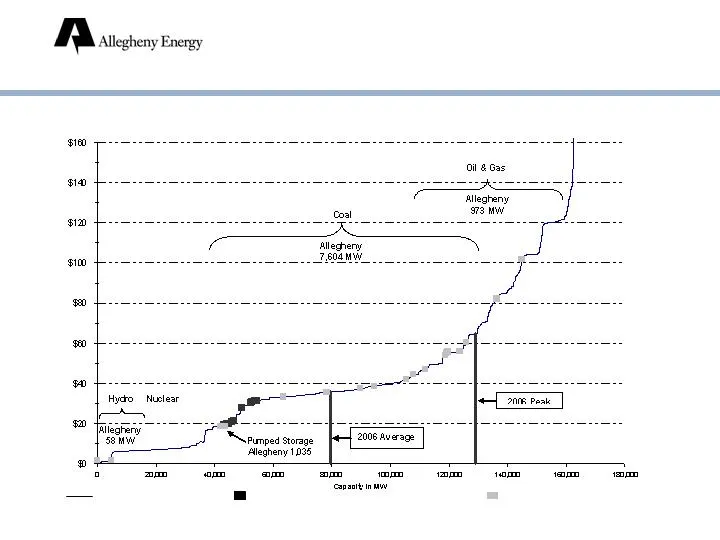
Low-Cost Generation Fleet Allegheny has an advantaged dispatch in PJM PJM Dispatch Cost (Ozone Season): $/MWh Allegheny Supercritical Coal Units Dispatch Cost Allegheny – Other Units Assumptions: natural gas delivered at approximately $8.00/mmBTU; coal at approximately $2.75/mmBTU; SO at $670/ton; N
Slide 37: PJM -- An Attractive Market
World’s largest competitive power market Over 51 million people 700 million MWH of energy annually 163,500 MW of capacity Nation’s most liquid spot power market Model for FERC’s proposed Standard Market Design Provides transactional flexibility: contracts not required Generation and Marketing: PJM -
Slide 38: Growth Driver: Transition to Market-Based Rates
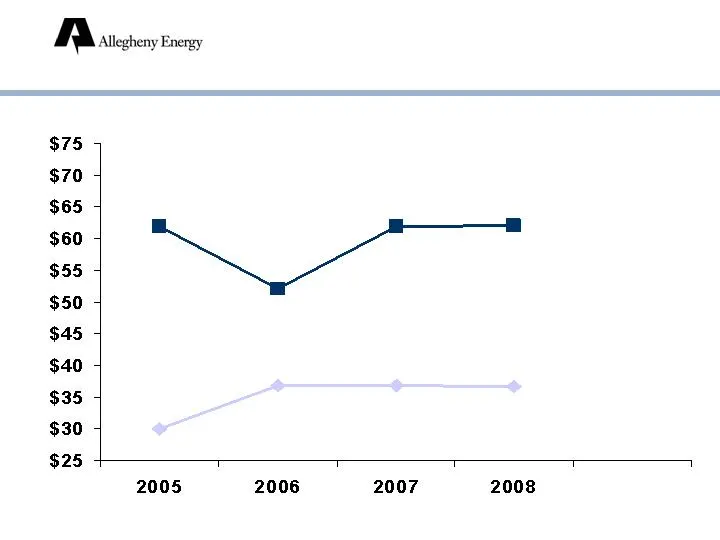
Growth Driver: Transition to Market-Based Rates Market: Current* POLR: Maryland Generation Rates $ per MWH * As of October 9, 2006
Slide 39: Improving Performance, Reducing Spending
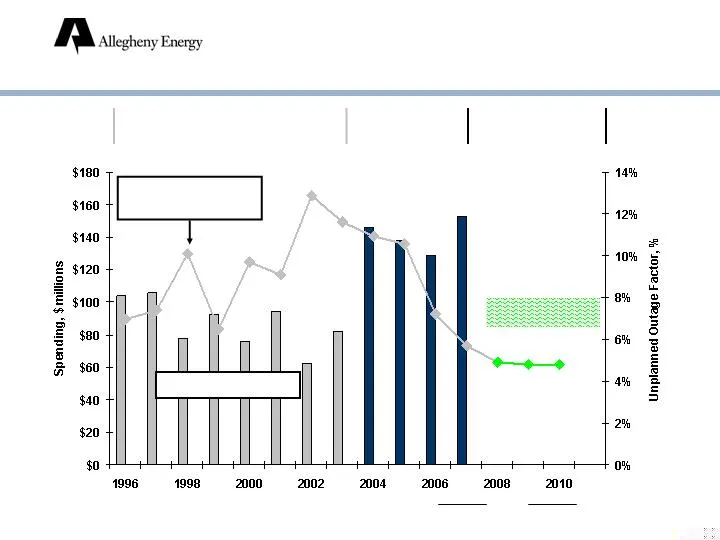
Improving Performance, Reducing Spending O&M and Capital* Unplanned outage factor High Performance Under-investment Re-investment Reduce spending * Special maintenance O&M and capital for supercritical coal units. Excludes environmental spending. Goal
Slide 40: Exposure to SO2 Allowance Market
Exposure to SO 2 Allowance Market SO 2 Emissions in Excess of Allowances (tons; estimated as of October 2006) * Approximately 75% of 2007 and 2008 short position is at Monongahela Power 2006 -0- 2007 40,000* 2008 40,000 - 80,000*
Slide 41: Coal: Average Delivered Cost/Ton
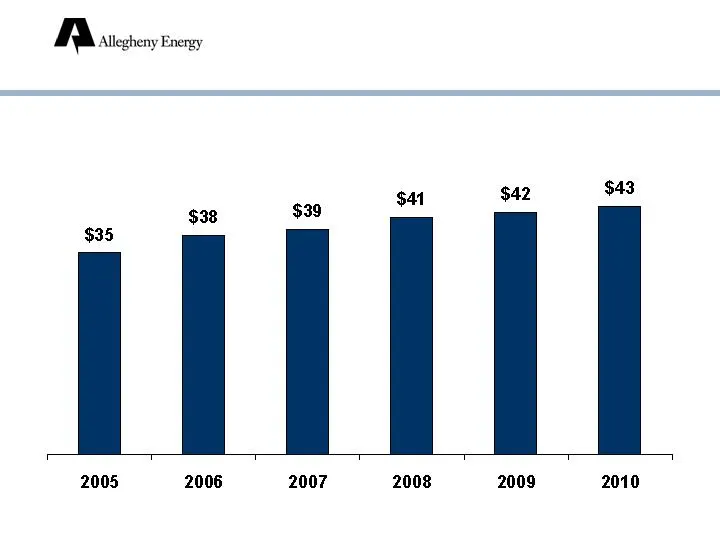
Coal: Average Delivered Cost/Ton Existing Contracts Only
Slide 42: Only 15% of Coal Delivered by Rail
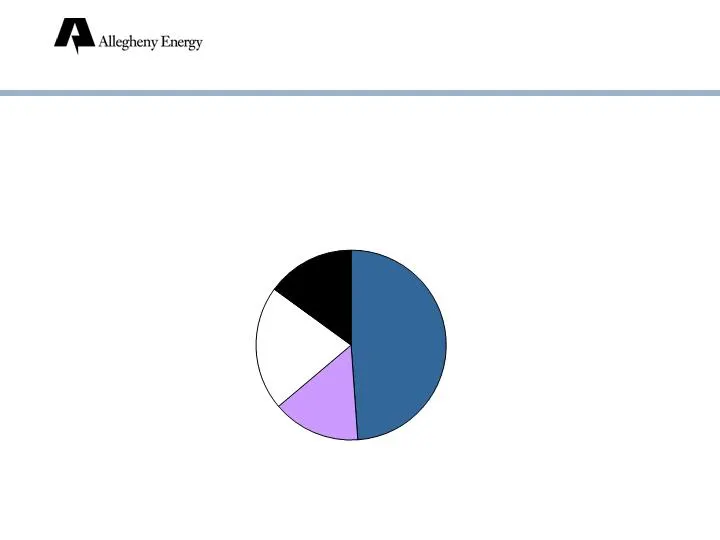
Only 15% of Coal Delivered by Rail Note: Some barge coal originates on short line railroads. Rail 15% Barge 49% Conveyor 15% Truck 21% Coal Delivery Methods
Slide 43: Delivery and Services: Overview
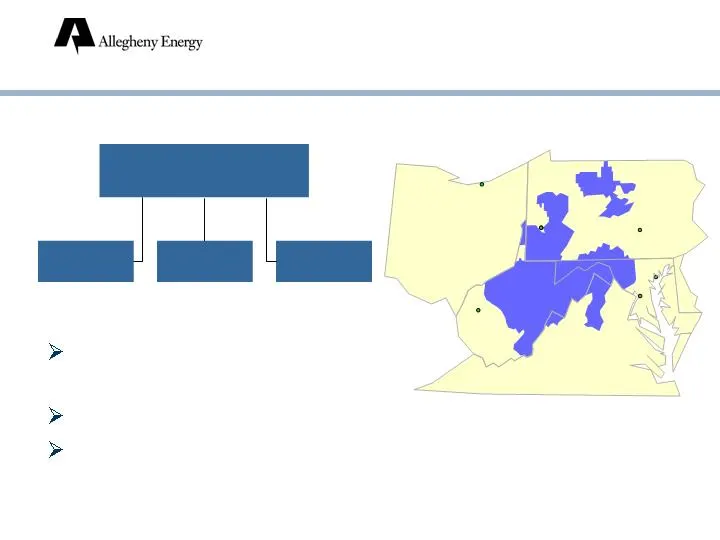
Allegheny Power West Penn Power Monongahela Power Potomac Edison WEST VIRGINIA Delivery and Services: Overview In 4 states (PA, WV, MD, VA) 1.6 million electric customers Load growth: 2.0% compounded annually (1995-2005; retail) VIRGINIA CHARLESTON OHIO HARRISBURG MARYLAND KENTUCKY PENNSYLVANIA CLEV
Slide 44: Delivery and Services: Retail Revenue Mix
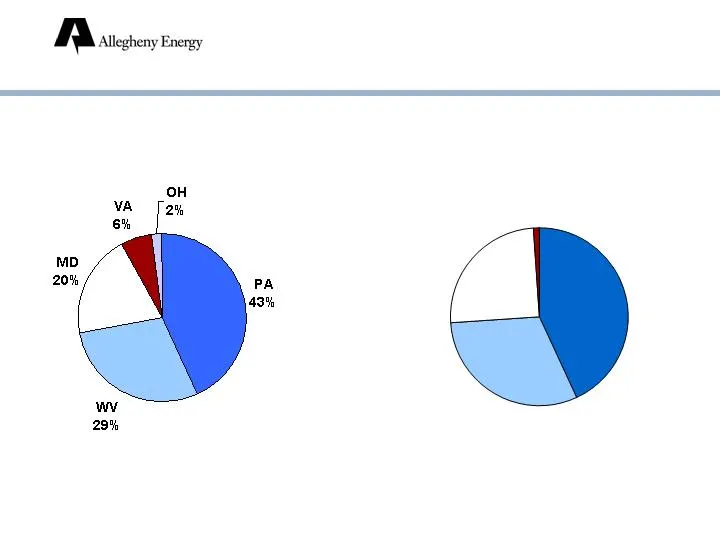
Delivery and Services: Retail Revenue Mix, 2005 By State By Customer Class Residential 43% Industrial 31% Commercial 25% Other 1%
Slide 45: Delivery and Services: Competitive Rates
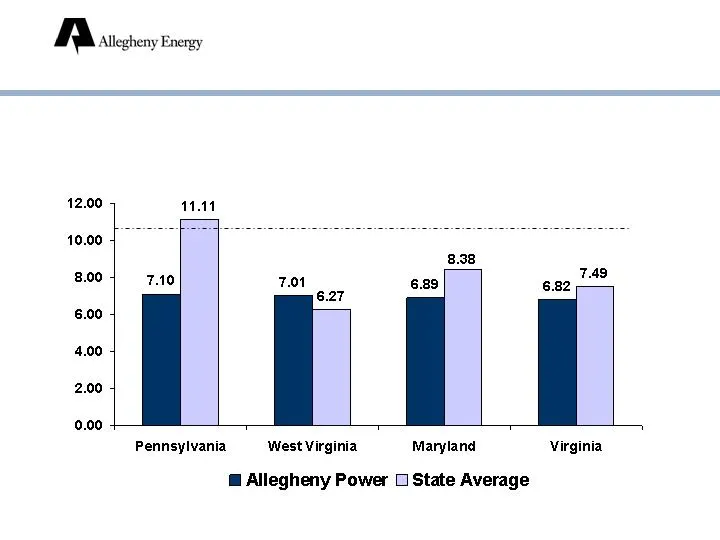
Delivery and Services: Competitive Rates National Average = 10.62 ¢ /kWh Residential Rates ¢/kWh as of January 1, 2006
Slide 46: Regulatory Timeline
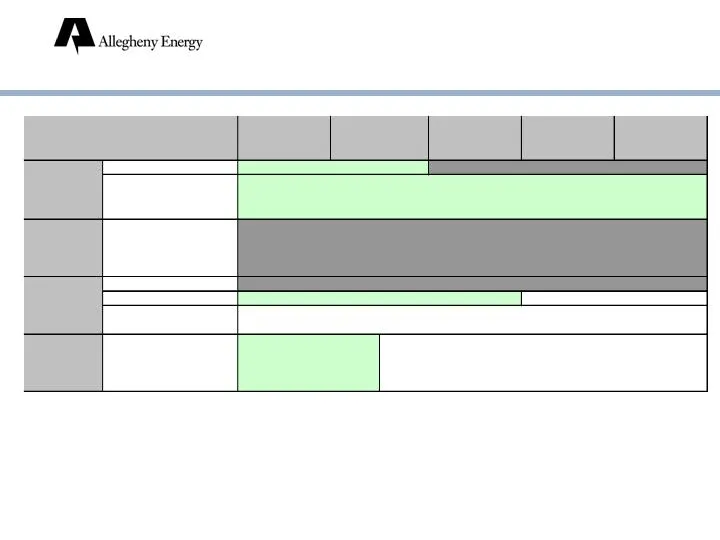
1 Generation rate caps include rate increases in each year, 2006-2010. 2 One-time T&D increase can be requested through 2007. After 2007, can request recovery of purchased power and annual incremental T&D reliability and environmental costs, and one additional T&D cost increase. Regulatory Timeline
Source: SEC EDGAR · 8-K filed Nov 3, 2006
More decks from Allegheny Energy Inc
 EEI Financial Conference 201045 slides · Nov 1, 2010
 Barclays Capital CEO Energy-Power Conference 20105 slides · Sep 15, 2010
 Merger or Acquisition (September 2010)19 slides · Sep 14, 2010
 Merger or Acquisition (August 2010)20 slides · Aug 13, 2010
 Merger or Acquisition (August 2010)7 slides · Aug 4, 2010
 Citigroup Conference June 7-8, 201056 slides · Jun 7, 2010