Gulfmark Offshore — 2012 Barclays CEO Energy-Power Conference
24 slides from Gulfmark Offshore's conference presentation, Sep 5, 2012
Slide 1: 2012 Barclays CEO Energy-Power Conference
GulfMark Offshore, Inc Exhibit 99.1 GulfMark Offshore, Inc 2012 Barclays CEO Energy-Power Conference

Slide 2: Cautionary Statement Regarding Forward-Looking Statements
2 Cautionary Statement Regarding Forward-Looking Statements NYSE: GLF www.GulfMark.com Certain statements and information in this presentation may constitute “forward-looking statements” within the meaning of the Private Securities Litigation Reform Act of 1995. The words “believe,” “expect,” “antic
Slide 3: Long Term Revenue & EBITDA
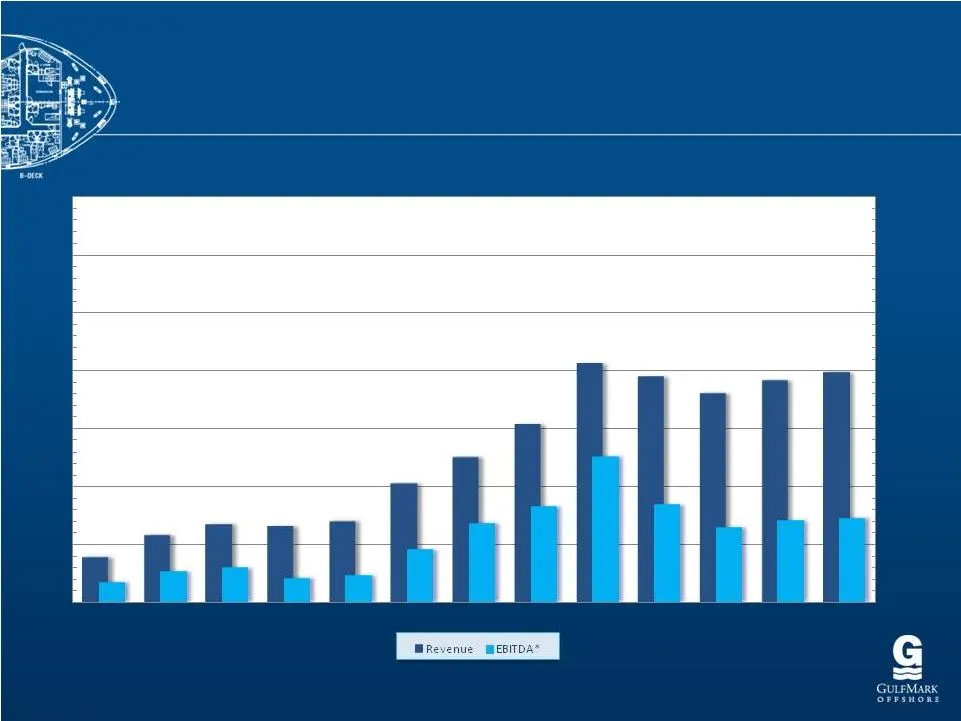
3 * Note: Adjusted for Special Items, See Supporting Information at the end of this Presentation $0 $100 $200 $300 $400 $500 $600 $700 $0 $100 $200 $300 $400 $500 $600 $700 2000 2001 2002 2003 2004 2005 2006 2007 2008 2009 2010 2011 2012 TTM Long Term Revenue & EBITDA Long Term Revenue & EBITDA (in
Slide 4: Pro Forma Prior Peak Revenue & EBITDA
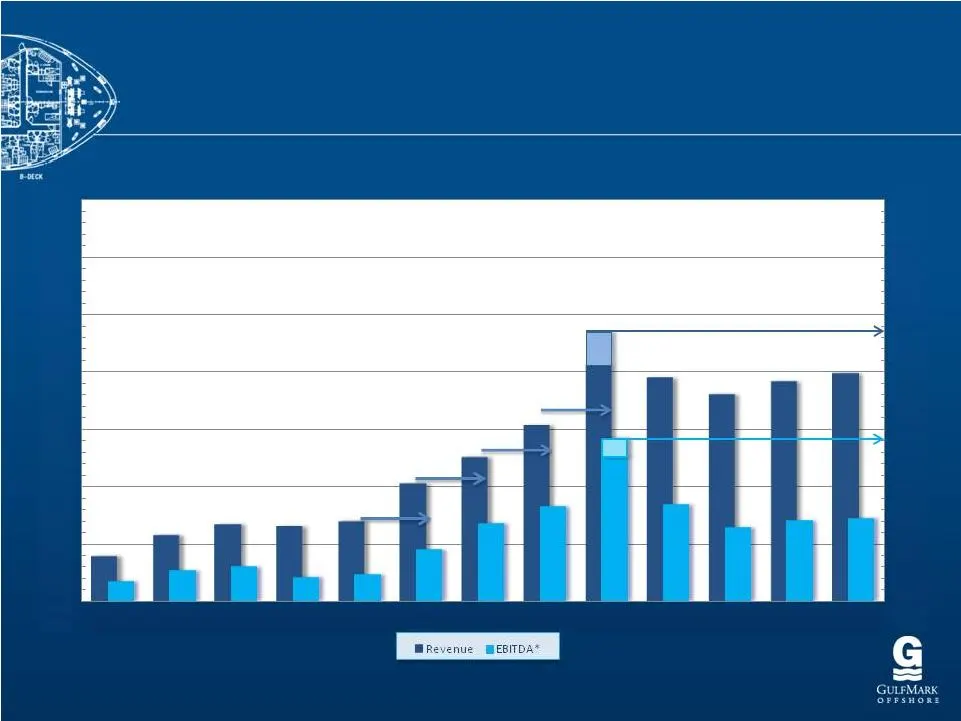
* Note: Adjusted for Special Items, See Supporting Information at the end of this Presentation $0 $100 $200 $300 $400 $500 $600 $700 $0 $100 $200 $300 $400 $500 $600 $700 2000 2001 2002 2003 2004 2005 2006 2007 2008 2009 2010 2011 2012 TTM 4 Pro Forma Prior Peak Revenue & EBITDA Pro Forma Prior Peak
Slide 5: Total Revenue in Backlog
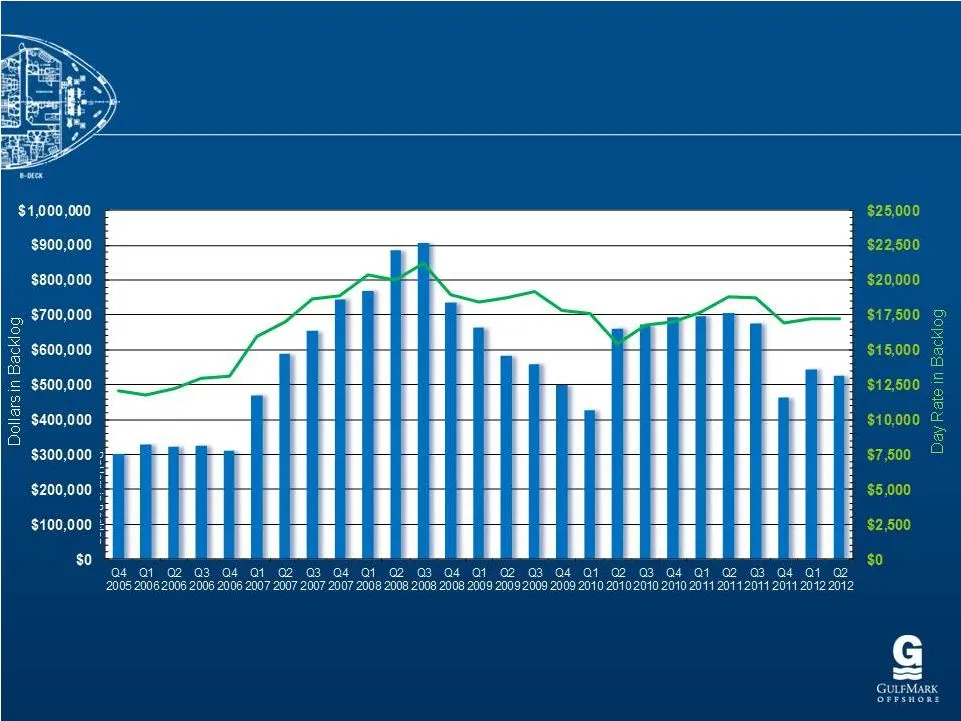
5 Total Revenue in Backlog Total Revenue in Backlog (in thousands of dollars) (in thousands of dollars) Day Rate in Backlog
Slide 6: Global Vessel Diversification
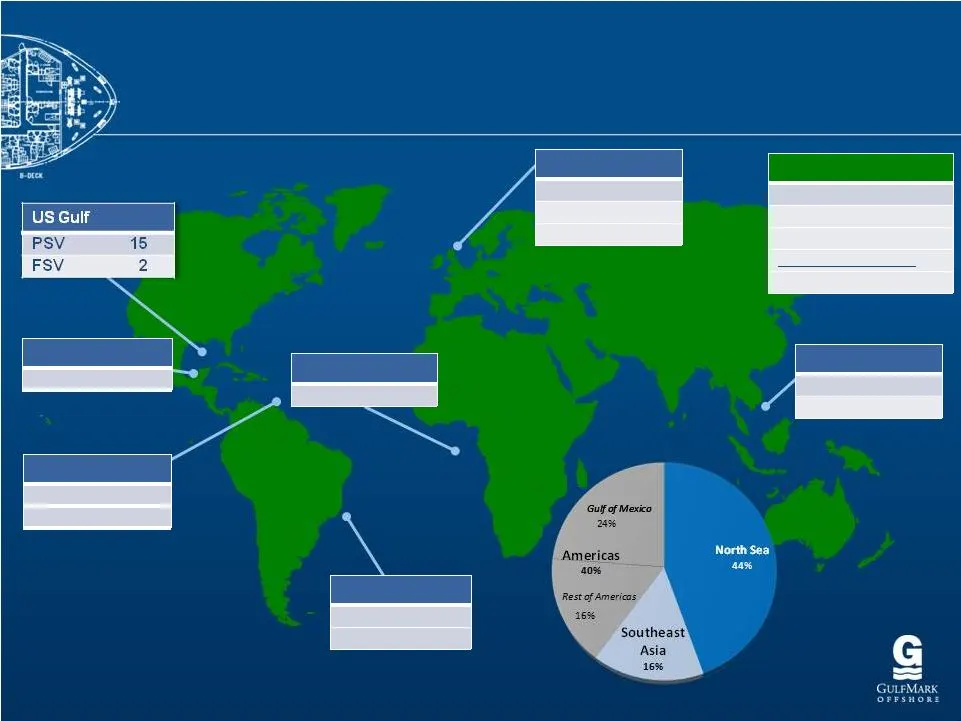
6 West Africa Mexico Trinidad North Sea Worldwide SE Asia Revenue Breakout by Region – Twelve Months Ended June 30, 2012 Brazil Global Vessel Diversification Global Vessel Diversification AHTS 2 AHTS PSV FSV PSV AHTS SpV PSV AHTS FSV/Crew 3 SpV Total PSV AHTS 12 PSV SpV

Slide 7: The GulfMark Fleet
7 The GulfMark Fleet The GulfMark Fleet
Slide 8: Young & Versatile Fleet
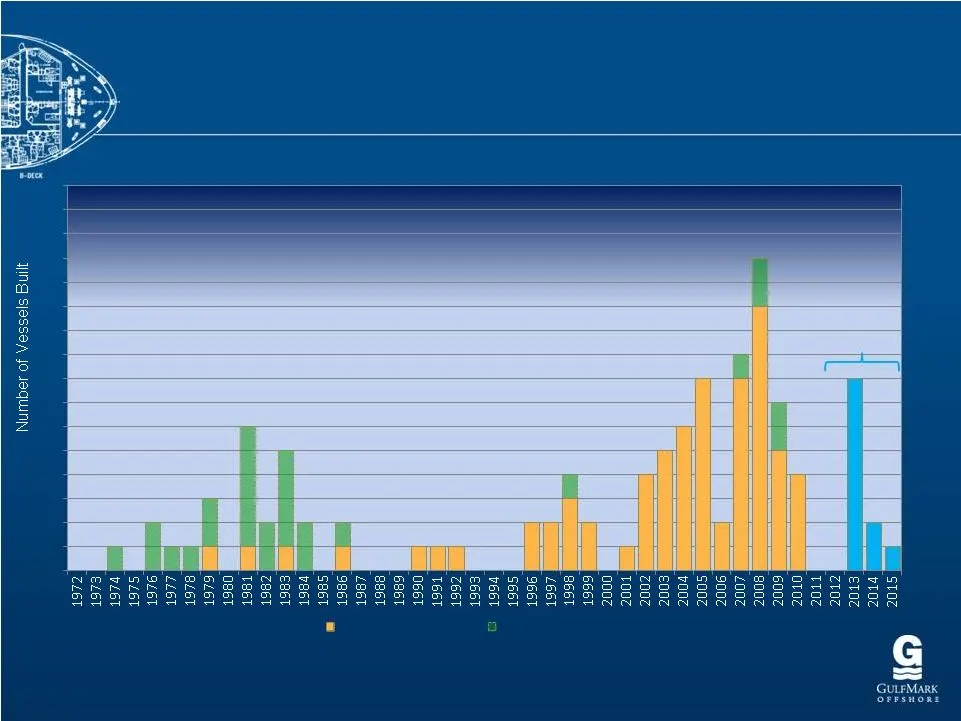
8 Number of Vessels GulfMark Built Per Year 0 1 2 3 4 5 6 7 8 9 10 11 12 13 14 15 16 0 1 2 3 4 5 6 7 8 9 10 11 12 13 14 15 16 Vessels in Current Fleet Vessels not in Current Fleet Young & Versatile Fleet Young & Versatile Fleet New Build Deliveries

Slide 9: Building For Our Future
9 Significant number of new generation rigs on order Increasing Activity both in the North Sea and New Frontiers Industry call for higher specification vessels to meet increasing regulatory demands: • Deeper Waters and Harsher Environments • Increased cargo carrying capacity and flexibility • Enhanc
Slide 10: New Build Program Overview
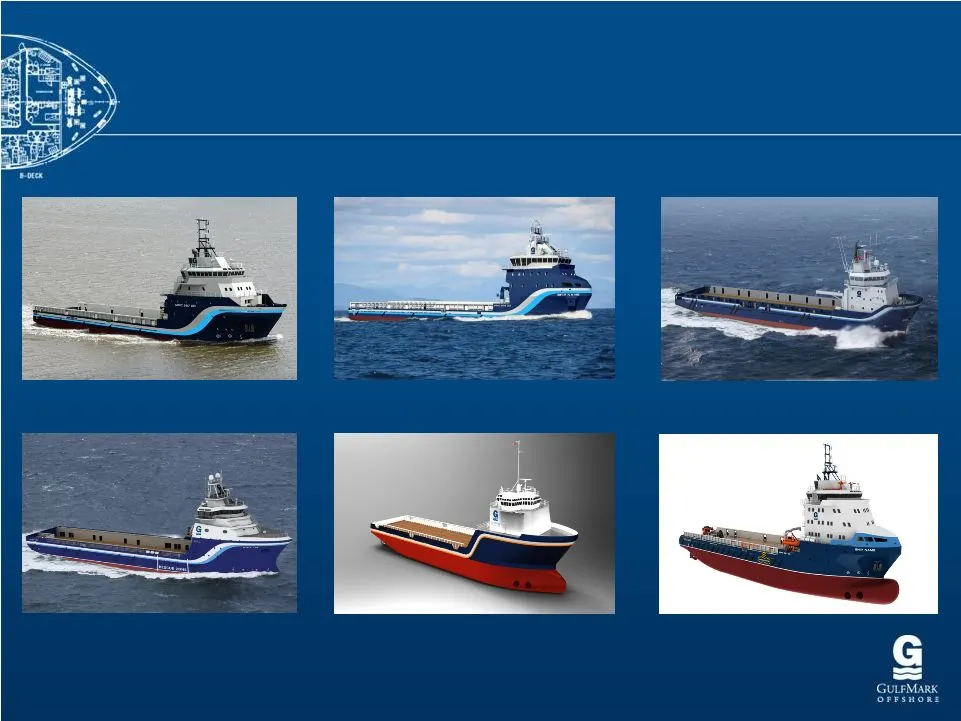
10 Two MMC 887 300 Class DP 2 (Europe) One MMC 879 280 Class DP2 (Europe) Two UT 755 XL 250 Class DP2 (Europe) Two ST-216 300 Class Arctic DP2 (Europe) Two 280 Class PSV DP2 (US) Two 300 Class PSV DP2 (US) New Build Program Overview New Build Program Overview
Slide 11: New Build and Vessel Enhancement Program Summary
11 • 7 Newbuild Vessels for Approximately $285 million • North Sea vessels hedged in EUR • DP2 Green PSVs (300 Class (2), 300 Class Arctic (2), 280 Class (1), 250 Class (2)) • Staggered delivery - 2Q 2013 through 1Q 2014 • 4 Newbuild US Flagged Vessels for Approximately $170 million • DP2 Green PSVs
Slide 12: Building For Our Future: 2013 & Beyond
12 300 Class PSV North Sea $37.0 $8.2 4.5x 300 Class PSV North Sea $37.0 $8.2 4.5x 280 Class PSV North Sea $34.0 $7.7 4.4x 300 Class Arctic PSV North Sea $58.0 $10.8 5.4x 300 Class Arctic PSV North Sea $60.0 $10.8 5.6x 250 Class PSV North Sea $31.0 $7.4 4.2x 250 Class PSV North Sea $31.0 $7.4 4.2x U
Slide 13: New Build Delivery Schedule
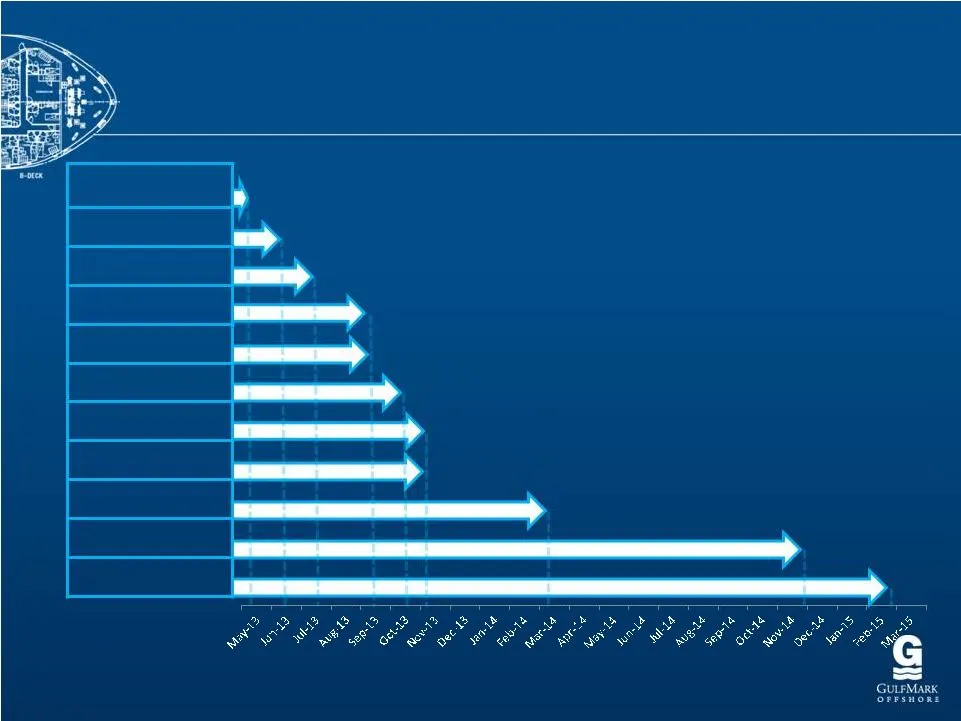
13 280 Class Europe 300 Class Artic Europe 280 Class Europe 300 Class Europe 280 Class Us 250 Class Europe 300 Class Artic 280 Class US 250 Class Europe 300 Class US 300 Class US New Build Delivery Schedule New Build Delivery Schedule
Slide 14: GulfMark Stretch Program
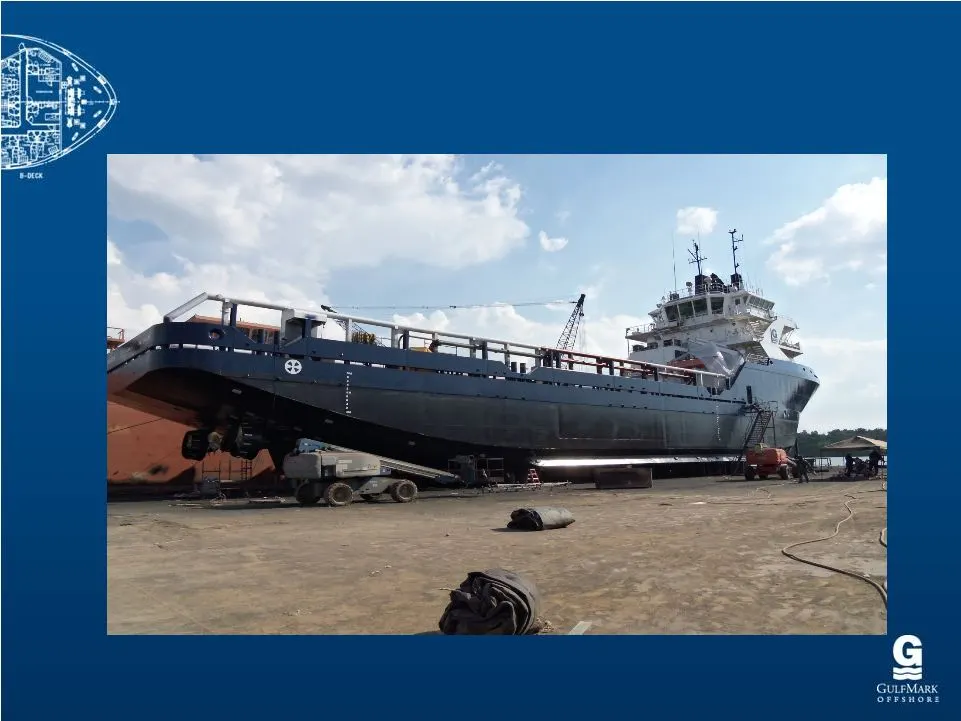
14 GulfMark Stretch Program GulfMark Stretch Program

Slide 15: Market Drivers
15 Market Drivers Market Drivers
Slide 16: Rig Growth in the North Sea
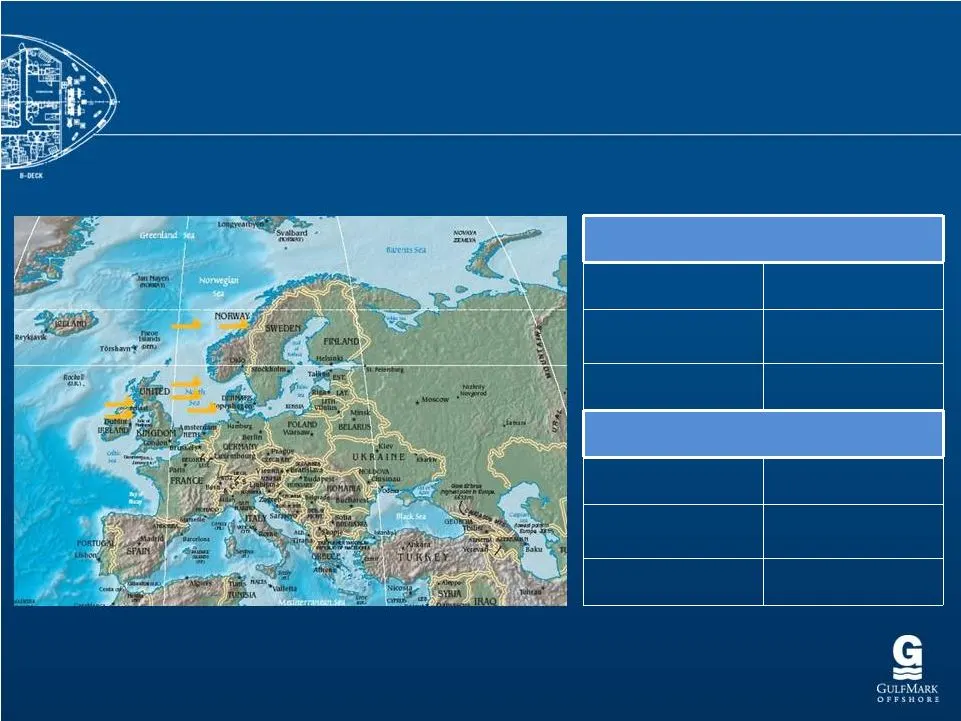
16 Source: IHS Petrodata – August 2012 Floating Rigs Active 45 Scheduled Arrivals (by 2014) 9 % Increase 20% Jackups Active 41 Scheduled Arrivals (by 2014) 8 % Increase 20% Rig Growth in the North Sea Rig Growth in the North Sea
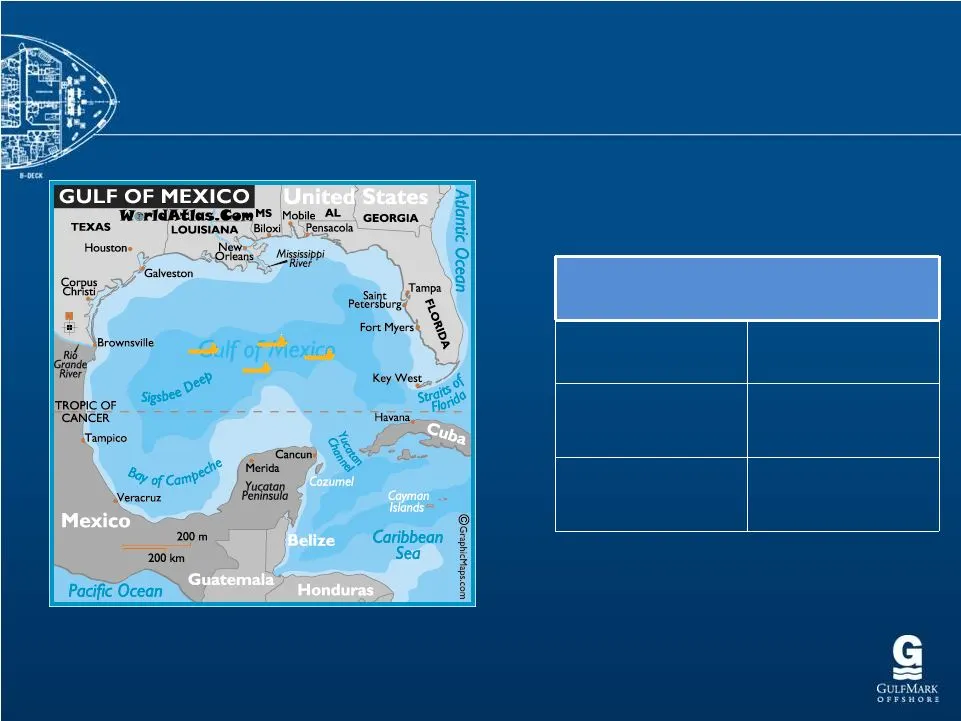
Slide 17: Floating Rig Growth in the U.S. GOM
17 Source: IHS Petrodata – August 2012 Floating Rigs in U.S. GOM Active 36 Scheduled Arrivals (by 2014) 10 % Increase 28% Floating Rig Growth in the U.S. GOM Floating Rig Growth in the U.S. GOM
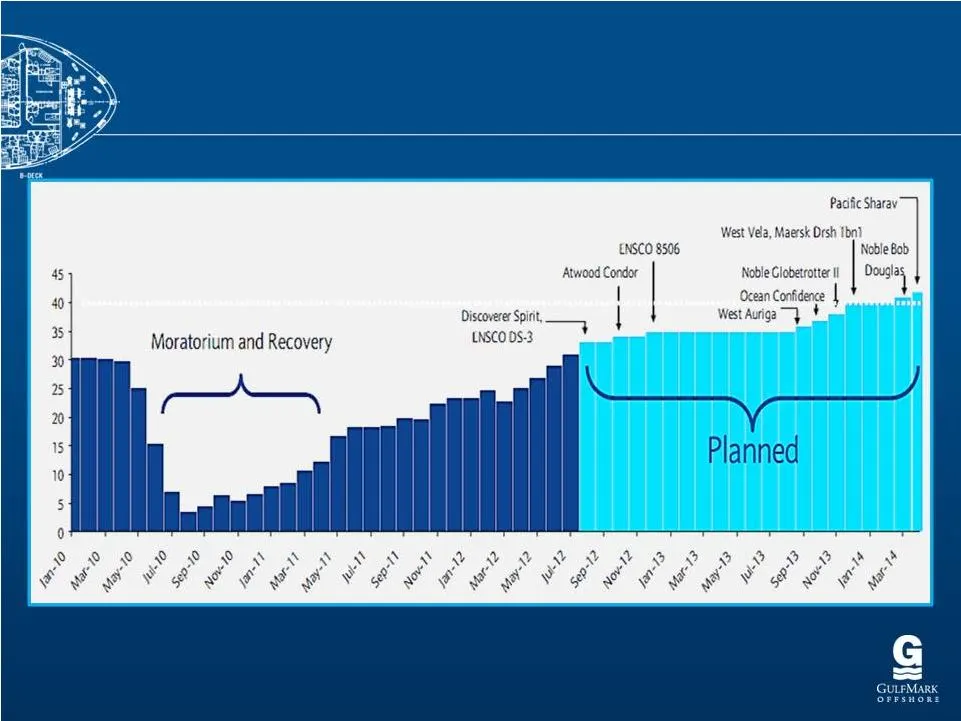
Slide 18: Floating Rig Growth in the U.S. GOM
18 Source: Barclays Floating Rig Growth in the U.S. GOM Floating Rig Growth in the U.S. GOM
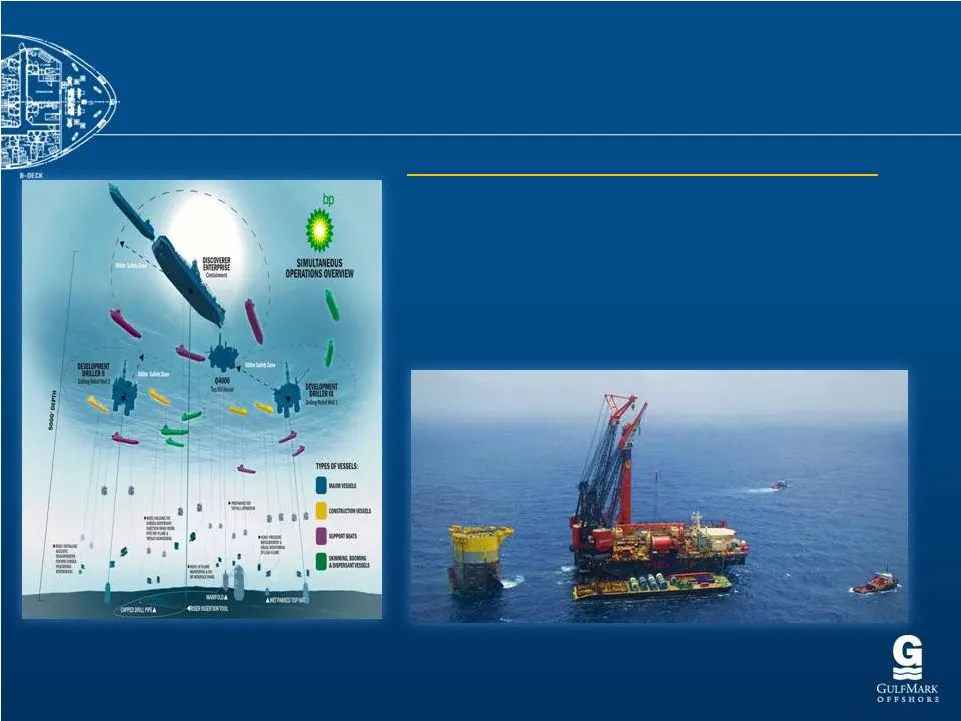
Slide 19: Worldwide Sub Sea – Driving the Future
19 • Subsea Demand Expected to Increase 33% and Annual Expenditure double to $20.3 Billion by 2016 • Set to Top $77 Billion Over Next Five Years • Increase of 63% Over Previous Five Year Period • Sub Sea Work Requires Newer, More Specialized Vessels and Support Equipment Source: Douglas-Westwood’s W

Slide 20: Financial Information
20 Financial Information Financial Information
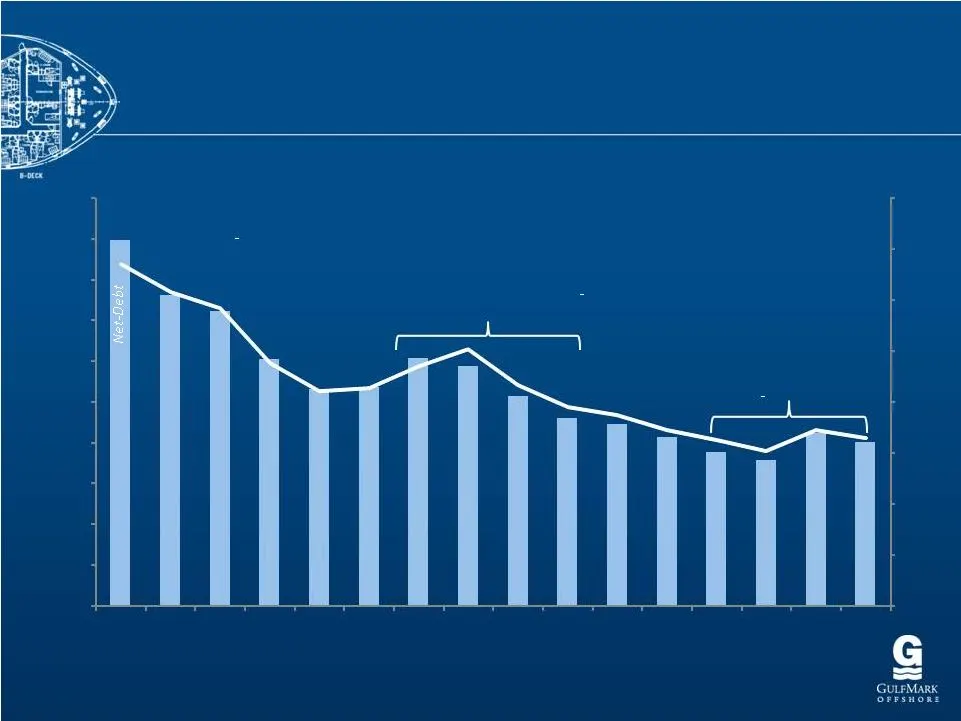
Slide 21: Consistent Reduction in Net Debt Position
21 0% 5% 10% 15% 20% 25% 30% 35% 40% $0 $50,000 $100,000 $150,000 $200,000 $250,000 $300,000 $350,000 $400,000 $450,000 $500,000 Q3 2008 Q4 2008 Q1 2009 Q2 2009 Q3 2009 Q4 2009 Q1 2010 Q2 2010 Q3 2010 Q4 2010 Q1 2011 Q2 2011 Q3 2011 Q4 2011 Q1 2012 Q2 2012 Net Debt to Total Book Capitalization Final

Slide 22: Investment Highlights
22 Industry Leaders in QHSE Performance & People Development Global Presence and Diverse Operations Expertise Financial Stability & Flexibility to Pursue Opportunities Growth through Both Acquisition and New Construction Young, Versatile, High-Specification Fleet Investment Highlights Investment Hig

Slide 23: EBITDA and Adjusted EBITDA definitions
23 EBITDA is defined as net income (loss) before interest expense, net, income tax provision, and depreciation and amortization, which includes impairment. Adjusted EBITDA is calculated by adjusting EBITDA for certain items that we believe are non-cash or unusual, consisting of: (i) loss from uncons

Slide 24: GulfMark
= GULEMARK
Source: SEC EDGAR · 8-K filed Sep 5, 2012
More decks from Gulfmark Offshore Inc
 Merger or Acquisition (July 2018)11 slides · Jul 16, 2018
 Merger or Acquisition (July 2018)15 slides · Jul 16, 2018
 Investor Presentation (March 2018)22 slides · Mar 6, 2018
 Debt Investor Presentation (October 2017)16 slides · Oct 2, 2017
 Debt Investor Presentation (May 2017)41 slides · May 18, 2017
 Debt Investor Presentation (November 2016)28 slides · Nov 28, 2016