Vitesse Semiconductor — Needham & Company Growth Stock Conference 2009
22 slides from Vitesse Semiconductor's conference presentation, Jan 6, 2009
Slide 1: Corporate Overview
Corporate Overview Needham & Company Growth Stock Conference January 2009
Slide 2: Safe Harbor Statement
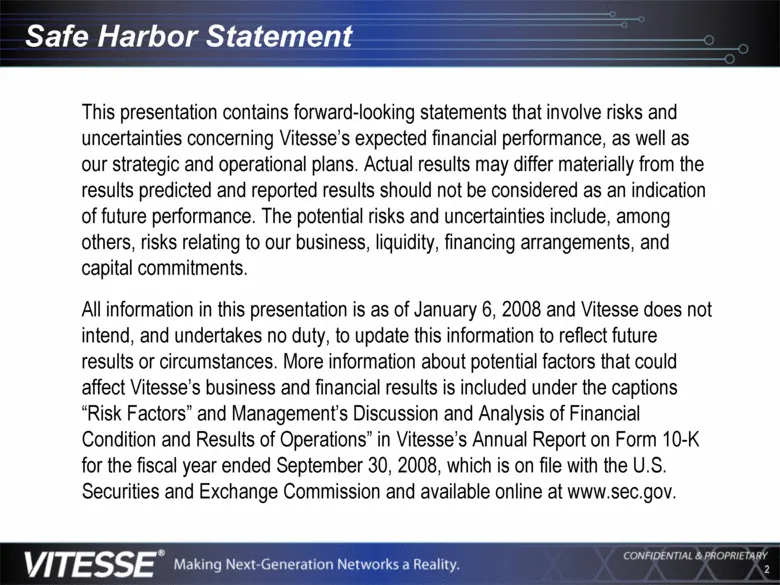
2 Safe Harbor Statement This presentation contains forward-looking statements that involve risks and uncertainties concerning Vitesse’s expected financial performance, as well as our strategic and operational plans. Actual results may differ materially from the results predicted and reported results
Slide 3: The Company
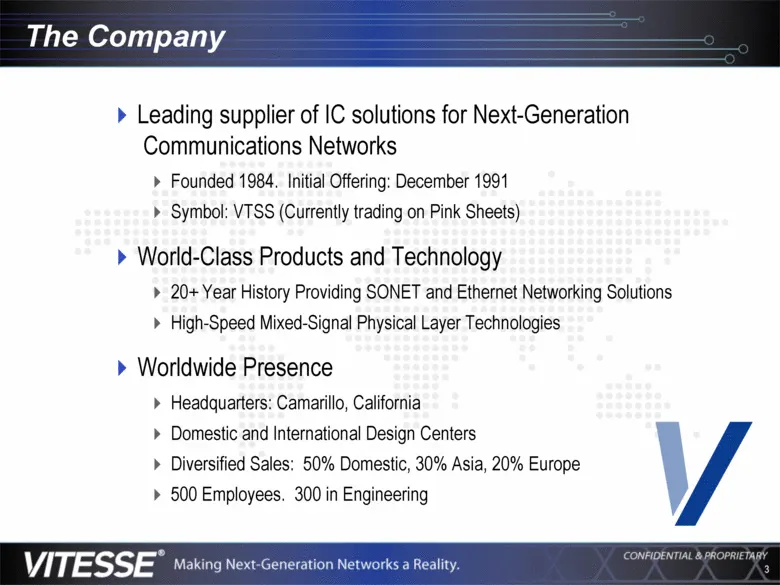
3 The Company Leading supplier of IC solutions for Next-Generation Communications Networks Founded 1984. Initial Offering: December 1991 Symbol: VTSS (Currently trading on Pink Sheets) World-Class Products and Technology 20+ Year History Providing SONET and Ethernet Networking Solutions High-Speed M
Slide 4: Management Team
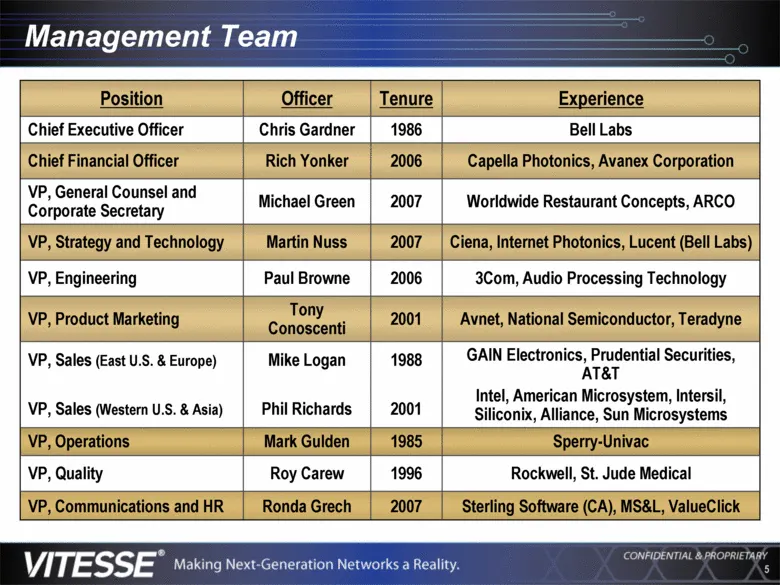
5 Management Team Rockwell, St. Jude Medical 1996 Roy Carew VP, Quality Sperry-Univac 1985 Mark Gulden VP, Operations Sterling Software (CA), MS&L, ValueClick 2007 Ronda Grech VP, Communications and HR Avnet, National Semiconductor, Teradyne 2001 Tony Conoscenti VP, Product Marketing GAIN Electronic
Slide 5: Markets and Products
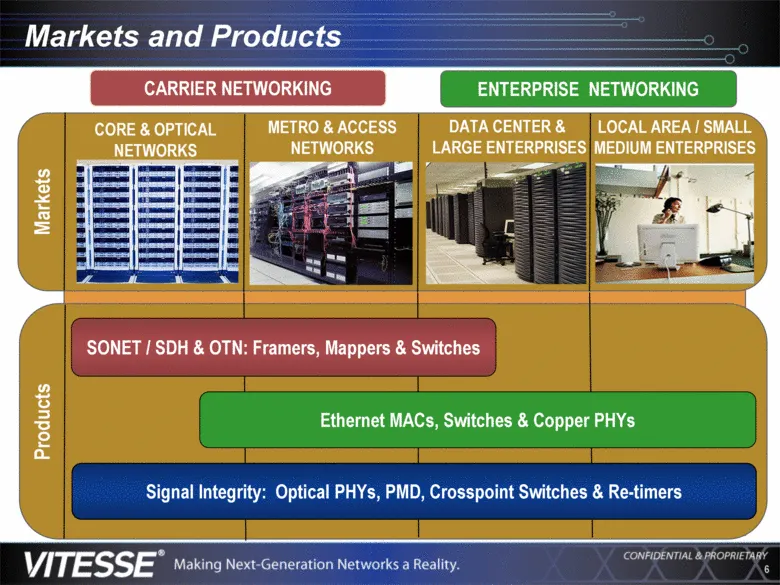
6 Markets and Products Markets METRO & ACCESS NETWORKS DATA CENTER & LARGE ENTERPRISES LOCAL AREA / SMALL MEDIUM ENTERPRISES CORE & OPTICAL NETWORKS Products CARRIER NETWORKING ENTERPRISE NETWORKING SONET / SDH & OTN: Framers, Mappers & Switches Ethernet MACs, Switches & Copper PHYs Signal Integrity
Slide 6: $2.5 Billion Industry; R&D Investments for Growth
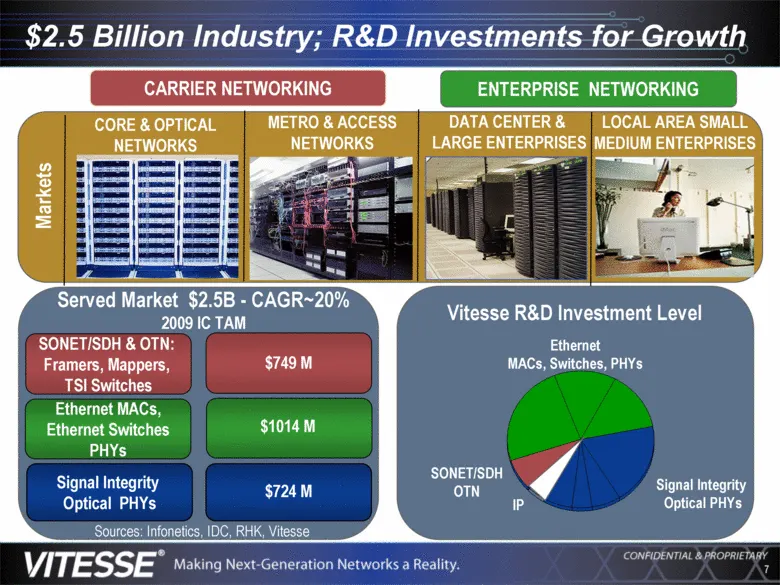
7 $2.5 Billion Industry; R&D Investments for Growth METRO & ACCESS NETWORKS DATA CENTER & LARGE ENTERPRISES Markets CORE & OPTICAL NETWORKS Served Market $2.5B - CAGR~20% 2009 IC TAM Vitesse R&D Investment Level Ethernet MACs, Switches, PHYs Signal Integrity Optical PHYs IP SONET/SDH OTN SONET/SDH &
Slide 7: Convergence Is Happening
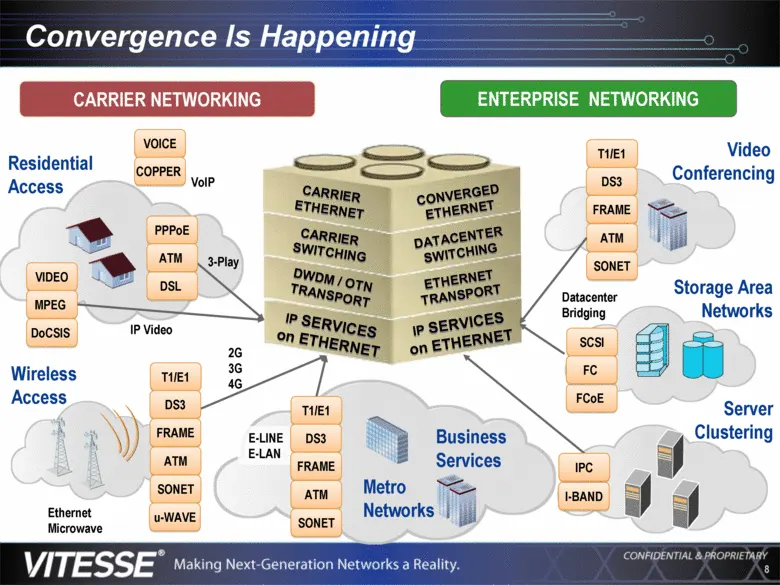
8 Convergence Is Happening Business Services Wireless Access Residential Access Video Conferencing IP Video VoIP 3-Play 2G 3G 4G Ethernet Microwave Storage Area Networks Server Clustering Datacenter Bridging E-LINE E-LAN Metro Networks CARRIER NETWORKING ENTERPRISE NETWORKING IP S E RV ICE S o n ET
Slide 8: Our Winning Strategy At-a-Glance
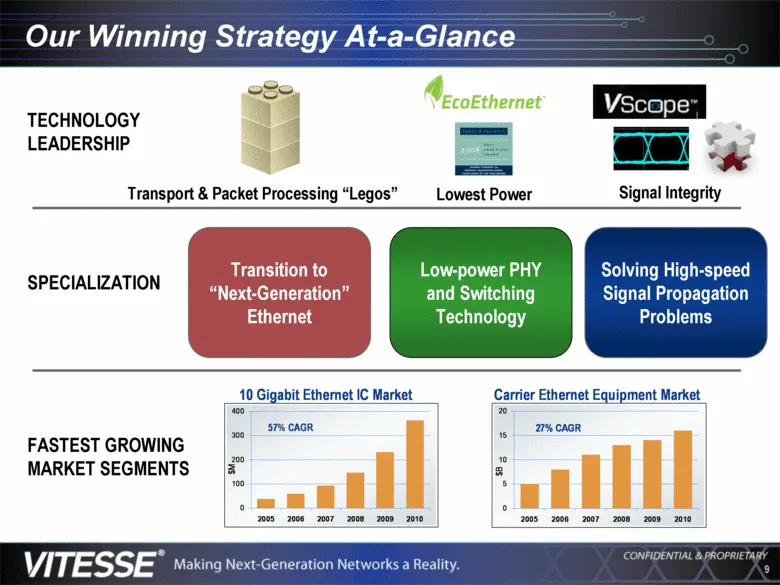
9 Our Winning Strategy At-a-Glance TECHNOLOGY LEADERSHIP SPECIALIZATION FASTEST GROWING MARKET SEGMENTS Signal Integrity Lowest Power Transport & Packet Processing “Legos” Transition to “Next-Generation” Ethernet Solving High-speed Signal Propagation Problems Low-power PHY and Switching Technology 0
Slide 9: Focused Product Development
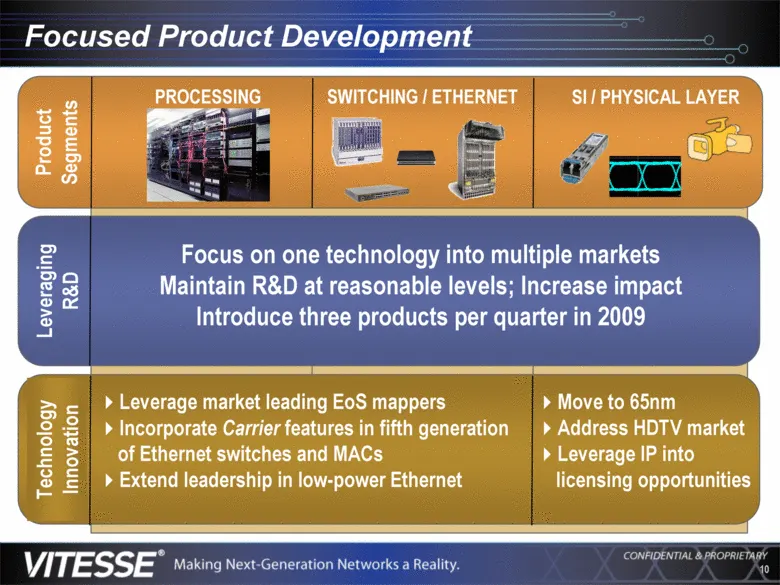
10 Focused Product Development Product Segments SI / PHYSICAL LAYER SWITCHING / ETHERNET PROCESSING Technology Innovation Leverage market leading EoS mappers Incorporate Carrier features in fifth generation of Ethernet switches and MACs Extend leadership in low-power Ethernet Move to 65nm Address HD
Slide 10: Competitive Landscape
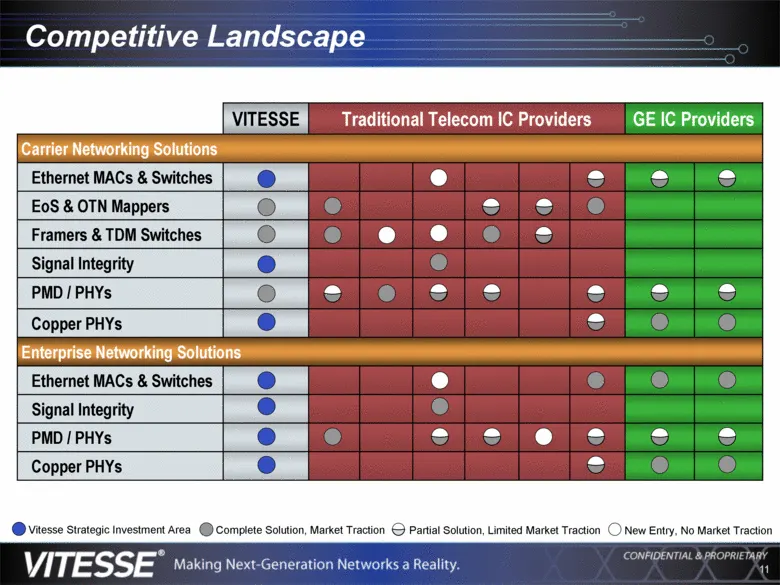
11 Competitive Landscape Copper PHYs PMD / PHYs Signal Integrity Ethernet MACs & Switches Enterprise Networking Solutions Copper PHYs PMD / PHYs Signal Integrity Framers & TDM Switches EoS & OTN Mappers Ethernet MACs & Switches Carrier Networking Solutions GE IC Providers Traditional Telecom IC Prov
Slide 11: Leading Customers in the 'Networking' World
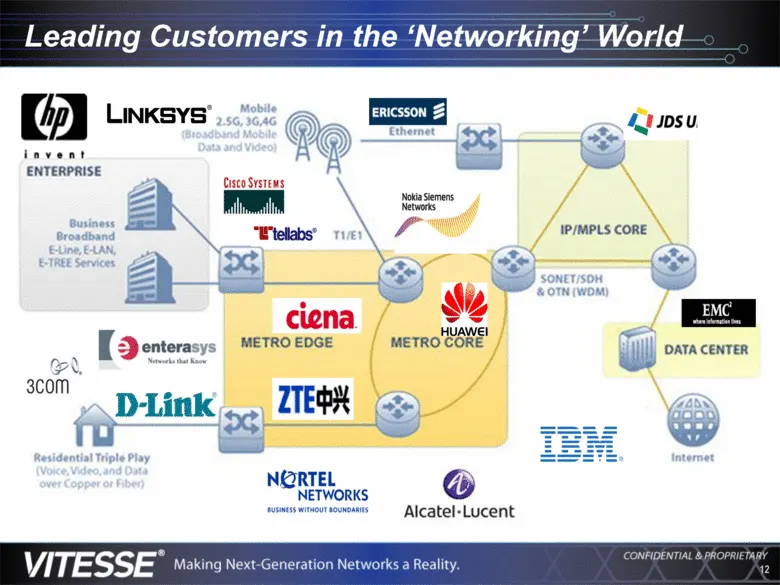
12 Leading Customers in the ‘Networking’ World
Slide 12: Making Next-Generation Networks a Reality
) 7 SE ’ JI E Ss Making Next: -Generation Networks a Reality. : _—
Slide 13: SEC Reporting Obligations - Current
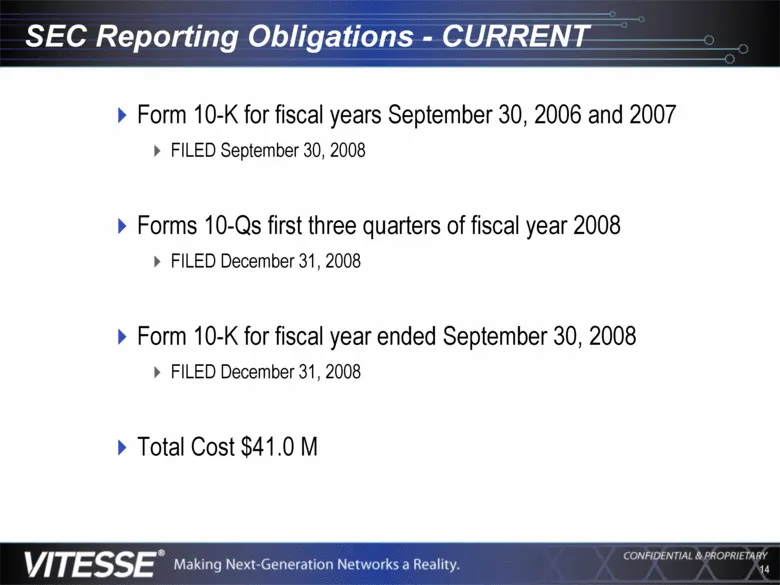
14 SEC Reporting Obligations - CURRENT Form 10-K for fiscal years September 30, 2006 and 2007 FILED September 30, 2008 Forms 10-Qs first three quarters of fiscal year 2008 FILED December 31, 2008 Form 10-K for fiscal year ended September 30, 2008 FILED December 31, 2008 Total Cost $41.0 M
Slide 14: Financial Summary (GAAP)
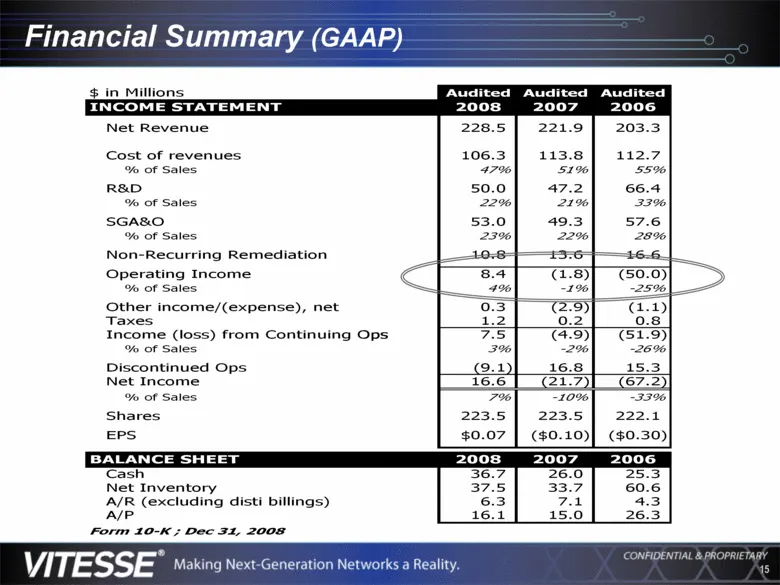
15 Financial Summary (GAAP) $ in Millions Audited Audited Audited INCOME STATEMENT 2008 2007 2006 Net Revenue 228.5 221.9 203.3 Cost of revenues 106.3 113.8 112.7 % of Sales 4 7 % 51 % 5 5% R&D 50.0 47.2 66.4 % of Sales 2 2 % 21 % 3 3% SGA&O 53.0 49.3 57.6 % of Sales 2 3 % 22 % 2 8% Non-Recurring Re
Slide 15: FY2006 to FY2008 Revenue (GAAP)
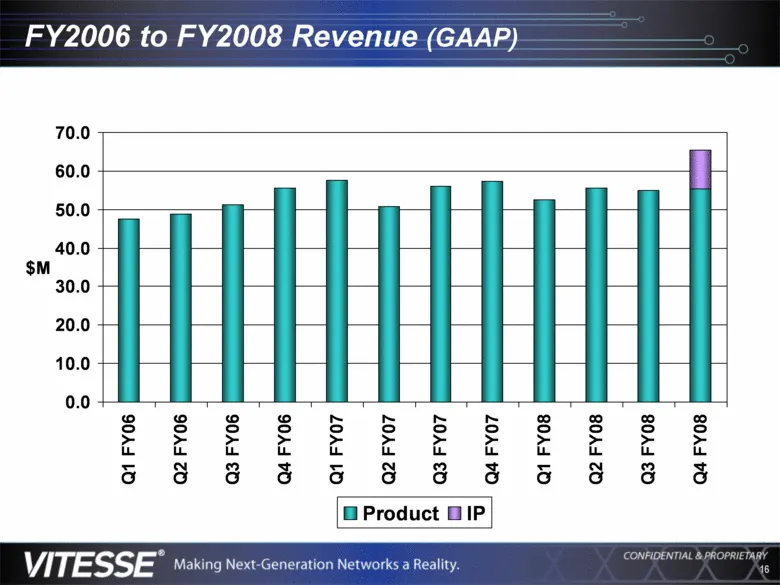
16 FY2006 to FY2008 Revenue (GAAP) 0.0 10.0 20.0 30.0 40.0 50.0 60.0 70.0 Q1 FY06 Q2 FY06 Q3 FY06 Q4 FY06 Q1 FY07 Q2 FY07 Q3 FY07 Q4 FY07 Q1 FY08 Q2 FY08 Q3 FY08 Q4 FY08 $M Product IP
Slide 16: Core Revenue Growth
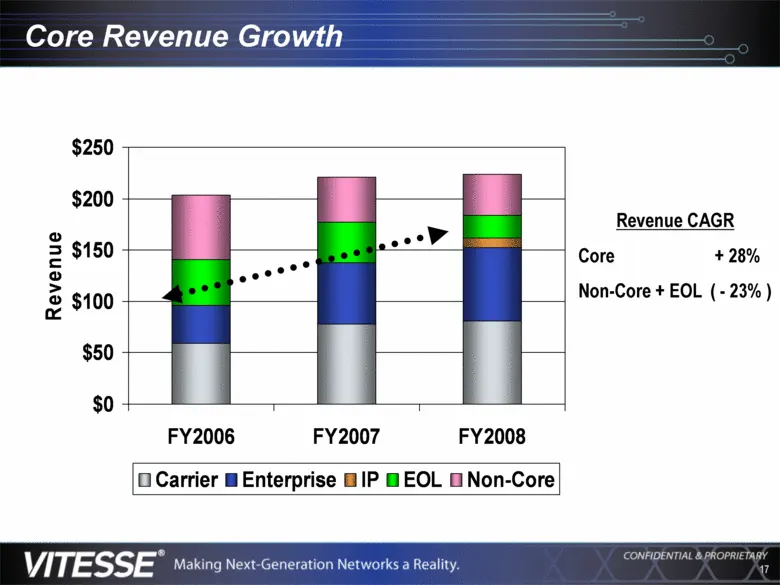
17 Core Revenue Growth $0 $50 $100 $150 $200 $250 FY2006 FY2007 FY2008 Revenue Carrier Enterprise IP EOL Non-Core Revenue CAGR Core + 28% Non-Core + EOL ( - 23% )
Slide 17: Expenses as % of Revenue (GAAP)
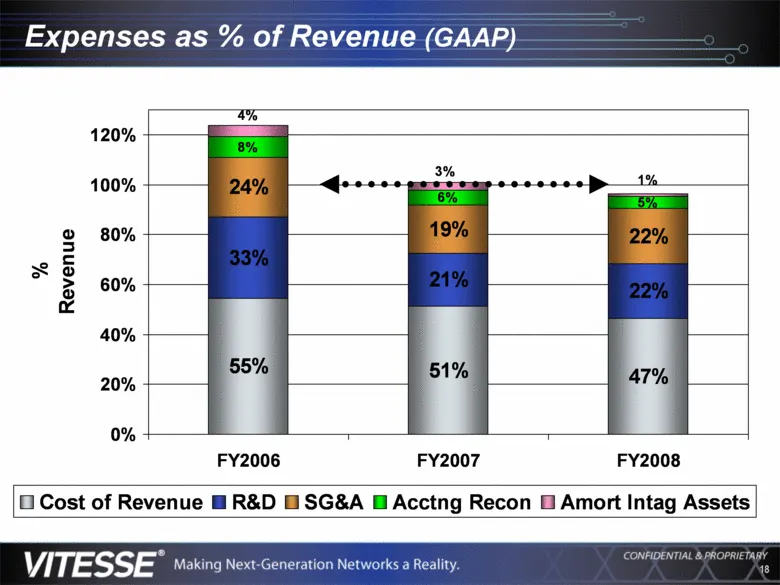
18 Expenses as % of Revenue (GAAP) 55% 51% 47% 33% 21% 22% 24% 19% 22% 6% 5% 8% 3% 1% 4% 0% 20% 40% 60% 80% 100% 120% FY2006 FY2007 FY2008 % Revenue Cost of Revenue R&D SG&A Acctng Recon Amort Intag Assets
Slide 18: FY2006 to FY2008 Cash (GAAP)
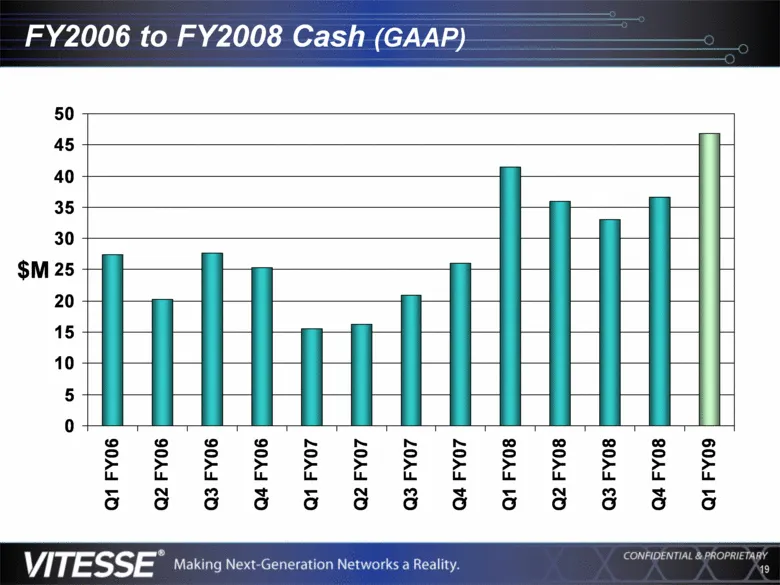
19 FY2006 to FY2008 Cash (GAAP) 0 5 10 15 20 25 30 35 40 45 50 Q1 FY06 Q2 FY06 Q3 FY06 Q4 FY06 Q1 FY07 Q2 FY07 Q3 FY07 Q4 FY07 Q1 FY08 Q2 FY08 Q3 FY08 Q4 FY08 Q1 FY09 $M
Slide 19: FY2006 to FY2008 Operating Income (GAAP)
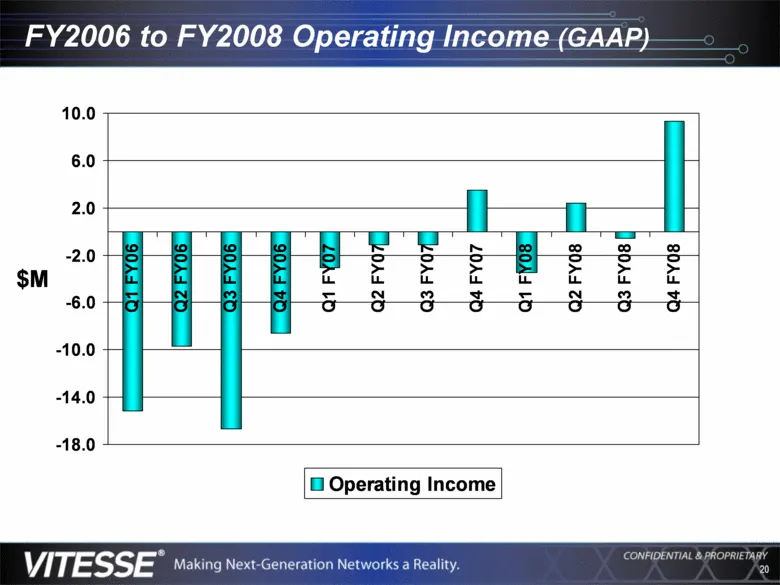
20 FY2006 to FY2008 Operating Income (GAAP) -18.0 -14.0 -10.0 -6.0 -2.0 2.0 6.0 10.0 Q1 FY06 Q2 FY06 Q3 FY06 Q4 FY06 Q1 FY07 Q2 FY07 Q3 FY07 Q4 FY07 Q1 FY08 Q2 FY08 Q3 FY08 Q4 FY08 $M Operating Income
Slide 20: Long-Term Financial Targets
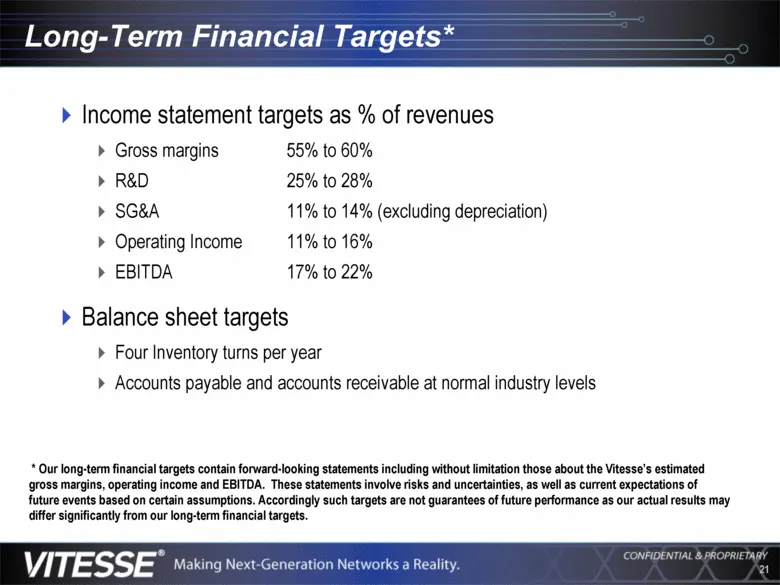
21 Long-Term Financial Targets* Income statement targets as % of revenues Gross margins 55% to 60% R&D 25% to 28% SG&A 11% to 14% (excluding depreciation) Operating Income 11% to 16% EBITDA 17% to 22% Balance sheet targets Four Inventory turns per year Accounts payable and accounts receivable at nor
Slide 21: Vitesse's Compelling Message
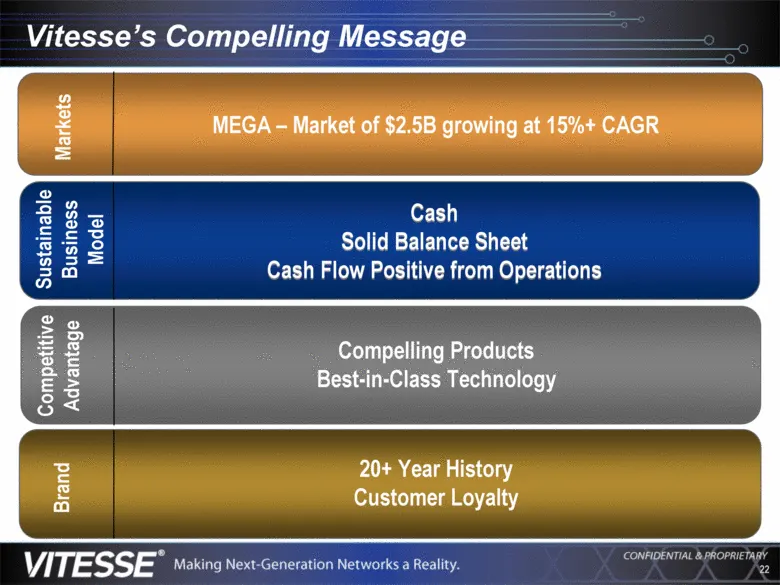
22 Vitesse’s Compelling Message Markets MEGA – Market of $2.5B growing at 15%+ CAGR Brand 20+ Year History Customer Loyalty Sustainable Business Model Competitive Advantage Compelling Products Best-in-Class Technology Cash Solid Balance Sheet Cash Flow Positive from Operations
Slide 22: Making Next-Generation Networks a Reality
\ ] SE ; JI ES Making Next: Generation Networks a Reality ; =
Source: SEC EDGAR · 8-K filed Jan 6, 2009
More decks from Vitesse Semiconductor Corp
 Shareholder Meeting (February 2015)26 slides · Feb 26, 2015
 Investor Presentation (May 2010)23 slides · May 18, 2010
 Shareholder Meeting (January 2010)20 slides · Jan 8, 2010
 JMP Securities Research Conference May 200925 slides · May 19, 2009
 B. Riley & Co. 2009 Annual Investor Conference22 slides · Mar 18, 2009
 AeA Classic Financial Conference 200823 slides · Nov 4, 2008