Thermadyne — Investor Presentation (March 2010)
19 slides from Thermadyne's investor presentation, Mar 1, 2010
Slide 1: Thermadyne Holdings Corporation Investor Presentation March 2010
Thermadyne Holdings Corporation (NASDAQ: THMD) Investor Presentation March, 2010
Slide 2: Forward-Looking Statement Disclaimer
Slide 2 Forward-Looking Statement Disclaimer These slides contain (and the accompanying oral discussion will contain) "forward-looking statements" within the meaning of the Private Securities Litigation Reform Act of 1995. Such statements present management's expectations, beliefs, plans and objecti
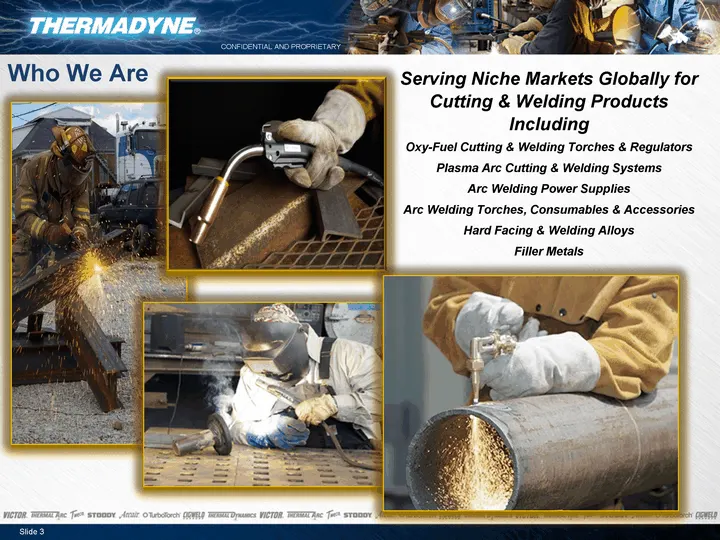
Slide 3: Who We Are
Slide 3 Who We Are Serving Niche Markets Globally for Cutting & Welding Products Including Oxy-Fuel Cutting & Welding Torches & Regulators Plasma Arc Cutting & Welding Systems Arc Welding Power Supplies Arc Welding Torches, Consumables & Accessories Hard Facing & Welding Alloys Filler Metals Slide 3
Slide 4: Stable Financially & Positioned For Growth
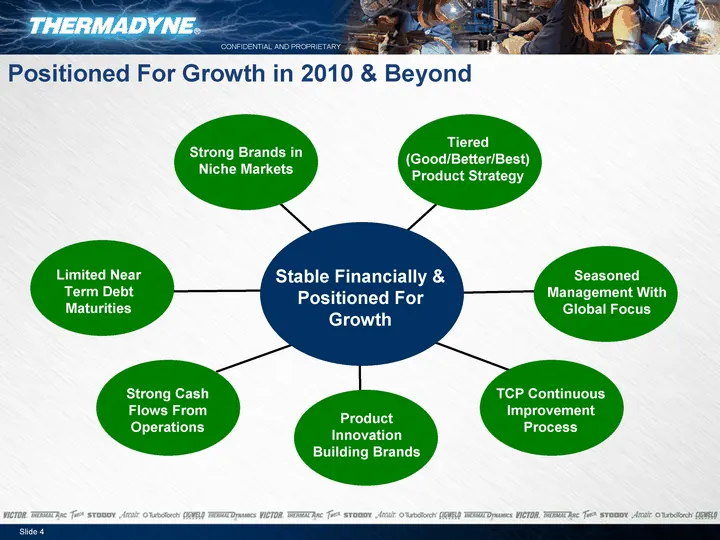
Slide 4 Stable Financially & Positioned For Growth TCP Continuous Improvement Process Strong Brands in Niche Markets Tiered (Good/Better/Best) Product Strategy Seasoned Management With Global Focus Product Innovation Building Brands Strong Cash Flows From Operations Limited Near Term Debt Maturities
Slide 5: Our Plan For Building Future Shareholder Value In A Slow Economy
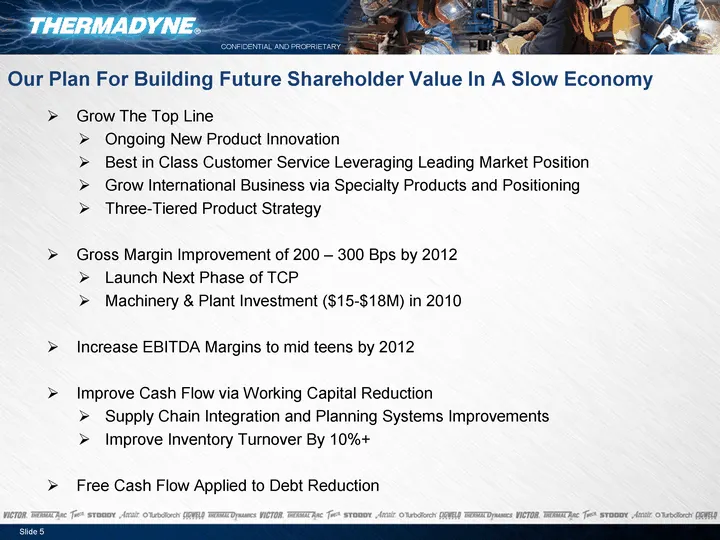
Slide 5 Our Plan For Building Future Shareholder Value In A Slow Economy Grow The Top Line Ongoing New Product Innovation Best in Class Customer Service Leveraging Leading Market Position Grow International Business via Specialty Products and Positioning Three-Tiered Product Strategy Gross Margin Im
Slide 6: Historic Times For Steel & Thermadyne
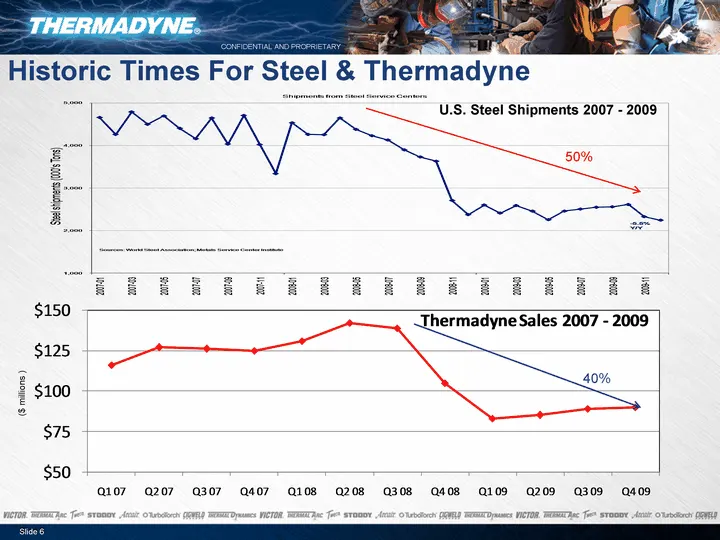
U.S. Steel Shipments 2007 - 2009 Slide 6 ($ millions ) Historic Times For Steel & Thermadyne 40% 50% Slide 6
Slide 7: Responding To Crisis & Preparing For The Future
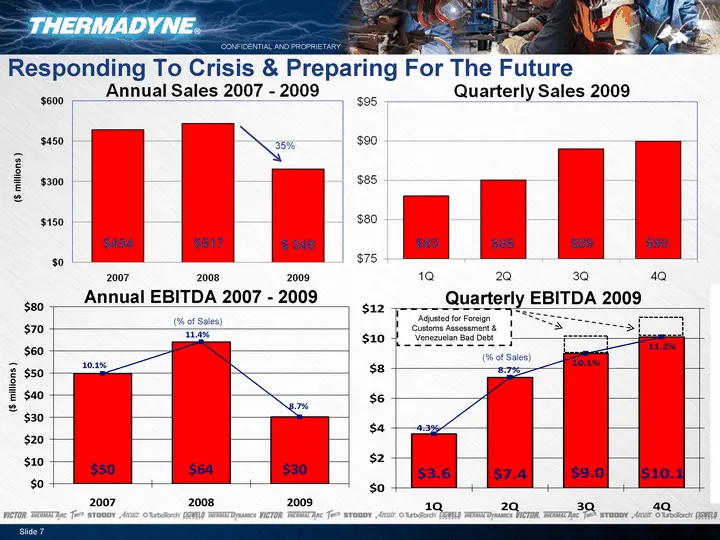
Slide 7 2007 2008 2009 EBITDA, as adjusted 49.8 64.1 30.1 EBITDA, as % of sales 49.8 64.1 30.1 Annual EBITDA 2007 - 2009 ($ millions ) 35% ($ millions ) 1Q 2Q 3Q 4Q EBITDA, as adjusted 3.6 7.4 9 10.1 EBITDA, as % of sales 0.036 0.074 0.09 0.101 Quarterly EBITDA 2009 (% of Sales) (% of Sales) Adjuste
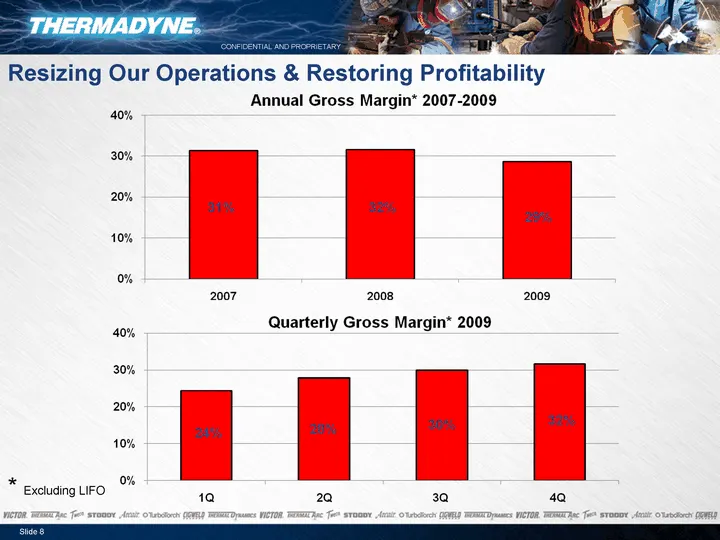
Slide 8: Resizing Our Operations & Restoring Profitability
Slide 8 Resizing Our Operations & Restoring Profitability * Excluding LIFO
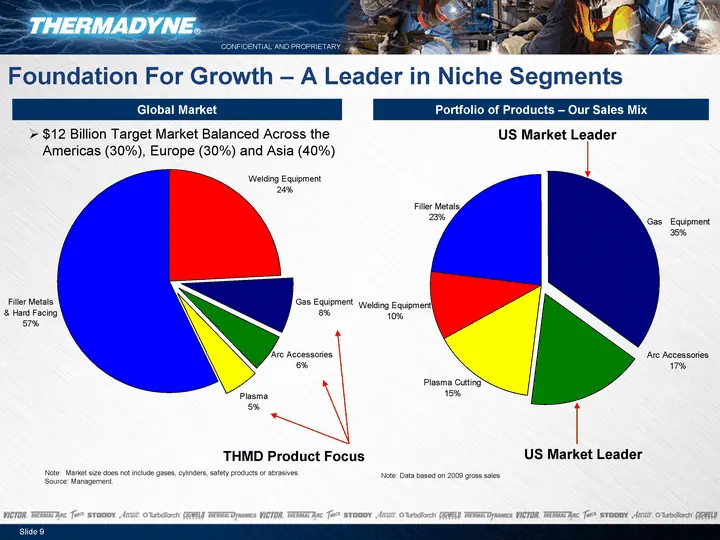
Slide 9: Foundation For Growth - A Leader in Niche Segments
Welding Equipment Gas Equipment Arc Accessories Plasma Filler Metals 0.24 0.08 0.056 0.05 0.57 Slide 9 Foundation For Growth - A Leader in Niche Segments Gas Equipment Arc Accessories Plasma Cutting Welding Equipment Filler Metals 0.35 0.17 0.15 0.1 0.23 Note: Market size does not include gases, cyl
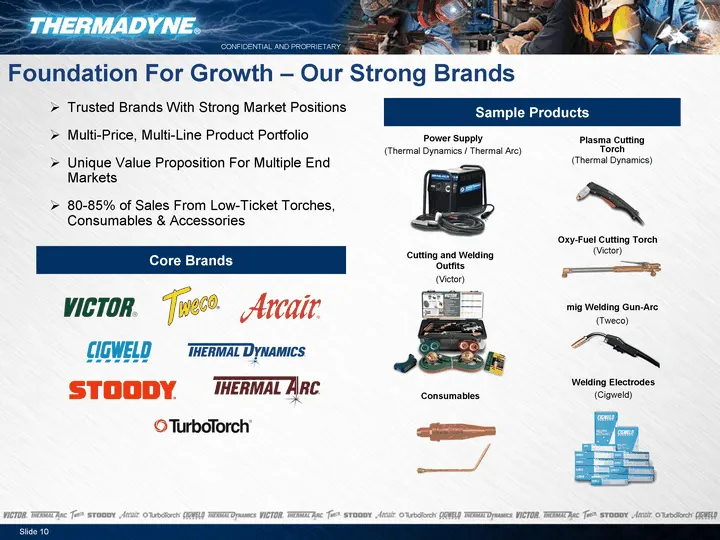
Slide 10: Foundation For Growth - Our Strong Brands
Slide 10 Foundation For Growth - Our Strong Brands Trusted Brands With Strong Market Positions Multi-Price, Multi-Line Product Portfolio Unique Value Proposition For Multiple End Markets 80-85% of Sales From Low-Ticket Torches, Consumables & Accessories Sample Products Oxy-Fuel Cutting Torch (Victor
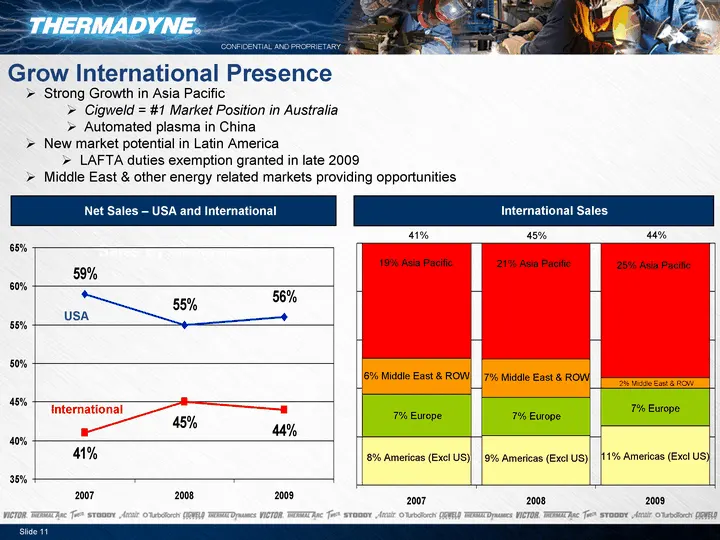
Slide 11: Grow International Presence
Slide 11 Grow International Presence Sales By Geography Sales Strong Growth in Asia Pacific Cigweld = #1 Market Position in Australia Automated plasma in China New market potential in Latin America LAFTA duties exemption granted in late 2009 Middle East & other energy related markets providing oppor
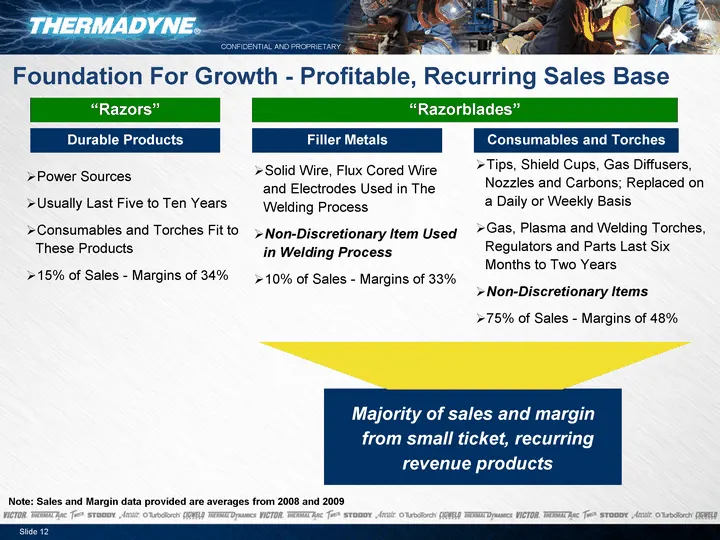
Slide 12: Foundation For Growth - Profitable, Recurring Sales Base
Slide 12 Tips, Shield Cups, Gas Diffusers, Nozzles and Carbons; Replaced on a Daily or Weekly Basis Gas, Plasma and Welding Torches, Regulators and Parts Last Six Months to Two Years Non-Discretionary Items 75% of Sales - Margins of 48% Filler Metals Solid Wire, Flux Cored Wire and Electrodes Used i
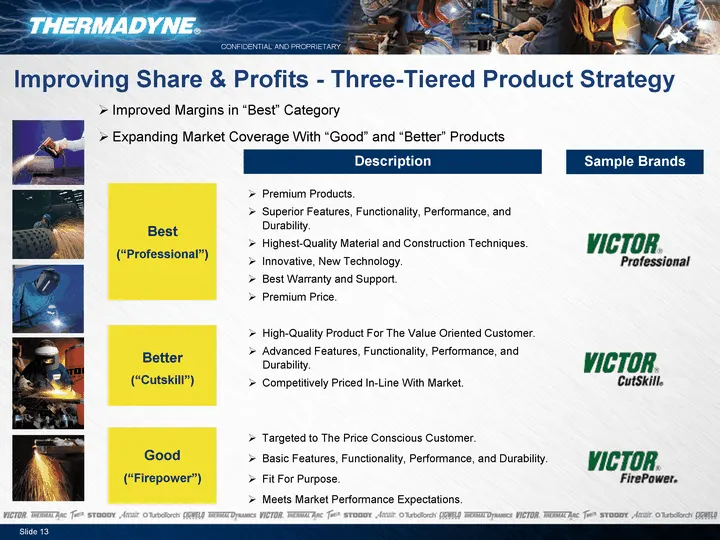
Slide 13: Improving Share & Profits - Three-Tiered Product Strategy
Slide 13 Improving Share & Profits - Three-Tiered Product Strategy Improved Margins in "Best" Category Expanding Market Coverage With "Good" and "Better" Products Description Targeted to The Price Conscious Customer. Basic Features, Functionality, Performance, and Durability. Fit For Purpose. Meets
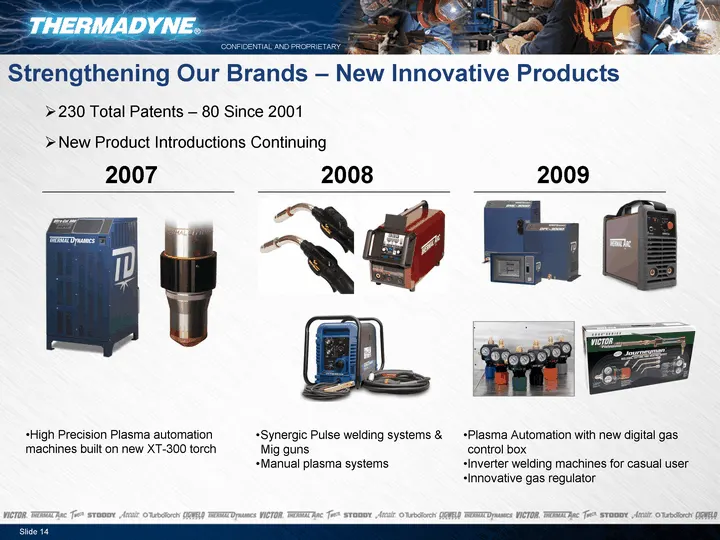
Slide 14: Strengthening Our Brands - New Innovative Products
2007 2008 2009 Slide 14 Strengthening Our Brands - New Innovative Products High Precision Plasma automation machines built on new XT-300 torch Synergic Pulse welding systems & Mig guns Manual plasma systems Plasma Automation with new digital gas control box Inverter welding machines for casual user
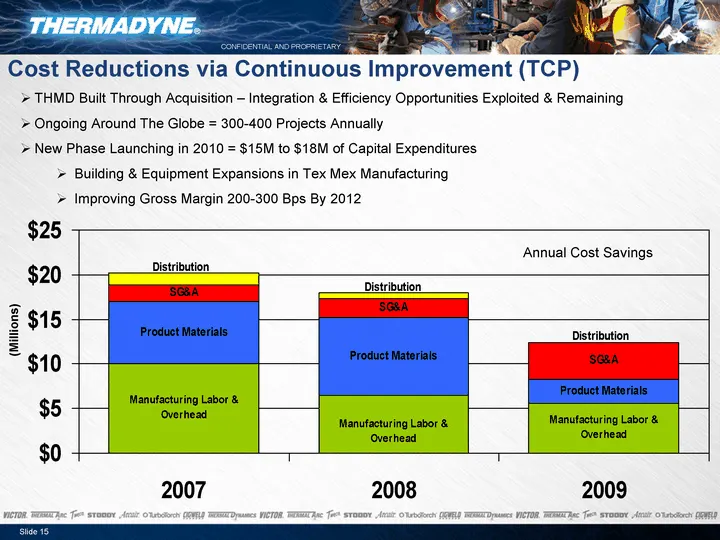
Slide 15: Cost Reductions via Continuous Improvement (TCP)
2007 2008 2009 Manufacturing Labor & OH 10.1 6.5 5.6 Product Materials 6.9 8.7 2.7 SG&A 1.9 2.1 4.1 Distribution 1.3 0.7 0 Slide 15 Cost Reductions via Continuous Improvement (TCP) THMD Built Through Acquisition - Integration & Efficiency Opportunities Exploited & Remaining Ongoing Around The Globe
Slide 16: Increasing Cash Flows
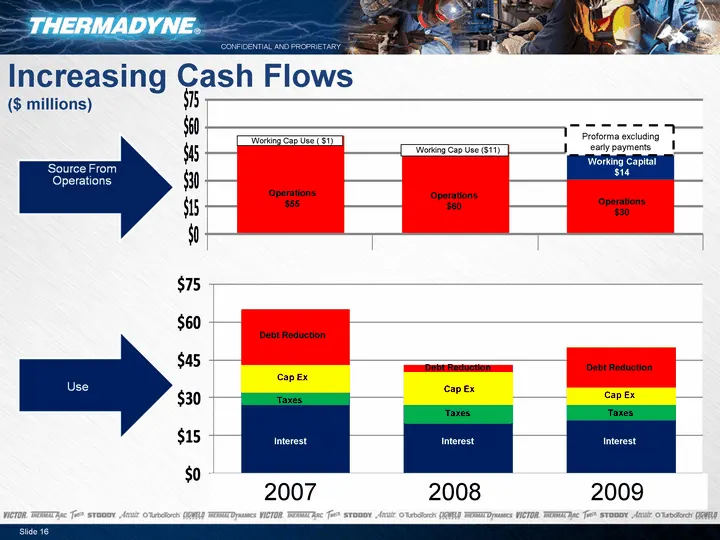
Increasing Cash Flows ($ millions) Slide 16 Working Cap Use ( $1) Working Cap Use ($11) Operations $55 Operations $60 Operations $30 Debt Reduction Taxes Cap Ex Interest Debt Reduction Taxes Cap Ex Interest Debt Reduction Taxes Cap Ex Interest 2007 2008 2009 Working Capital $14 Operations $55 Operat
Slide 17: Cash Flows From Working Capital Efficiency
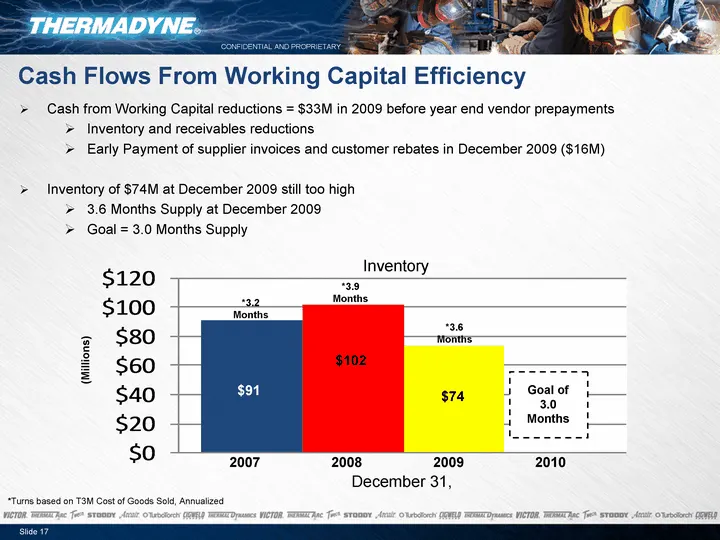
Slide 17 Cash Flows From Working Capital Efficiency (Millions) Inventory December 31, 2007 2009 2008 2010 $91 $74 $102 Cash from Working Capital reductions = $33M in 2009 before year end vendor prepayments Inventory and receivables reductions Early Payment of supplier invoices and customer rebates i
Slide 18: Limited Debt Maturities
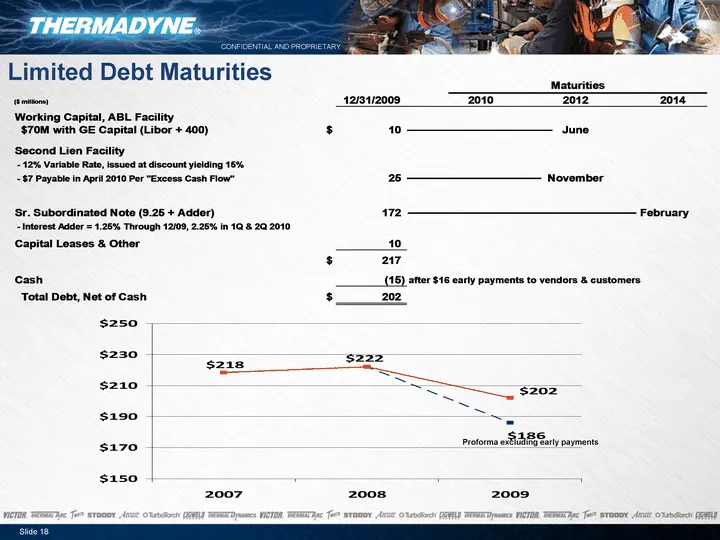
Limited Debt Maturities 2007 2008 2009 Net Debt 218.4 222.1 186 Net Debt, less year-end prepays 218.4 222.1 202.1 Proforma excluding early payments Slide 18
Slide 19: Outlook For 2010
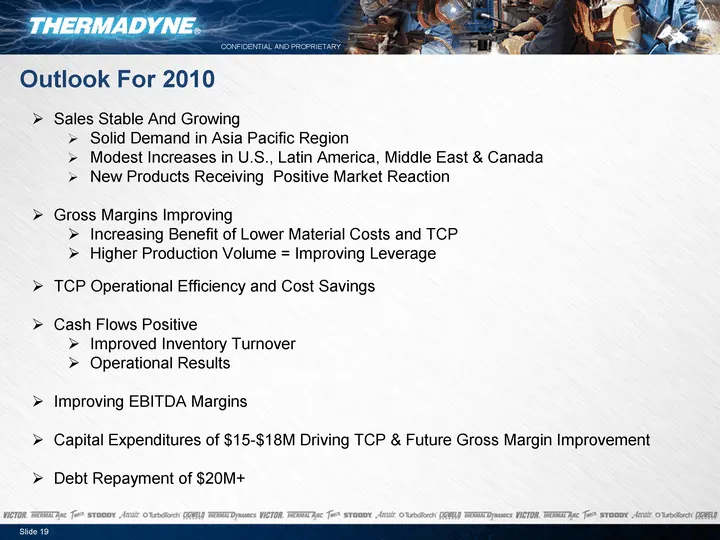
Slide 19 Outlook For 2010 Sales Stable And Growing Solid Demand in Asia Pacific Region Modest Increases in U.S., Latin America, Middle East & Canada New Products Receiving Positive Market Reaction Gross Margins Improving Increasing Benefit of Lower Material Costs and TCP Higher Production Volume = I
Source: SEC EDGAR · 8-K filed Mar 1, 2010