Allegheny Energy — Merger or Acquisition (February 2010)
30 slides from Allegheny Energy's merger presentation, Feb 11, 2010
Slide 1: FirstEnergy and Allegheny Energy - February 2010
February 2010

Slide 2: Safe Harbor - FirstEnergy
Safe Harbor - FirstEnergy This communication includes forward-looking statements based on information currently available to management. Such statements are subject to certain risks and uncertainties. These statements include declarations regarding management’s intents, beliefs and current expectati

Slide 3: Safe Harbor - FirstEnergy (Continued)
Safe Harbor - FirstEnergy (Continued) With respect to the proposed merger, actual results may differ materially due to the risks and uncertainties relating to the ability to obtain the requisite Allegheny and FirstEnergy stockholder approvals; the risk that FirstEnergy or Allegheny may be unable to

Slide 4: Safe Harbor - Allegheny
Safe Harbor - Allegheny In addition to historical information, this presentation may contain a number of "forward-looking statements" as defined in the Private Securities Litigation Reform Act of 1995. Words such as anticipate, expect, project, intend, plan, believe, and words and terms of similar s

Slide 5: Additional Information and Where to Find It
Additional Information and Where to Find It In connection with the proposed merger, FirstEnergy will file with the SEC a Registration Statement on Form S-4 that will include a joint proxy statement of FirstEnergy and Allegheny that also constitutes a prospectus of FirstEnergy. FirstEnergy and Allegh

Slide 6: Agenda
Agenda Combination Rationale Transaction Terms Combined Company Profile Financial Highlights Regulatory Timeline & Next Steps Summary

Slide 7: Combination Rationale
Combination Rationale

Slide 8: FirstEnergy Combination Rationale
FirstEnergy Combination Rationale Consistent with our strategy to build a balanced, integrated and diversified portfolio of assets – Adjacent geographic footprint complements existing businesses and our retail sales strategy – Generation anchored by efficient nuclear and supercritical fossil baseloa

Slide 9: Allegheny Combination Rationale
Allegheny Combination Rationale Substantial upfront value to shareholders – 32% premium to Allegheny's current price (as of February th closing price) – FirstEnergy’s current dividend would represent a 145% increase for Allegheny shareholders, supported by combined company’s strong balance sheet and

Slide 10: Transaction Terms
Transaction Terms

Slide 11: Key Transaction Terms
Key Transaction Terms Consideration: 100% stock Offer Price: 0.667 shares of FirstEnergy per Allegheny share Premium: 32% based on February th closing prices and 22% to the average stock price of Allegheny over the last 60 days Pro Forma 73% FirstEnergy shareholders Ownership: 27% Allegheny sharehol

Slide 12: Combined Company Profile
Combined Company Profile
Slide 13: Combined Statistics
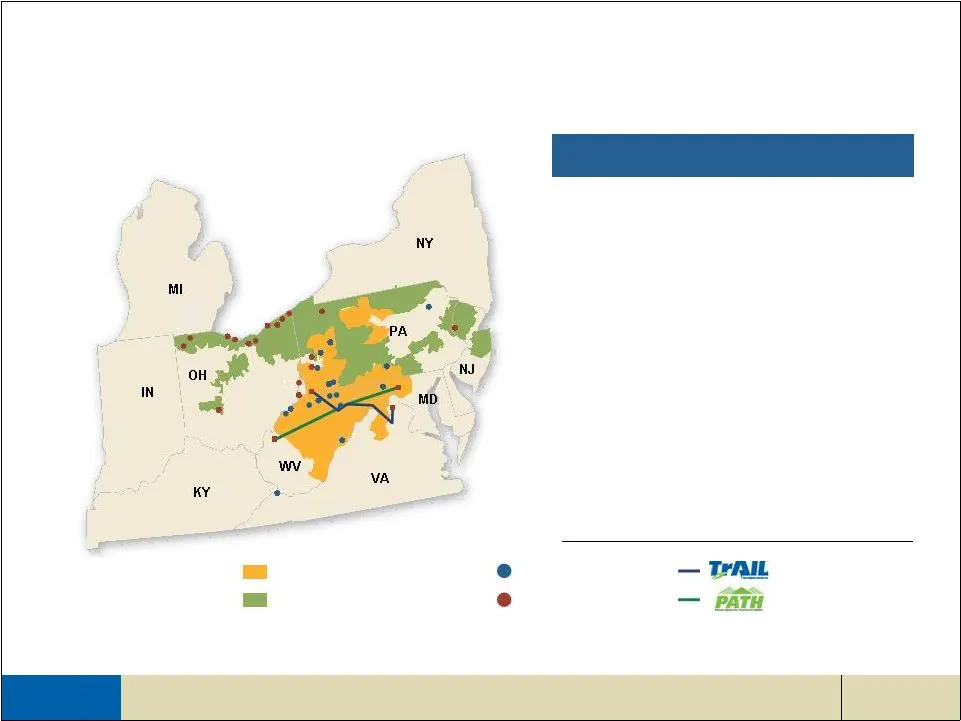
Combined Statistics 1 An Integrated, Regional Platform 1. 12/31/2009 data, except where noted 2. Excludes American Transmission Systems Incorporated (ATSI) and Allegheny Energy Transmission, LLC 3. 2009 estimate Revenue: Regulated Utilities Electric Customers: Regulated States: Rate Base: Total Gene
Slide 14: Diverse Competitive Generation Portfolio
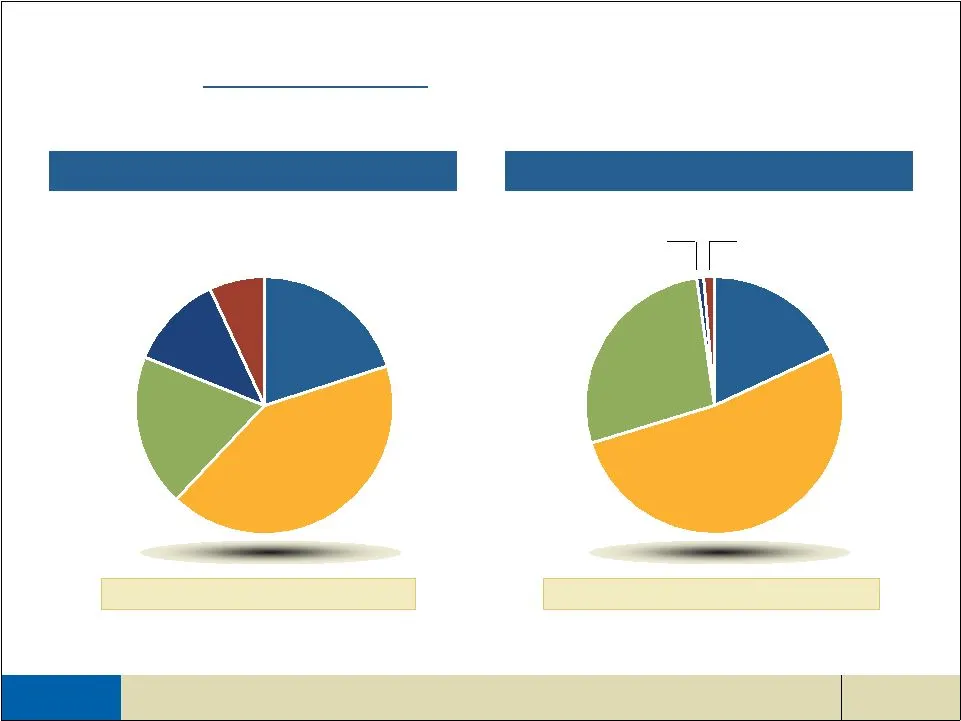
Combined Competitive Capacity 1 19% 20% 7% 12% Combined Competitive Production 2 28% 18% Diverse Competitive Generation Portfolio 42% Nuclear Gas / Oil 52% Supercritical Coal Nuclear Gas / Oil <1% Hydro/Wind ~2% Total Combined Capacity: 21 GW Total Combined Production: 117 TWh 1. Capacity as of year
Slide 15: Highly Efficient Coal-Fired Fleet
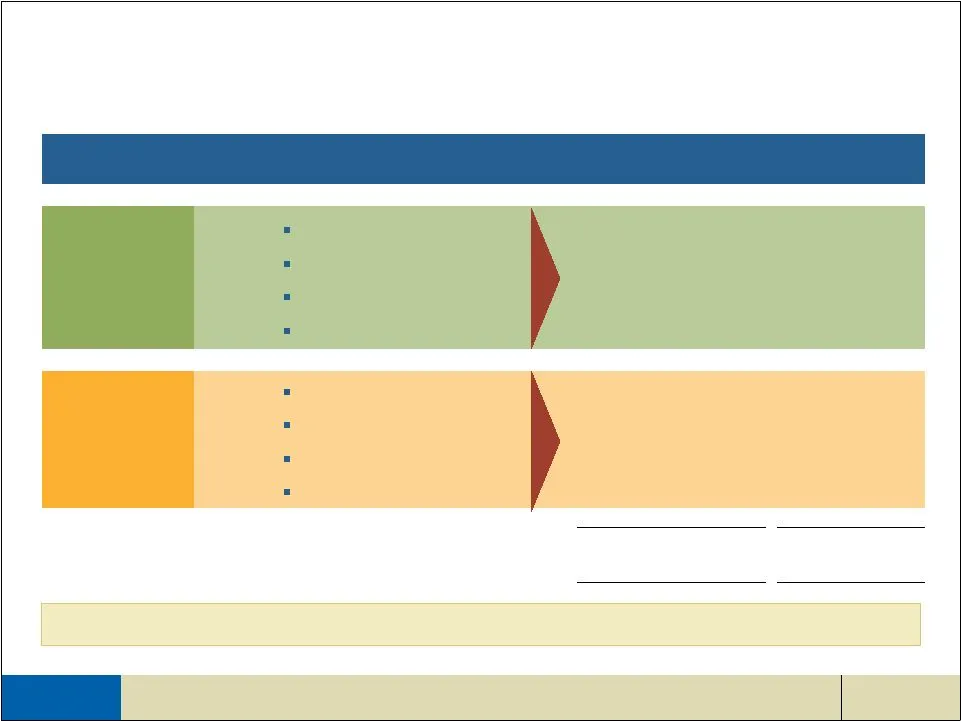
Supercritical Units Combined Companies (MW) U.S. Total (MW) Highly Efficient Coal-Fired Fleet 4,945 (32%) 224,600 (72%) Pre-1965 Typically Unscrubbed Heat Rates ~11,000 Btu/kWh Higher Cost ~$30-35/MWh Subcritical Units 15,332 MW 312,000 MW 10,387 (68%) 87,400 (28%) Post-1965 Typically Scrubbed Heat
Slide 16: Combined Fleet is Well Positioned for Changing Environmental Regulation
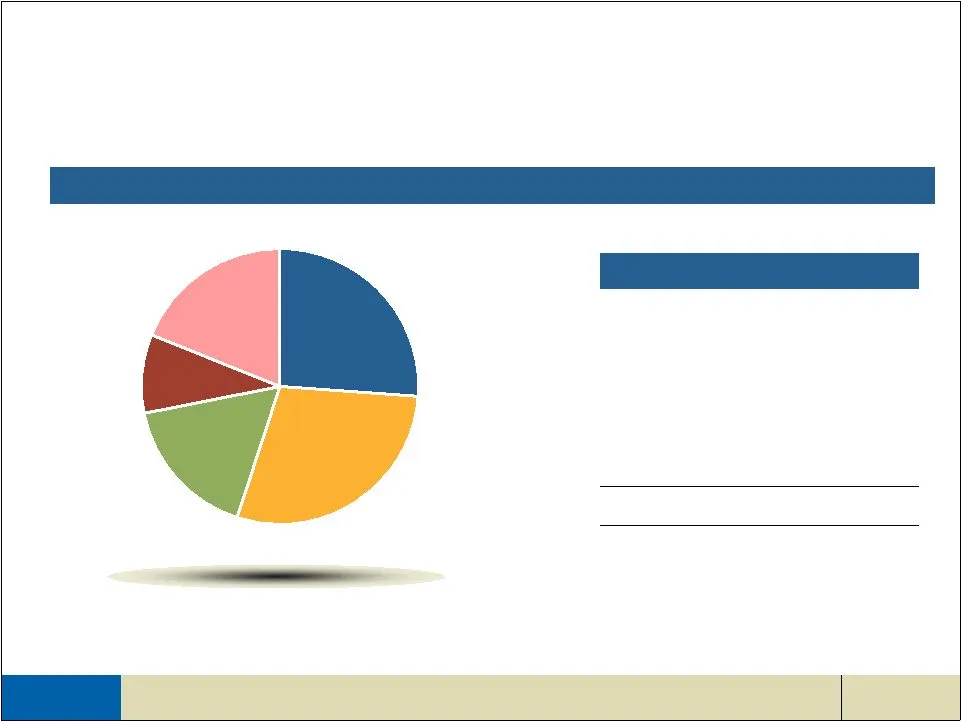
Total Capacity 17% 26% 9% GW’s by Category 1 Combined Fleet is Well Positioned for Changing Environmental Regulation 1. Regulated and competitive capacity as of 12/31/2009 2. Includes nuclear, wind and hydro 3. Includes Sammis Units 6 and 7 AQC project being completed in 2010 4. Sammis Units – 5, Ft
Slide 17: Regulated Utilities Across Seven States
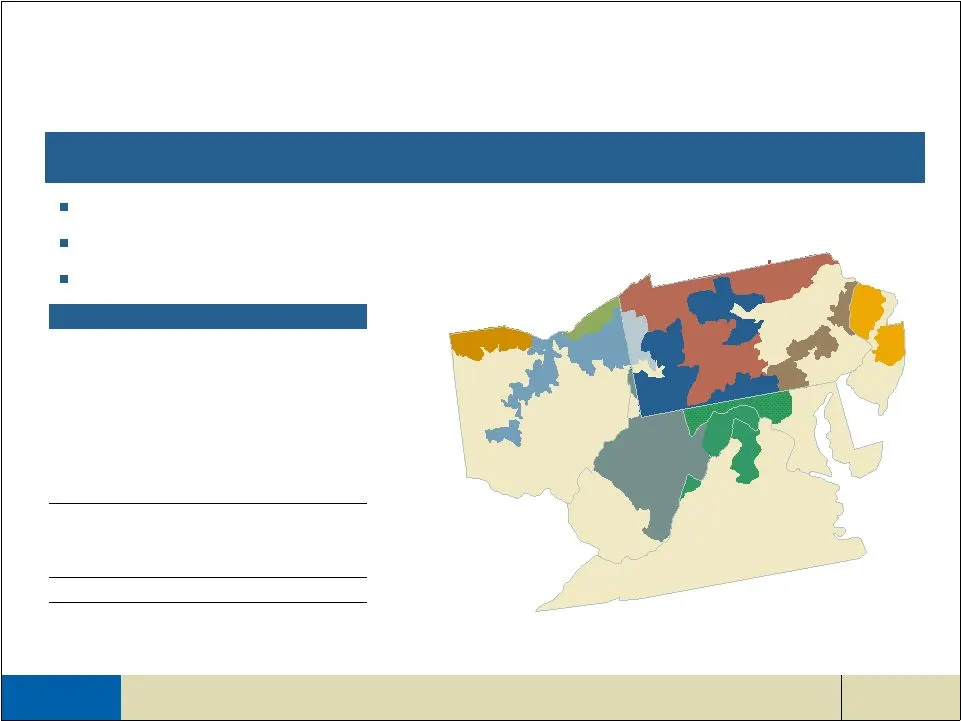
10 Regulated Utilities Across Seven States 1 Customers 2 Regulated Utilities 6.1MM customers in OH, PA, MD, WV, NJ, VA and NY 194,000 miles of distribution and nearly 20,000 miles of transmission lines 67,000 square miles 1. Excludes American Transmission Systems Incorporated (ATSI) and Allegheny En
Slide 18: Additional Transmission Expansion
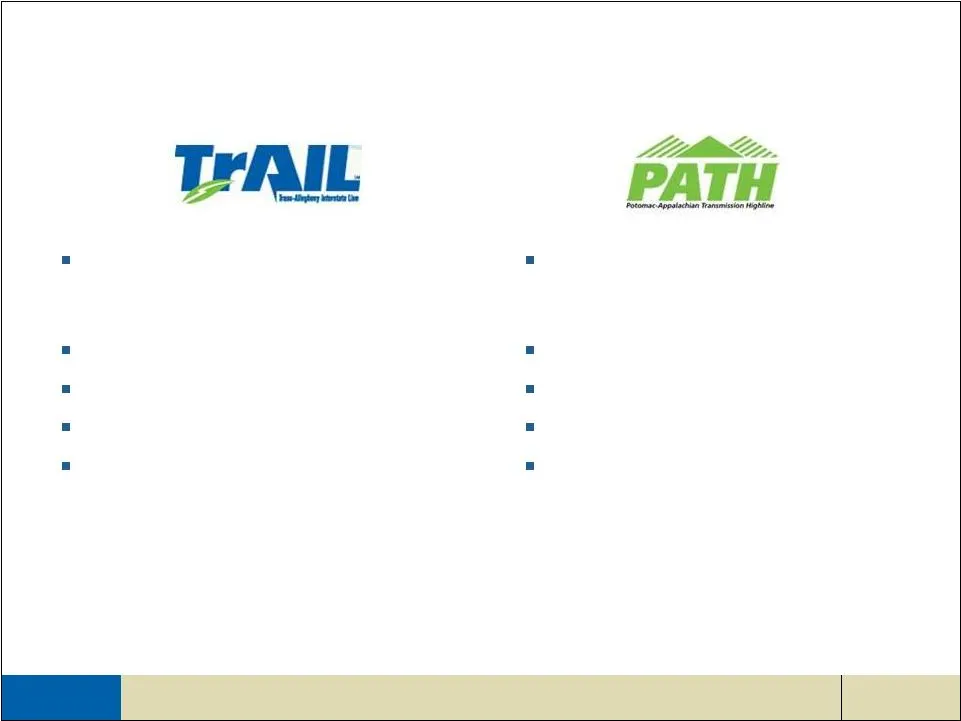
Additional Transmission Expansion 500 kV transmission line extending 149 miles from western PA through WV and into VA ROE: 12.7% Equity: 50% Cost: $850MM Status: – Approved in all states – Construction progressing – On track for in-service date in 2011 765 kV transmission line extending 275 miles fr

Slide 19: Financial Highlights
Financial Highlights
Slide 20: Estimated Annual Synergies
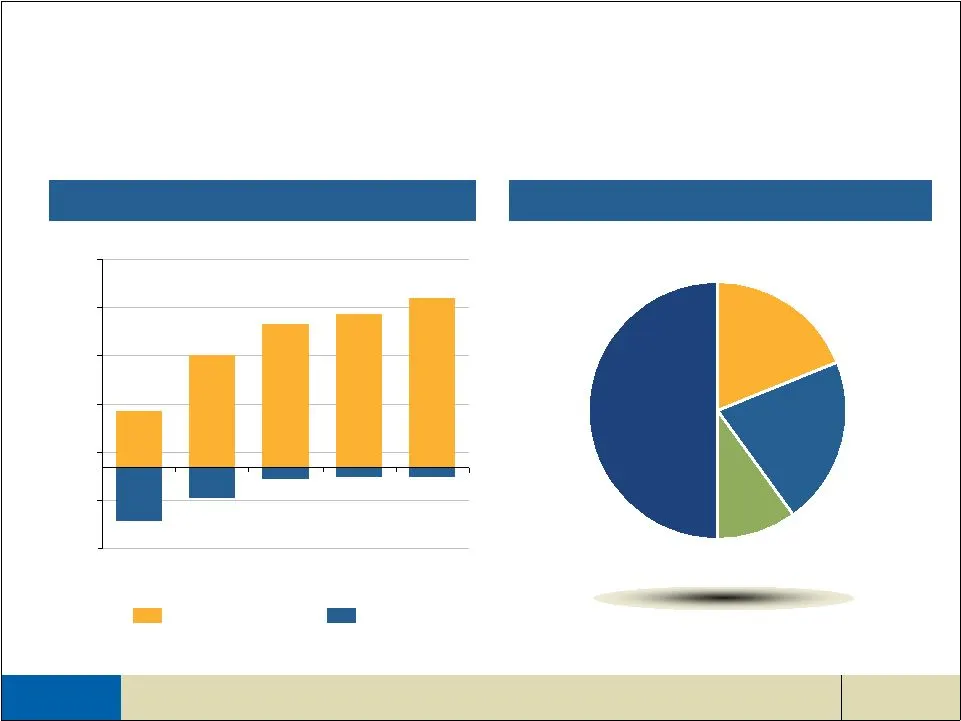
Estimated Annual Synergies Synergies By Category 10% 50% 21% (28) (28) (35) (95) (165) (250) (100) Year 1 Year 2 Year 3 Year 4 Year 5 Overview of Transaction Synergies $MM 19% Corporate Generation and Fuel Information Services Utility Gross Pre-Tax Synergies Costs to Achieve

Slide 21: Pro Forma Earnings Impact
Pro Forma Earnings Impact Anticipate transaction to be accretive to earnings in the first year following the close, including purchase accounting adjustments Purchase accounting adjustments expected to be modest – Estimated asset and liability step-ups reduce earnings by approximately $7MM in year 1
Slide 22: Pro Forma Key Ratios: Solid Balance Sheet
Year 2 Year 1 Pro Forma Key Ratios Solid Balance Sheet 51% – 55% 51% – 55% Debt / Capital 3.0x – 3.5x 3.0x – 3.5x Debt / EBITDA 4.3x – 4.7x 3.7x – 4.3x Funds from Operations Interest Coverage 20% – 23% 18% – 21% Funds from Operations / Total Debt Combined company metrics support stable investment gr

Slide 23: Summary Expected Financial Highlights
Summary Expected Financial Highlights Synergies realized across wide range of business segments but primarily derived from competitive operations Anticipate transaction to be accretive to earnings in the first year following the close Solid balance sheet and strong operating cash flow generation Cre

Slide 24: Regulatory Timeline & Next Steps
Regulatory Timeline & Next Steps

Slide 25: Regulatory Timeline & Next Steps
Regulatory Timeline & Next Steps Forming a transition team and transition steering committee – Comprised of key FirstEnergy and Allegheny management and senior executives Begin filings for regulatory approvals and shareholder vote Companies expect to complete the transaction within 12-14 months

Slide 26: Summary
Summary

Slide 27: Summary
Summary Combination creates a leading regional energy provider Complementary portfolio of generating assets strengthens the combined company’s operational performance Scale and scope of combined distribution and transmission assets create new opportunities Meaningful synergy opportunities, primarily
Slide 28

Slide 29: FirstEnergy Update
FirstEnergy Update
Slide 30: 2009 Fourth Quarter & Full-Year GAAP to Non-GAAP Reconciliation
Full Year 2009 Fourth Quarter 2009 ($ Per Share) 2009 Fourth Quarter & Full-Year GAAP to Non-GAAP Reconciliation 3.77 0.77 Basic Earnings Per Share (Non-GAAP) 0.42 0.42 Power Contract Mark-To-Markets Adjustment (0.52) – Non-Core Asset Sales/Impairments (0.53) (0.49) Income Tax Issue Resolution 0.31
Source: SEC EDGAR · DEFA14A filed Feb 11, 2010
More decks from Allegheny Energy Inc
 EEI Financial Conference 201045 slides · Nov 1, 2010
 Barclays Capital CEO Energy-Power Conference 20105 slides · Sep 15, 2010
 Merger or Acquisition (September 2010)19 slides · Sep 14, 2010
 Merger or Acquisition (August 2010)20 slides · Aug 13, 2010
 Merger or Acquisition (August 2010)7 slides · Aug 4, 2010
 Citigroup Conference June 7-8, 201056 slides · Jun 7, 2010