PetroQuest Energy — Investor Presentation (November 2005)
25 slides from PetroQuest Energy's investor presentation, Nov 17, 2005
Slide 1: November 2005
November 2005
Slide 2: Company Strategy
Company Strategy Focus in Gulf Coast Basin (onshore and Gulf of Mexico Shelf), East Texas and Arkoma Basin Goal to maintain 60% of reserves in long lived basins while maintaining 75% of production from Gulf Coast region (51% of reserves long-lived at 9/30/05) Balanced growth approach Moderate/low ri
Slide 3: Why Invest in PetroQuest?
Why Invest in PetroQuest? Impressive growth since going public in September 1998 43% production CAGR 40% reserve CAGR Significant presence in three diverse basins - staged for growth in all three; 7.1 year reserve life index at 12/31/04 Small-cap stock with high liquidity Market capitalization - $45
Slide 4: Production - Commodity Mix
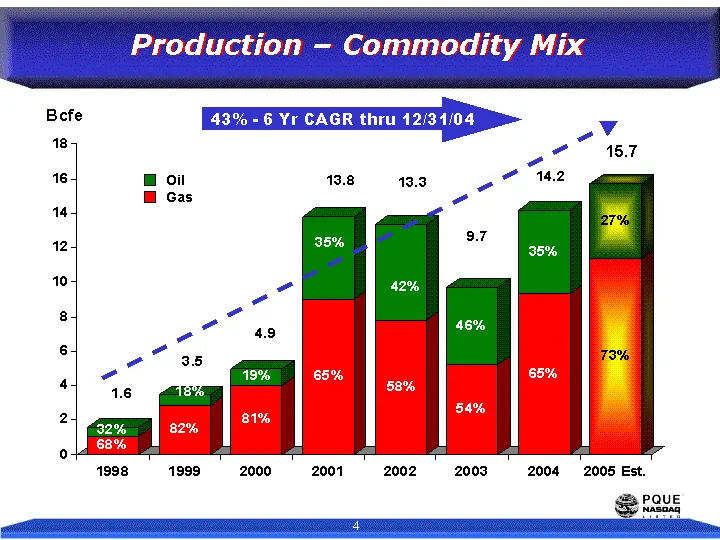
Production - Commodity Mix Oil Gas 43% - 6 Yr CAGR thru 12/31/04
Slide 5: Reserves - Product Mix
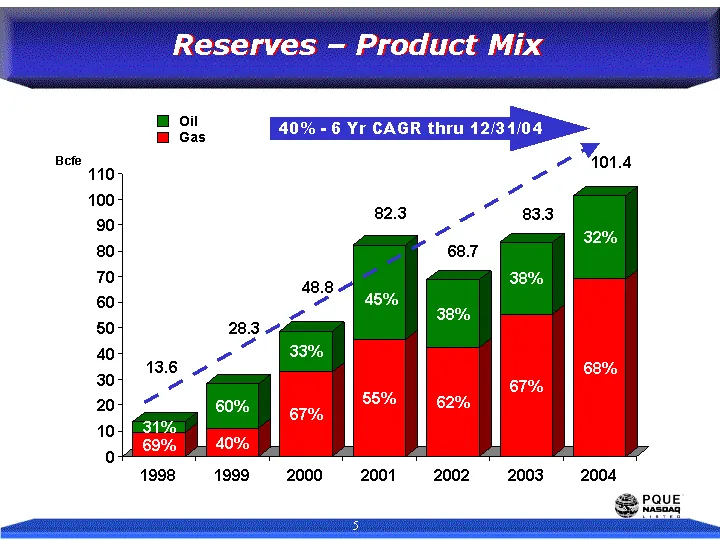
Reserves - Product Mix Oil Gas 40% - 6 Yr CAGR thru 12/31/04
Slide 6: Production and Reserves - Basin Mix
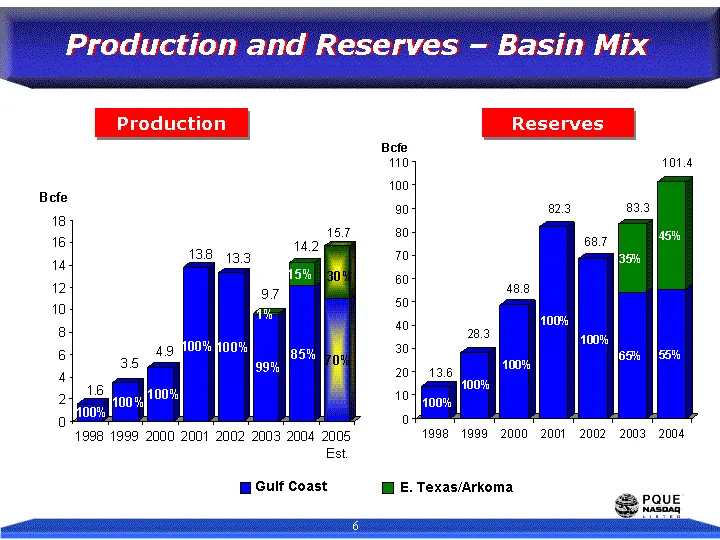
Production and Reserves - Basin Mix Production Reserves Gulf Coast E. Texas/Arkoma 15.7
Slide 7: Drilling Activity
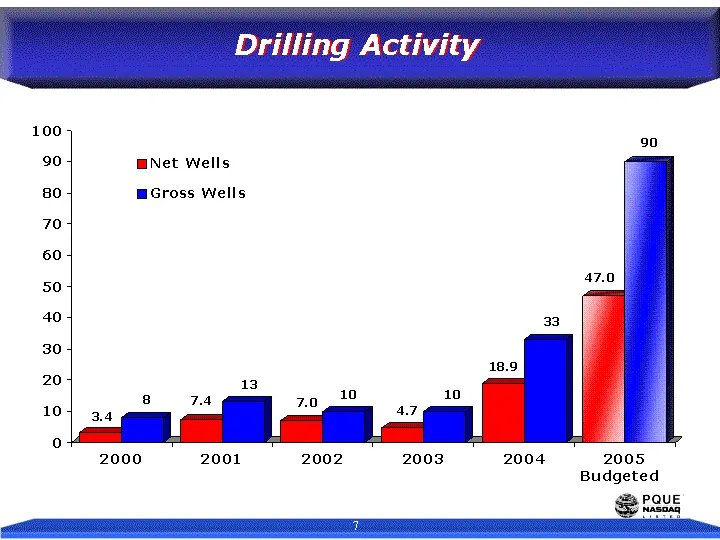
Drilling Activity 2000 2001 2002 2003 2004 2005 Net Wells 3.35 7.41 7.01 4.71 18.9 47 Gross Wells 8 13 10 10 33 90
Slide 8: Estimated Net Unrisked Reserve Potential
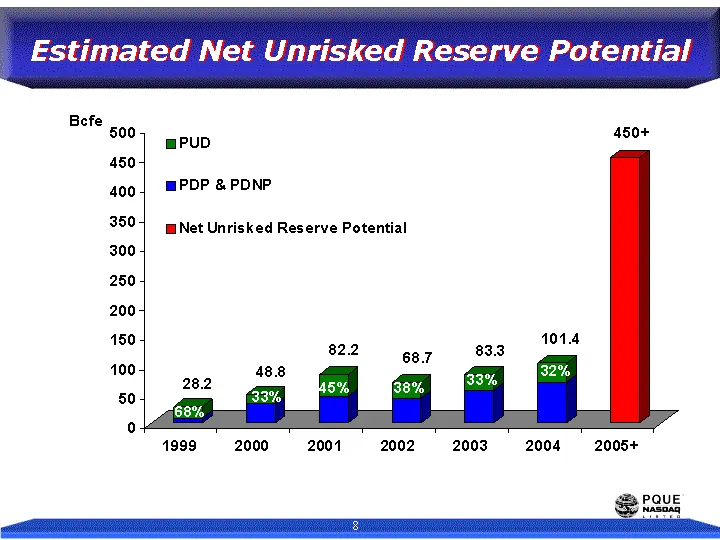
Estimated Net Unrisked Reserve Potential
Slide 9: Major Project Locations
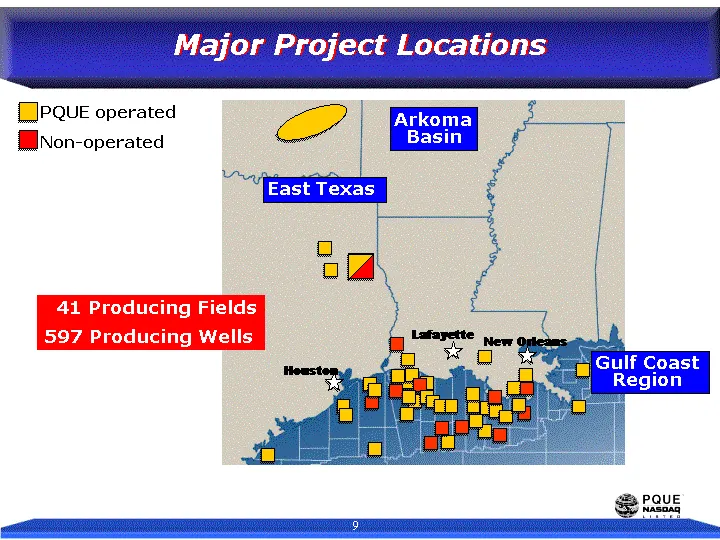
Lafayette Houston New Orleans Major Project Locations Non-operated PQUE operated 41 Producing Fields 597 Producing Wells Arkoma Basin East Texas Gulf Coast Region
Slide 10: 2005 Drilling Schedule
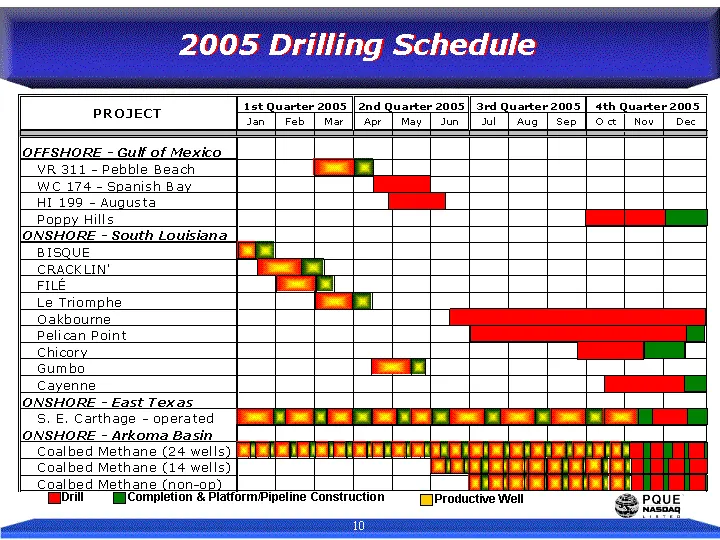
2005 Drilling Schedule Drill Completion & Platform/Pipeline Construction Productive Well
Slide 11: 2005 South Louisiana Drilling Program
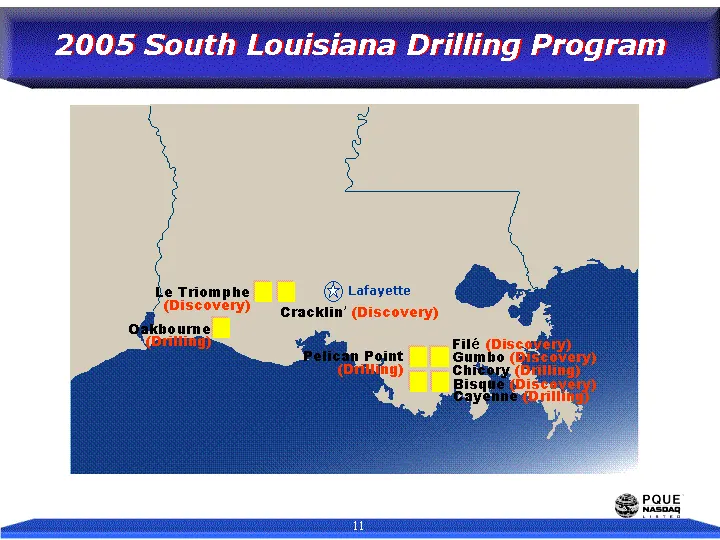
2005 South Louisiana Drilling Program 2005 South Louisiana Drilling Program Oakbourne (Drilling) File (Discovery) Gumbo (Discovery) Chicory (Drilling) Bisque (Discovery) Cayenne (Drilling) Cracklin' (Discovery) Lafayette Pelican Point (Drilling) Le Triomphe (Discovery)
Slide 12: 2005 South Louisiana Drilling Program
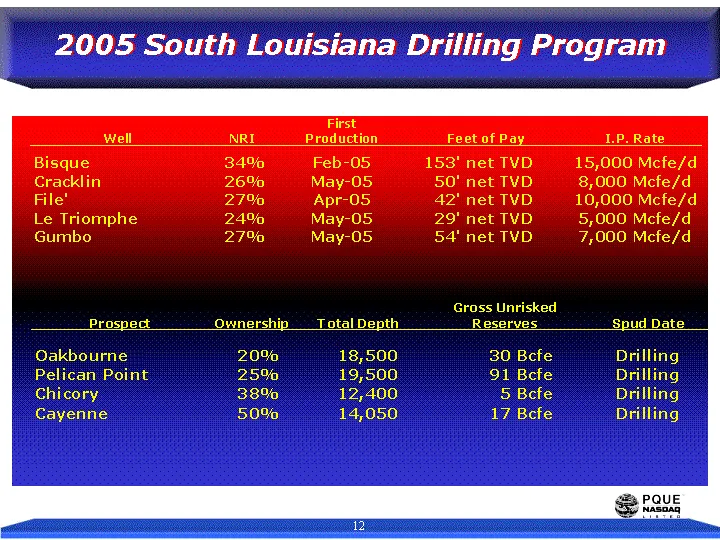
2005 South Louisiana Drilling Program
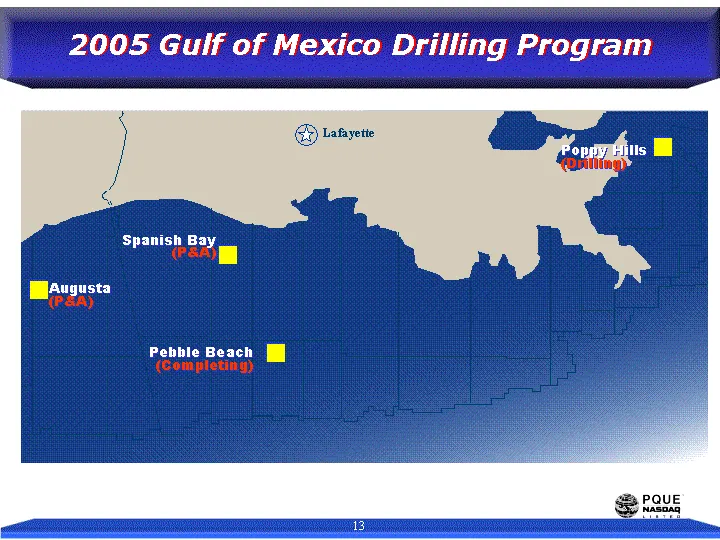
Slide 13: 2005 Gulf of Mexico Drilling Program
2005 Gulf of Mexico Drilling Program Poppy Hills (Drilling) Lafayette Spanish Bay (P&A) Pebble Beach (Completing) Augusta (P&A)
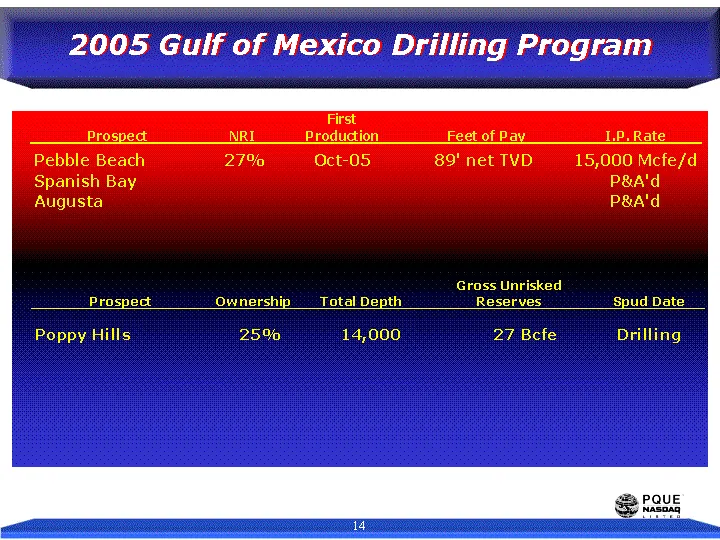
Slide 14: 2005 Gulf of Mexico Drilling Program
2005 Gulf of Mexico Drilling Program
Slide 15: East Texas Basin
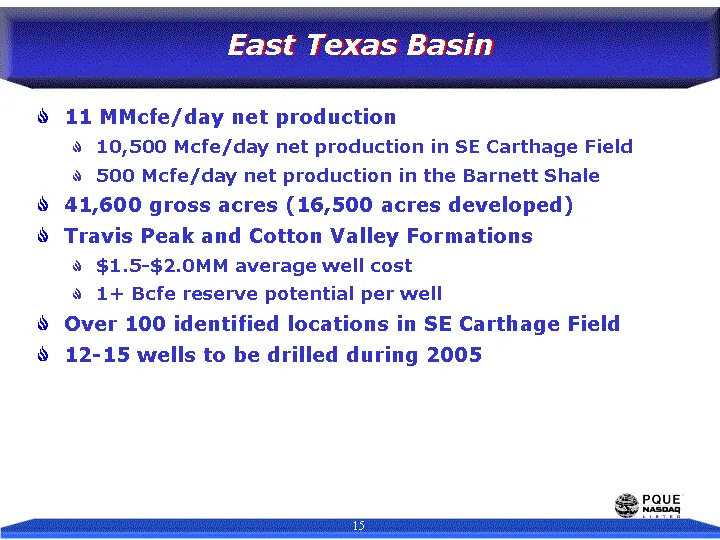
East Texas Basin 11 MMcfe/day net production 10,500 Mcfe/day net production in SE Carthage Field 500 Mcfe/day net production in the Barnett Shale 41,600 gross acres (16,500 acres developed) Travis Peak and Cotton Valley Formations $1.5-$2.0MM average well cost 1+ Bcfe reserve potential per well Over
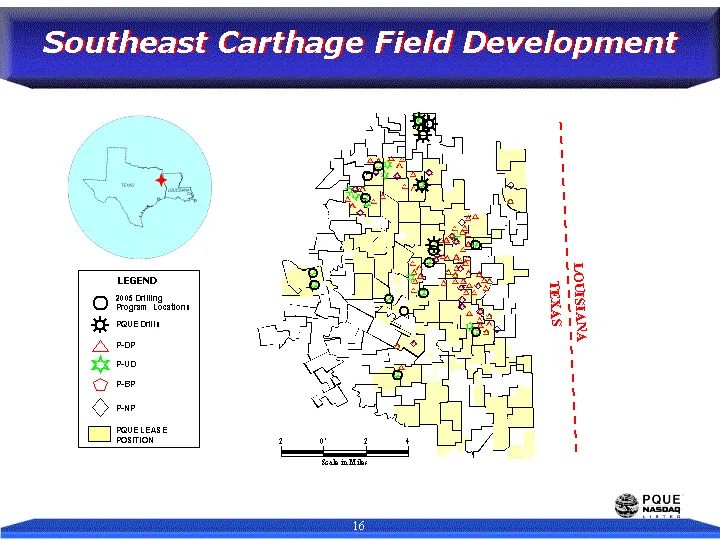
Slide 16: Southeast Carthage Field Development
Southeast Carthage Field Development LOUISIANA TEXAS LEGEND 2005 Drilling Program Locations PQUE Drills P-DP P-UD P-BP PQUE LEASE POSITION P-NP
Slide 17: Arkoma Basin - Hartshorne Coal
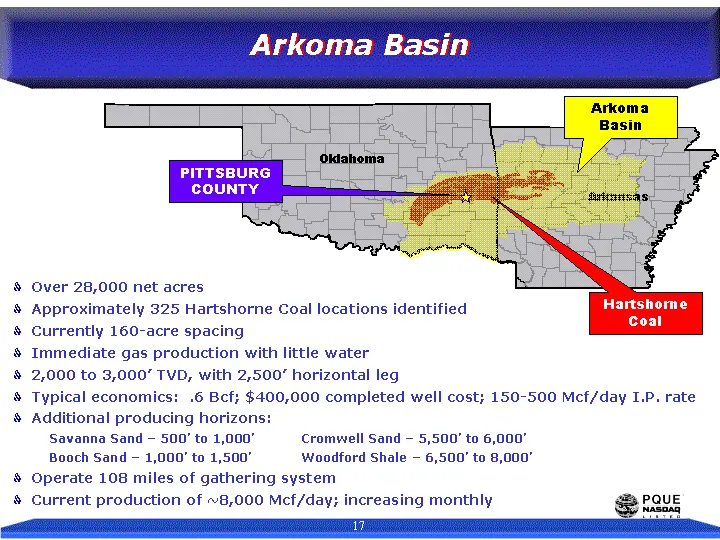
Over 28,000 net acres Approximately 325 Hartshorne Coal locations identified Currently 160-acre spacing Immediate gas production with little water 2,000 to 3,000' TVD, with 2,500' horizontal leg Typical economics: .6 Bcf; $400,000 completed well cost; 150-500 Mcf/day I.P. rate Additional producing h
Slide 18: Hartshorne Coal - Vertical vs. Horizontal
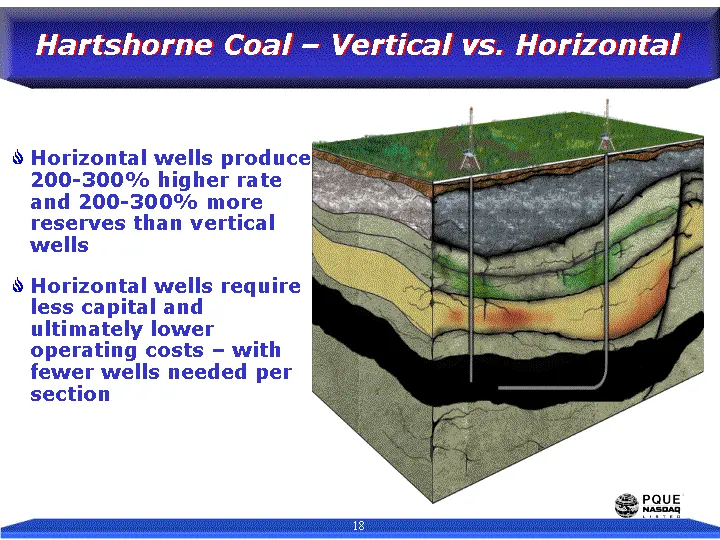
Hartshorne Coal - Vertical vs. Horizontal Horizontal wells produce 200-300% higher rate and 200-300% more reserves than vertical wells Horizontal wells require less capital and ultimately lower operating costs - with fewer wells needed per section
Slide 19: 2005 Drilling Capital Program
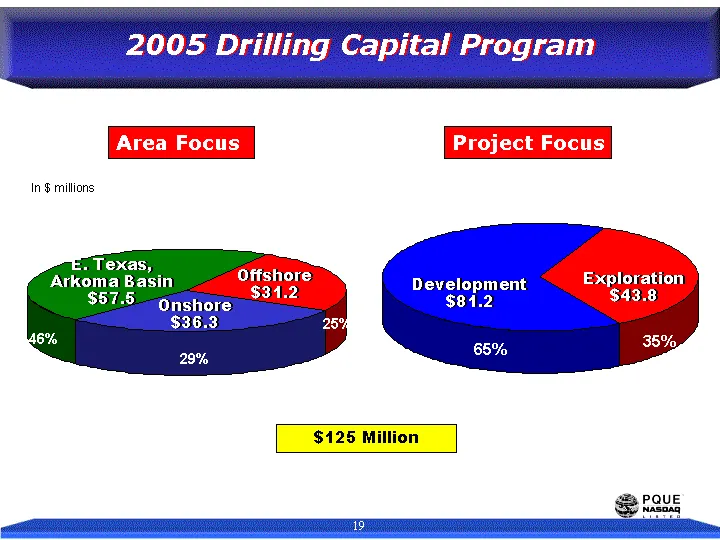
2005 Drilling Capital Program Project Focus Area Focus In $ millions Exploration $43.8 Development $81.2 Offshore $31.2 Onshore $36.3 E. Texas, Arkoma Basin $57.5 $125 Million
Slide 20: Financial Flexibility
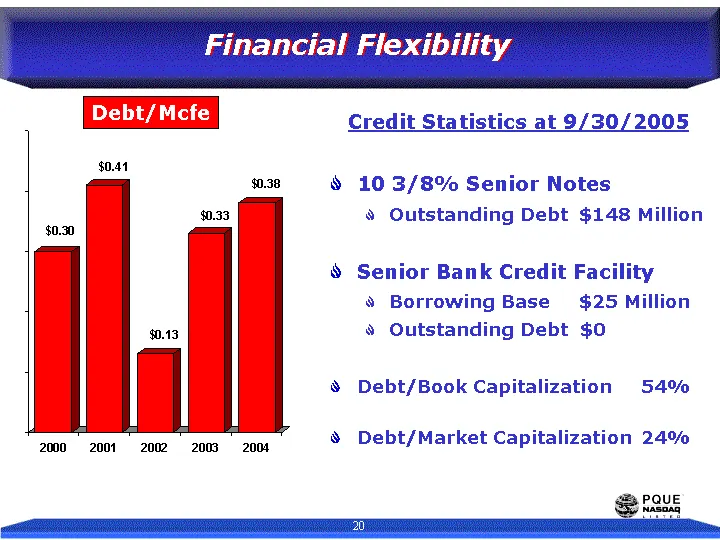
Financial Flexibility 2000 2001 2002 2003 2004 Debt/Mcfe 0.3 0.41 0.13 0.33 0.38 Credit Statistics at 9/30/2005 10 3/8% Senior Notes Outstanding Debt $148 Million Senior Bank Credit Facility Borrowing Base $25 Million Outstanding Debt $0 Debt/Book Capitalization 54% Debt/Market Capitalization 24% De
Slide 21: Recent Financing
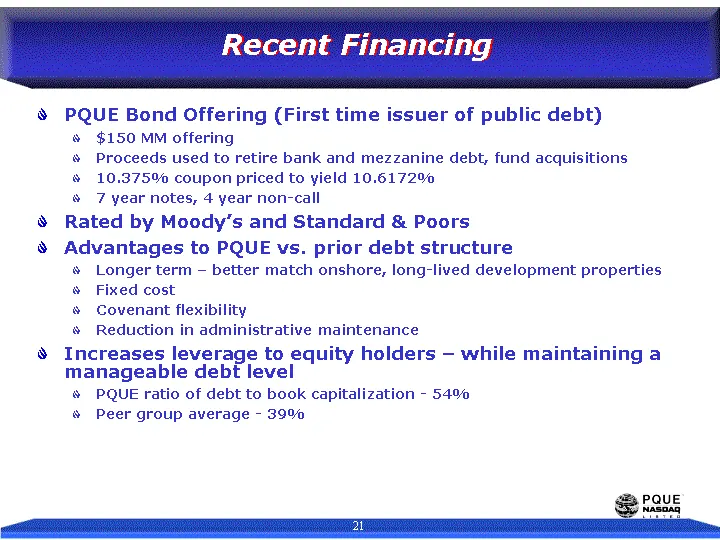
Recent Financing PQUE Bond Offering (First time issuer of public debt) $150 MM offering Proceeds used to retire bank and mezzanine debt, fund acquisitions 10.375% coupon priced to yield 10.6172% 7 year notes, 4 year non-call Rated by Moody's and Standard & Poors Advantages to PQUE vs. prior debt str
Slide 22: Revenue
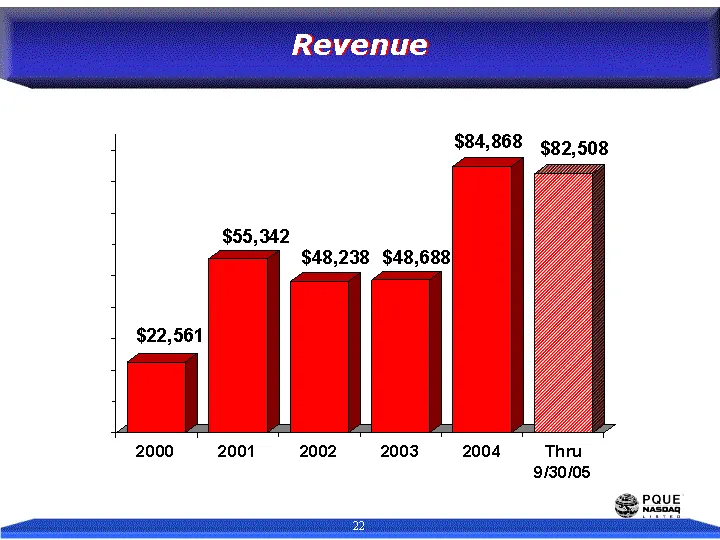
Revenue 2000 2001 2002 2003 2004 Thru 9/30/05 Revenue 22561 55342 48238 48688 84868 82508
Slide 23: Gross Margin and Gross Margin Per Mcfe
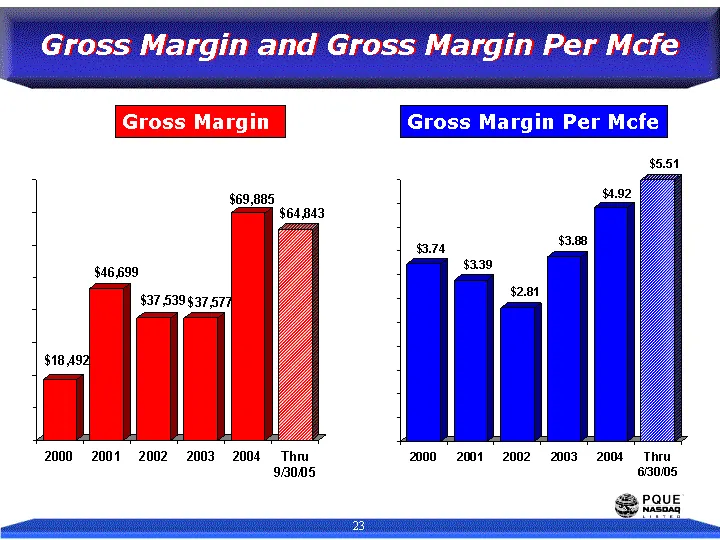
Gross Margin and Gross Margin Per Mcfe 2000 2001 2002 2003 9mo. 2004 Gross Margin/Mcfe 3.74 3.39 2.81 3.88 4.81 2000 2001 2002 2003 9-mo. 2004 Gross Margin/Mcfe 18492 46699 37539 37577 51327 Gross Margin Per Mcfe Gross Margin 2000 2001 2002 2003 2004 Thru 9/30/05 Gross Margin/Mcfe 18492 46699 37539
Slide 24: Summary
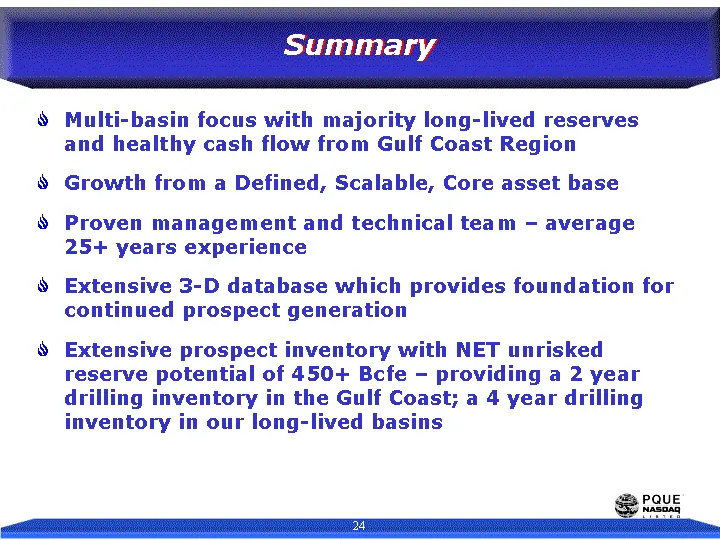
Summary Multi-basin focus with majority long-lived reserves and healthy cash flow from Gulf Coast Region Growth from a Defined, Scalable, Core asset base Proven management and technical team - average 25+ years experience Extensive 3-D database which provides foundation for continued prospect genera
Slide 25: Forward-looking statements
November 2005 This presentation contains forward-looking statements within the meaning of Section 27A of the Securities Act of 1933 and Section 21E of the Securities and Exchange Act of 1934. PetroQuest believes that its expectations are based on reasonable assumptions. No assurance, however, can be
Source: SEC EDGAR · 8-K filed Nov 17, 2005
More decks from PetroQuest Energy Inc
 Corporate Update (June 2019)15 slides · Jun 19, 2019
 Investor Presentation (November 2018)16 slides · Nov 7, 2018
 Investor Presentation (July 2018)29 slides · Jul 10, 2018
 Investor Presentation (December 2017)6 slides · Dec 20, 2017
 Investor Presentation (January 2017)28 slides · Jan 9, 2017
 Investor Presentation (April 2016)29 slides · Apr 5, 2016