Sprague Resources LP — NAPTP Annual Investor Conference (May 2015)
33 slides from Sprague Resources LP's conference presentation, May 20, 2015
Slide 1: Sprague Resources LP – NAPTP Annual Investor Conference
Sprague Resources LP NAPTP Annual Investor Conference Exhibit 99.1

Slide 2: Safe Harbor
Safe Harbor Forward-Looking Statements /Non-GAAP Measures Some of the statements in this presentation may contain forward-looking statements within the meaning of the safe harbor provisions of the U.S. Private Securities Litigation Reform Act of 1995. Forward-looking statements can be identified by
Slide 3
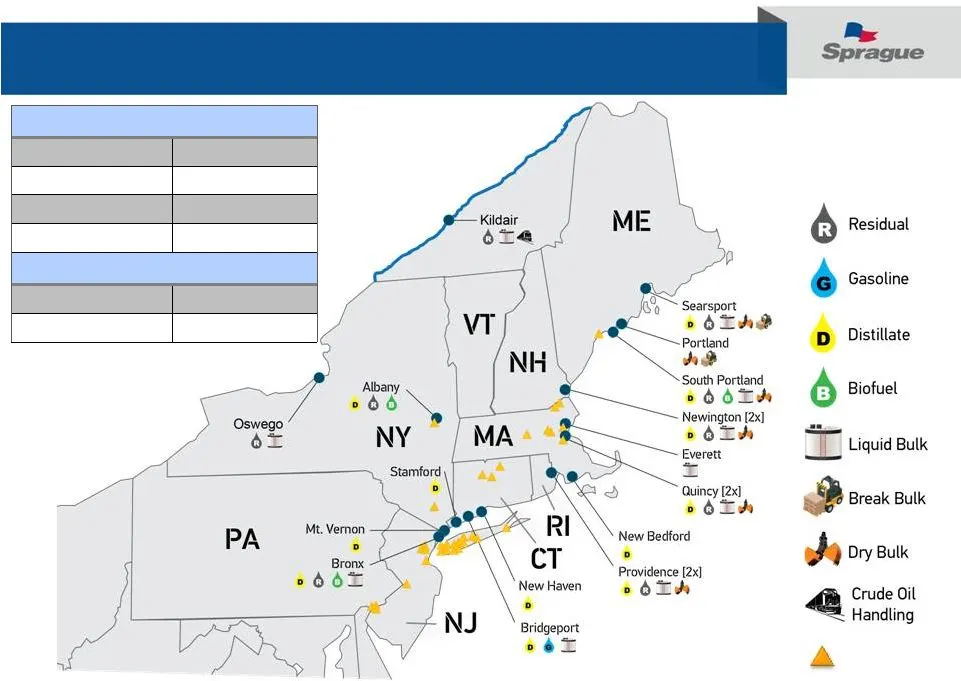
Slide 4: Refined Products and Materials Handling Network
Refined Products and Materials Handling Network (1) Does not include ~2.1 million barrels of storage capacity (46 storage tanks) currently out of service and not necessary for current operations rd Party Locations Storage Metrics Storage Tanks: Tank Capacity (1) : 14.1 MMbbl 18 Pads: 1,226,000 ft 10
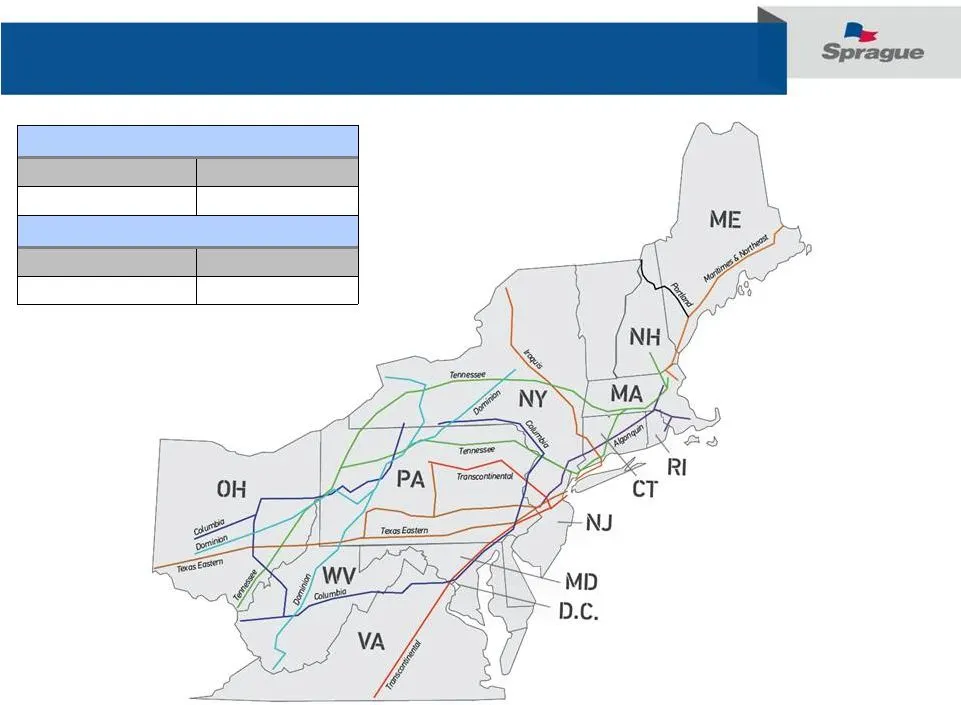
Slide 5: Natural Gas Service Area
Natural Gas Service Area Supply Metrics Pipelines: States/Utilities: Marketing Metrics ~ MMBtus (2014): 54,430,000 ~ Customer Accounts: 15,000
Slide 6: Sprague Resources LP (SRLP) Overview
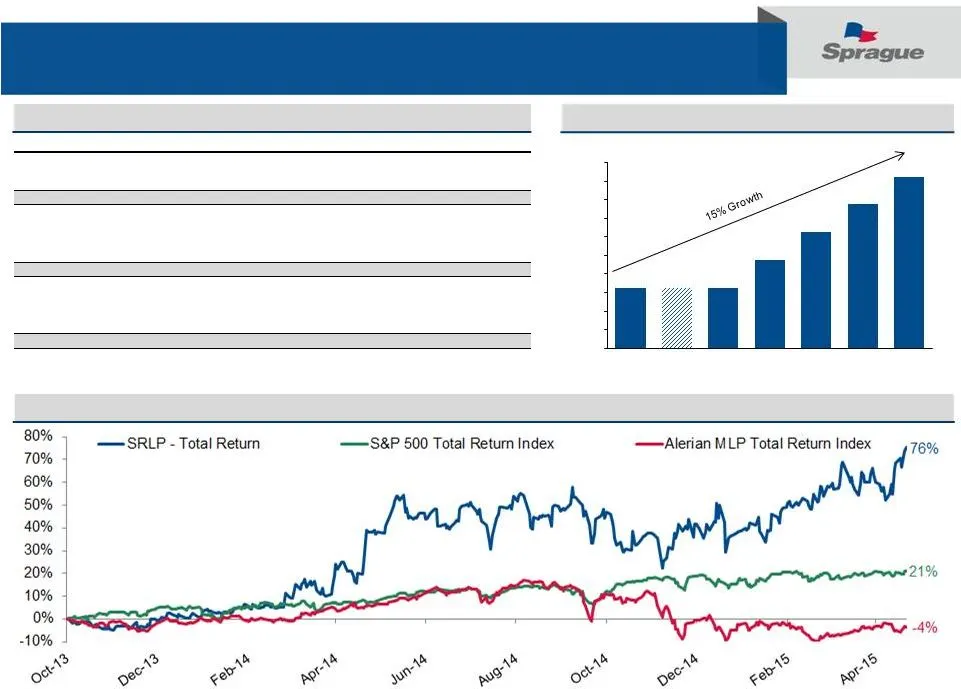
Sprague Resources LP (SRLP) Overview Ticker SRLP Exchange NYSE SRLP Price Per Unit on May 15, 2015 $28.06 Total Units Outstanding 21.1 million Market Capitalization $548 million 1Q 2015 Distribution Per Unit $0.4725 Annualized 1Q 2015 Distribution Per Unit $1.89 Yield as of May 15, 2015 6.74% Distri
Slide 7: Fee-Based Income
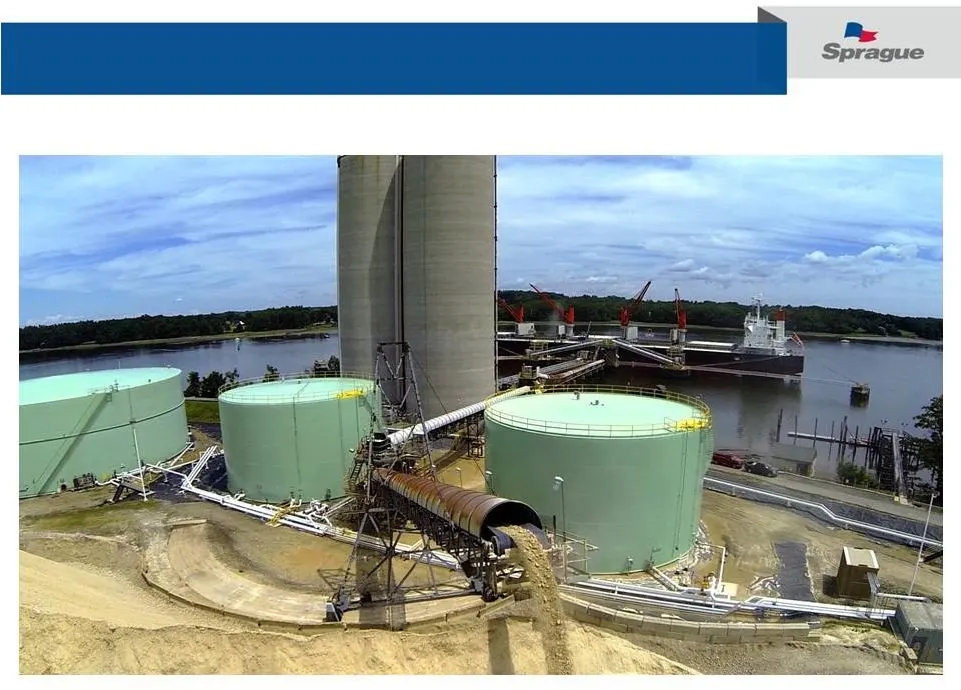
Fee-Based Income River Road Terminal Sprague’s terminals integrate refined product distribution with contractual income from materials handling services
Slide 8: Fee-Based Income Kildair Terminal
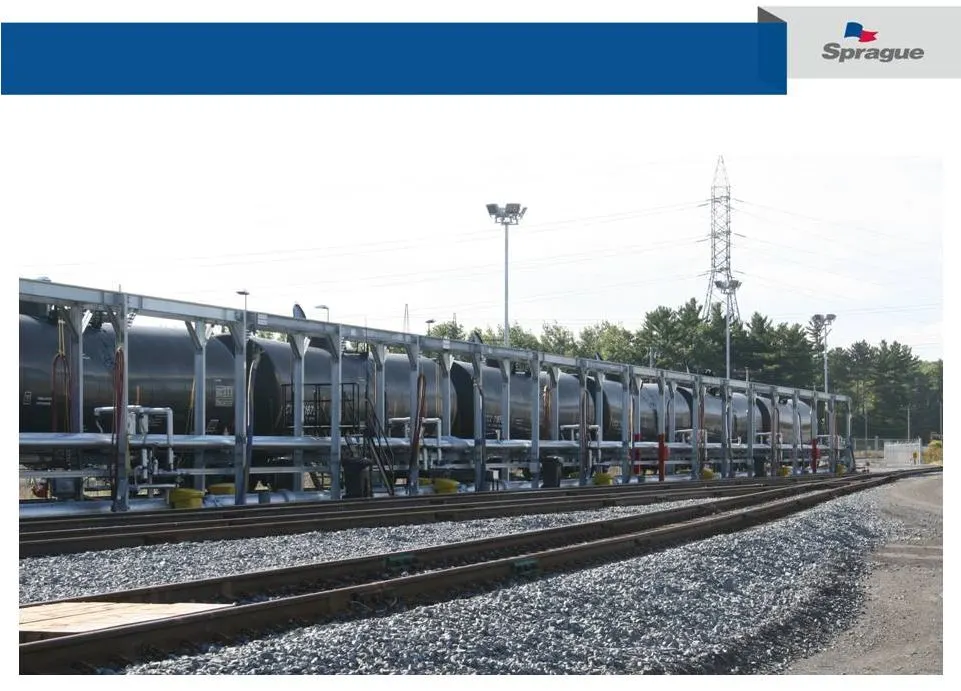
Fee-Based Income Kildair Terminal Recent expansion into crude trans-shipment / storage at our Kildair facility
Slide 9: Converting Rack Business to Contracted Sales
Converting Rack Business to Contracted Sales • Offers from Sprague move with market • Buyers contract for supply at known price • Volatility presents opportunity for customers • Forward programs de-risk customer business • “Chat” feature promotes communication and negotiation • Sprague has ability t
Slide 10: Natural Gas Contract Margin
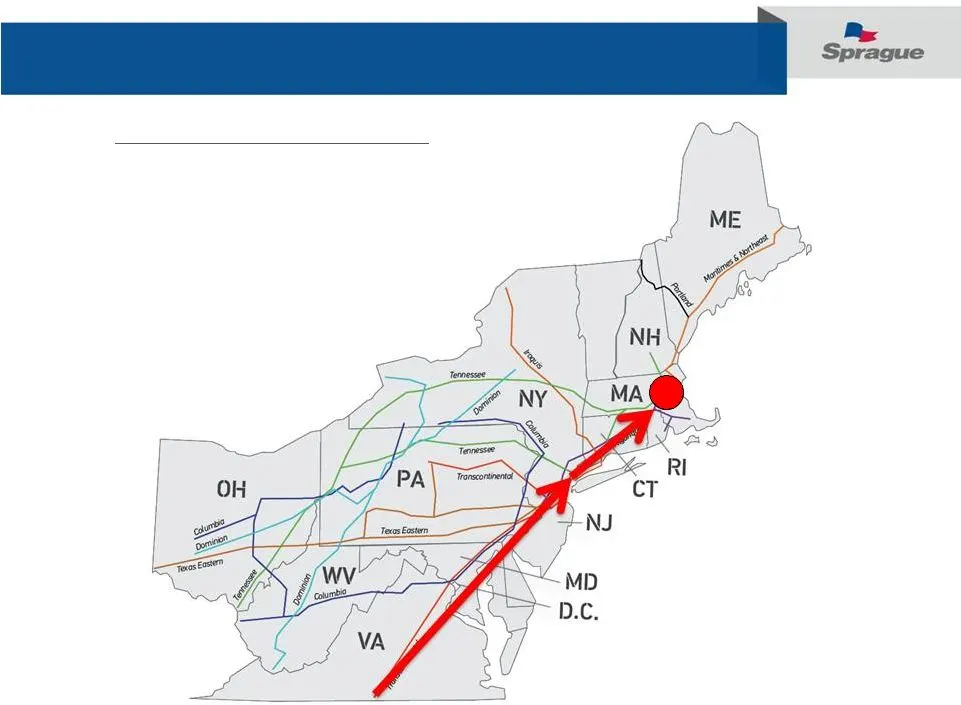
Natural Gas Contract Margin • Standard pathway to meter assumed • Contract offer reflects market cost to supply • Customer signs contract – sale is locked in • Supply costs are hedged Base contract margin established 2-Leg Traditional Supply Route
Slide 11: Natural Gas Margin Optimization
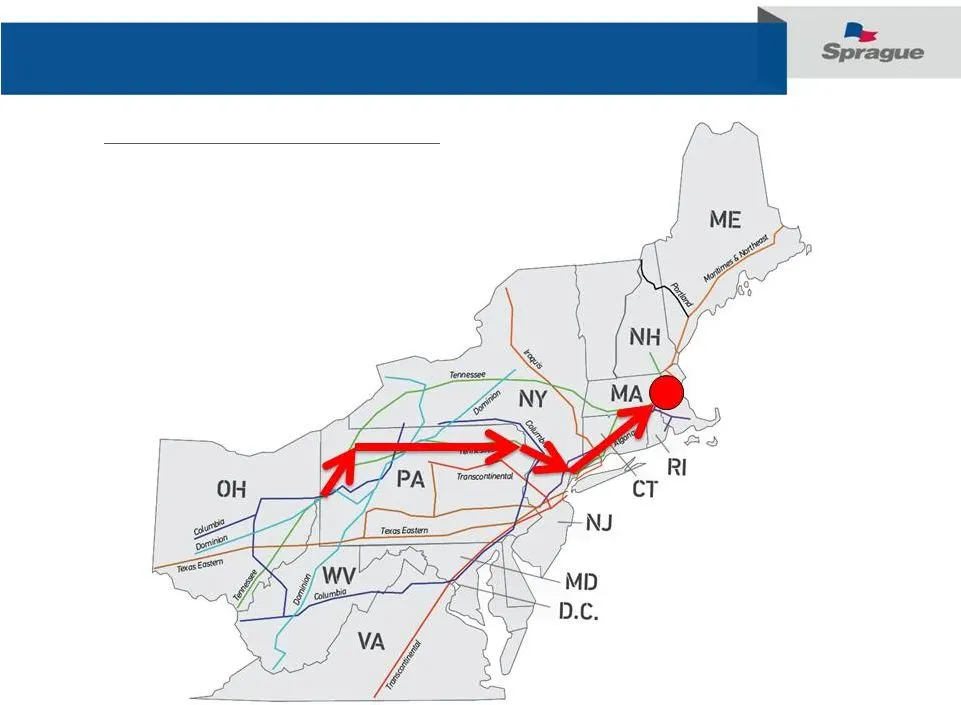
Natural Gas Margin Optimization Schedulers have flexibility to supply gas utilizing many pathways prior to delivery Broad portfolio of customer accounts enables “swaps” Cash market volatility presents additional opportunities Margin Enhancement Opportunities 4-Leg Alternative Supply Route
Slide 12: Integrated Business Model
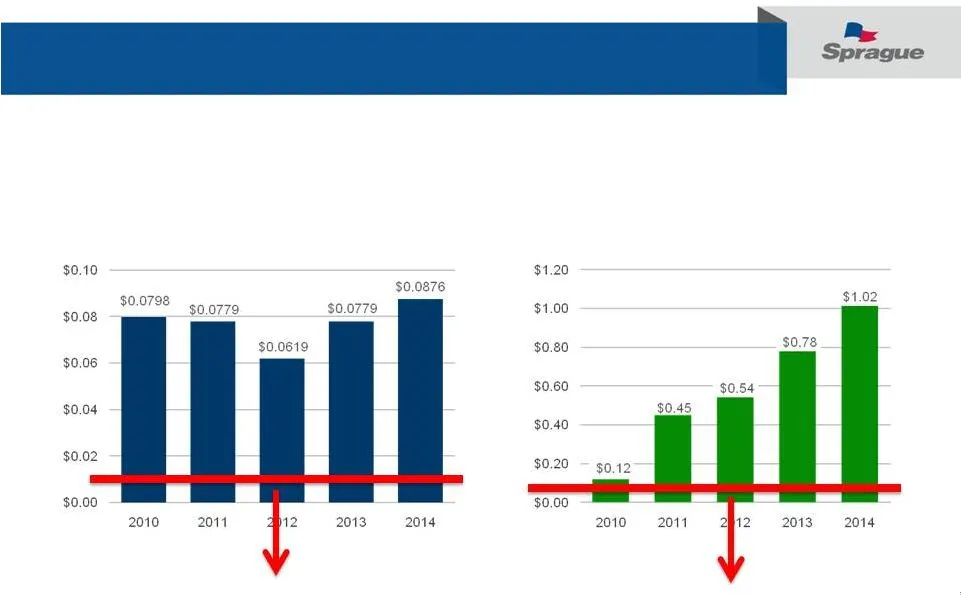
Integrated Business Model Supply and logistics expertise, coupled with product and service innovations, used to enhance returns on the asset base Refined Products Adjusted Unit Margin ($/gallon) Natural Gas Adjusted Unit Margin ($/MMBtu) Representative Throughput Model Margin Representative Wholesal
Slide 13: Integrated Business Model
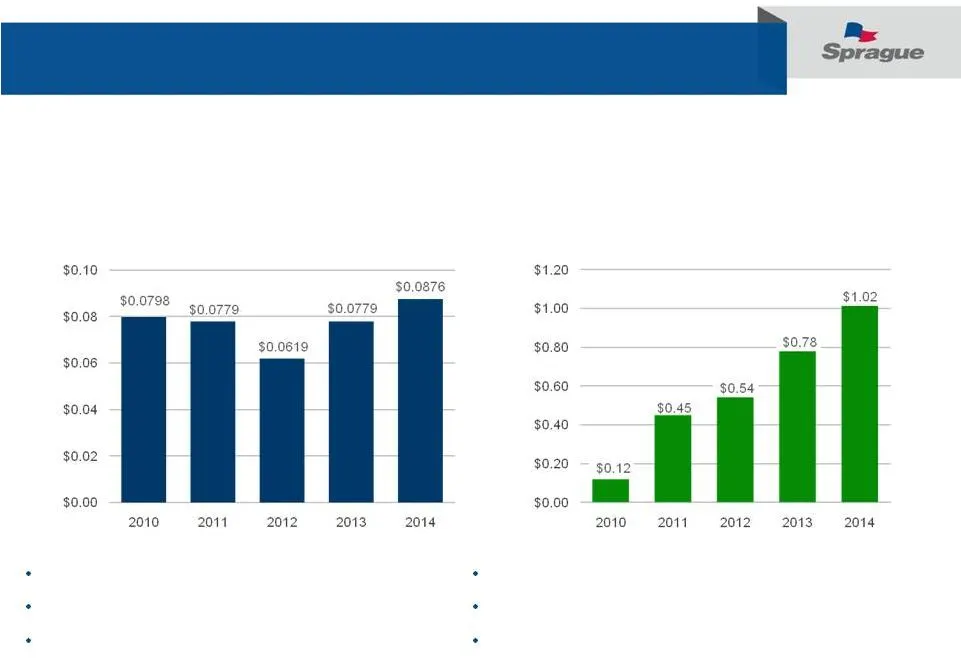
Integrated Business Model Refined Products Adjusted Unit Margin ($/gallon) Natural Gas Adjusted Unit Margin ($/MMBtu) Proprietary terminal marketers Local market competitive intelligence Control of our own supply in extreme conditions Superior product/service offer to customer Management of gas from
Slide 14: Limited Commodity Exposure
Limited Commodity Exposure • Sprague’s Risk Policy sets authorized position limits for all commodities handled • Inventory is tracked daily and Risk team monitors all open positions relative to inventory levels and sales to ensure Sprague maintains a hedged book of business • Outright short/long pos
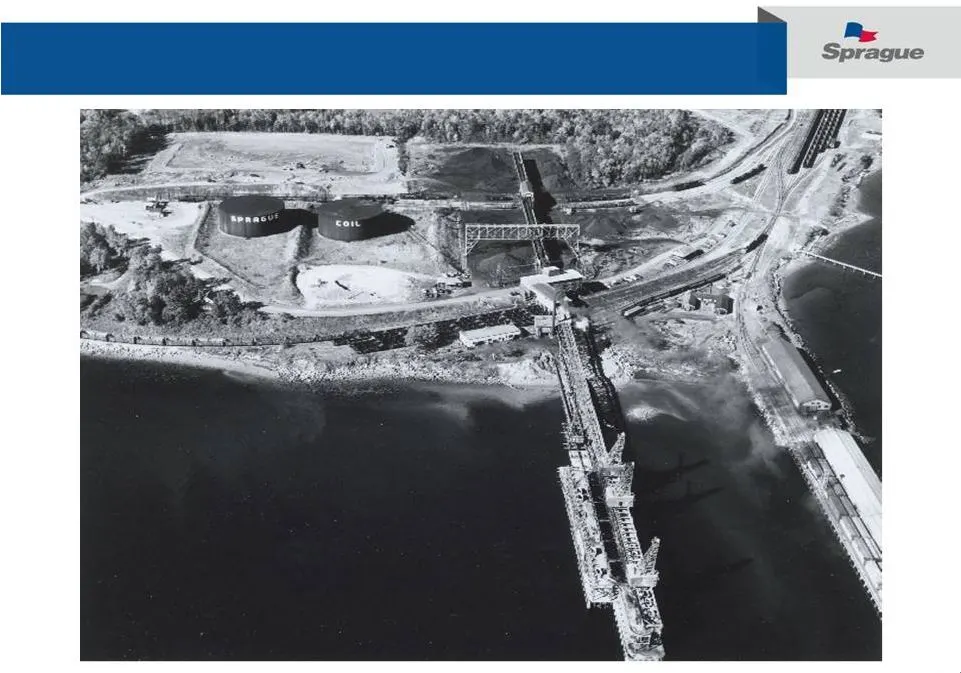
Slide 15: Searsport Terminal – circa 1950 Organic Growth
Searsport Terminal – circa 1950 Organic Growth – Sprague’s DNA
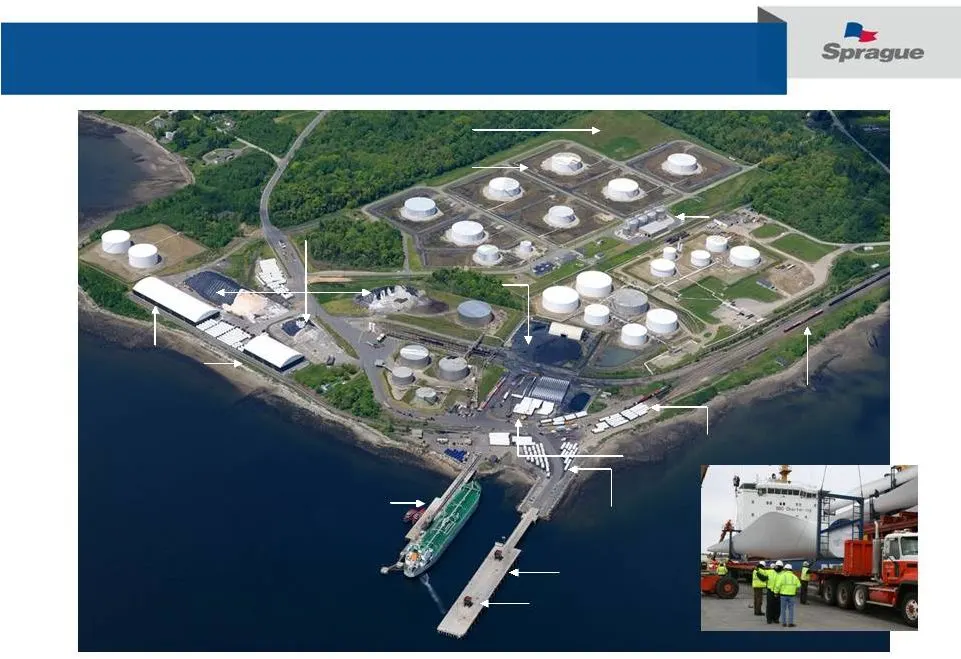
Slide 16: Searsport Terminal today
Rail Transfer Pad Nacelles Road Salt Pads Clay Slurry Rail connection to CP, CMQ and Pan Am Liquid Finger Dock Bulk Dock Food Grade Warehouses Available for Development Blades Hopper Coal / Petcoke Third Party Tanks Third Party Tanks Third-party storage Organic Growth – Sprague’s DNA Searsport Termi
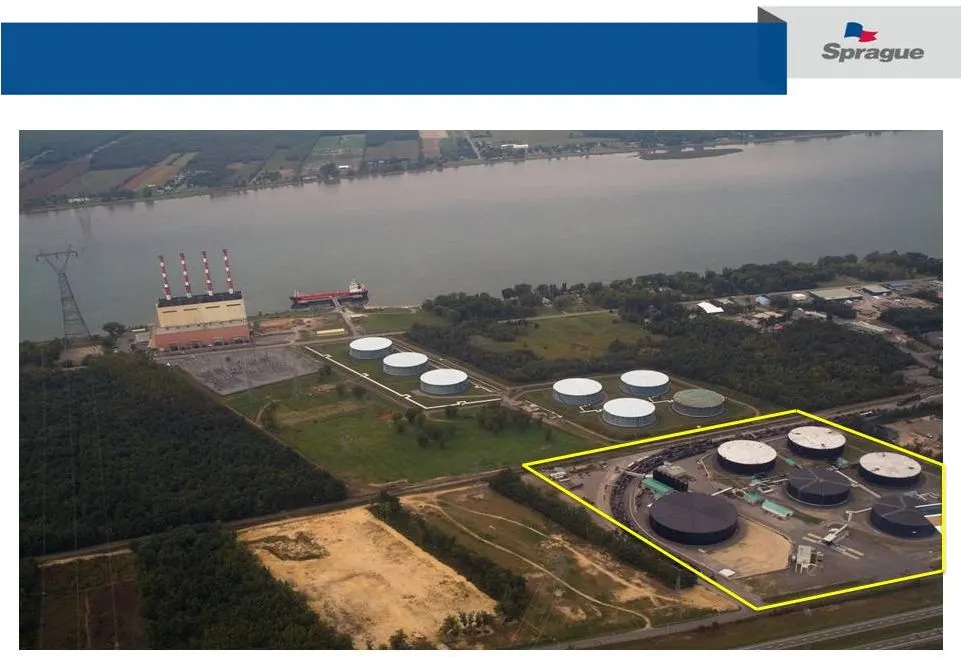
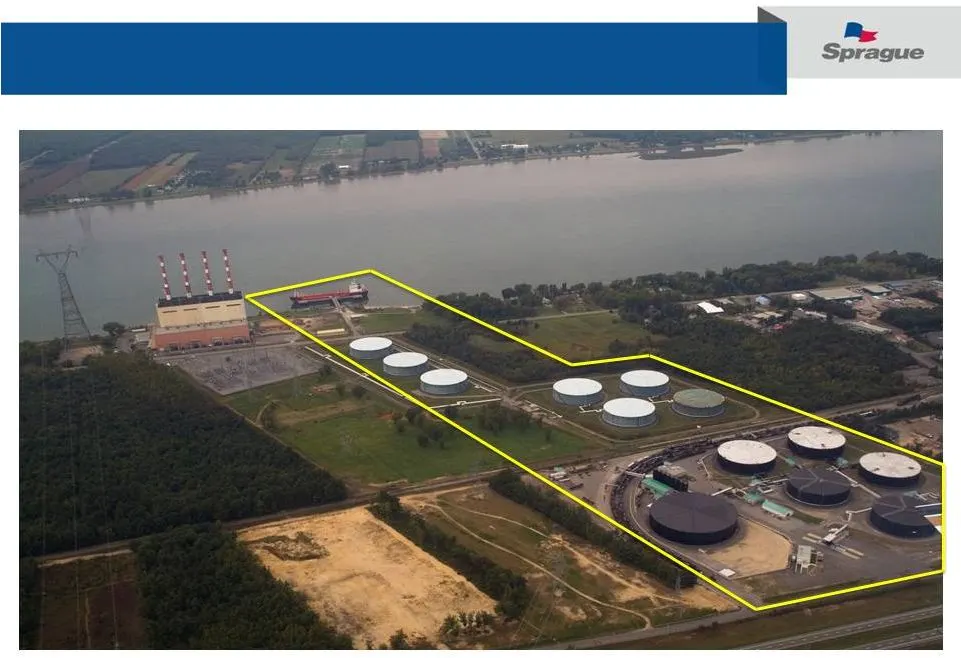
Slide 17: Organic Growth – Kildair Terminal, October 2007
Organic Growth – Sprague’s DNA Kildair Terminal October 2007
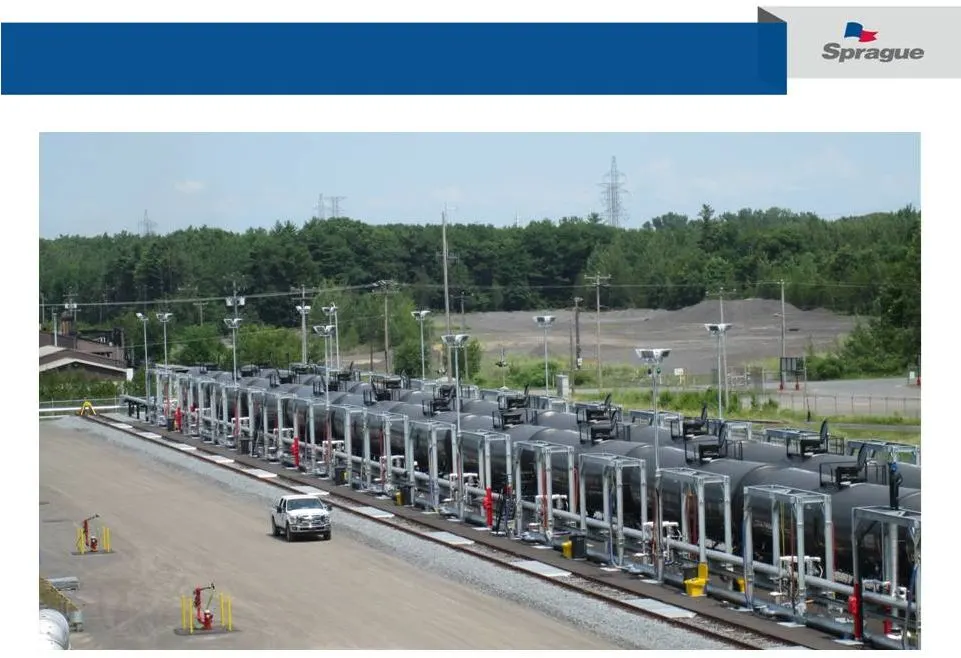
Slide 18: Organic Growth – Kildair Terminal, October 2012
Organic Growth – Sprague’s DNA Kildair Terminal October 2012
Slide 19: Organic Growth – Kildair Terminal, June 2014
Organic Growth – Sprague’s DNA Kildair Terminal June 2014
Slide 20: Visible Return Growth In Recent Acquisitions
Visible Return Growth In Recent Acquisitions • Replacement of 3 rd party supplier • Growth in assigned capacity portfolio and associated optimization • Electricity brokerage platform • Investing expansion capital at terminal • Distillates / Biofuels • Space for Materials Handling growth • Cost-effec
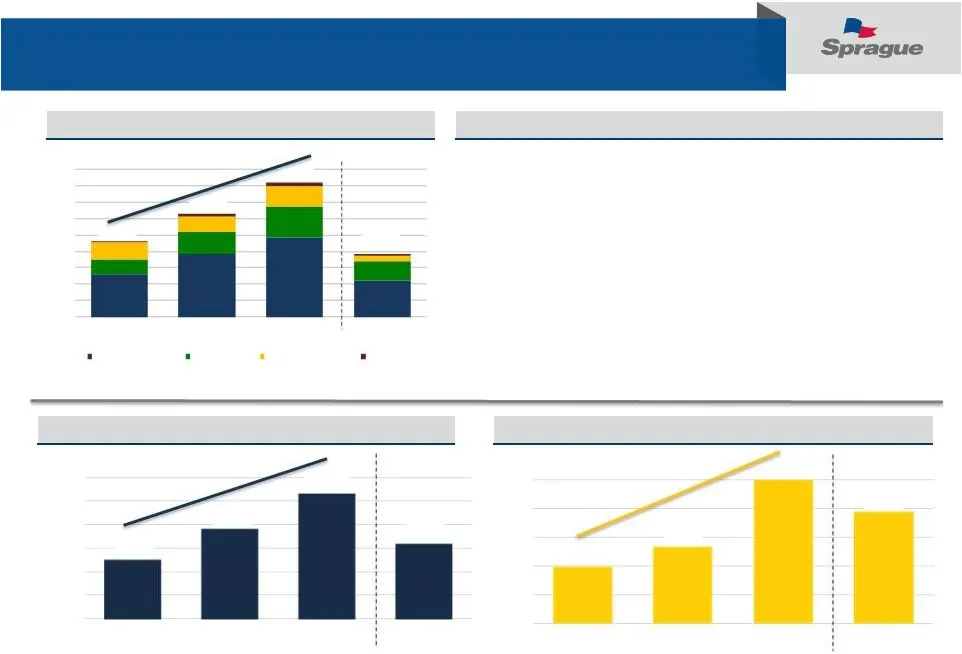
Slide 21: Strong Financial Performance and Growth
Strong Financial Performance and Growth Adjusted EBITDA • Refined Products - 19% increase in heating degree days with colder than normal weather; benefit from recent Castle acquisition; strong margin generation resulting in record quarter • Natural Gas – Uplift from Q4 Metromedia acquisition contrib
Slide 22: Distribution Growth and Coverage
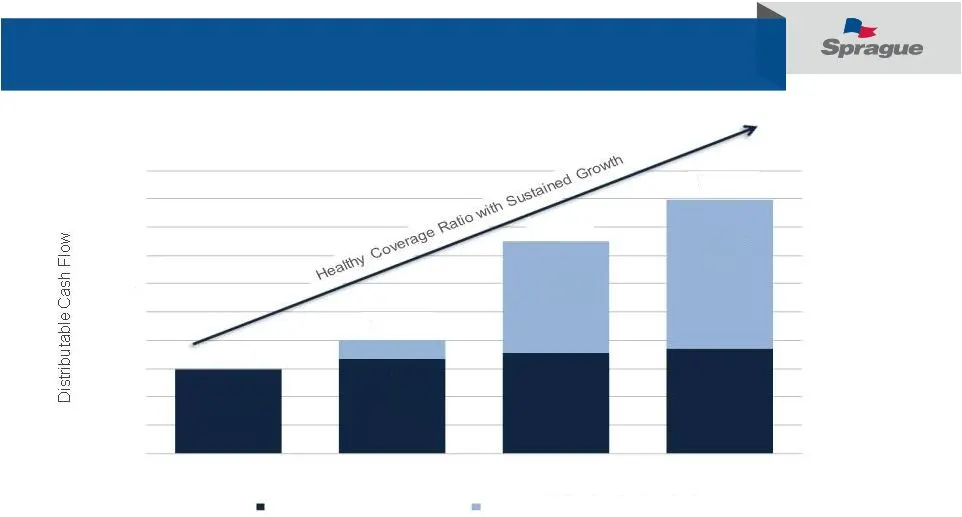
Distribution Growth and Coverage 1.0x 1.2x • Ratable $0.015 per unit distribution growth by quarter planned for the next 12 - 24 months • Strong coverage ratio enables Sprague to “naturally delever” by paying down debt with excess cash flow without the need to access the equity markets $0 $10 $20 $3
Slide 23: Credit Facility, Liquidity and Leverage
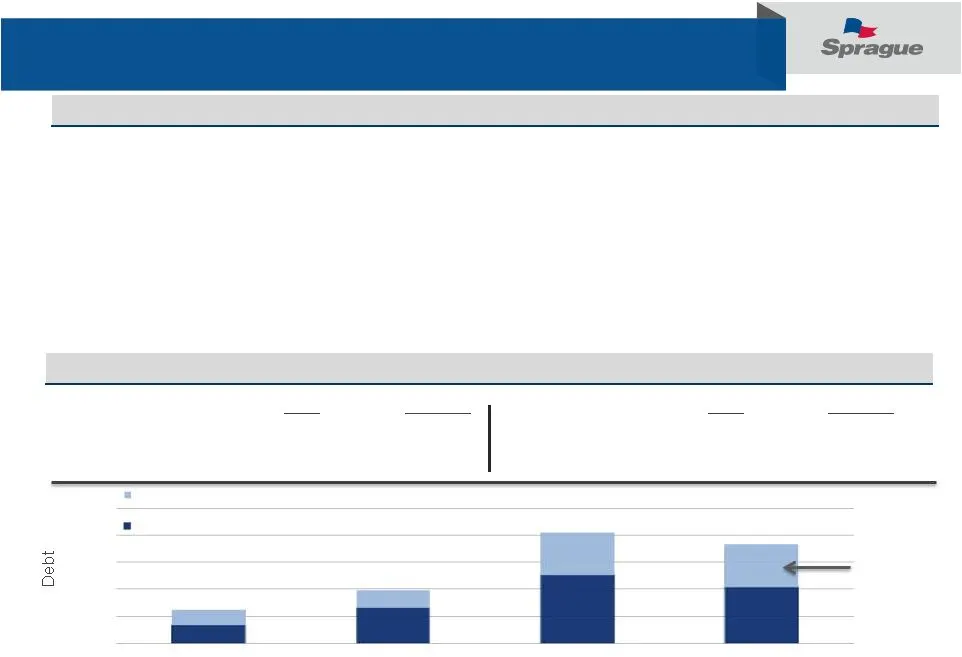
Credit Facility, Liquidity and Leverage 1.3x 1.6x 3.0x 2.7x (in millions) Debt Liquidity Acquisition Facility $312 $88 Accordion $200 • $1.12 billion Working Capital facility (includes $120 million multicurrency Working Capital facility) • $400 million Acquisition facility • Accordions: • Combined W

Slide 24: Guidance
Guidance Full Year 2015 Guidance • Adjusted EBITDA guidance range of $105 to $120 million • Assumes normal weather, market conditions and no acquisitions • Maintenance CapEx range of $7 million to $10 million • Cash Interest expense range of $23 million to $26 million • Distribution growth of $0.015
Slide 25: Key Investment Considerations
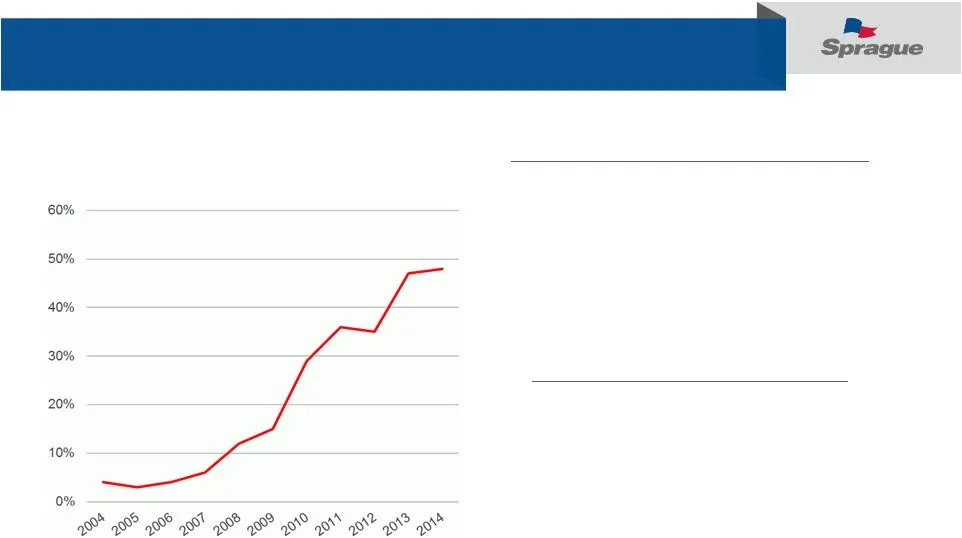
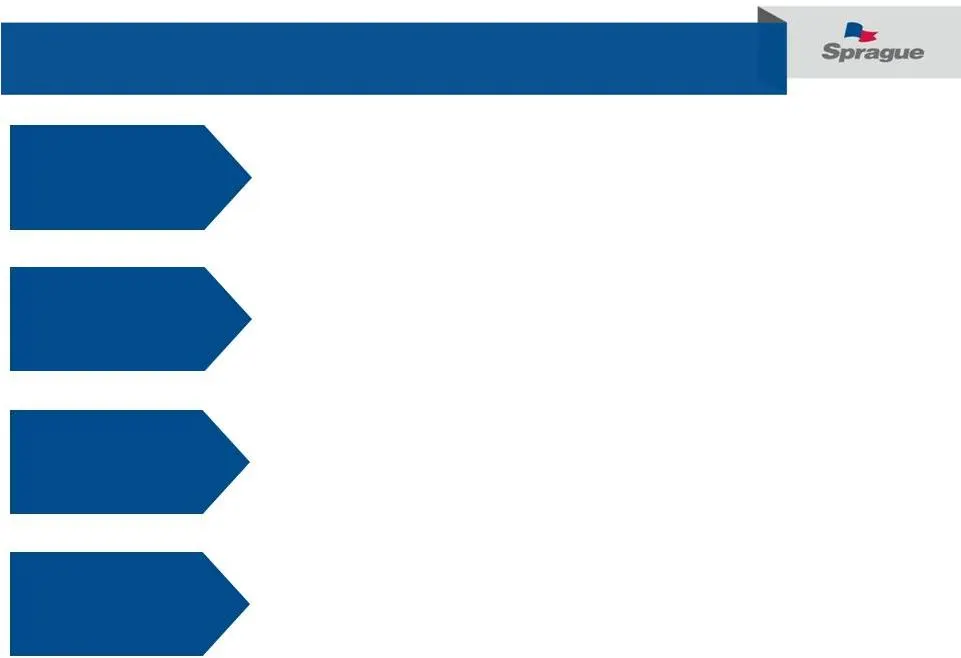
Key Investment Considerations Terminaling, Logistics and Marketing Expertise Contract-Based Income with Upside Potential Strong Capital Position Visible Growth Prospects Materials Handling is 100% fee-based, multi-year contracts More than 50% of Refined Product sales are under contract Natural Gas c
Slide 26: Appendix
Appendix
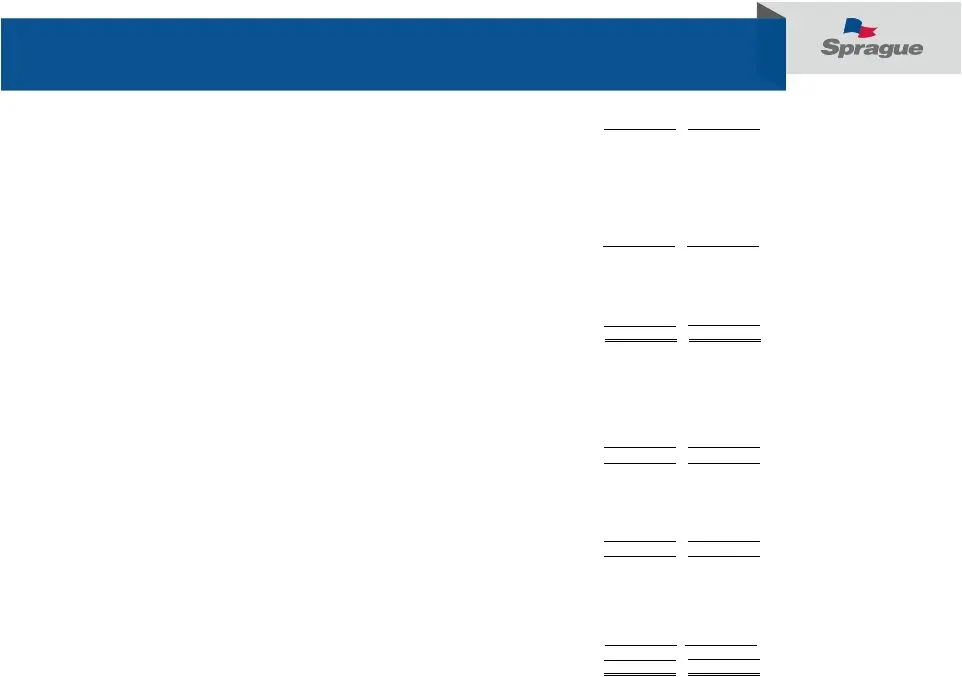
Slide 27: Condensed Consolidated Balance Sheet
Condensed Consolidated Balance Sheet March 31, December 31, (Unaudited) Assets Current assets: Cash and cash equivalents……………………………………………………. $ 21,609 $ 4,080 Accounts receivable, net……………………………………………………… 342,174 289,424 Inventories……………………………………………………………………. 217,912 390,555 Fair value of derivative
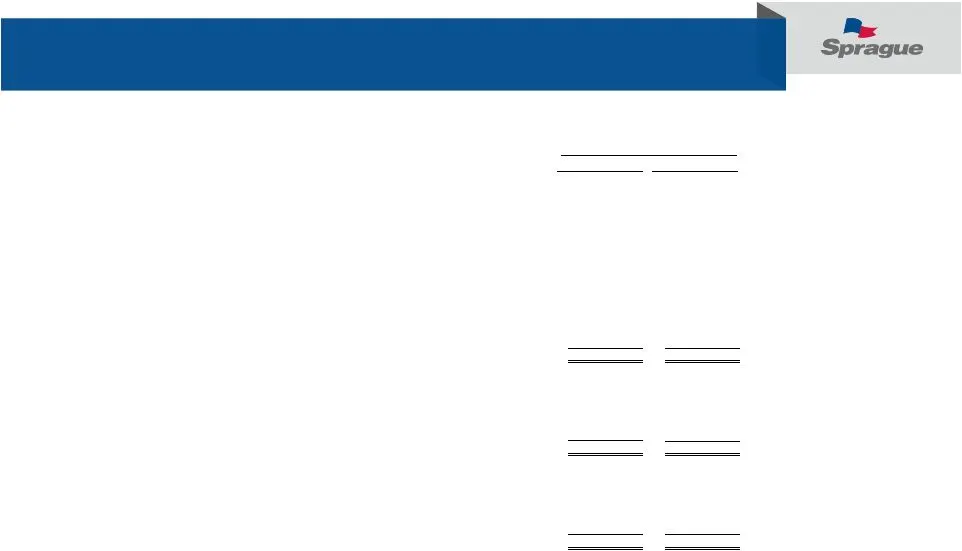
Slide 28: Adjusted Gross Margin by Segment – Q1 2015
Adjusted Gross Margin by Segment – Q1 2015 Three Months Ended March 31, (unaudited) (unaudited) ($ and volumes in thousands) Volumes: Refined products (gallons) 726,432 588,756 Natural gas (MMBtus) …...……………………………………………………………………………..…………… 20,013 16,496 Materials handling (short tons)…………………………………………
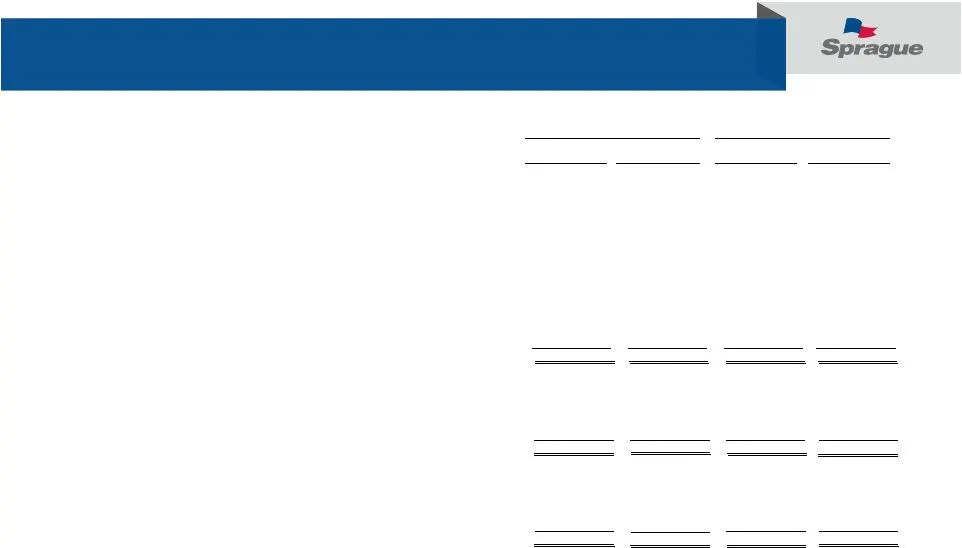
Slide 29: Adjusted Gross Margin by Segment – YE 2014
Adjusted Gross Margin by Segment – YE 2014 (1) Three Months Ended Year Ended December 31, December 31, Predecessor Predecessor (unaudited) (unaudited) ($ and volumes in thousands) ($ and volumes in thousands) Volumes: Refined products (gallons) 475,398 399,462 1,668,240 1,472,100 Natural gas (MMBtus
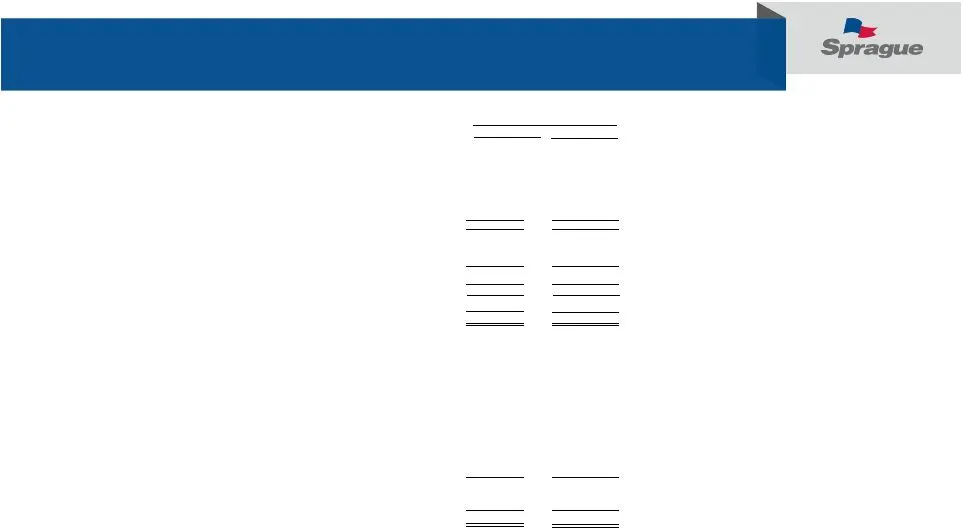
Slide 30: Summary Financial Data – Q1 2015
Summary Financial Data – Q1 2015 Statement of Operations Data: Net sales $ 1,598,358 $ 1,994,699 Operating costs and expenses: Cost of products sold (exclusive of depreciation and amortization) 1,490,373 1,864,419 Operating expenses 18,883 16,838 Selling, general and administrative 32,381 27,411 Dep
Slide 31: Summary Financial Data – YE 2014
Summary Financial Data – YE 2014 (1) 1) On December 9, 2014, the Partnership acquired all of the equity interests in Kildair through the acquisition of the equity interests of Kildair’s parent Sprague Canadian Properties LLC. As the acquisition of Kildair by the Partnership represents a transfer of
Slide 32: Adjusted EBITDA to DCF Reconciliation – Q1 2015
Adjusted EBITDA to DCF Reconciliation – Q1 2015 ($ in thousands) Reconciliation of adjusted EBITDA to distributable cash flow: Adjusted EBITDA $ 63,540 $ 52,038 Add/(Deduct): Cash interest expense, net .............................................................. Cash taxes ........................
Slide 33: Adjusted EBITDA to DCF Reconciliation – YE 2014
Adjusted EBITDA to DCF Reconciliation – YE 2014 (1) ......................................................................................................... 1) On December 9, 2014, the Partnership acquired all of the equity interests in Kildair through the acquisition of the equity interests of Kil
Source: SEC EDGAR · 8-K filed May 20, 2015
More decks from Sprague Resources LP
 MLP and Energy Infrastructure Conference 201916 slides · May 13, 2019
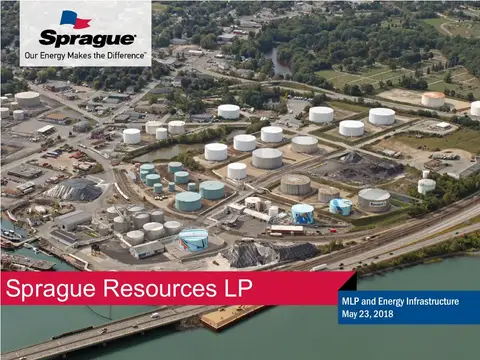 Conference Presentation (May 2018)16 slides · May 18, 2018
 Q1 2018 Earnings Presentation37 slides · May 8, 2018
 Q4 2017 Earnings Presentation46 slides · Mar 15, 2018
 Q3 2017 Earnings Presentation47 slides · Nov 7, 2017
 Merger or Acquisition (September 2017)5 slides · Sep 19, 2017