Layne Christensen — Gabelli & Co. Best Ideas Conference 2012
30 slides from Layne Christensen's conference presentation, Dec 12, 2012
Slide 1: Gabelli & Co. Best Ideas Conference December 13, 2012
Gabelli & Co. Best Ideas Conference December 13, 2012
Slide 2: Safe Harbor
Safe Harbor This presentation may contain forward-looking statements within the meaning of Section 27A of the Securities Act of 1933 and Section 21E of the Exchange Act of 1934. Such statements may include, but are not limited to, statements of plans and objectives, statements of future economic per
Slide 3: A Market Leader in the U.S. and Around the World
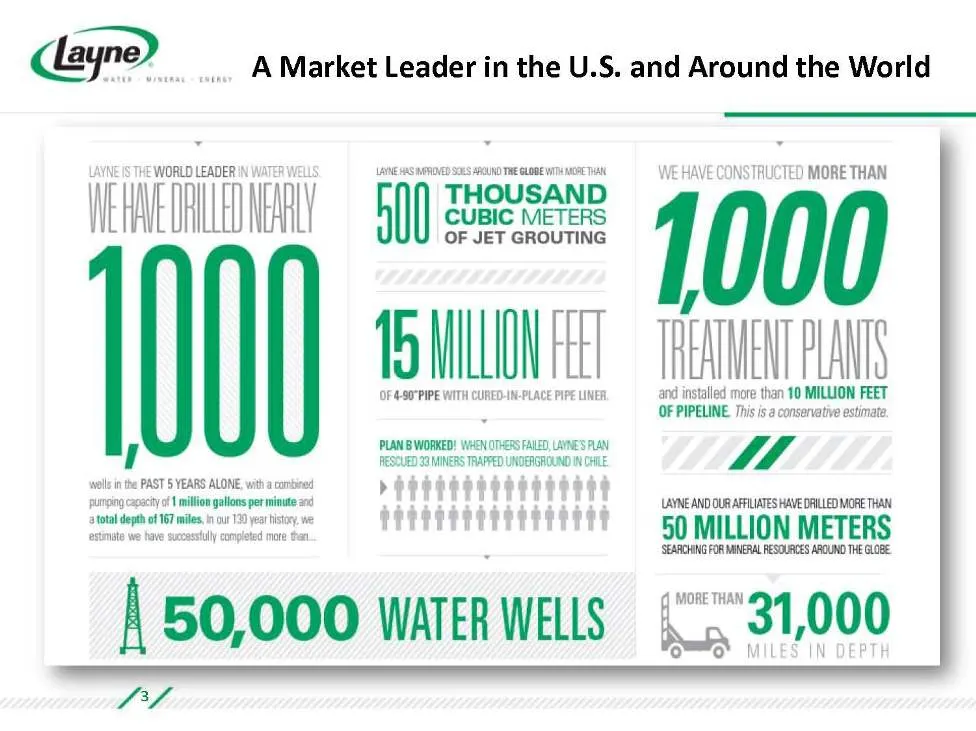
A Market Leader in the U.S. and Around the World
Slide 4: A Market Leader in the U.S. and Around the World
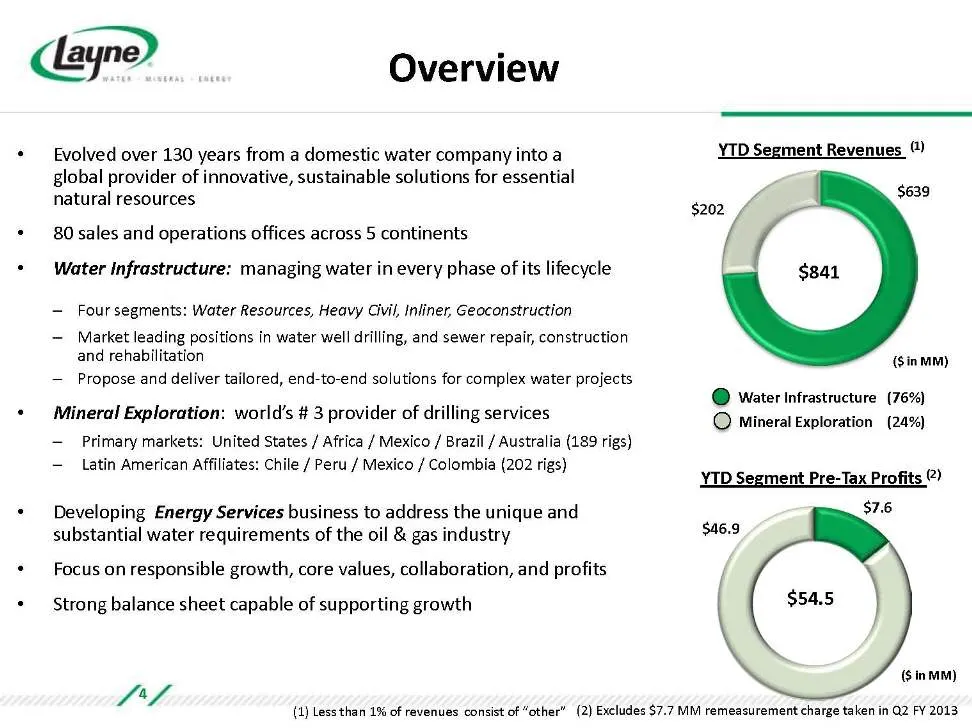
A Market Leader in the U.S. and Around the World YTD Segment Revenues (1) Water Infrastructure (76%) Mineral Exploration (24%) YTD Segment Pre-Tax Profits (2) (1) Less than 1% of revenues consist of “other” $639 $202 $54.5 (2) Excludes $7.7 MM remeasurement charge taken in Q2 FY 2013 ($ in MM)
Slide 5: FY 2013 Financial Overview
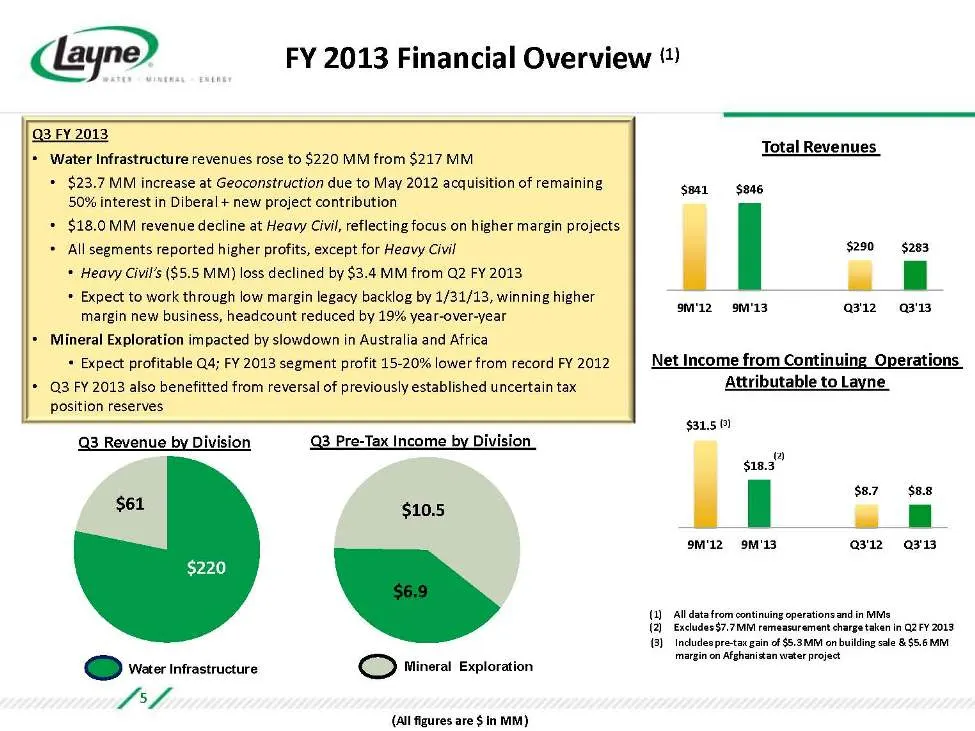
FY 2013 Financial Overview (1) $841 $846 $290 $283 9M'129M'13Q3'12Q3'13$10.5 $6.9 Q3 Revenue by Division Q3 Pre-Tax Income by Division 5 Total Revenues Net Income from Continuing Operations Attributable to Layne Water Infrastructure Mineral Exploration Q3 FY 2013 •Water Infrastructure revenues rose
Slide 6: FY 2013 Financial Overview
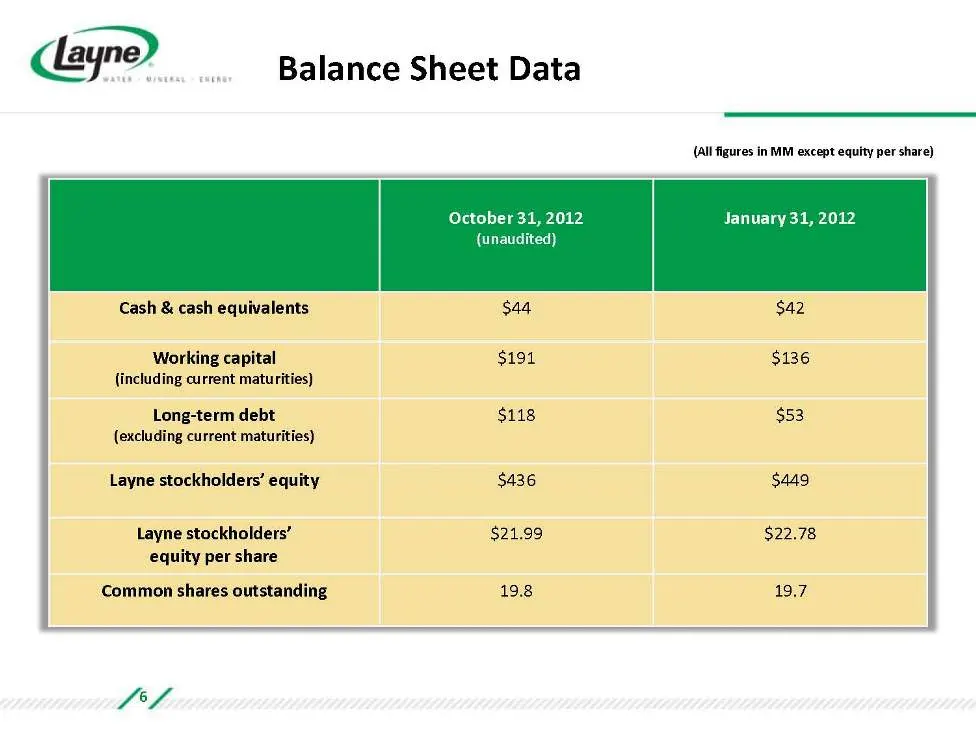
FY 2013 Financial Overview (1) $841 $846 $290 $283 9M'129M'13Q3'12Q3'13$10.5 $6.9 Q3 Revenue by Division Q3 Pre-Tax Income by Division 5 Total Revenues Net Income from Continuing Operations Attributable to Layne Water Infrastructure Mineral Exploration Q3 FY 2013 •Water Infrastructure revenues rose
Slide 7: One Layne Initiative
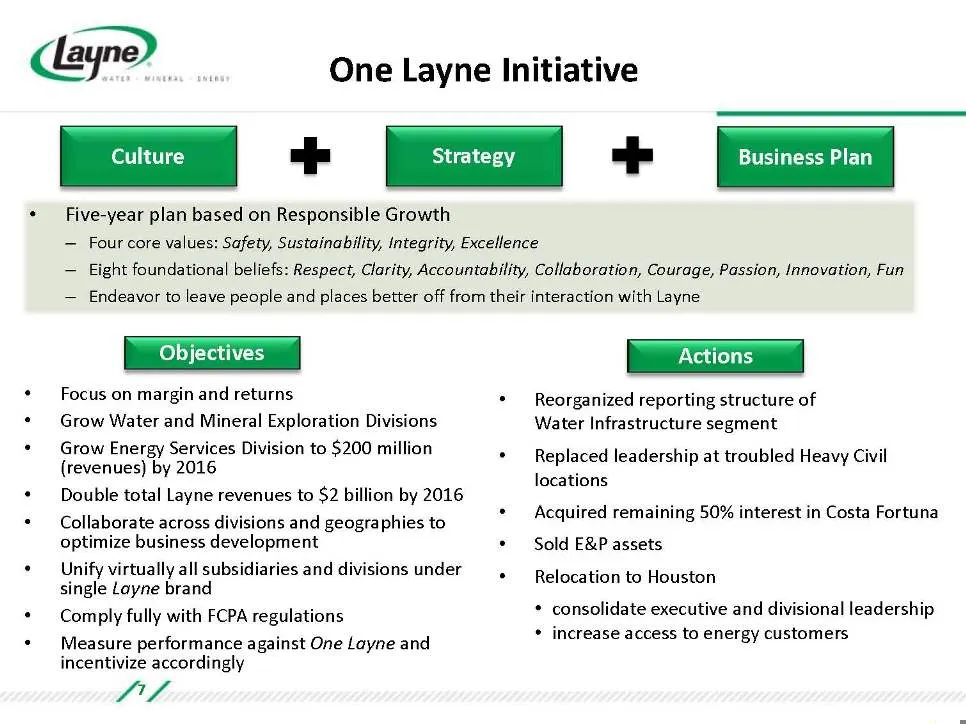
One Layne Initiative 7 Culture •Five-year plan based on Responsible Growth –Four core values: Safety, Sustainability, Integrity, Excellence –Eight foundational beliefs: Respect, Clarity, Accountability, Collaboration, Courage, Passion, Innovation, Fun –Endeavor to leave people and places better off
Slide 8: One Layne: Collaboration
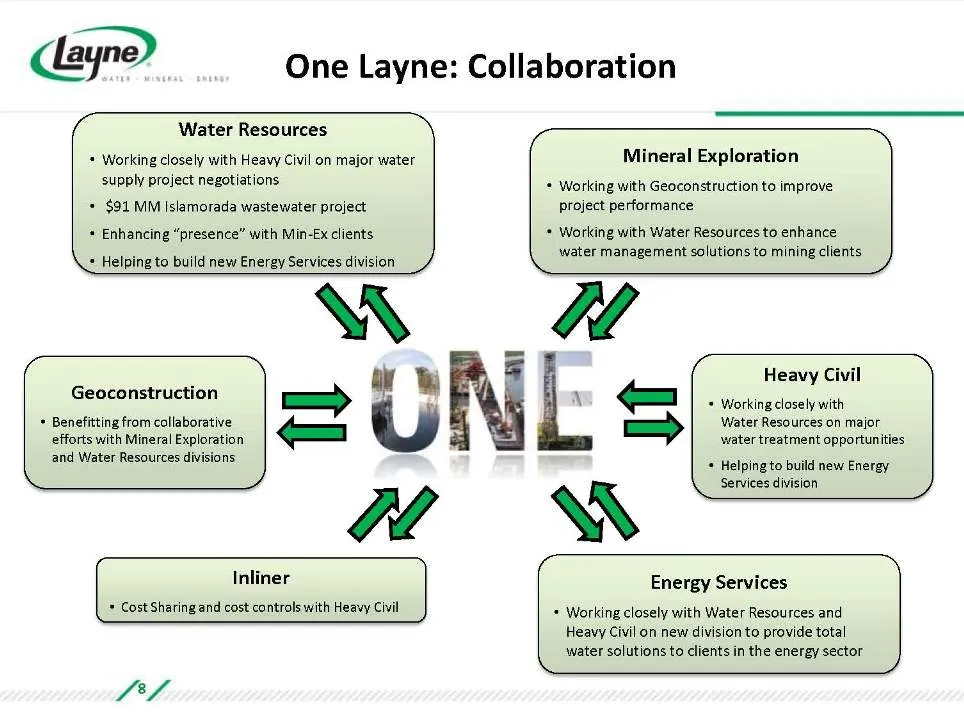
One Layne: Collaboration Water Resources •Working closely with Heavy Civil on major water supply project negotiations • $91 MM Islamorada wastewater project •Enhancing “presence” with Min-Ex clients •Helping to build new Energy Services division Inliner •Cost Sharing and cost controls with Heavy Civ
Slide 9: Water Infrastructure Solutions: Manage Every Phase of the Water Cycle
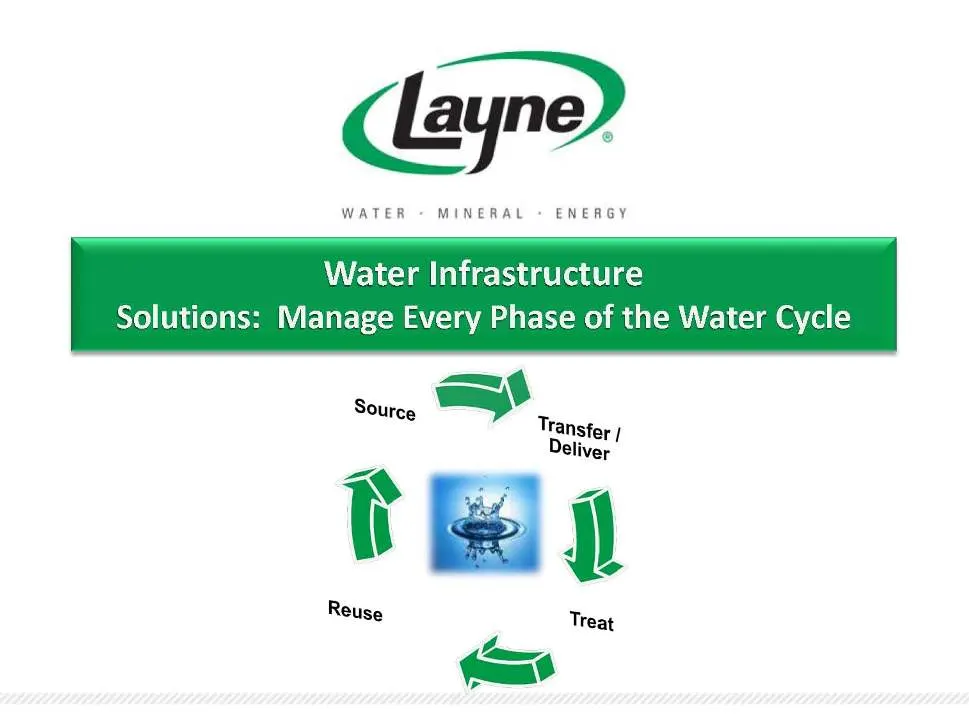
Water Infrastructure Solutions: Manage Every Phase of the Water Cycle
Slide 10: Current State of the Water Environment
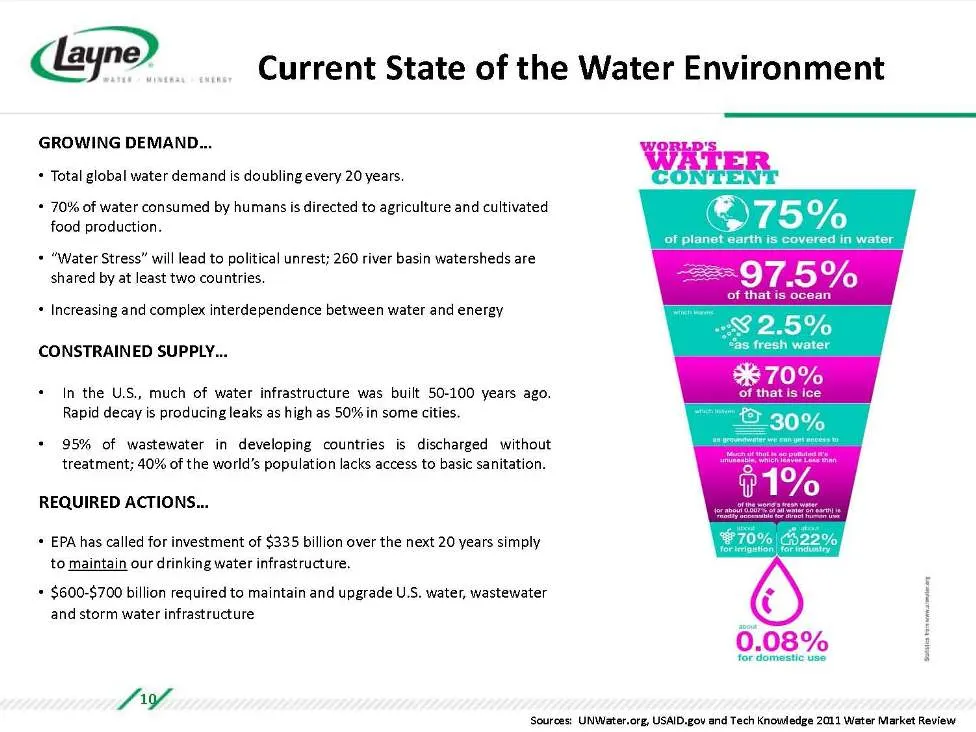
Current State of the Water Environment GROWING DEMAND… •Total global water demand is doubling every 20 years. •70% of water consumed by humans is directed to agriculture and cultivated food production. •“Water Stress” will lead to political unrest; 260 river basin watersheds are shared by at least t
Slide 11: Long-Term Water Infrastructure Investment
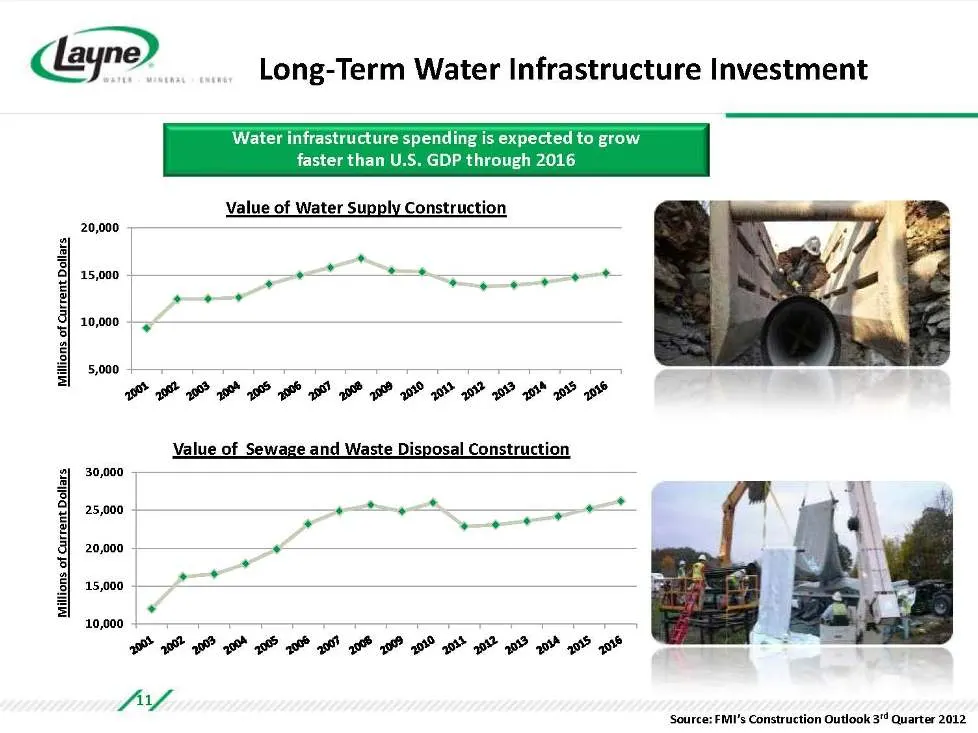
Long-Term Water Infrastructure Investment Source: FMI’s Construction Outlook 3rd Quarter 2012 Water infrastructure spending is expected to grow faster than U.S. GDP through 2016 5,00010,00015,00020,000Value of Water Supply Construction Millions of Current Dollars 10,00015,00020,00025,00030,000Value
Slide 12: Water Infrastructure
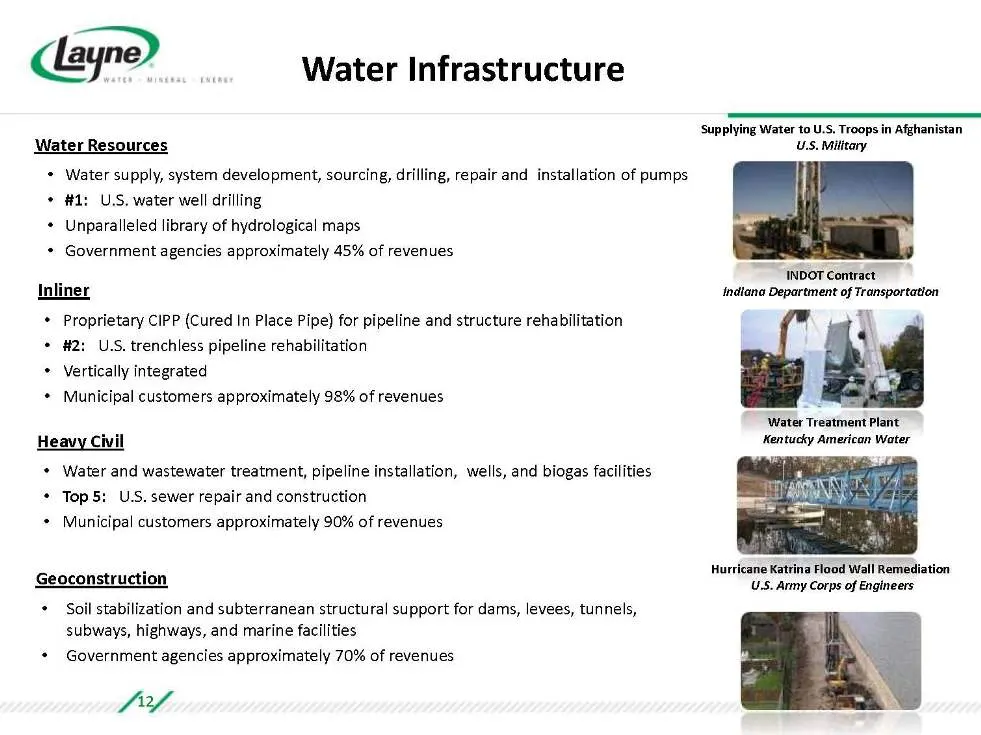
Water Infrastructure Water Resources •Water supply, system development, sourcing, drilling, repair and installation of pumps •#1: U.S. water well drilling •Unparalleled library of hydrological maps •Government agencies approximately 45% of revenues Geoconstruction •Soil stabilization and subterranea
Slide 13: Water Infrastructure
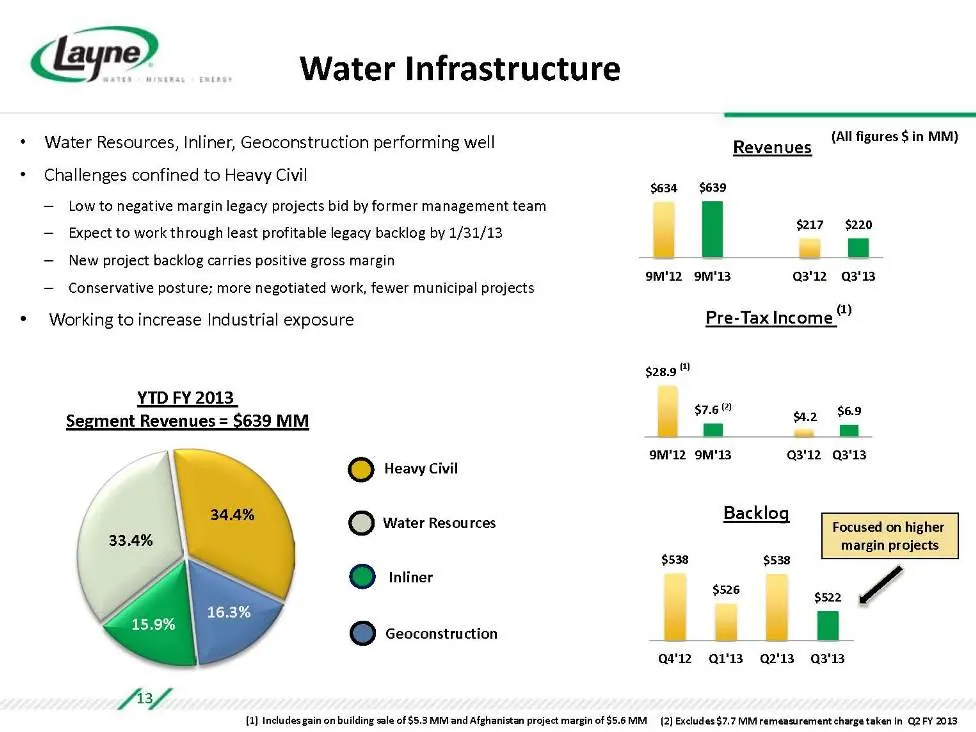
Water Infrastructure $634 $639 $217 $220 9M'129M'13Q3'12Q3'13Revenues Pre-Tax Income (1) Backlog $28.9 (1) $7.6 (2) $4.2 $6.9 9M'129M'13Q3'12Q3'13$538 $526 $538 $522 Q4'12Q1'13Q2'13Q3'13(2) Excludes $7.7 MM remeasurement charge taken in Q2 FY 2013 (All figures $ in MM) Focused on higher margin proje
Slide 14: Water Infrastructure revenue by division
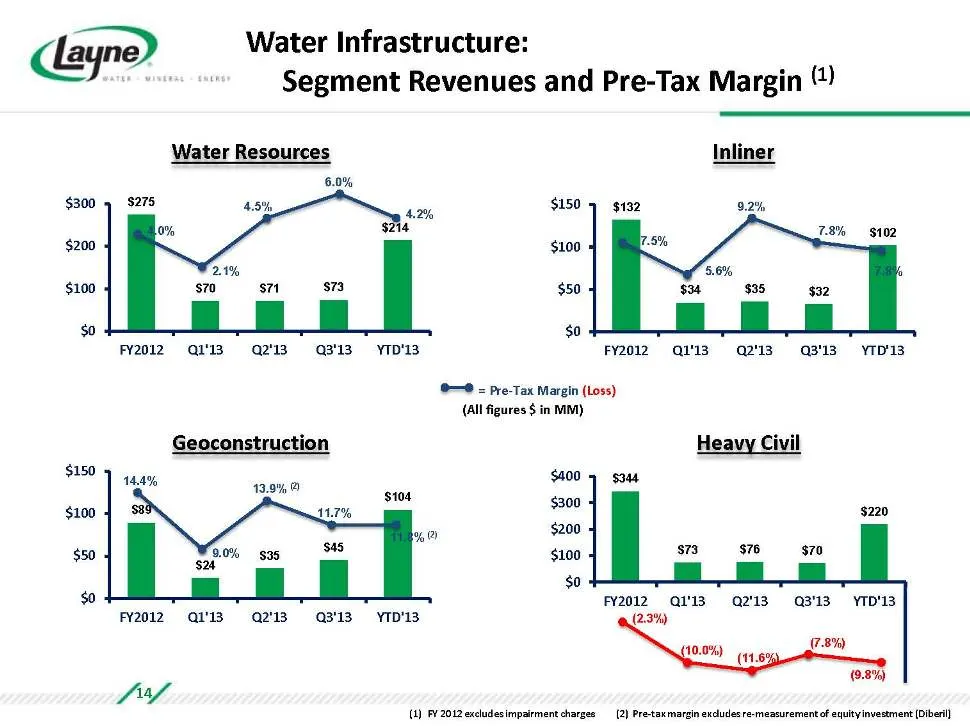
$0$50$100$150FY2012Q1'13Q2'13Q3'13YTD'137.8% Water Resources Heavy Civil Inliner Geoconstruction $344 $73 $76 $70 $220 $0$100$200$300$400FY2012Q1'13Q2'13Q3'13YTD'13$89 $24 $35 $45 $104 $0$50$100$150FY2012Q1'13Q2'13Q3'13YTD'13$275 $70 $71 $73 $214 $0$100$200$300FY2012Q1'13Q2'13Q3'13YTD'13 Water
Slide 15: Water Infrastructure Outlook
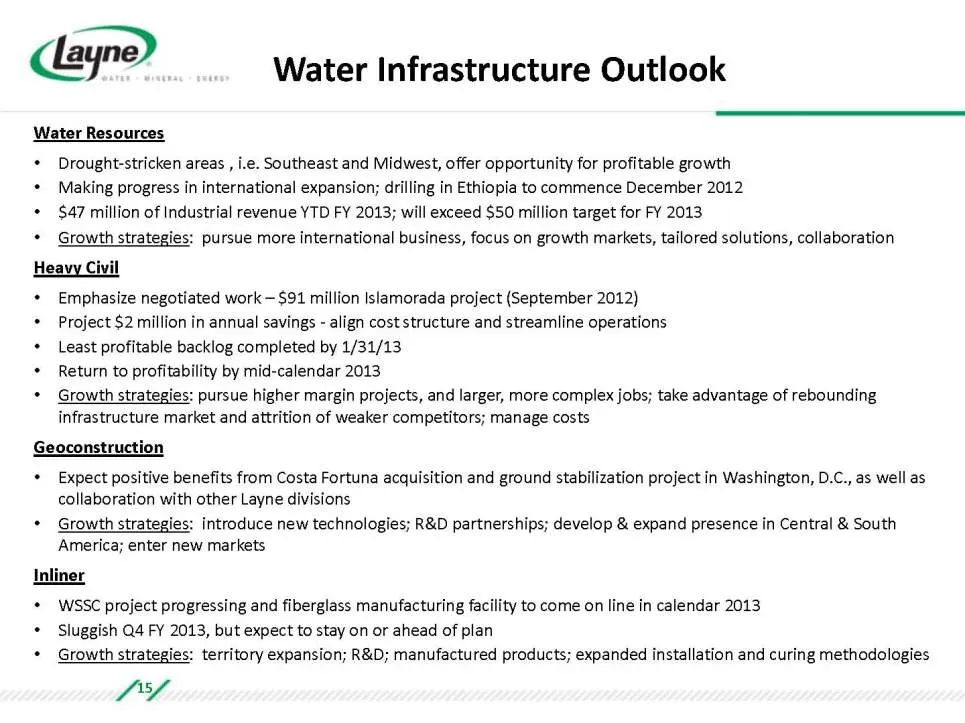
Water Infrastructure Outlook Water Resources •Drought-stricken areas , i.e. Southeast and Midwest, offer opportunity for profitable growth •Making progress in international expansion; drilling in Ethiopia to commence December 2012 •$47 million of Industrial revenue YTD FY 2013; will exceed $50 milli
Slide 16: Mineral Exploration
Mineral Exploration Full Spectrum Mineral Exploration Drilling Services
Slide 17: Mineral Exploration
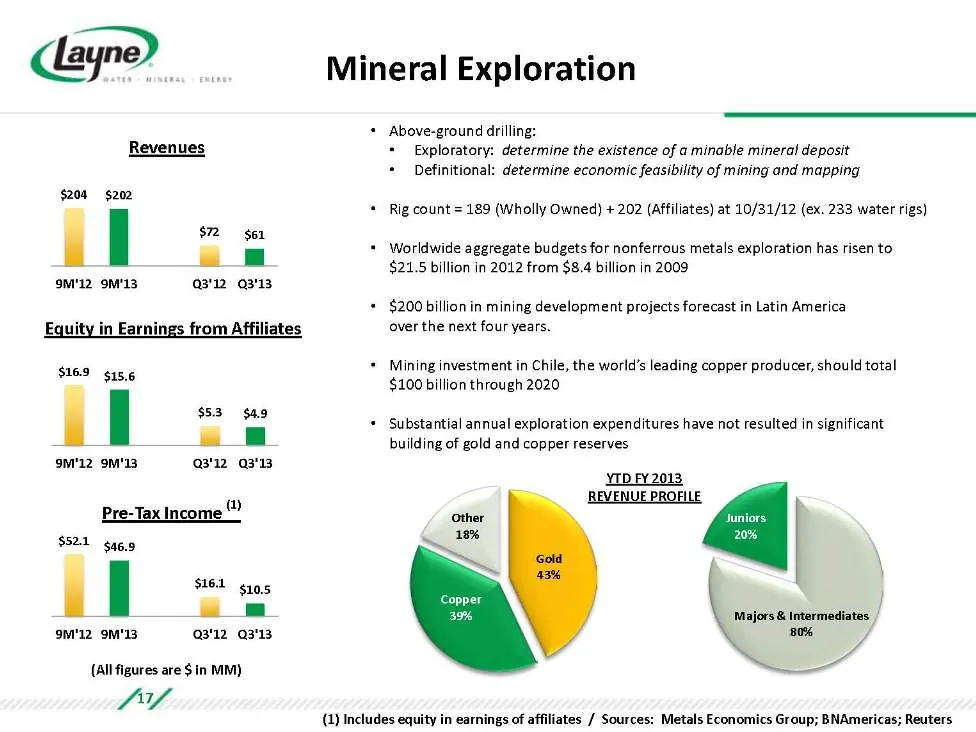
Mineral Exploration $204 $202 $72 $61 9M'129M'13Q3'12Q3'13Revenues Equity in Earnings from Affiliates Pre-Tax Income (1) $16.9 $15.6 $5.3 $4.9 9M'129M'13Q3'12Q3'13$52.1 $46.9 $16.1 $10.5 9M'129M'13Q3'12Q3'13(1) Includes equity in earnings of affiliates / Sources: Metals Economics Group; BNAmericas;
Slide 18: Serving Growing Markets
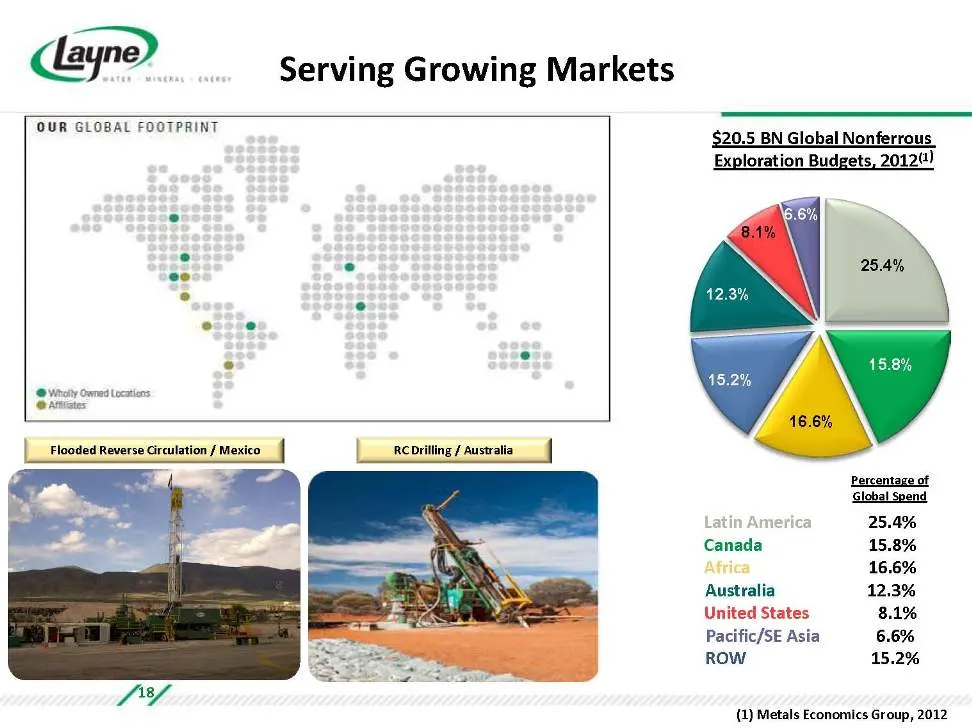
Serving Growing Markets Latin America 25.4% Canada 15.8% Africa 16.6% Australia 12.3% United States 8.1% Pacific/SE Asia 6.6% ROW 15.2% 18 (1) Metals Economics Group, 2012 $20.5 BN Global Nonferrous Exploration Budgets, 2012(1) Flooded Reverse Circulation / Mexico RC Drilling / Australia
Slide 19: Mineral Exploration Growth Strategies
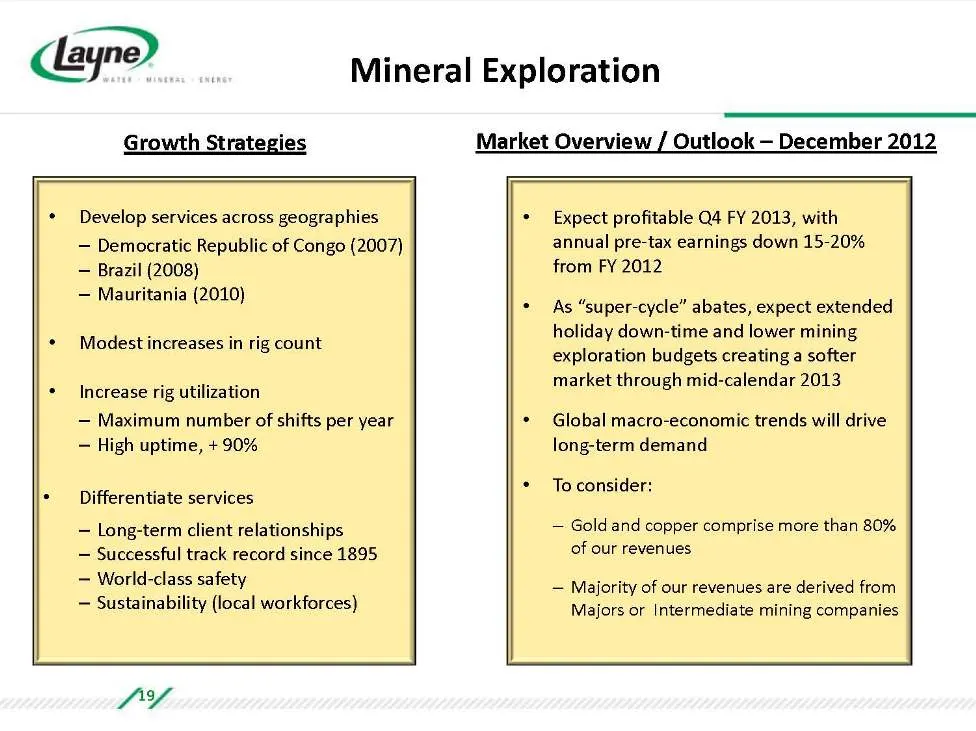
Mineral Exploration Growth Strategies •Expect profitable Q4 FY 2013, with annual pre-tax earnings down 15-20% from FY 2012 •As “super-cycle” abates, expect extended holiday down-time and lower mining exploration budgets creating a softer market through mid-calendar 2013 •Global macro-economic trends
Slide 20: Energy: An Evolving Focus
WATER » MINERAL - ENERGY Energy An Evolving Focus
Slide 21: Fracking: Accessing Domestic Energy Reserves
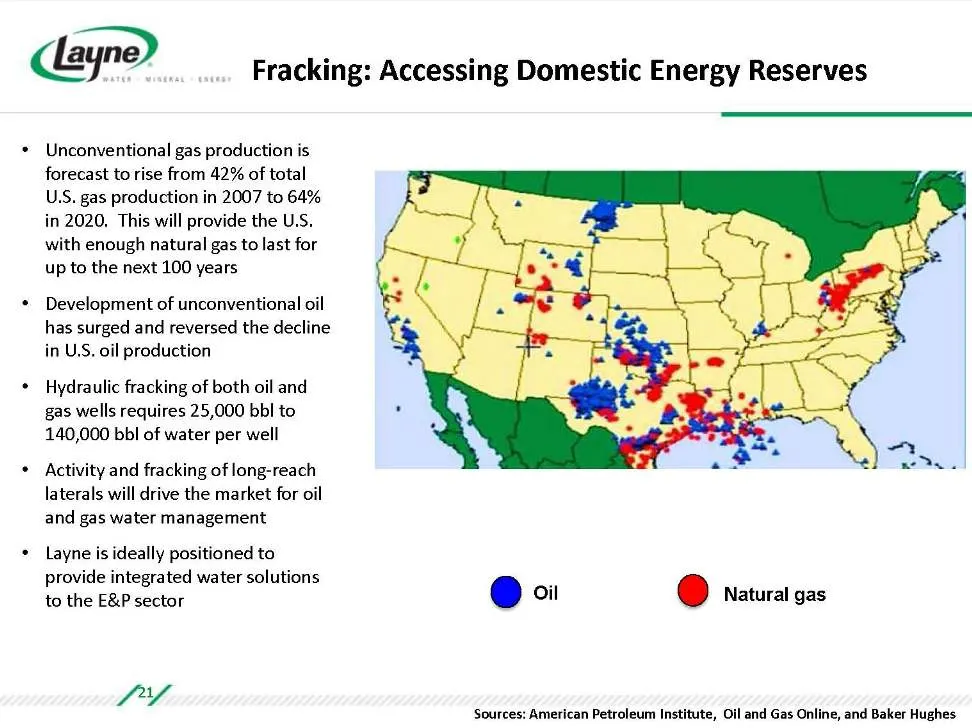
Unconventional gas production is forecast to rise from 42% of total U.S. gas production in 2007 to 64% in 2020. This will provide the U.S. with enough natural gas to last for up to the next 100 years •Development of unconventional oil has surged and reversed the decline in U.S. oil production •Hydra
Slide 22: Responsible Water Management Solutions for the E&P Industry
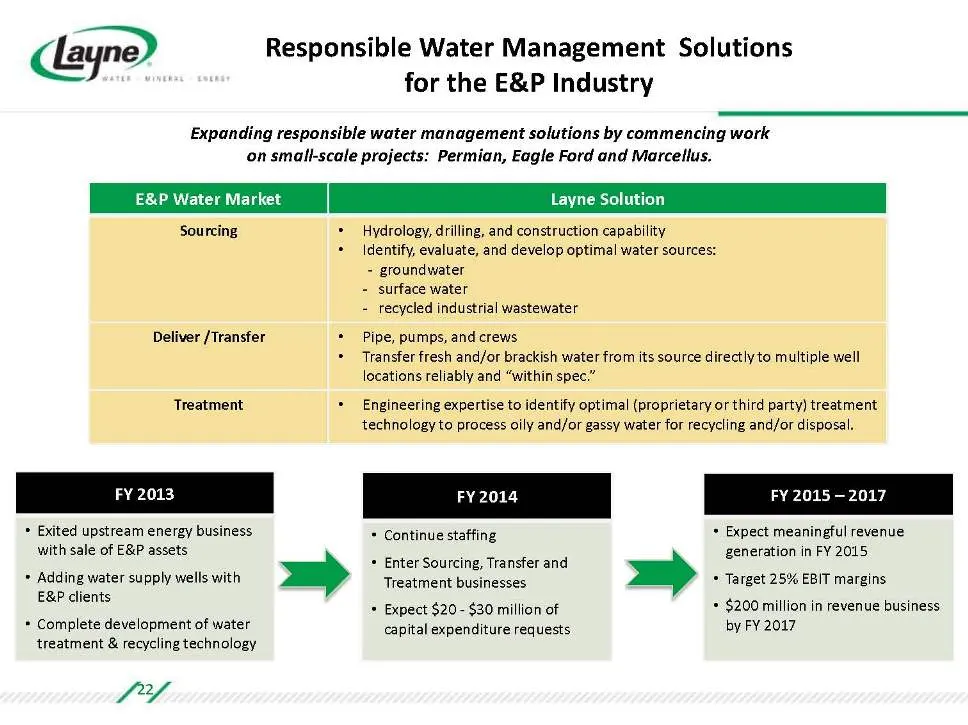
Responsible Water Management Solutions for the E&P Industry 22 E&P Water Market Layne Solution Sourcing •Hydrology, drilling, and construction capability •Identify, evaluate, and develop optimal water sources: - groundwater - surface water - recycled industrial wastewater Deliver /Transfer •Pipe, pu
Slide 23: Contact Us
Contact Us Jerry Fanska, SVP-Finance 913.677.6858 [email protected] www.layne.com Devin Sullivan, SVP 212.836.9608 [email protected] www.theequitygroup.com AT THE COMPANY: INVESTOR RELATIONS:
Slide 24: Appendix
WATER - MINERAL - ENERGY Appendix
Slide 25: Acquisition of Remaining Interest in Costa Fortuna
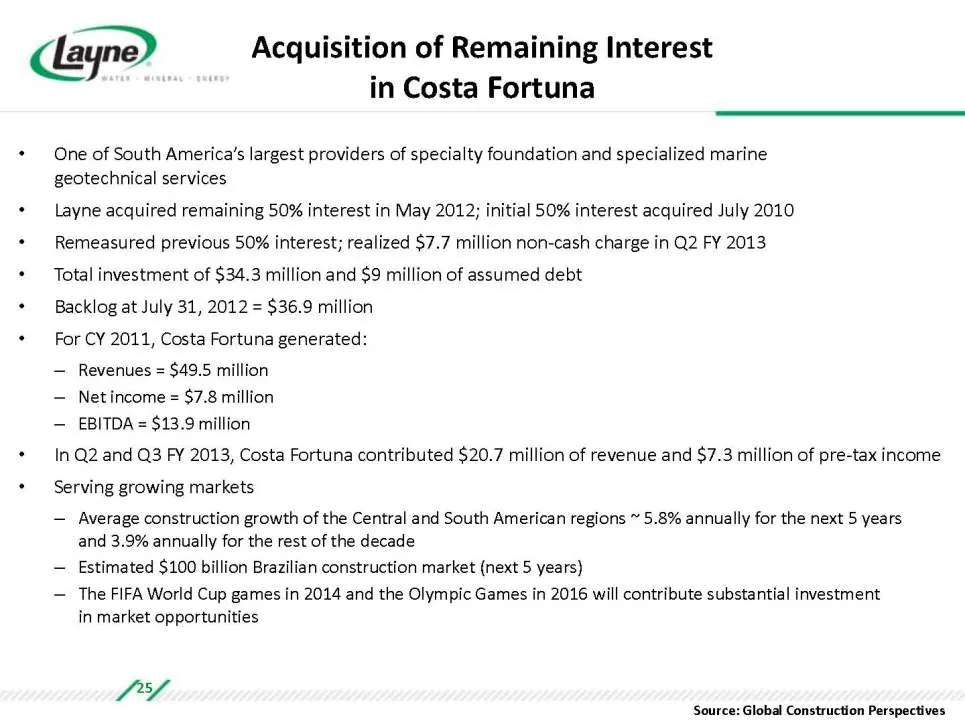
Acquisition of Remaining Interest in Costa Fortuna •One of South America’s largest providers of specialty foundation and specialized marine geotechnical services •Layne acquired remaining 50% interest in May 2012; initial 50% interest acquired July 2010 •Remeasured previous 50% interest; realized $7
Slide 26: Layne Consolidated Revenue and EBIT Bridges
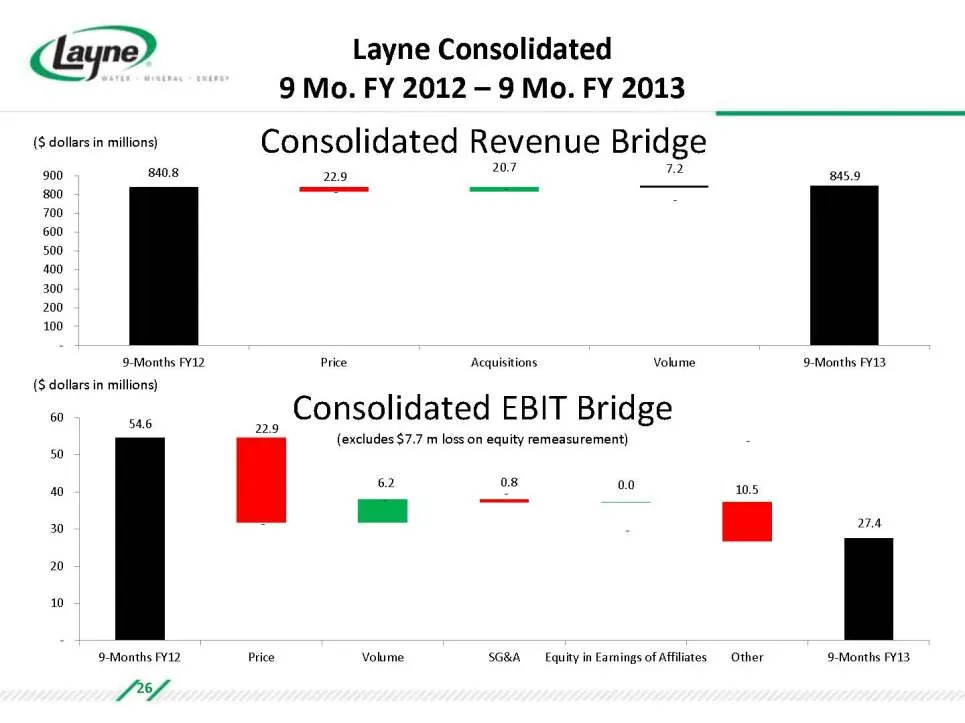
Layne Consolidated 9 Mo. FY 2012 – 9 Mo. FY 2013 840.8 - 20.7 7.2 845.9 22.9 - - - 100 200 300 400 500 600 700 800 9009-Months FY12PriceAcquisitionsVolume9-Months FY13Consolidated Revenue Bridge ($ dollars in millions) 54.6 - 6.2 - 0.0 - 27.4 22.9 - 0.8 - 10.5 - 10 20 30 40 50 609-Months FY12PriceVo
Slide 27: Water Infrastructure Revenue and EBIT Bridges
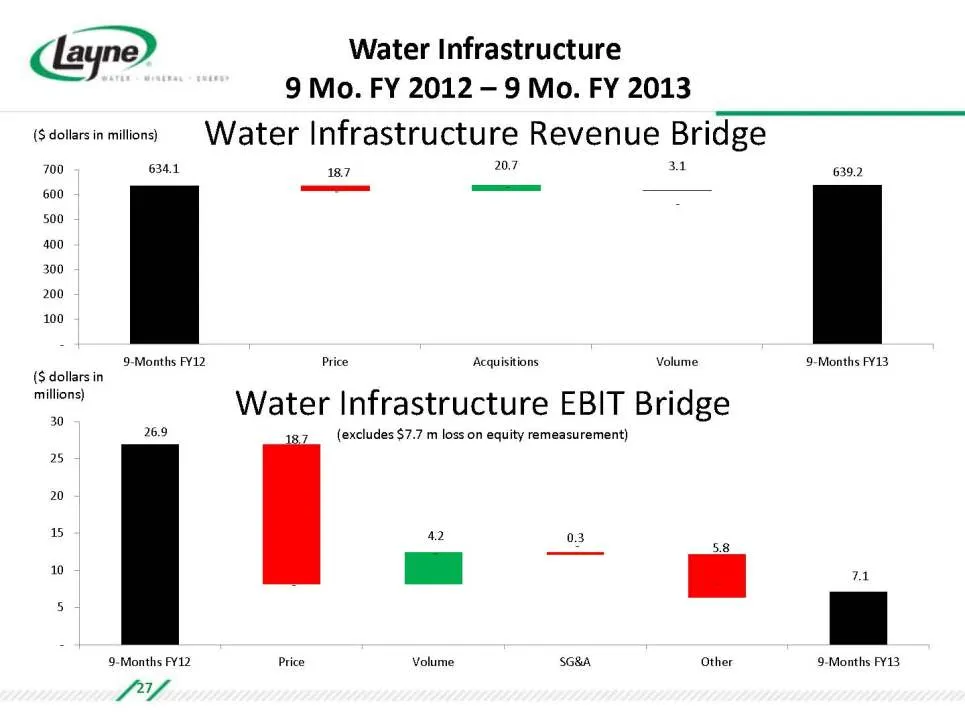
Water Infrastructure 9 Mo. FY 2012 – 9 Mo. FY 2013 634.1 - 20.7 3.1 639.2 18.7 - - - 100 200 300 400 500 600 7009-Months FY12PriceAcquisitionsVolume9-Months FY13Water Infrastructure Revenue Bridge ($ dollars in millions) 26.9 - 4.2 - - 7.1 18.7 - 0.3 5.8 - 5 10 15 20 25 309-Months FY12PriceVolumeSG&
Slide 28: Mineral Exploration Revenue and EBIT Bridges
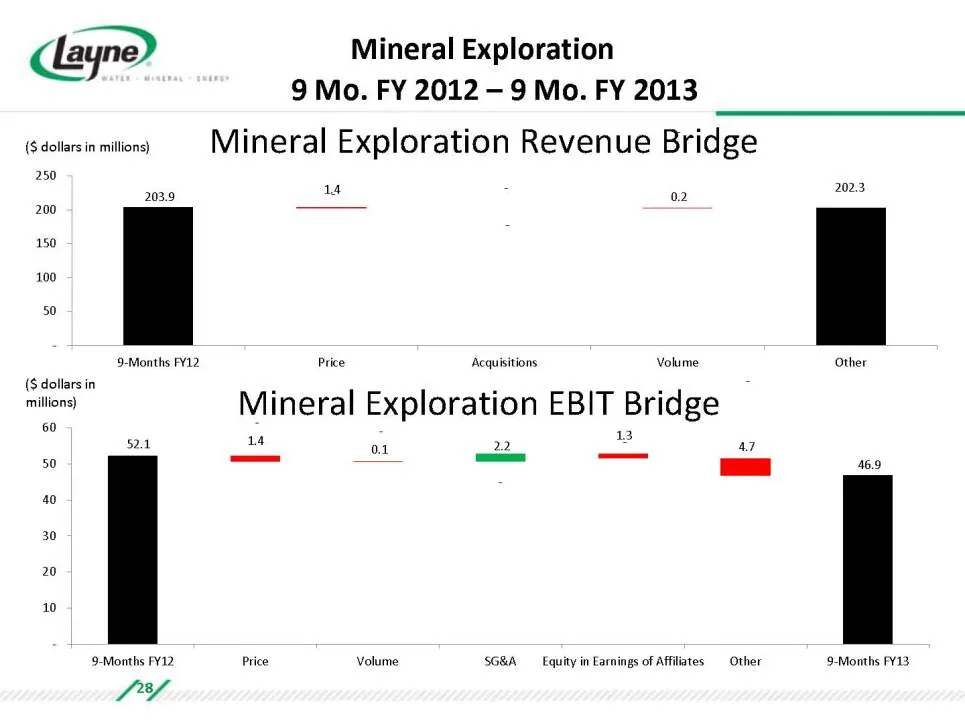
Mineral Exploration 9 Mo. FY 2012 – 9 Mo. FY 2013 203.9 - - - 202.3 1.4 - 0.2 - 50 100 150 200 2509-Months FY12PriceAcquisitionsVolumeOtherMineral Exploration Revenue Bridge ($ dollars in millions) 52.1 - - 2.2 - - 46.9 1.4 0.1 - 1.3 4.7 - 10 20 30 40 50 609-Months FY12PriceVolumeSG&AEquity in Earni
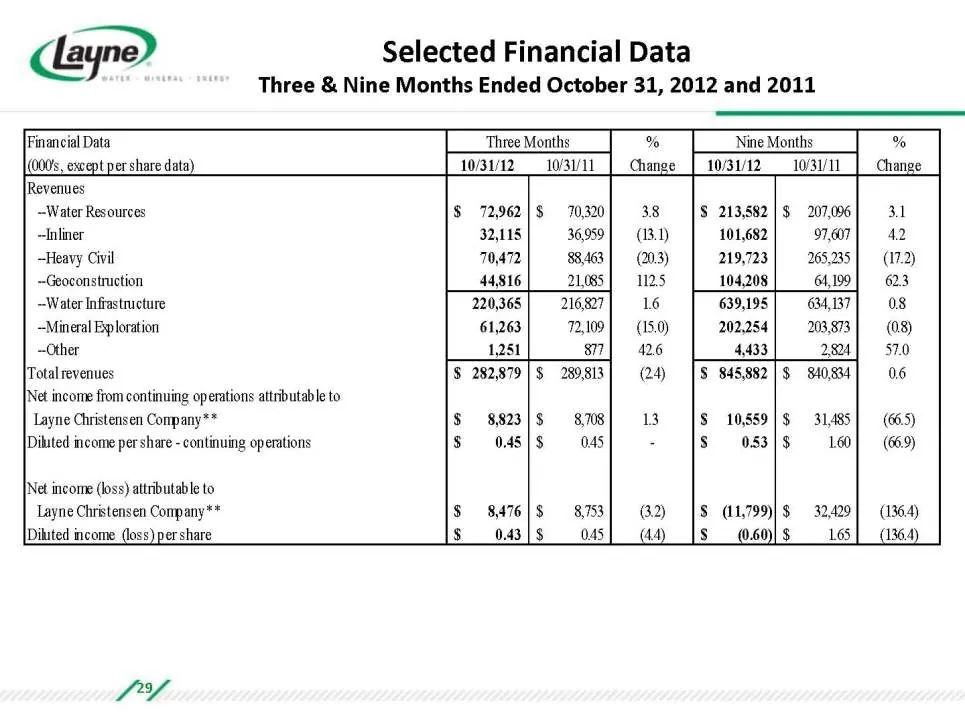
Slide 29: Selected Financial Data
Selected Financial Data Three & Nine Months Ended October 31, 2012 and 2011 29 Financial Data%%(000's, except per share data)10/31/1210/31/11Change10/31/1210/31/11ChangeRevenues--Water Resources72,962$ 70,320$ 3.8213,582$ 207,096$ 3.1--Inliner32,115 36,959 (13.1)101,682 97,607 4.2--Heavy Civil70,472
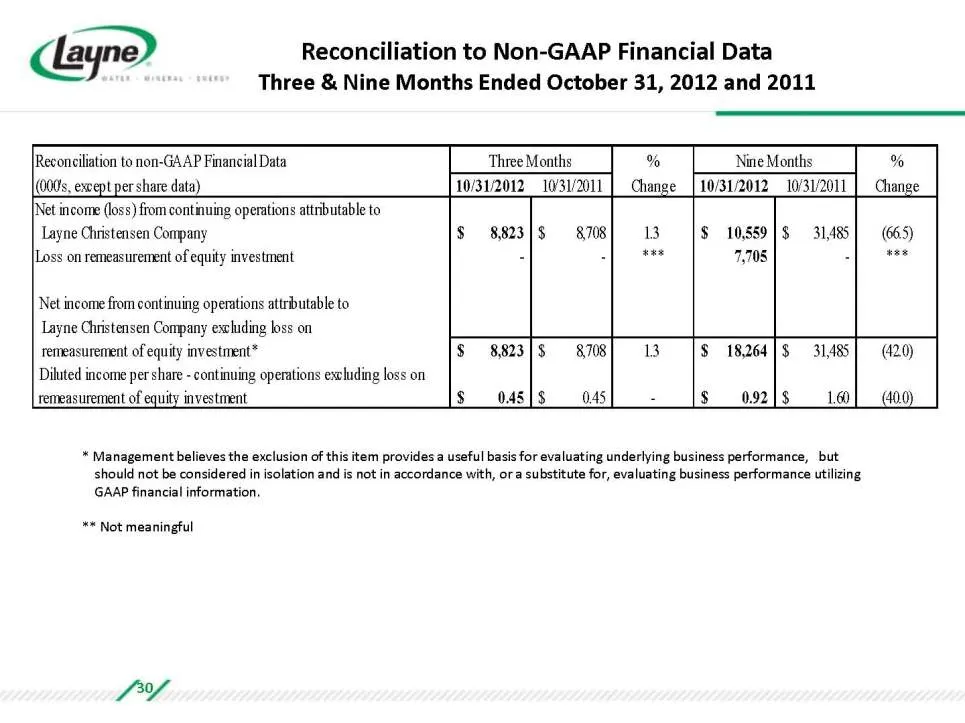
Slide 30: Reconciliation to Non-GAAP Financial Data
Reconciliation to Non-GAAP Financial Data Three & Nine Months Ended October 31, 2012 and 2011 30 * Management believes the exclusion of this item provides a useful basis for evaluating underlying business performance, but should not be considered in isolation and is not in accordance with, or a subs
Source: SEC EDGAR · 8-K filed Dec 12, 2012
More decks from Layne Christensen Company
 Southwest IDEAS Investor Conference November 201730 slides · Nov 16, 2017
 D.A. Davidson 16th Annual Engineering & Construction Conference 201729 slides · Sep 20, 2017
 Jefferies 2017 Industrials Conference29 slides · Aug 7, 2017
 Gabelli & Company's 27th Annual Pump, Valve, & Water Systems Symposium (March 2017)29 slides · Mar 1, 2017
 D.A. Davidson Engineering & Construction Conference 201627 slides · Sep 8, 2016
 Jefferies Industrials Conference 201623 slides · Aug 10, 2016