First Niagara Financial Group Inc
First Niagara Financial — Merger or Acquisition (April 2009)
20 slides from First Niagara Financial's merger presentation, Apr 7, 2009
Slide 1: Acquisition of Selected PNC Pennsylvania Banking Operations
Acquisition of Selected PNC Pennsylvania Banking Operations April 7, 2009
Slide 2: Safe Harbor Statement
This presentation contains forward-looking information for First Niagara Financial Group, Inc. Such information constitutes forward-looking statements (within the meaning of the Private Securities Litigation Reform Act of 1995) which involve significant risks and uncertainties. Actual results may di
Slide 3: Acquisition Highlights
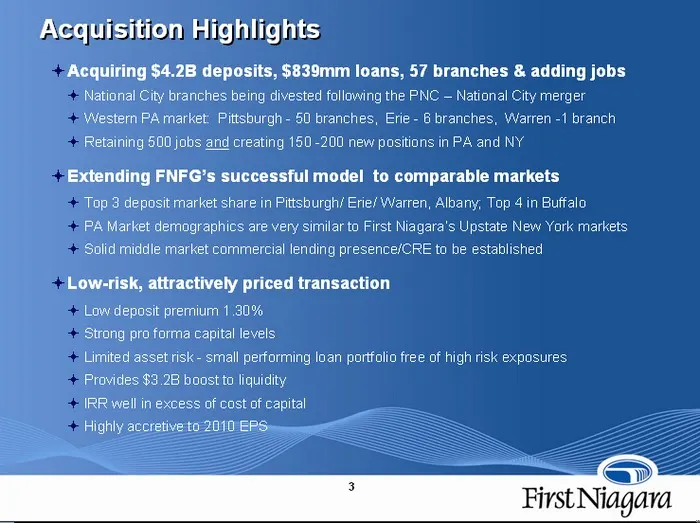
Acquisition Highlights Acquiring $4.2B deposits, $839mm loans, 57 branches & adding jobs National City branches being divested following the PNC - National City merger Western PA market: Pittsburgh - 50 branches, Erie - 6 branches, Warren -1 branch Retaining 500 jobs and creating 150 -200 new positi
Slide 4: Well Positioned in Existing & New Markets
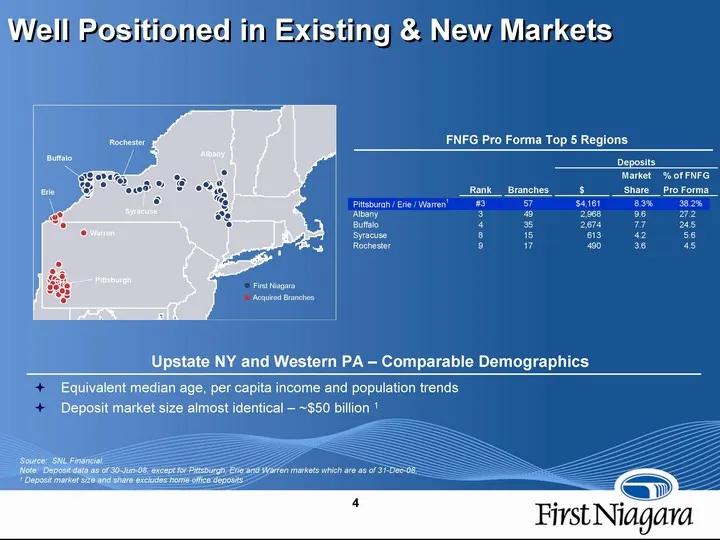
Well Positioned in Existing & New Markets FNFG Pro Forma Top 5 Regions Upstate NY and Western PA - Comparable Demographics Equivalent median age, per capita income and population trends Deposit market size almost identical - ~$50 billion 1 Source: SNL Financial. Note: Deposit data as of 30-Jun-08, e
Slide 5: Pittsburgh and Erie MSA Competitive Landscape
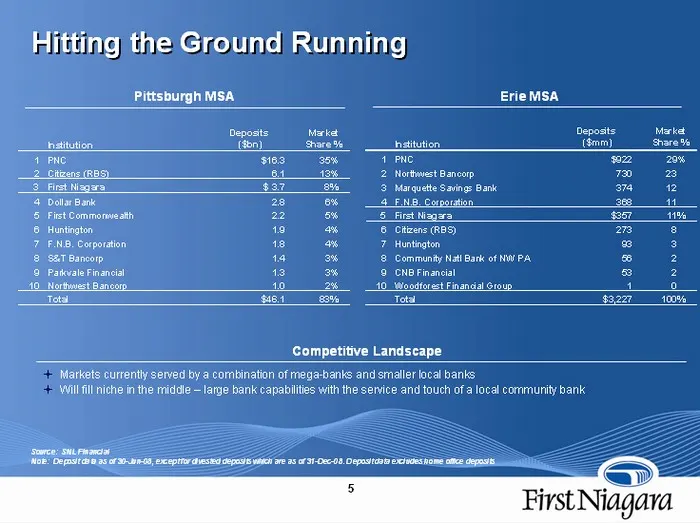
Pittsburgh MSA Hitting the Ground Running Erie MSA Competitive Landscape Markets currently served by a combination of mega-banks and small local banks Will fill niche in the middle - large bank capabilities with the service and touch of a local community bank Source: SNL Financial Note: Deposit data
Slide 6: Significantly Enhances Liquidity Position
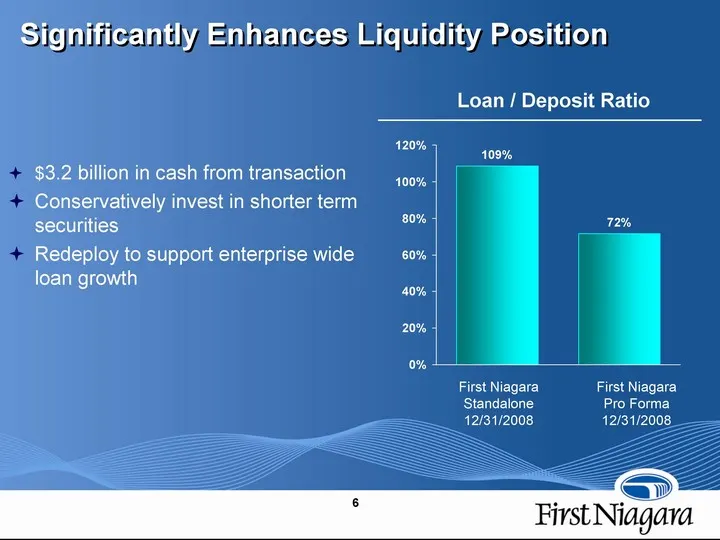
Significantly Enhances Liquidity Position $3.2 billion in cash from transaction Conservatively invest in shorter term securities Redeploy to support enterprise wide loan growth Loan / Deposit Ratio First Niagara Standalone 12/31/2008 First Niagara Pro Forma 12/31/2008
Slide 7: Leverages Strong Growth Momentum
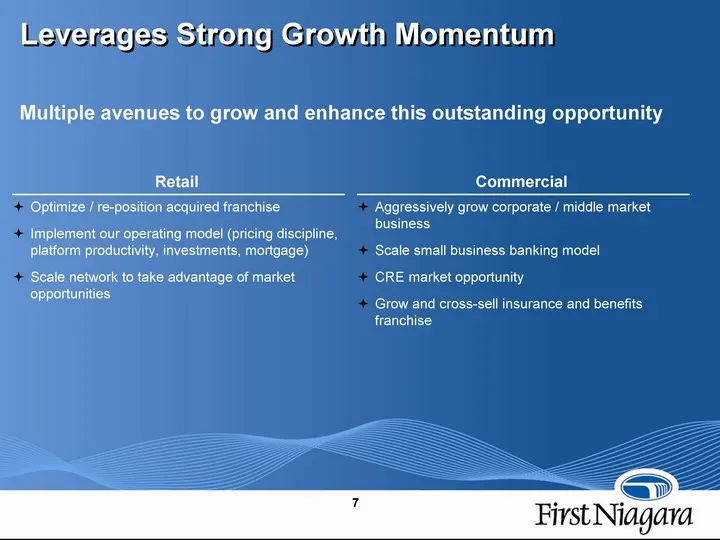
Leverages Strong Growth Momentum Multiple avenues to grow and enhance this outstanding opportunity Retail Optimize / re-position acquired franchise Implement our operating model (pricing discipline, platform productivity, investments, mortgage) Scale network to take advantage of market opportunities
Slide 8: Key Acquisition Terms
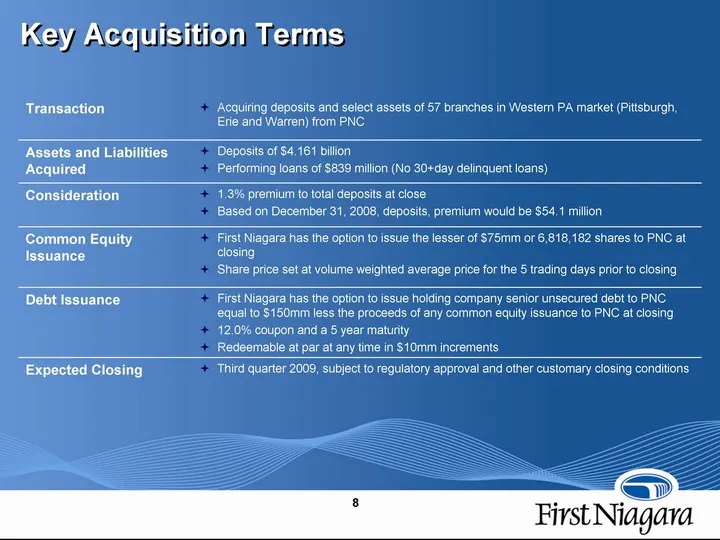
Key Acquisition Terms Transaction Acquiring deposits and select assets of 57 branches in Western PA market (Pittsburgh, Erie and Warren) from PNC Assets and Liabilities Acquired Deposits of $4.161 billion Performing loans of $839 million (No 30+day delinquent loans) Consideration 1.3% premium to tot
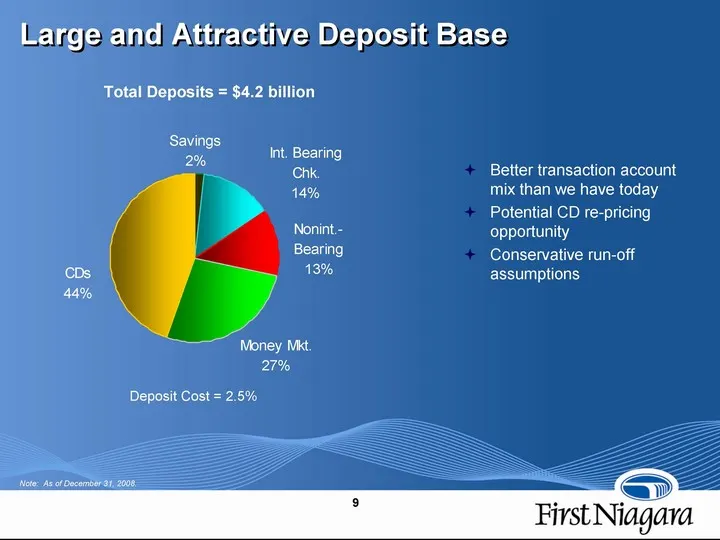
Slide 9: Large and Attractive Deposit Base
Note: As of December 31, 2008. Large and Attractive Deposit Base Better transaction account mix than we have today Potential CD re-pricing opportunity Conservative run-off assumptions Total Deposits = $4.2 billion Deposit Cost = 2.5%
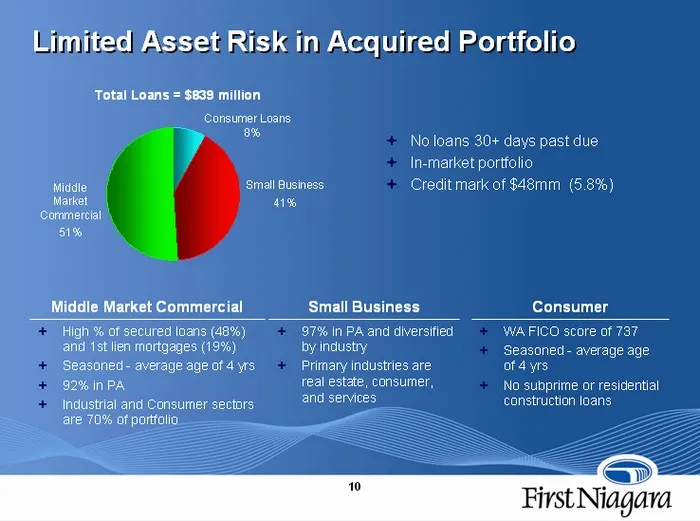
Slide 10: Limited Asset Risk in Acquired Portfolio
Limited Asset Risk in Acquired Portfolio Middle Market Commercial High % of secured loans (48%) and 1st lien mortgages (19%) Seasoned - average age of 4 yrs 92% in PA Industrial and Consumer sectors are 70% of portfolio No loans 30+ days past due In-market portfolio Credit mark of $48mm (5.8%) Total
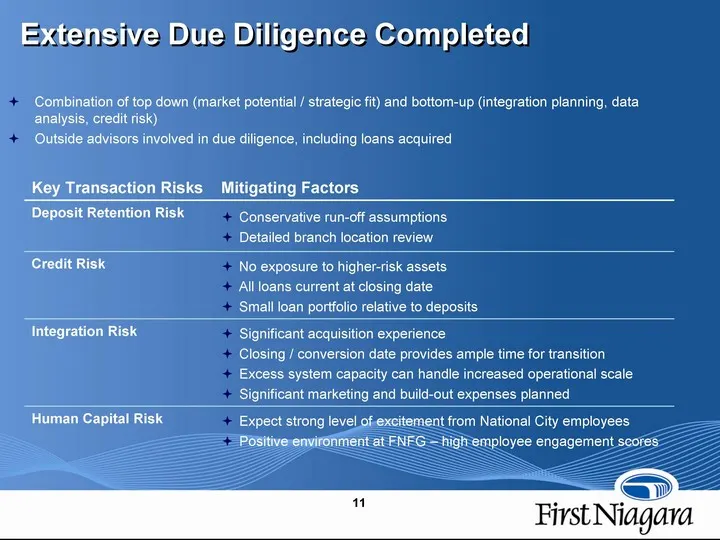
Slide 11: Extensive Due Diligence Completed
Combination of top down (market potential / strategic fit) and bottom-up (integration planning, data analysis, credit risk) Outside advisors involved in due diligence, including loans acquired Key Transaction Risks Mitigating Factors Deposit Retention Risk Conservative run-off assumptions Detailed b
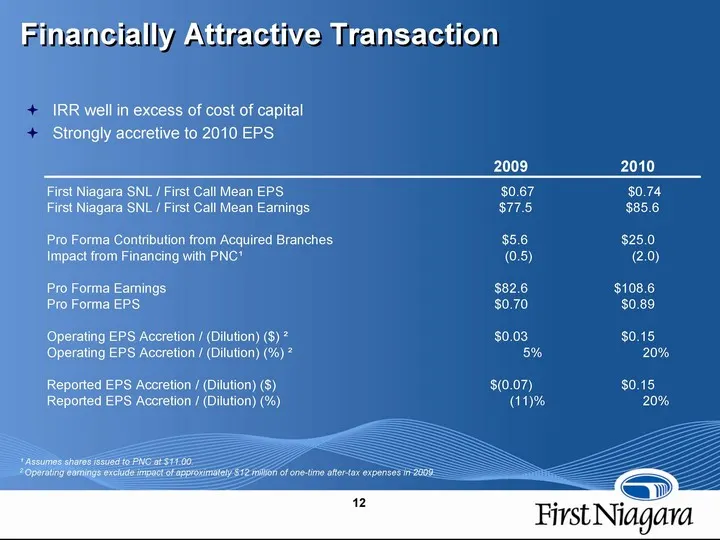
Slide 12: Financially Attractive Transaction
Financially Attractive Transaction IRR well in excess of cost of capital Strongly accretive to 2010 EPS 1 Assumes shares issued to PNC at $11.00. 2 Operating earnings exclude impact of approximately $12 million of one-time after-tax expenses in 2009.
Slide 13: Strong Pro Forma Capital Position
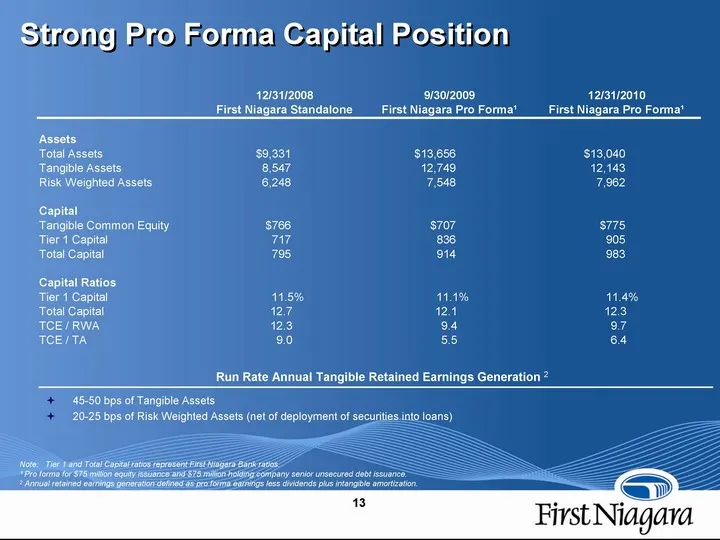
Strong Pro Forma Capital Position Note: Tier 1 and Total Capital ratios represent First Niagara Bank ratios. 1 Pro forma for $75 million equity issuance and $75 million holding company senior unsecured debt issuance. 2 Annual retained earnings generation defined as pro forma earnings less dividends
Slide 14: Tough Times Breed Opportunities: First Niagara, A Winning Franchise
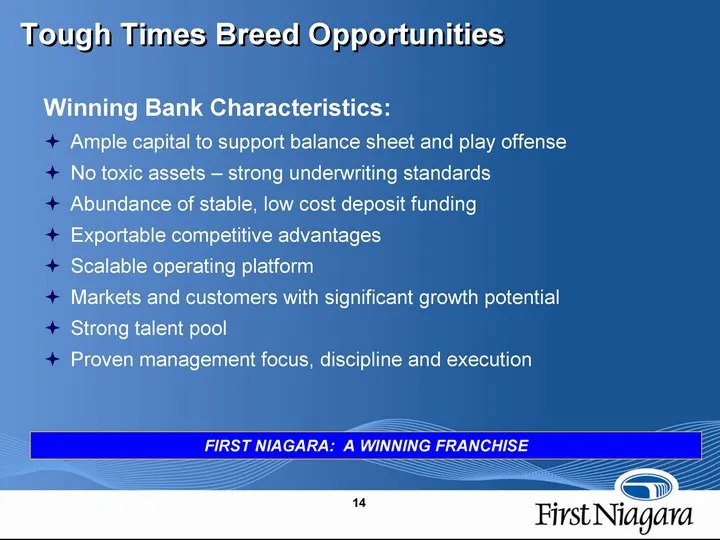
Winning Bank Characteristics: Ample capital to support balance sheet and play offense No toxic assets - strong underwriting standards Abundance of stable, low cost deposit funding Exportable competitive advantages Scalable operating platform Markets and customers with significant growth potential St
Slide 15: Supplemental Financial Disclosure
Supplemental Financial Disclosure
Slide 16: Profitability Assumptions
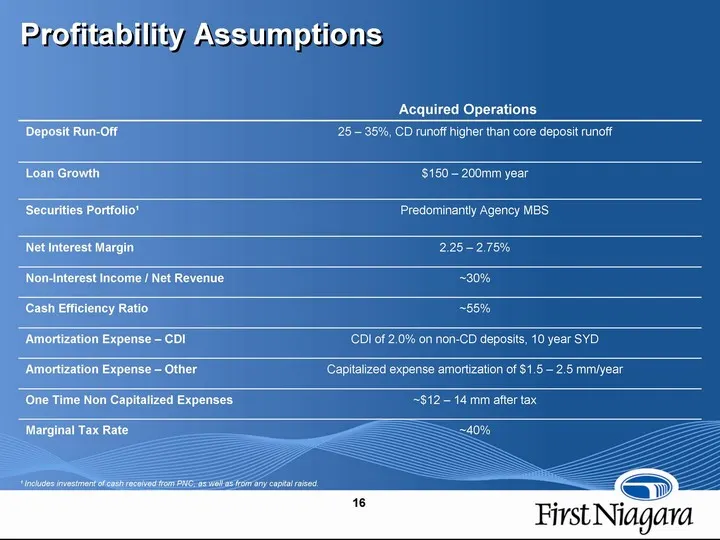
Profitability Assumptions Acquired Operations Acquired Operations Deposit Run-Off Deposit Run-Off 25 - 35%, CD runoff higher than core deposit runoff Loan Growth Loan Growth $150 - 200mm year Securities Portfolio1 Securities Portfolio1 Predominantly Agency MBS Net Interest Margin Net Interest Margin
Slide 17: Loan Portfolio Details
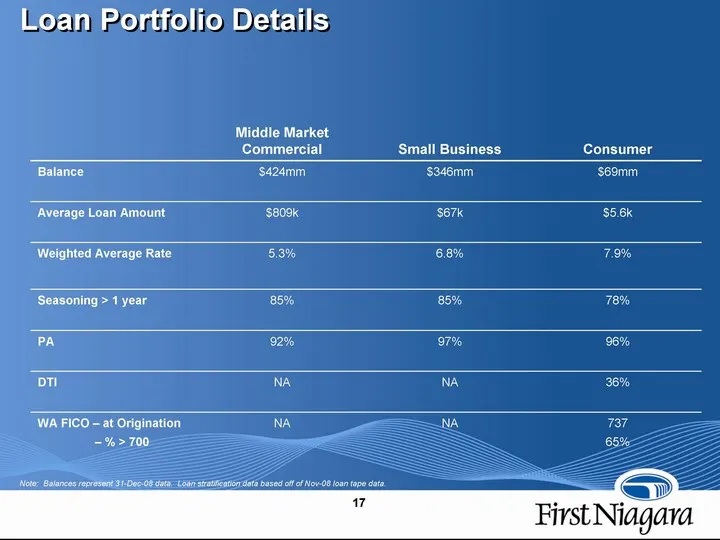
Loan Portfolio Details Note: Balances represent 31-Dec-08 data. Loan stratification data based off of Nov-08 loan tape data. Middle Market Commercial Small Business Consumer Balance $424mm $346mm $69mm Average Loan Amount $809k $67k $5.6k Weighted Average Rate 5.3% 6.8% 7.9% Seasoning > 1 year 85% 8
Slide 18: Acquired Portfolio Lifetime Credit Loss Expectation
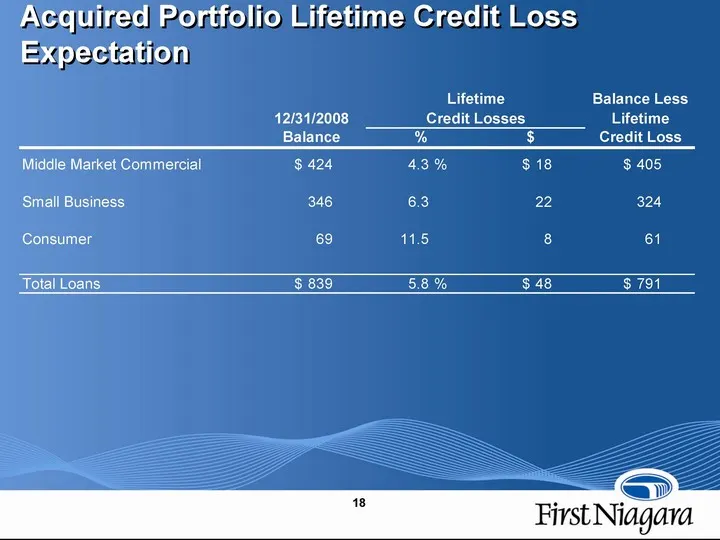
Acquired Portfolio Lifetime Credit Loss Expectation
Slide 19: Acquired Balance Sheet
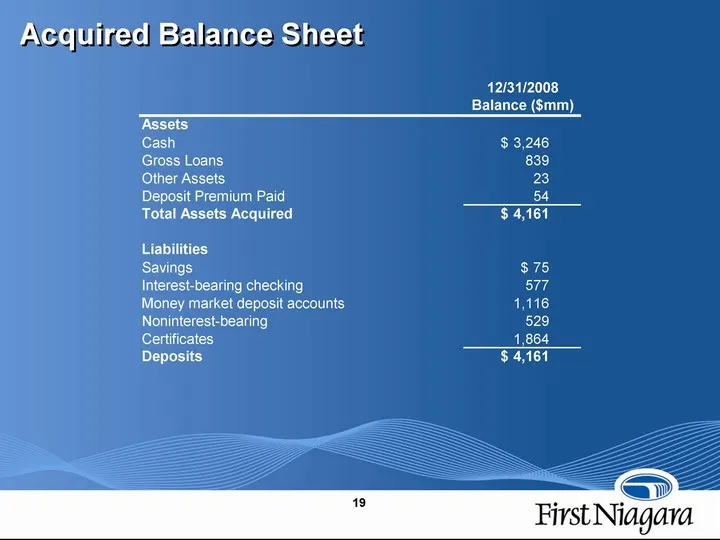
Acquired Balance Sheet 12/31/2008 Balance ($mm) Assets Cash $3,246 Gross Loans 839 Other Assets 23 Deposit Premium Paid 54 Total Assets Acquired $4,161 Liabilities Savings $75 Interest-bearing checking 877 Money market deposit accounts 1,116 Noninterest-bearing 529 Certificates 1,864 Deposits $4,161
Slide 20: Listing information and investor inquiries
First Niagara Financial Group's common stock is listed on the NASDAQ Global Select Market and is traded under the symbol FNFG Additional information is available at www.fnfg.com Investor Inquires: Tony Alessi Vice President 716.625.7692 [email protected]
Source: SEC EDGAR · 8-K filed Apr 7, 2009
More decks from First Niagara Financial Group Inc
 Q4 2015 Earnings Presentation27 slides · Jan 21, 2016
 Merger or Acquisition (October 2015)18 slides · Oct 30, 2015
 Q3 2015 Earnings Presentation20 slides · Oct 23, 2015
 Q2 2015 Earnings Presentation20 slides · Jul 24, 2015
 Presentation (June 2015)11 slides · Jun 16, 2015
 Q1 2015 Earnings Presentation20 slides · Apr 24, 2015