US Airways — Next Generation Equity Research U.S. Airline Conference 2009
23 slides from US Airways's conference presentation, Dec 9, 2009

Slide 1: Next Generation Equity Research U.S. Airline Conference
Next Generation Equity Research U.S. Airline Conference December 9, 2009 Scott Kirby President US Airways Group, Inc.
Slide 2: Forward-Looking Statements
Forward-Looking Statements Certain of the statements contained herein should be considered "forward-looking statements" within the meaning of the Private Securities Litigation Reform Act of 1995. These forward looking statements may be identified by words such as "may," "will," "expect," "intend," "
Slide 3: Overview
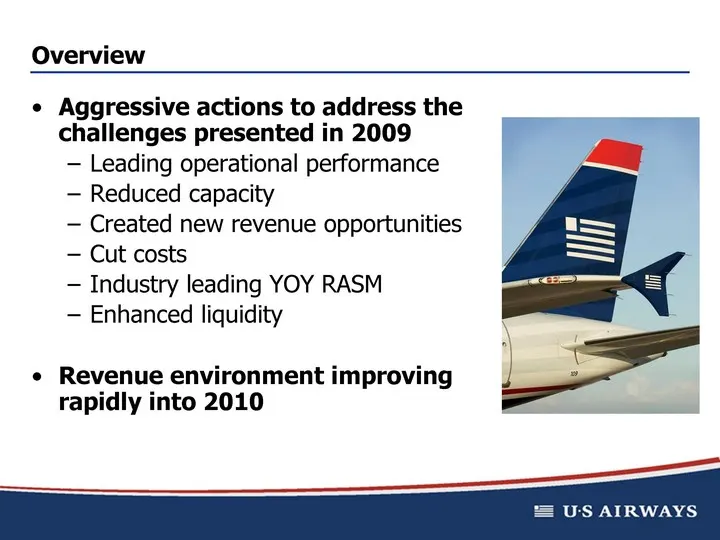
Overview Aggressive actions to address the challenges presented in 2009 Leading operational performance Reduced capacity Created new revenue opportunities Cut costs Industry leading YOY RASM Enhanced liquidity Revenue environment improving rapidly into 2010
Slide 4: Leading Operational Performance
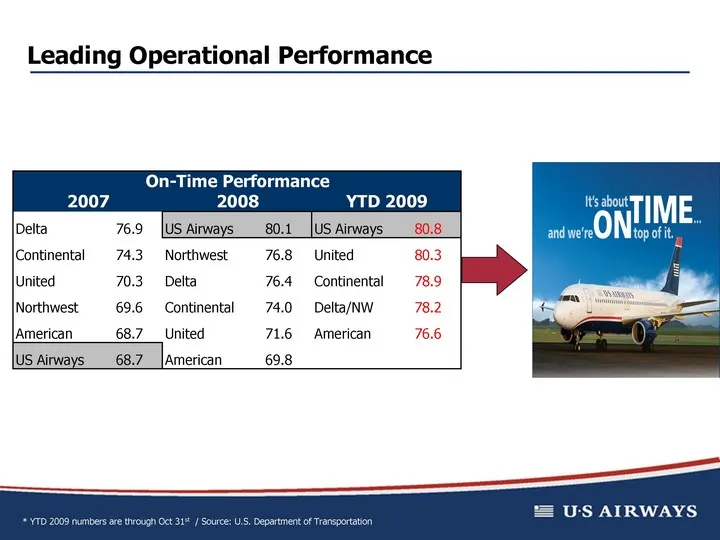
Leading Operational Performance * YTD 2009 numbers are through Oct 31st / Source: U.S. Department of Transportation
Slide 5: Capacity Discipline
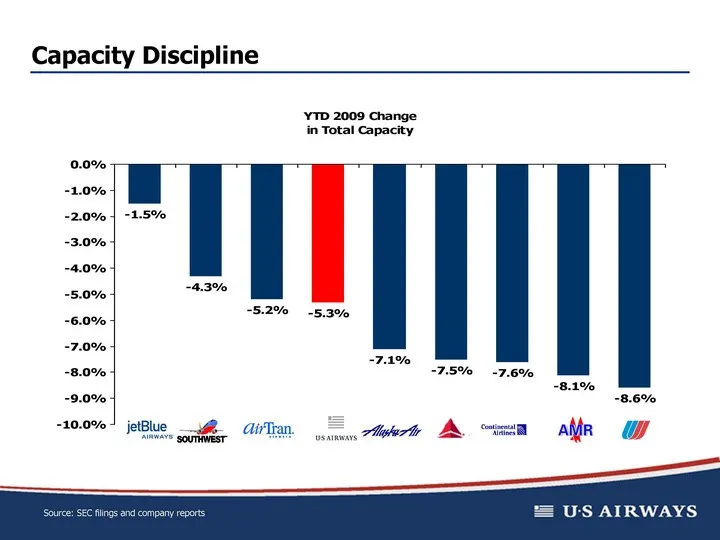
Capacity Discipline JBLU LUV AAI LCC ALK DAL CAL AMR UAUA -0.015 -0.043 -0.052 -0.053 -0.071 -0.075 -0.076 -0.081 -0.086 Source: SEC filings and company reports
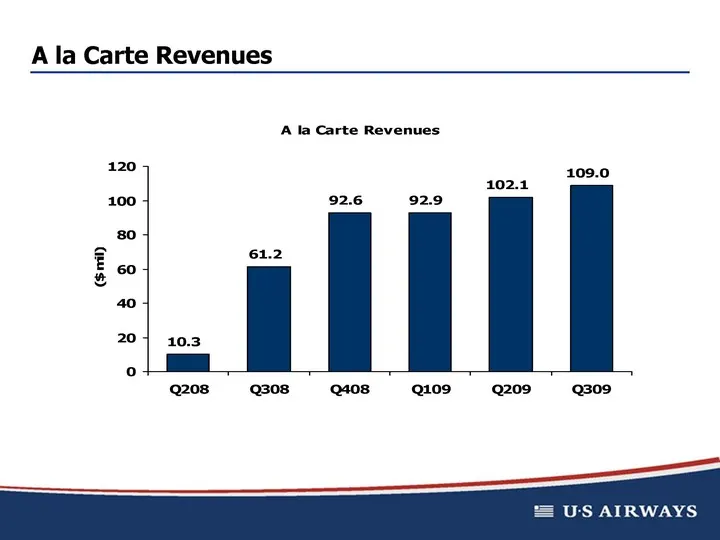
Slide 6: A la Carte Revenues
A la Carte Revenues Q208 Q308 Q408 Q109 Q209 Q309 10.3 61.2 92.6 92.9 102.1 109
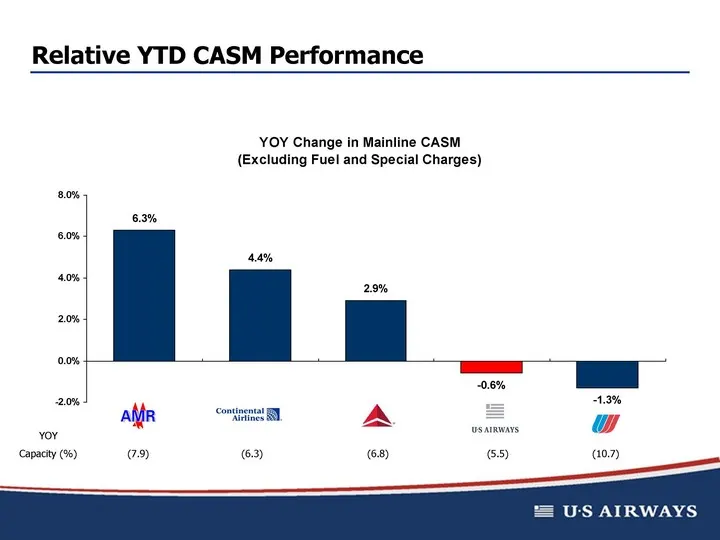
Slide 7: Relative YTD CASM Performance
ALK JBLU AAI LUV AMR CAL DAL LCC UAUA 0.104 0.09 0.076 0.069 0.063 0.044 0.029 -0.006 -0.013 Relative YTD CASM Performance YOY Capacity (%) (7.9) (6.3) (6.8) (5.5) (10.7)
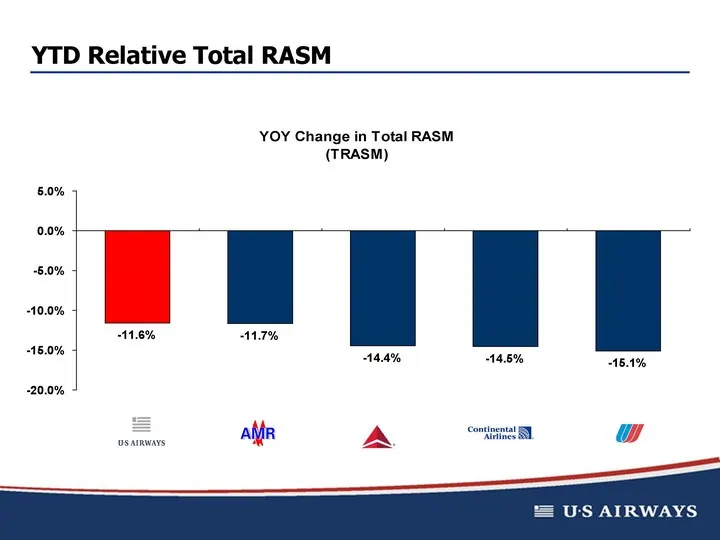
Slide 8: YTD Relative Total RASM
YTD Relative Total RASM ALK JBLU LUV AAI LCC AMR DAL CAL UAUA -0.031 -0.033 -0.037 -0.064 -0.116 -0.117 -0.144 -0.145 -0.151
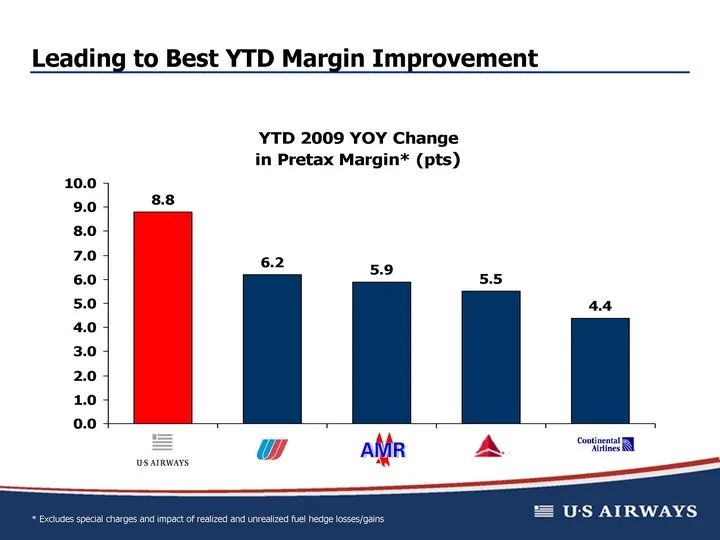
Slide 9: Leading to Best YTD Margin Improvement
LCC UAUA AMR DAL CAL 8.8 6.2 5.9 5.5 4.4 Leading to Best YTD Margin Improvement * Excludes special charges and impact of realized and unrealized fuel hedge losses/gains
Slide 10: Outlook Going Forward
Outlook Going Forward
Slide 11: Recent Announcements
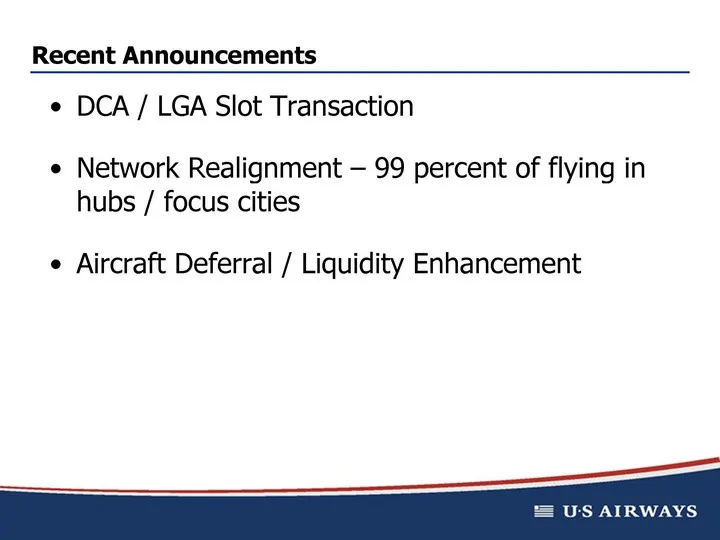
Recent Announcements DCA / LGA Slot Transaction Network Realignment - 99 percent of flying in hubs / focus cities Aircraft Deferral / Liquidity Enhancement
Slide 12: Aircraft Deferral / Liquidity Enhancements
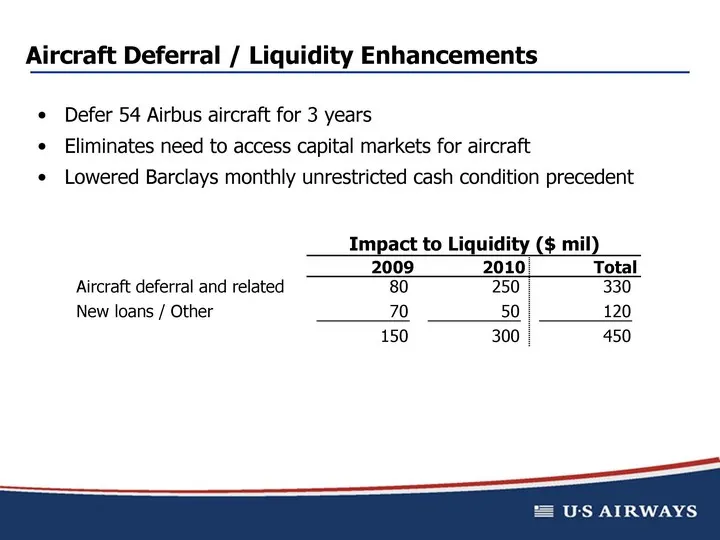
Aircraft Deferral / Liquidity Enhancements Defer 54 Airbus aircraft for 3 years Eliminates need to access capital markets for aircraft Lowered Barclays monthly unrestricted cash condition precedent
Slide 13: Historical Industry Revenue Performance
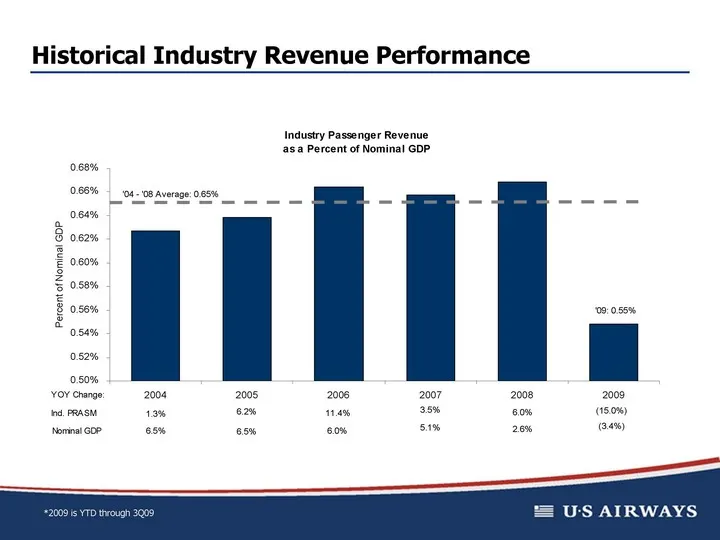
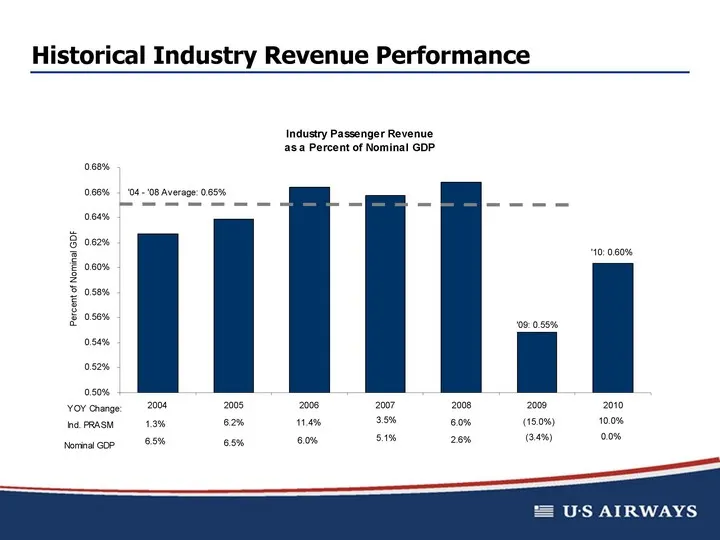
Historical Industry Revenue Performance *2009 is YTD through 3Q09
Slide 14: Historical Industry Revenue Performance
Historical Industry Revenue Performance
Slide 15: Revenue Trends are Encouraging
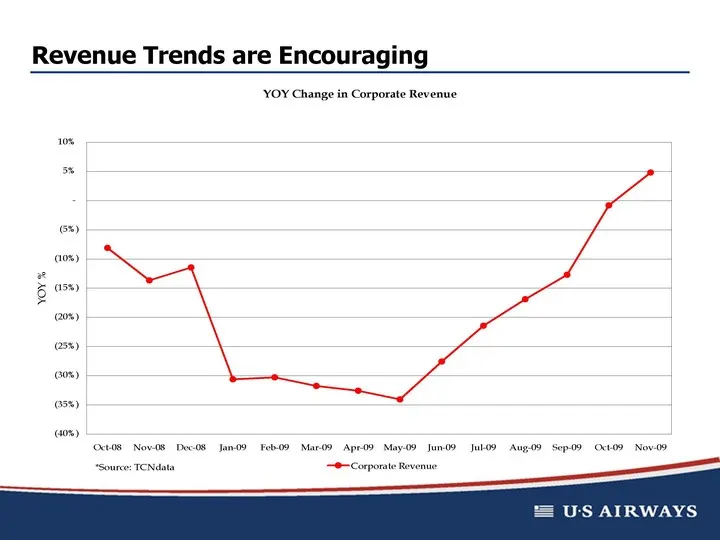
Revenue Trends are Encouraging
Slide 16: Yield Continues to Improve
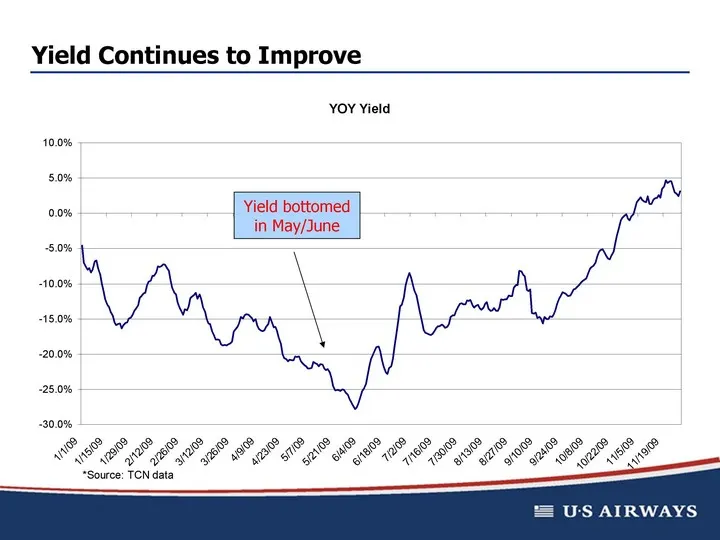
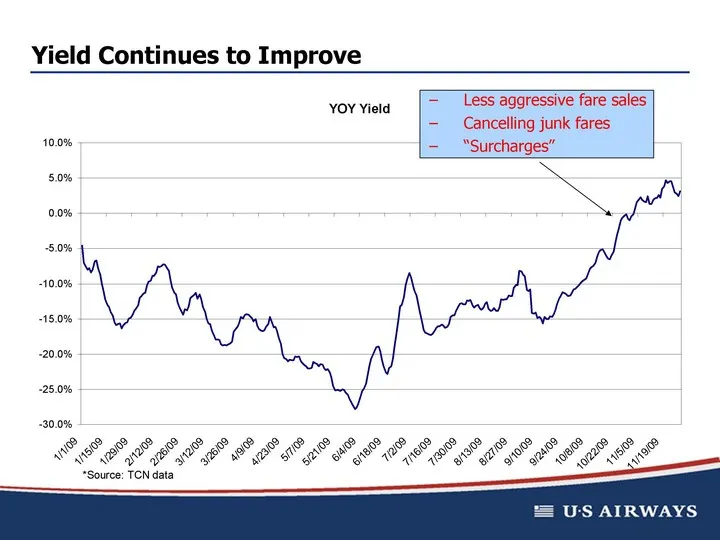
Yield Continues to Improve Yield bottomed in May/June
Slide 17: Yield Continues to Improve
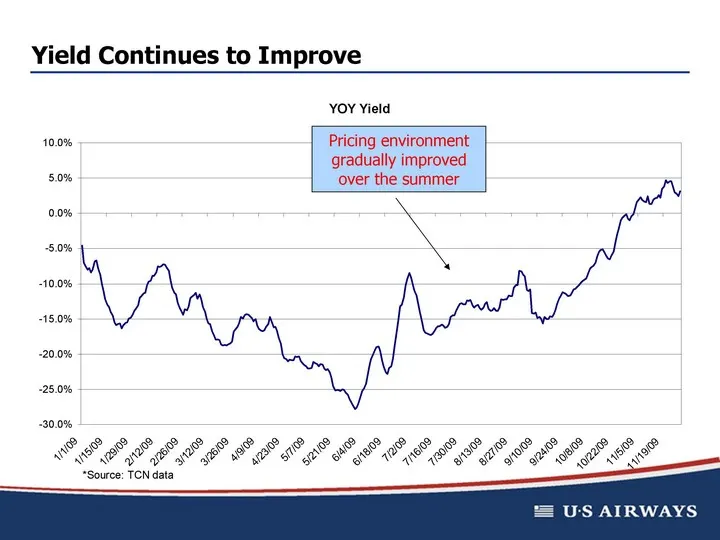
Yield Continues to Improve Pricing environment gradually improved over the summer
Slide 18: Yield Continues to Improve
Yield Continues to Improve Less aggressive fare sales Cancelling junk fares "Surcharges"
Slide 19: Summary
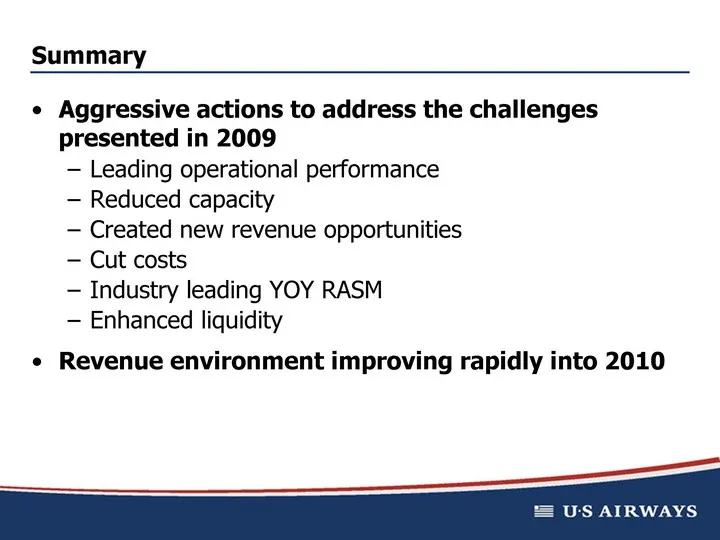
Summary Aggressive actions to address the challenges presented in 2009 Leading operational performance Reduced capacity Created new revenue opportunities Cut costs Industry leading YOY RASM Enhanced liquidity Revenue environment improving rapidly into 2010
Slide 20: Appendix
APPENDIX
Slide 21: GAAP to non-GAAP Reconciliation
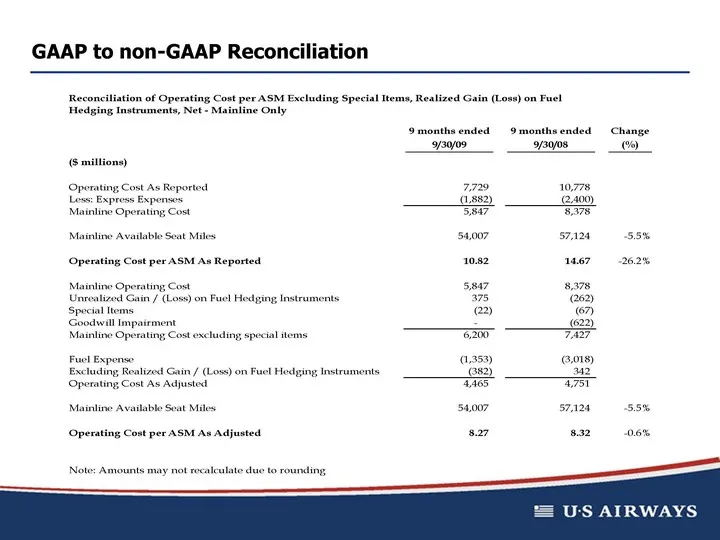
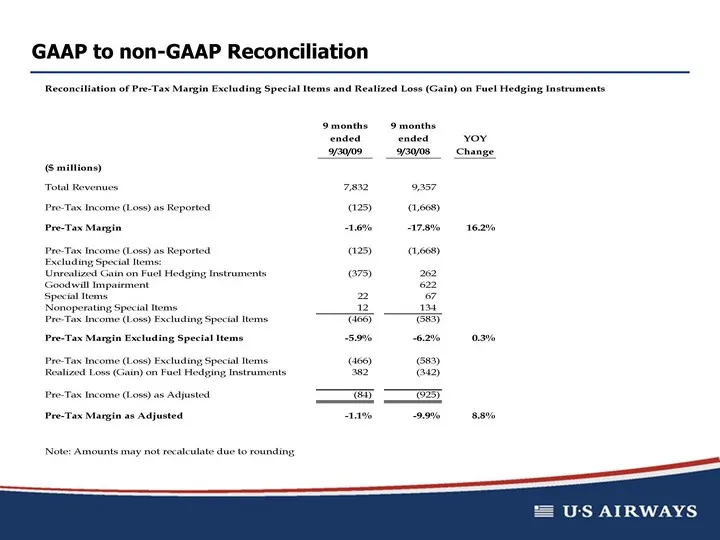
GAAP to non-GAAP Reconciliation
Slide 22: GAAP to non-GAAP Reconciliation
GAAP to non-GAAP Reconciliation

Slide 23: Questions?
Questions?
Source: SEC EDGAR · 8-K filed Dec 9, 2009
More decks from US Airways Group Inc
 Merger or Acquisition (May 2013)30 slides · May 10, 2013
 Merger or Acquisition (April 2013)19 slides · Apr 25, 2013
 IPO Roadshow (April 2013)25 slides · Apr 10, 2013
 Merger or Acquisition (March 2013)30 slides · Mar 22, 2013
 Merger or Acquisition (February 2013)7 slides · Feb 26, 2013
 IPO Roadshow (November 2012)10 slides · Nov 29, 2012