PetroQuest Energy — Investor Presentation (February 2014)
47 slides from PetroQuest Energy's investor presentation, Feb 18, 2014
Slide 1: PetroQuest Energy, Inc. February 2014
*s troQuest Energy, Inc. February 2014
Slide 2: Company Information
Company Information 2 Corporate Contact: Matt Quantz - [email protected] This presentation contains "forward-looking statements" within the meaning of Section 27A of the Securities Act of 1933, as amended, and Section 21E of the Securities Exchange Act of 1934, as amended. These forward-looking
Slide 3: Our Daily Focus
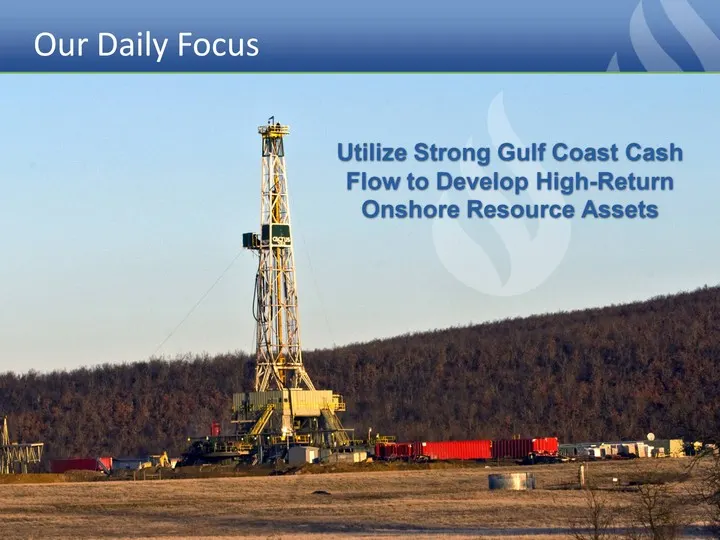
Our Daily Focus 3 Utilize Strong Gulf Coast Cash Flow to Develop High-Return Onshore Resource Assets
Slide 4: Gulf Coast Cash Flow Magnifies Growth
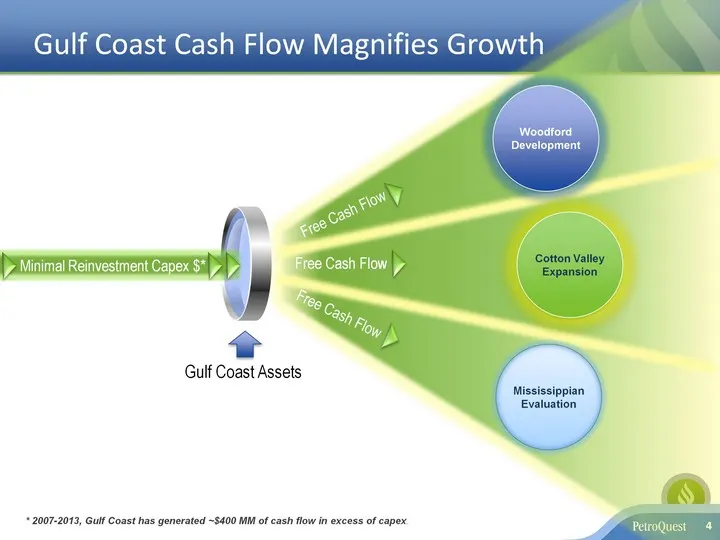
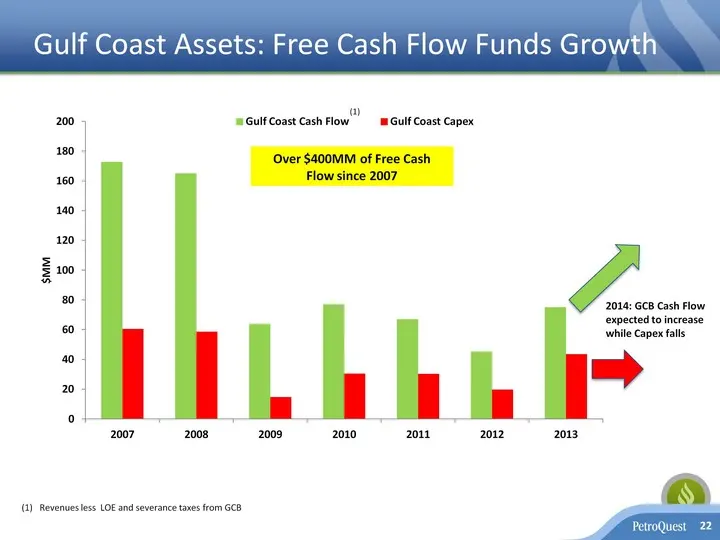
Gulf Coast Cash Flow Magnifies Growth 4 Free Cash Flow Free Cash Flow Free Cash Flow Minimal Reinvestment Capex $* WoodfordDevelopment Cotton Valley Expansion Mississippian Evaluation Gulf Coast Assets * 2007-2013, Gulf Coast has generated ~$400 MM of cash flow in excess of capex.
Slide 5: Our Properties
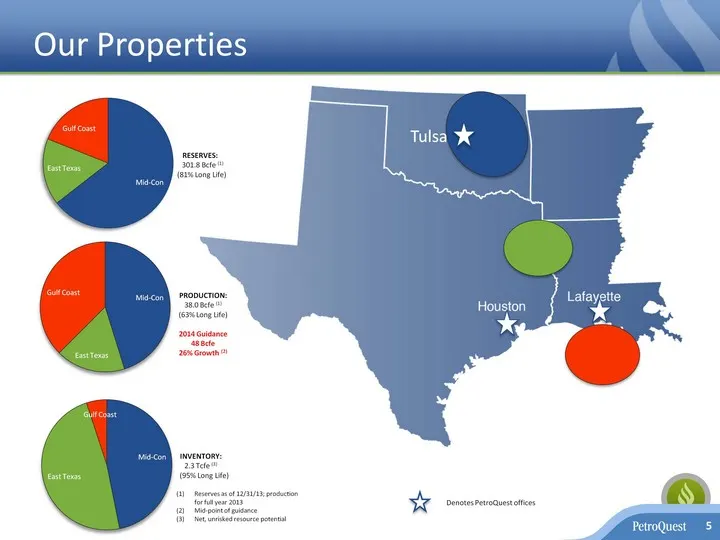
Reserves as of 12/31/13; production for full year 2013Mid-point of guidanceNet, unrisked resource potential Our Properties 5 (CHART) PRODUCTION:38.0 Bcfe (1)(63% Long Life)2014 Guidance48 Bcfe26% Growth (2)(CHART) RESERVES: 301.8 Bcfe (1) (81% Long Life) (CHART) INVENTORY:2.3 Tcfe (3) (95% Long Life
Slide 6: Valuation Decoupled from Strong Growth
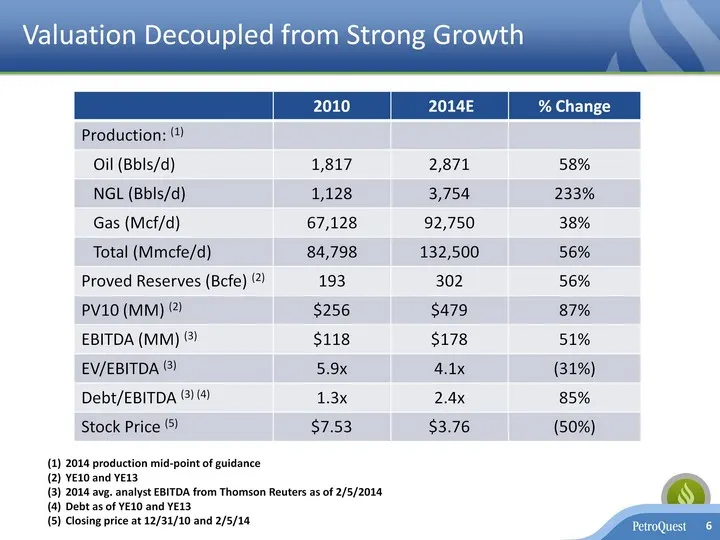
Valuation Decoupled from Strong Growth Valuation Decoupled from Strong Growth 2014 production mid-point of guidanceYE10 and YE132014 avg. analyst EBITDA from Thomson Reuters as of 2/5/2014Debt as of YE10 and YE13 Closing price at 12/31/10 and 2/5/14 6
Slide 7: Onshore Growth Assets
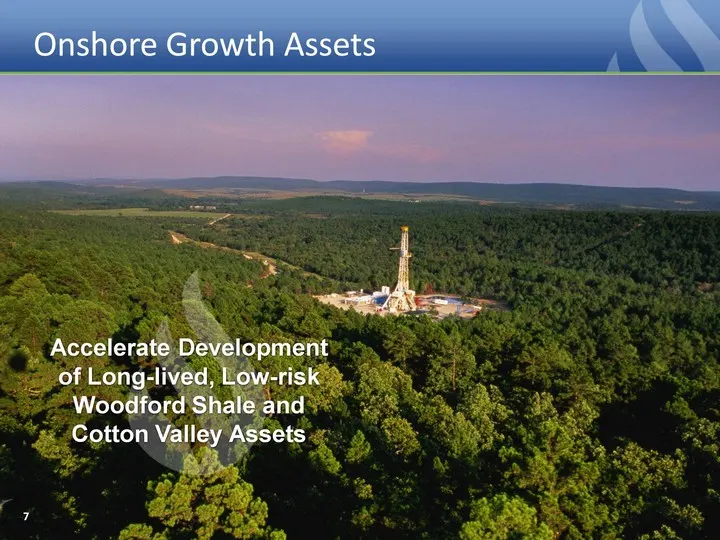
7 Onshore Growth Assets Accelerate Development of Long-lived, Low-risk Woodford Shale and Cotton Valley Assets
Slide 8: Mid-Continent
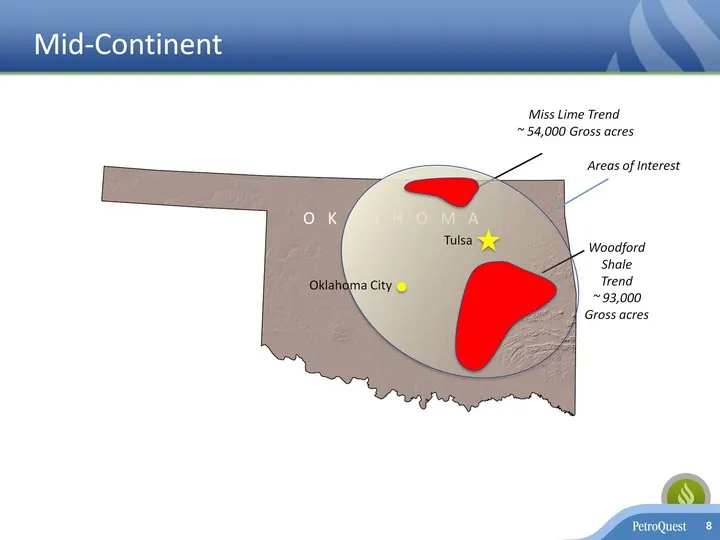
Mid-Continent 8 OKLAHOMA WoodfordShaleTrend~ 93,000Gross acres Miss Lime Trend ~ 54,000 Gross acres Areas of Interest Tulsa Oklahoma City
Slide 9: Woodford Position - Ramping Up Development
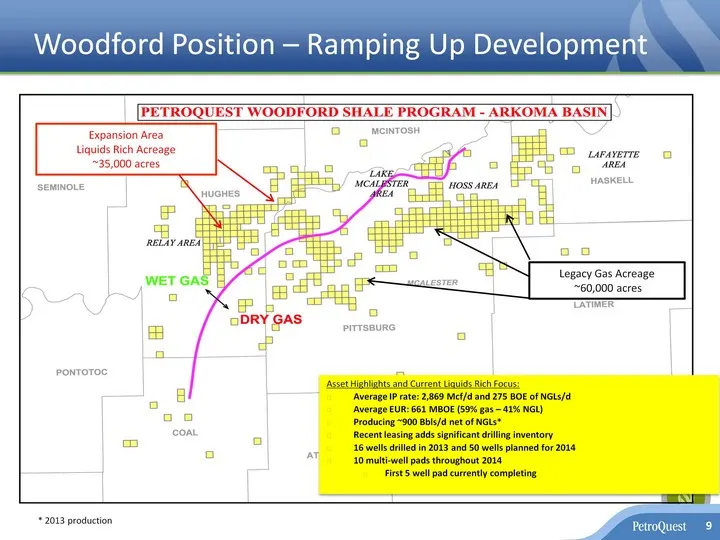
Woodford Position - Ramping Up Development 9 Asset Highlights and Current Liquids Rich Focus:Average IP rate: 2,869 Mcf/d and 275 BOE of NGLs/dAverage EUR: 661 MBOE (59% gas - 41% NGL)Producing ~900 Bbls/d net of NGLs*Recent leasing adds significant drilling inventory16 wells drilled in 2013 and 50
Slide 10: Woodford Liquids Rich Gas Horizontal Well Economics
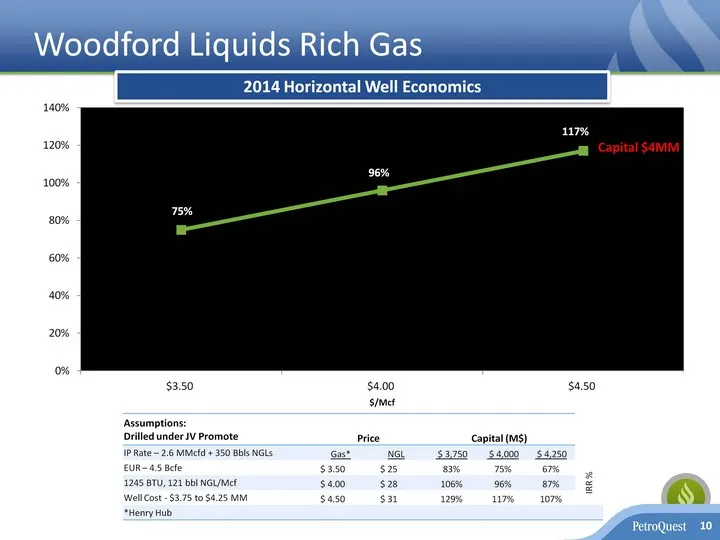
Woodford Liquids Rich Gas 10 Assumptions: Drilled under JV Promote Price Price Capital (M$) Capital (M$) Capital (M$) IP Rate - 2.6 MMcfd + 350 Bbls NGLs Gas* NGL $ 3,750 $ 4,000 $ 4,250 EUR - 4.5 Bcfe $ 3.50 $ 25 83% 75% 67% IRR % 1245 BTU, 121 bbl NGL/Mcf $ 4.00 $ 28 106% 96% 87% IRR % Well Cost -
Slide 11: Continuous Improvement in the Woodford
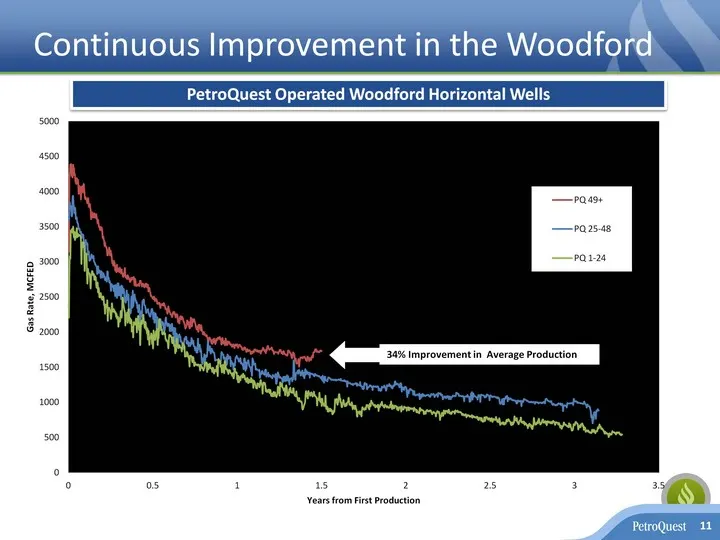
(CHART) Continuous Improvement in the Woodford 11 PetroQuest Operated Woodford Horizontal Wells 34% Improvement in Average Production
Slide 12: PQ Woodford Performance
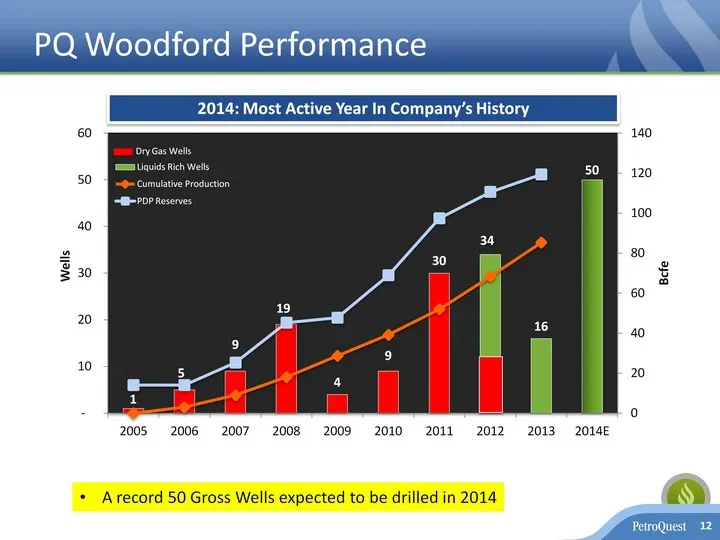
PQ Woodford Performance 12 (CHART) 2014: Most Active Year In Company's History A record 50 Gross Wells expected to be drilled in 2014 Dry Gas Wells
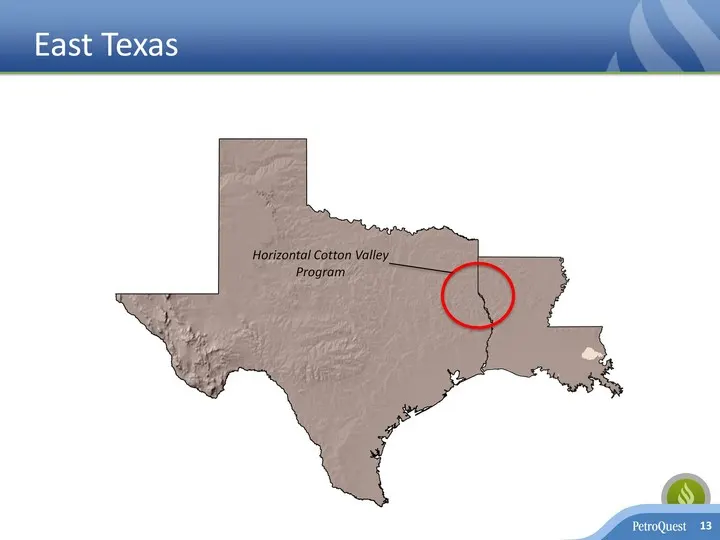
Slide 13: East Texas Horizontal Cotton Valley Program
East Texas 13 Horizontal Cotton ValleyProgram
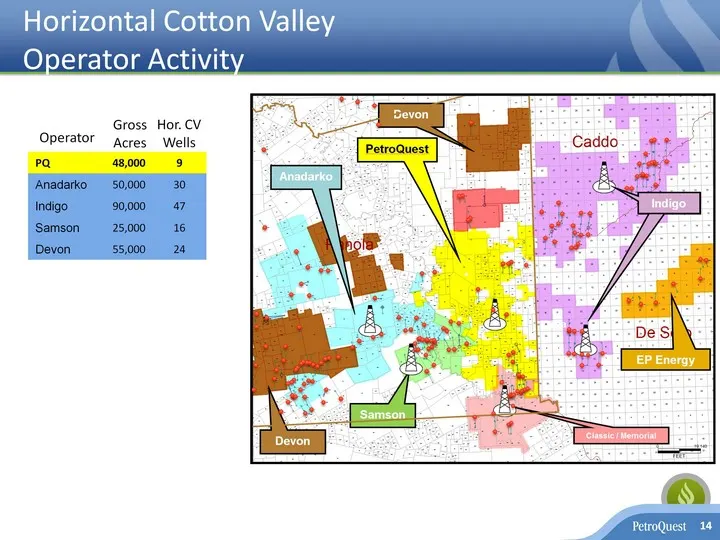
Slide 14: Horizontal Cotton Valley Operator Activity
Horizontal Cotton Valley Operator Activity Operator Activity Operator Activity Operator Gross Acres Hor. CV Wells 14
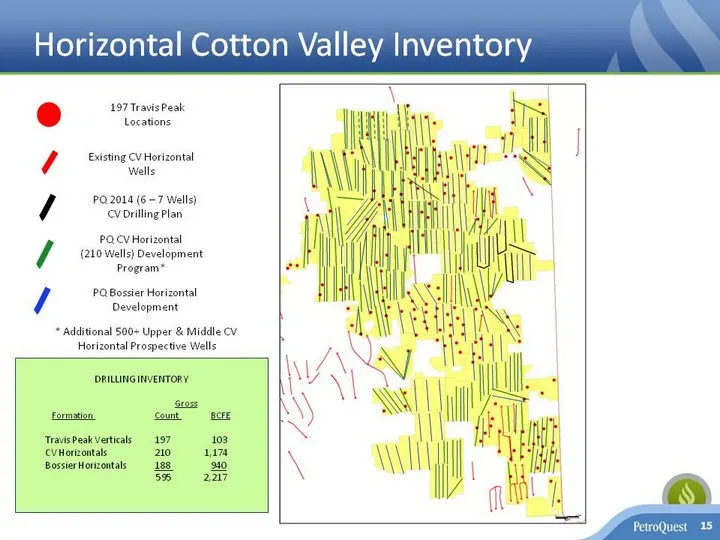
Slide 15: Horizontal Cotton Valley Inventory
15 PQ CV Horizontal (210 Wells) DevelopmentProgram* PQ 2014 (6 - 7 Wells)CV Drilling Plan Existing CV Horizontal Wells DRILLING INVENTORY GrossFormation Count BCFE Travis Peak Verticals 197 103CV Horizontals 210 1,174Bossier Horizontals 188 940 595 2,217 197 Travis PeakLocations * Additional 500+ Up
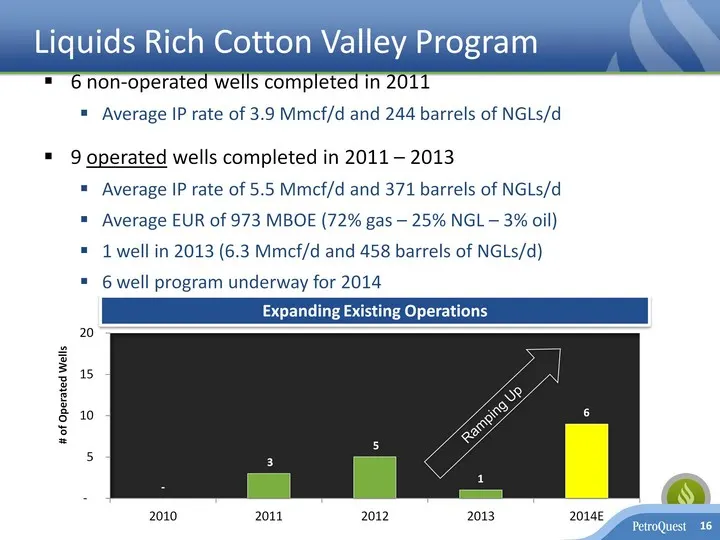
Slide 16: Liquids Rich Cotton Valley Program
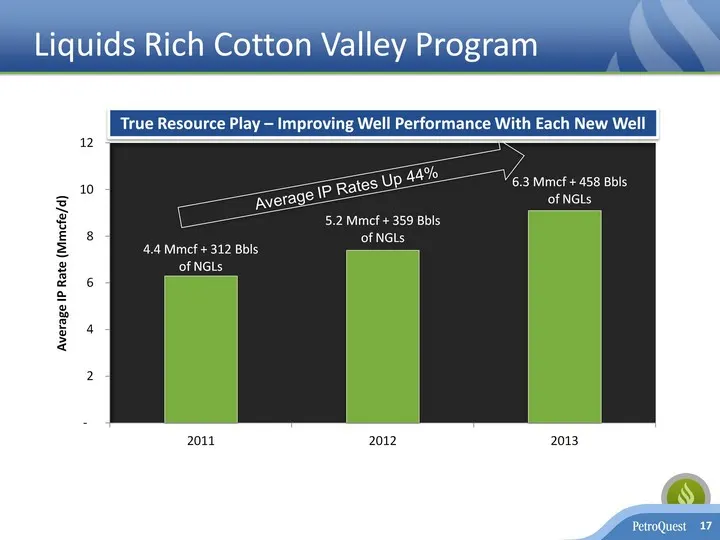
Liquids Rich Cotton Valley Program 6 non-operated wells completed in 2011Average IP rate of 3.9 Mmcf/d and 244 barrels of NGLs/d9 operated wells completed in 2011 - 2013Average IP rate of 5.5 Mmcf/d and 371 barrels of NGLs/dAverage EUR of 973 MBOE (72% gas - 25% NGL - 3% oil)1 well in 2013 (6.3 Mmcf
Slide 17: Liquids Rich Cotton Valley Program
Liquids Rich Cotton Valley Program 17 (CHART) Average IP Rates Up 44% True Resource Play - Improving Well Performance With Each New Well
Slide 18: Liquids Rich Horizontal Cotton Valley IRR
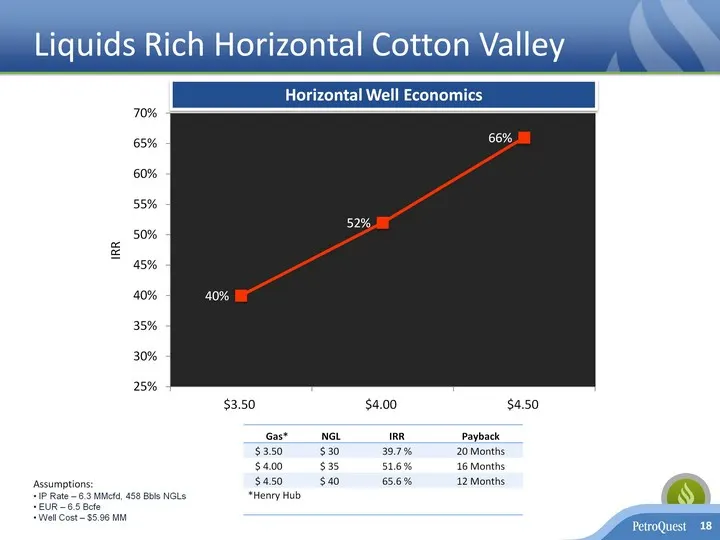
Liquids Rich Horizontal Cotton Valley 18 IRR Assumptions: IP Rate - 6.3 MMcfd, 458 Bbls NGLs EUR - 6.5 Bcfe Well Cost - $5.96 MM (CHART) Horizontal Well Economics Gas* NGL IRR Payback $ 3.50 $ 30 39.7 % 20 Months $ 4.00 $ 35 51.6 % 16 Months $ 4.50 $ 40 65.6 % 12 Months *Henry Hub
Slide 19: Mississippian Lime - Utilizing Science to Enhance Value
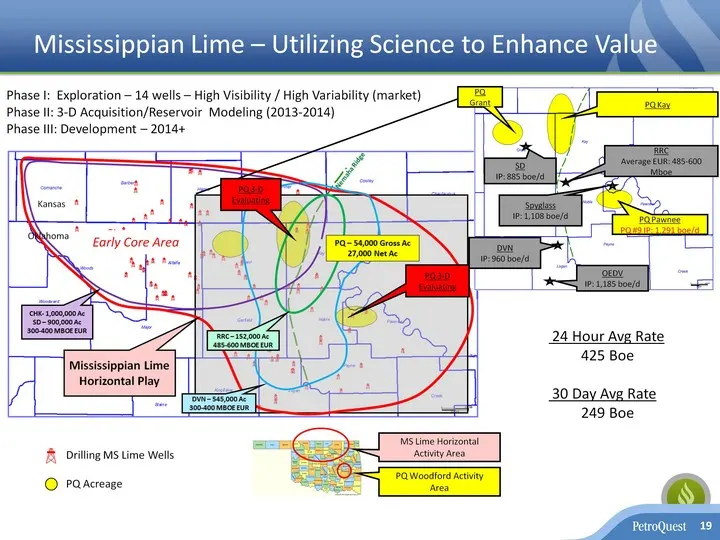
Mississippian Lime - Utilizing Science to Enhance Value 19 Drilling MS Lime Wells PQ Acreage Early Core Area Kansas Oklahoma PQ Woodford Activity Area MS Lime Horizontal Activity Area PQ Kay PQ PawneePQ #9 IP: 1,291 boe/d RRCAverage EUR: 485-600 Mboe SpyglassIP: 1,108 boe/d DVNIP: 960 boe/d OEDVIP:
Slide 20: Cash Flowing Gulf Coast Assets
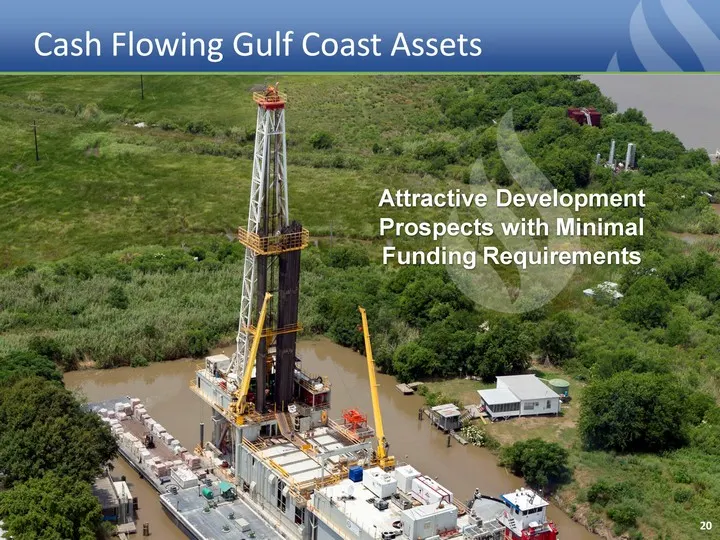
Cash Flowing Gulf Coast Assets 20 XX combined years of experience finding, developing and operating in the Gulf of Mexico and Gulf Coast region Attractive Development Prospects with Minimal Funding Requirements
Slide 21: Gulf Coast
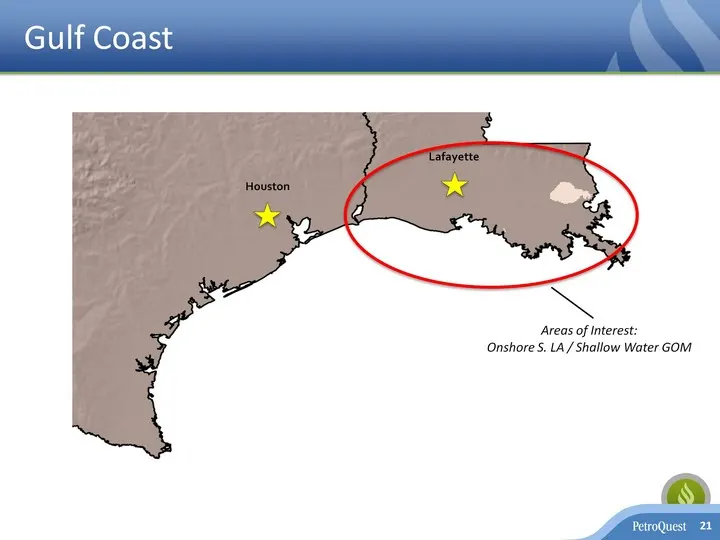
Gulf Coast 21 Houston Lafayette Areas of Interest:Onshore S. LA / Shallow Water GOM
Slide 22: Gulf Coast Assets: Free Cash Flow Funds Growth
Gulf Coast Assets: Free Cash Flow Funds Growth 22 Revenues less LOE and severance taxes from GCB(CHART) Over $400MM of Free Cash Flow since 2007 (1)
Slide 23: La Cantera/Thunder Bayou Shallow Fields
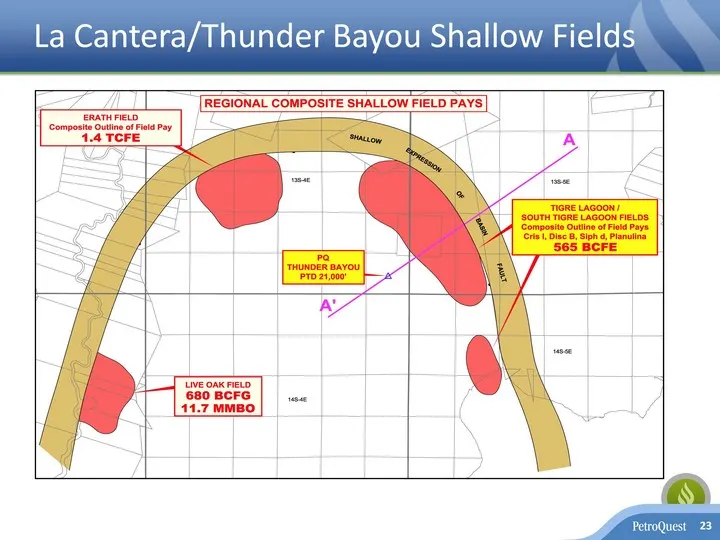
La Cantera/Thunder Bayou Shallow Fields 23
Slide 24: Thunder Bayou Stratigraphic Cross Section
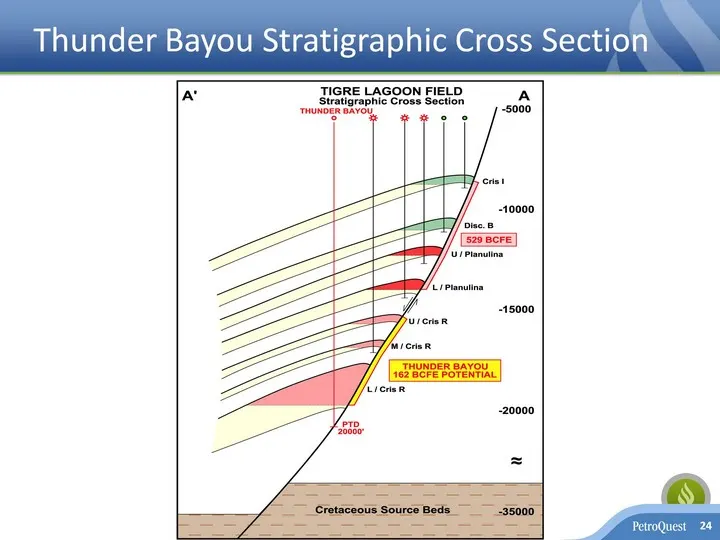
Thunder Bayou Stratigraphic Cross Section 24
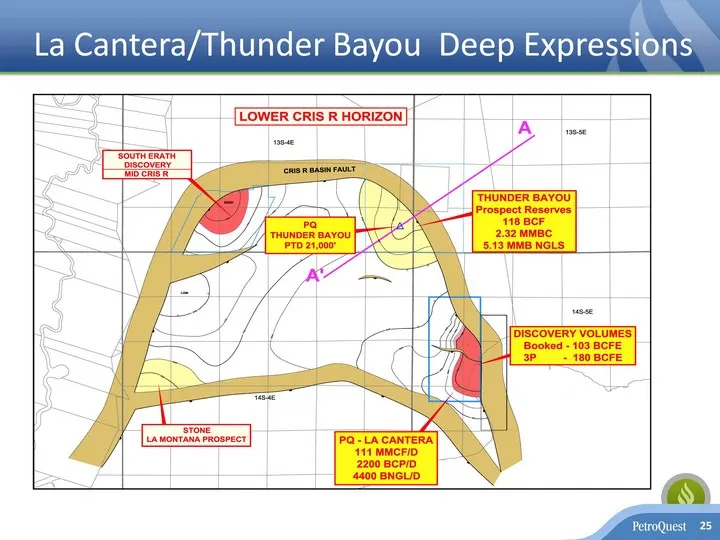
Slide 25: La Cantera/Thunder Bayou Deep Expressions
La Cantera/Thunder Bayou Deep Expressions 25
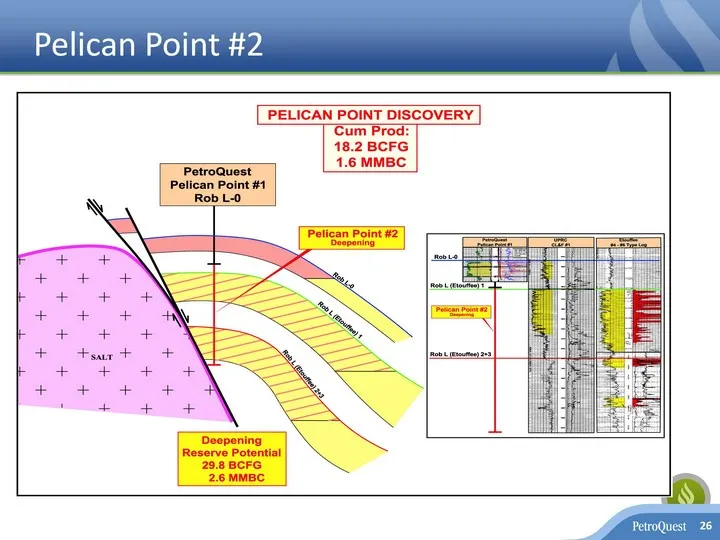
Slide 26: Pelican Point #2
Pelican Point #2 PELICAN POINT DISCOVERY jum Prod: 18.2 BCFG 4.6 MMBC.
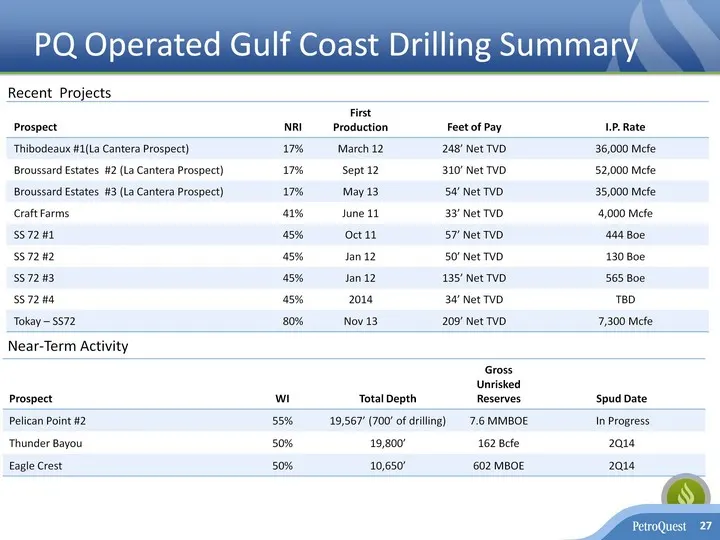
Slide 27: PQ Operated Gulf Coast Drilling Summary
PQ Operated Gulf Coast Drilling Summary PQ Operated Gulf Coast Drilling Summary 27 Prospect NRI First Production Feet of Pay I.P. Rate Thibodeaux #1(La Cantera Prospect) 17% March 12 248' Net TVD 36,000 Mcfe Broussard Estates #2 (La Cantera Prospect) 17% Sept 12 310' Net TVD 52,000 Mcfe Broussard Es
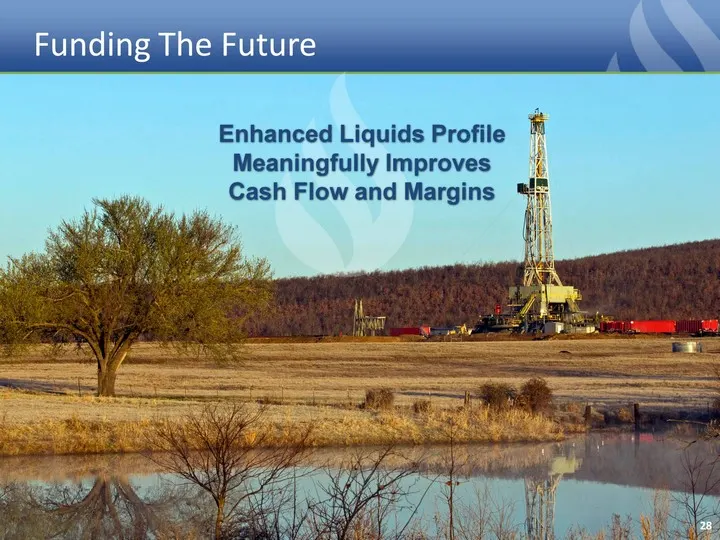
Slide 28: Funding The Future
Funding The Future 28 History of Growth Funded With Cash Flow Total company drilling success rate of 95% Enhanced Liquids Profile Meaningfully Improves Cash Flow and Margins
Slide 29: Accelerating Cash Flow Profile
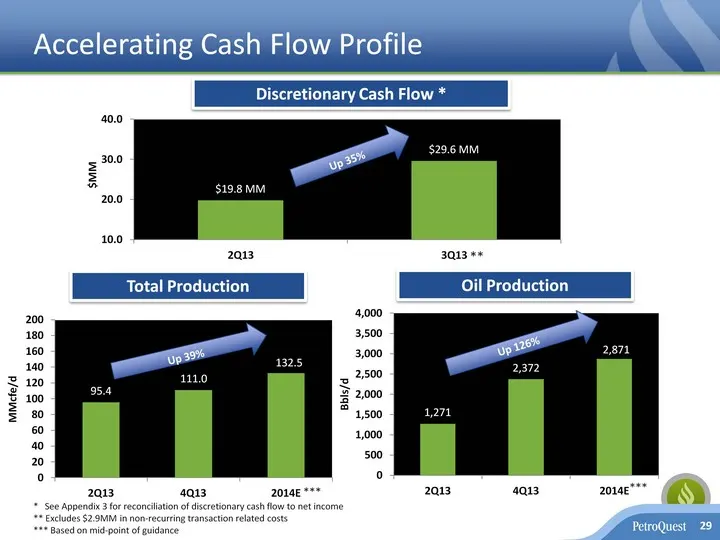
29 Accelerating Cash Flow Profile Discretionary Cash Flow * Total Production Oil Production (CHART) $MM (CHART) MMcfe/d (CHART) Bbls/d Up 126% 29 * See Appendix 3 for reconciliation of discretionary cash flow to net income** Excludes $2.9MM in non-recurring transaction related costs*** Based on mid-
Slide 30: Liquids Production Will Drive Cash Margin Expansion
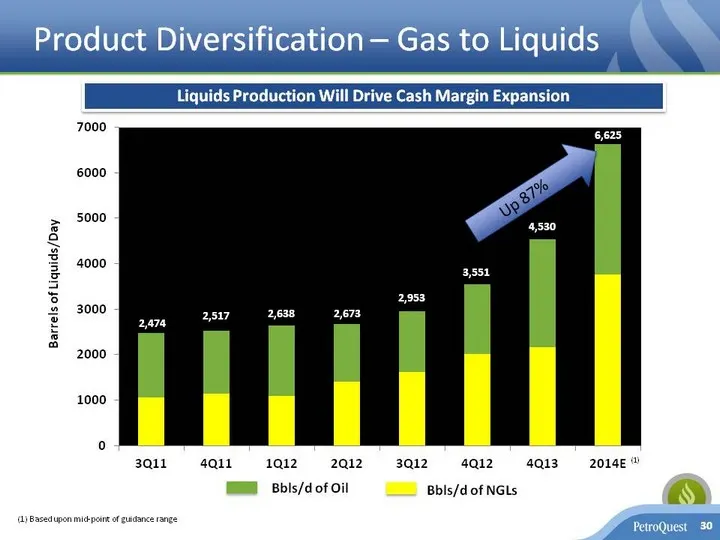
Barrels of Liquids/Day Liquids Production Will Drive Cash Margin Expansion 7000 6000 5000 4000 3000 2000 1000 3Q114Q11._—=s1qi2_—s-2Q12,3Q12_—4Ql2_—-4q13.—_2014e Bbls/d of Oil Bbls/d of NGLs
Slide 31: Debt Metrics - Poised for Improvement with Growing Cash Flow Profile
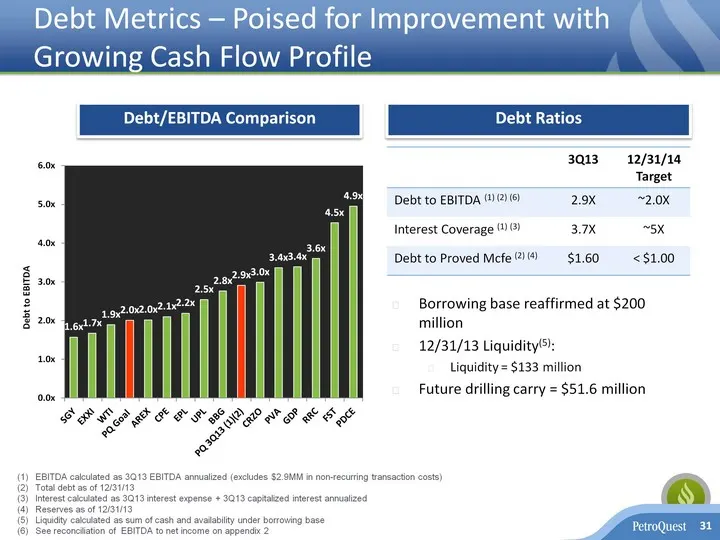
Debt Metrics - Poised for Improvement with Growing Cash Flow Profile 31 Debt/EBITDA Comparison Debt/EBITDA Comparison EBITDA calculated as 3Q13 EBITDA annualized (excludes $2.9MM in non-recurring transaction costs)Total debt as of 12/31/13Interest calculated as 3Q13 interest expense + 3Q13 capitaliz
Slide 32: Capital Investment Program (Liquids Focused)
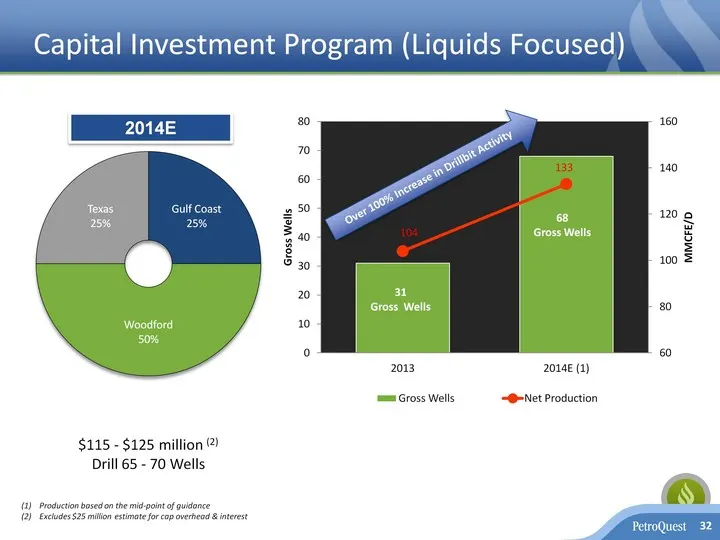
Capital Investment Program (Liquids Focused) 32 2014E $115 - $125 million (2)Drill 65 - 70 Wells Production based on the mid-point of guidanceExcludes $25 million estimate for cap overhead & interest (CHART) (CHART) Over 100% Increase in Drillbit Activity
Slide 33: Committed to Fund Drilling with Cash Flow
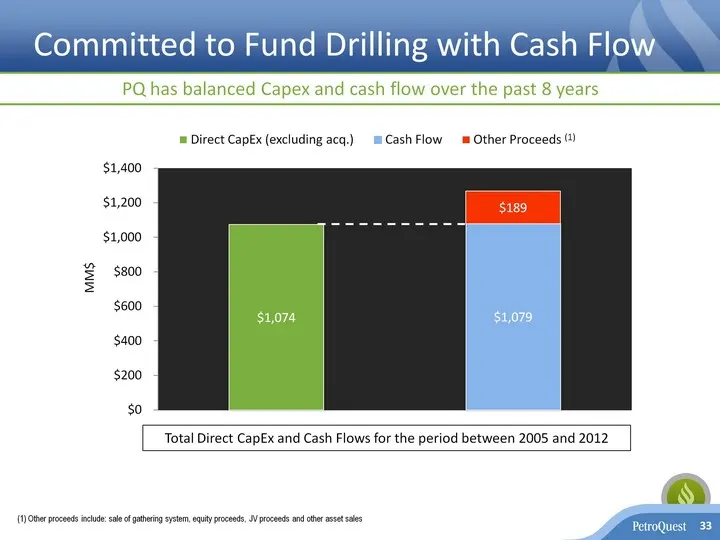
Committed to Fund Drilling with Cash Flow 33 MM$ Total Direct CapEx and Cash Flows for the period between 2005 and 2012 PQ has balanced Capex and cash flow over the past 8 years (1) (1) Other proceeds include: sale of gathering system, equity proceeds, JV proceeds and other asset sales (CHART)
Slide 34: The Opportunity
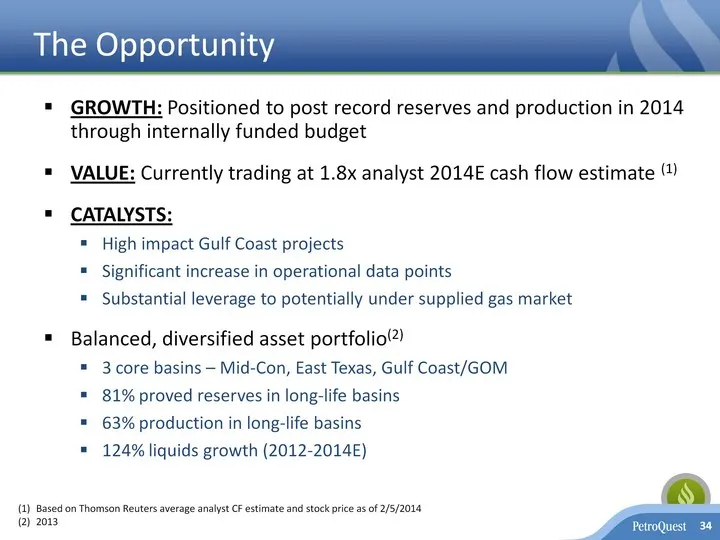
The Opportunity GROWTH: Positioned to post record reserves and production in 2014 through internally funded budgetVALUE: Currently trading at 1.8x analyst 2014E cash flow estimate (1)CATALYSTS: High impact Gulf Coast projectsSignificant increase in operational data points Substantial leverage to pot
Slide 35: Appendix
Appendix 35
Slide 36: Appendix - Hedging Positions
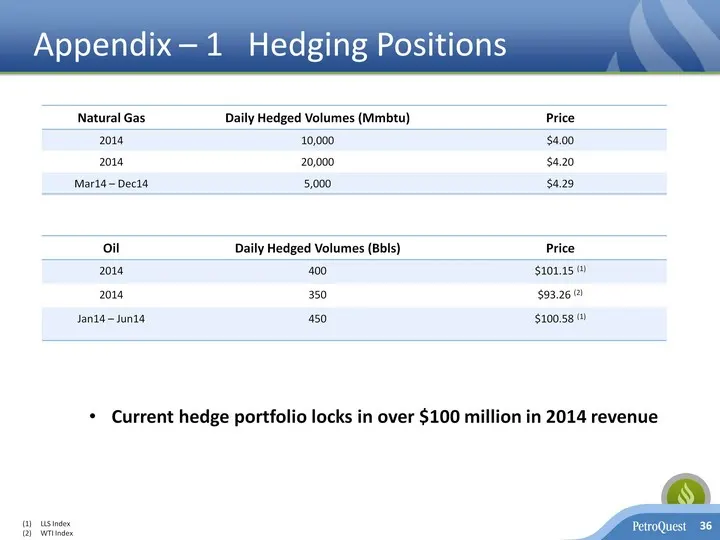
Appendix - 1 Hedging Positions 36 Natural Gas Daily Hedged Volumes (Mmbtu) Price 2014 10,000 $4.00 2014 20,000 $4.20 Mar14 - Dec14 5,000 $4.29 Oil Daily Hedged Volumes (Bbls) Price 2014 400 $101.15 (1) 2014 350 $93.26 (2) Jan14 - Jun14 450 $100.58 (1) LLS IndexWTI Index Current hedge portfolio locks
Slide 37: Appendix - Adjusted EBITDA Definition
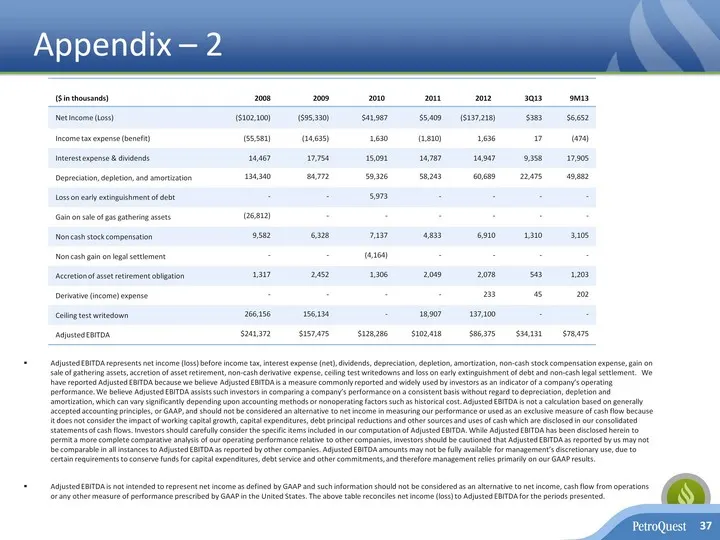
Appendix - 2 Adjusted EBITDA represents net income (loss) before income tax, interest expense (net), dividends, depreciation, depletion, amortization, non-cash stock compensation expense, gain on sale of gathering assets, accretion of asset retirement, non-cash derivative expense, ceiling test write
Slide 38: Appendix - Discretionary Cash Flow Reconciliation
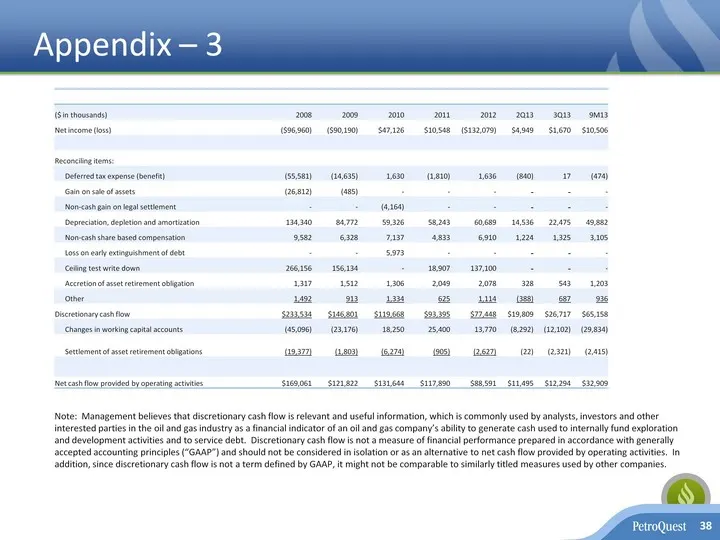
Appendix - 3 ($ in thousands) 2008 2009 2010 2011 2012 2Q13 3Q13 9M13 Net income (loss) ($96,960) ($90,190) $47,126 $10,548 ($132,079) $4,949 $1,670 $10,506 Reconciling items: Deferred tax expense (benefit) (55,581) (14,635) 1,630 (1,810) 1,636 (840) 17 (474) Gain on sale of assets (26,812) (485) -
Slide 39: Appendix - GOM Assets Acquired
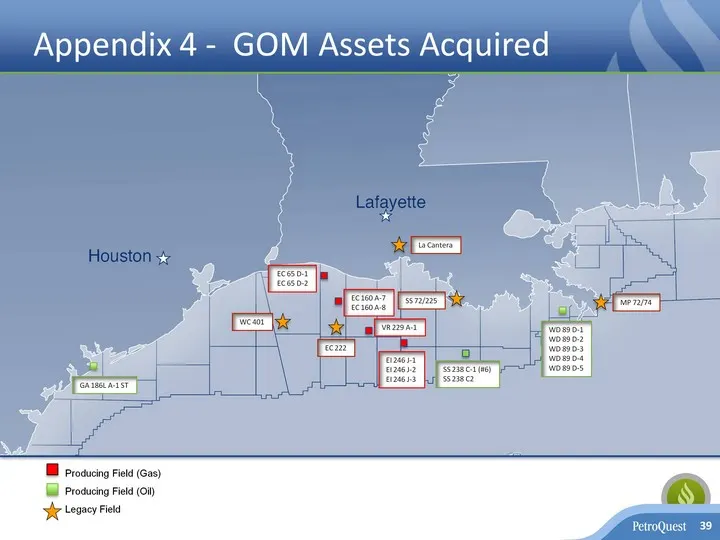
Appendix 4 - GOM Assets Acquired 39 Producing Field (Gas)Producing Field (Oil)Legacy Field WD 89 D-1WD 89 D-2WD 89 D-3WD 89 D-4WD 89 D-5 GA 186L A-1 ST MP 72/74 WC 401 EC 222 La Cantera SS 72/225 SS 238 C-1 (#6)SS 238 C2 EI 246 J-1EI 246 J-2EI 246 J-3 VR 229 A-1 EC 160 A-7EC 160 A-8 EC 65 D-1 EC 65
Slide 40: Appendix - Acquisition Overview
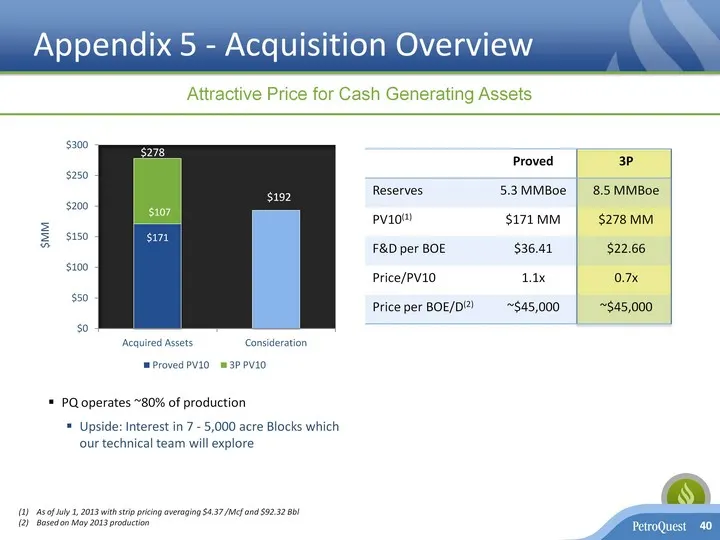
Proved 3P Reserves 5.3 MMBoe 8.5 MMBoe PV10(1) $171 MM $278 MM F&D per BOE $36.41 $22.66 Price/PV10 1.1x 0.7x Price per BOE/D(2) ~$45,000 ~$45,000 Appendix 5 - Acquisition Overview Appendix 5 - Acquisition Overview 40 PQ operates ~80% of productionUpside: Interest in 7 - 5,000 acre Blocks which our
Slide 41: Appendix - History of Positive Reserve Revisions
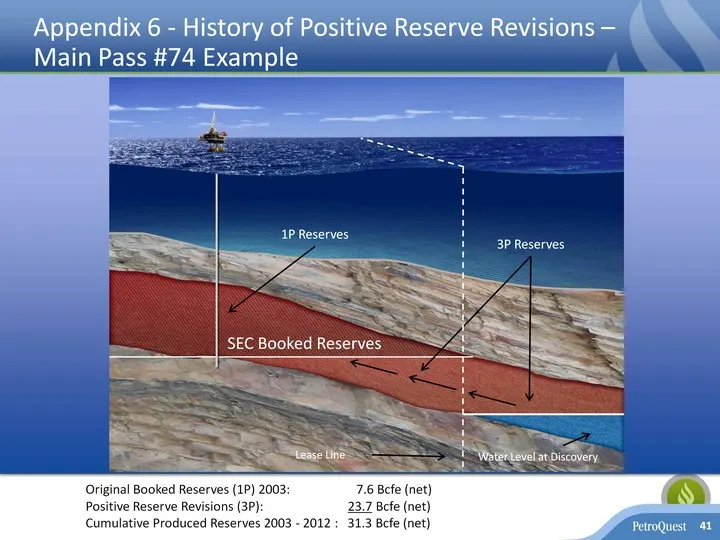
Appendix 6 - History of Positive Reserve Revisions - Main Pass #74 Example 41 1P Reserves 3P Reserves Lease Line Water Level at Discovery SEC Booked Reserves Original Booked Reserves (1P) 2003: 7.6 Bcfe (net) Positive Reserve Revisions (3P): 23.7 Bcfe (net)Cumulative Produced Reserves 2003 - 2012 :
Slide 42: Appendix - Woodford JV Transaction Summary
Appendix 7 - Woodford JV Transaction Summary Woodford JV closed May 2010 whereby partner received 29 Bcfe of PUD reserves and right to earn 50% of Woodford acreageReceived cash payments totaling $88.0 millionThrough 12/31/13 have utilized drilling carry totaling $95.0 millionAt 12/31/13 - $51.6 mill
Slide 43: Appendix - PQ Woodford Performance
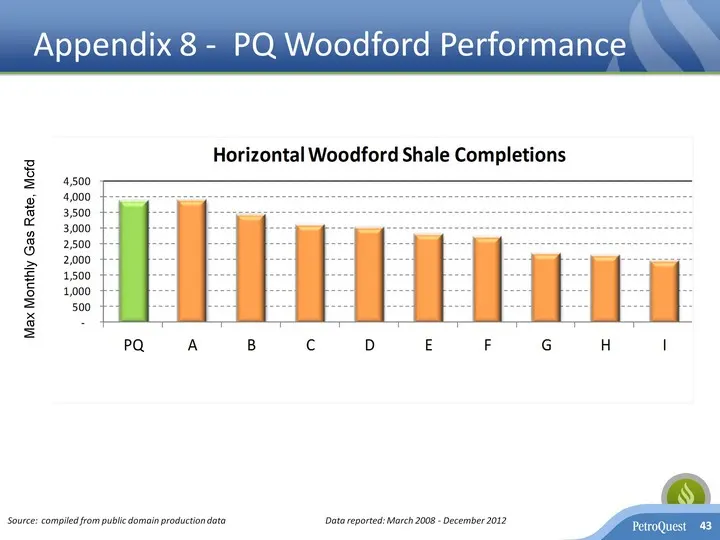
Source: compiled from public domain production data Data reported: March 2008 - December 2012 Max Monthly Gas Rate, Mcfd Appendix 8 - PQ Woodford Performance 43
Slide 44: Appendix - La Cantera Development
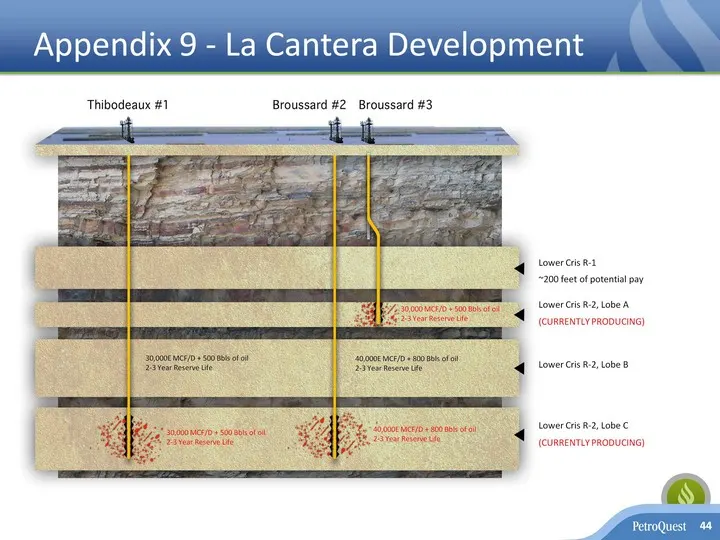
Appendix 9 - La Cantera Development 44 40,000 MCF/D + 740 Bbls of oil2-3 Year Reserve Life 30,000E MCF/D + 500 Bbls of oil2-3 Year Reserve Life 40,000E MCF/D + 800 Bbls of oil2-3 Year Reserve Life 30,000 MCF/D + 500 Bbls of oil2-3 Year Reserve Life 30,000 MCF/D + 500 Bbls of oil2-3 Year Reserve Life
Slide 45: Appendix - Panola County Cotton Valley - Room to Run
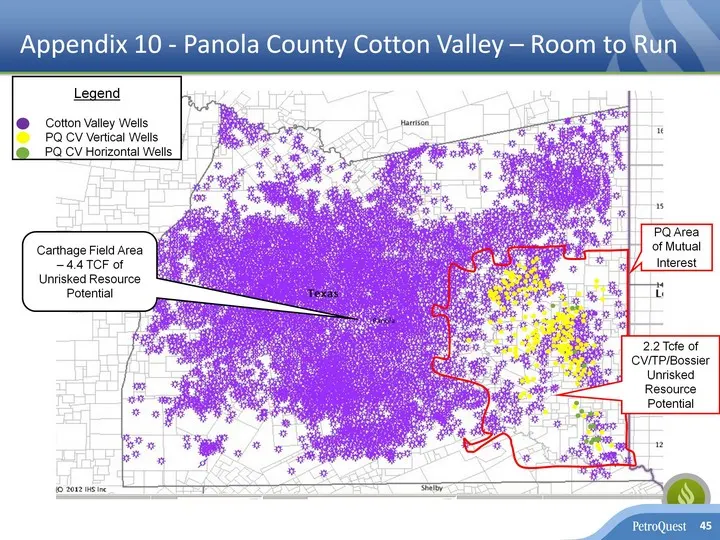
Appendix 10 - Panola County Cotton Valley - Room to Run Appendix 10 - Panola County Cotton Valley - Room to Run 45 LegendCotton Valley Wells PQ CV Vertical Wells PQ CV Horizontal Wells PQ Area of Mutual Interest Carthage Field Area - 4.4 TCF of Unrisked Resource Potential 2.2 Tcfe of CV/TP/BossierUn
Slide 46: Appendix - Woodford Well Economics (Without JV Promote)
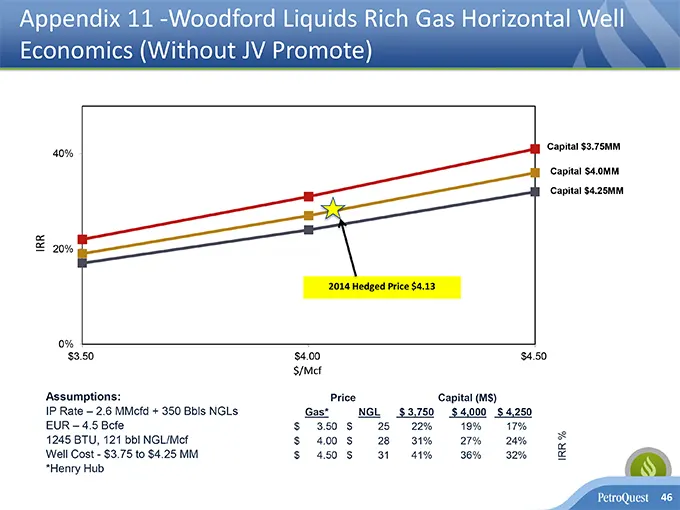
Appendix 11 -Woodford Liquids Rich Gas Horizontal Well Economics (Without JV Promote) i ‘Capital $3.75 Capita S4.0mm ‘Capital 4.25mi = 20% 0% $3.50 $400 $450 S/Met ‘Assumptions: Price ‘Capital (Ms) IP Rate ~ 2.6 MMefd + 350 Bbls NGLs EUR -4.5Bcfe $380 S 25 22% | 18% 17% 1245 BTU, 121 bbINGLIMct S$ 4
Slide 47: East Kaliste Saloom Road, Suite 6000 Lafayette, Louisiana 70508 Phone: (337) 232-7028 Fax: (337)
400 East Kaliste Saloom Road, Suite 6000 Lafayette, Louisiana 70508 Phone: (337) 232-7028 Fax: (337) 232-0044 www.petroquest.comNYSE: PQ 47
Source: SEC EDGAR · 8-K filed Feb 18, 2014
More decks from PetroQuest Energy Inc
 Corporate Update (June 2019)15 slides · Jun 19, 2019
 Investor Presentation (November 2018)16 slides · Nov 7, 2018
 Investor Presentation (July 2018)29 slides · Jul 10, 2018
 Investor Presentation (December 2017)6 slides · Dec 20, 2017
 Investor Presentation (January 2017)28 slides · Jan 9, 2017
 Investor Presentation (April 2016)29 slides · Apr 5, 2016