Ascena Retail — Investor Day (January 2017)
133 slides from Ascena Retail's investor day presentation, Jan 18, 2017
Slide 1: 2017 Investor Day
January 18, 2017 2017 Investor Day
Slide 2: Safe harbor statement – reconciliation of non-GAAP measures
2 Safe harbor statement – reconciliation of non - GAAP measures This presentation contains forward - looking statements within the meaning of the Private Securities Litigation Reform Act of 1995 . Forward - looking statements are based on current expectations and are indicated by words or phrases su
Slide 3: Agenda
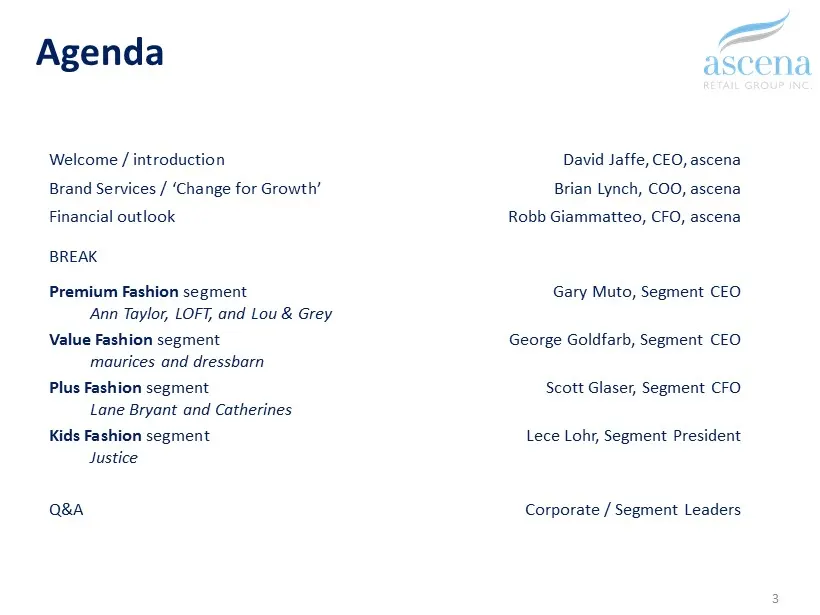
3 Agenda Welcome / introduction David Jaffe, CEO, ascena Brand Services / ‘Change for Growth’ Brian Lynch, COO, ascena Financial outlook Robb Giammatteo, CFO, ascena BREAK Premium Fashion segment Gary Muto, Segment CEO Ann Taylor, LOFT, and Lou & Grey Value Fashion segment George Goldfarb, Segment C
Slide 4: David Jaffe, Chief Executive Officer
David Jaffe Chief Executive Officer
Slide 5: Investment highlights
Investment highlights • Largest specialty apparel retailer focused exclusively on women and girls • Diversified portfolio of brands, customers, and real estate • Efficient, scalable shared services platform • Positioned to navigate dramatic industry change • Strong cash flow and liquidity 5
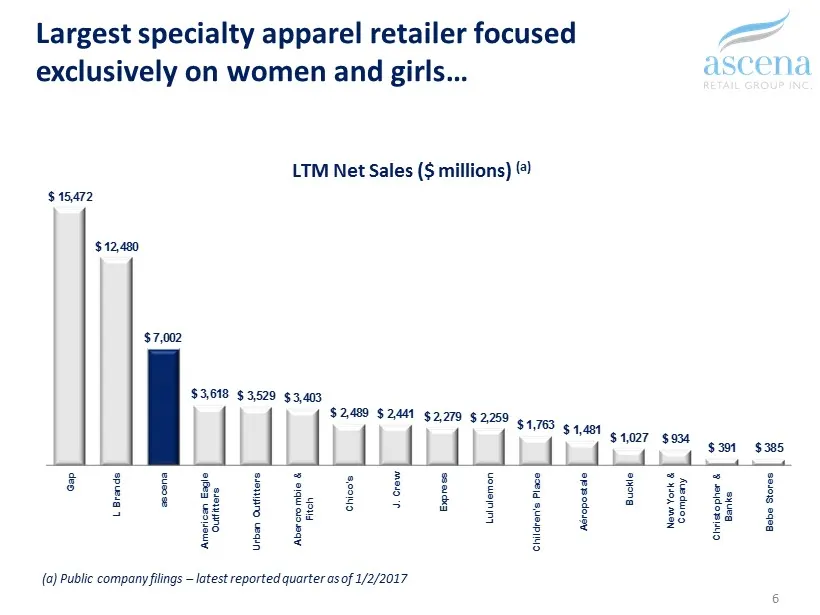
Slide 6: Largest specialty apparel retailer focused exclusively on women and girls
$ 15,472 $ 12,480 $ 7,002 $ 3,618 $ 3,529 $ 3,403 $ 2,489 $ 2,441 $ 2,279 $ 2,259 $ 1,763 $ 1,481 $ 1,027 $ 934 $ 391 $ 385 Gap L Brands ascena American Eagle Outfitters Urban Outfitters Abercrombie & Fitch Chico's J. Crew Express Lululemon Children's Place Aéropostale Buckle New York & Company Chri
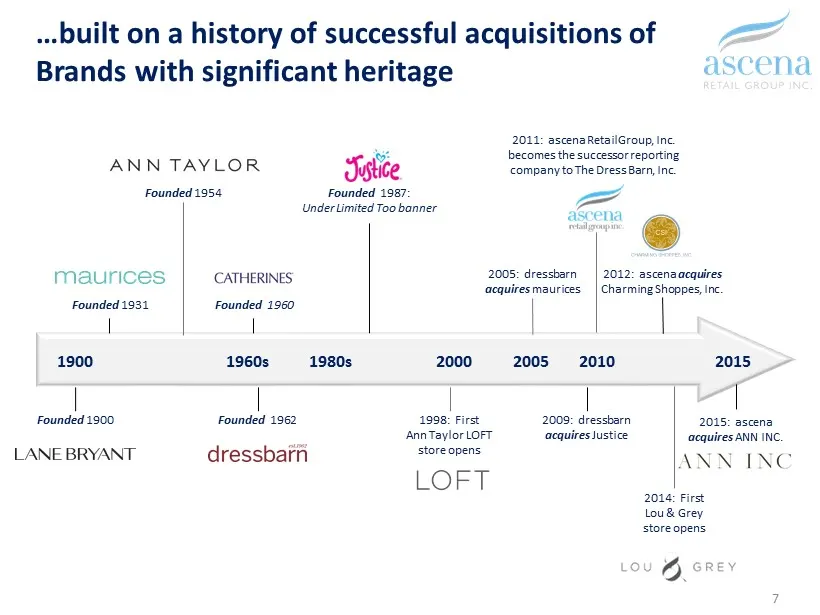
Slide 7: Built on a history of successful acquisitions of brands with heritage
7 …built on a history of successful acquisitions of Brands with significant heritage Founded 1931 Founded 1962 Founded 1987 : Under Limited Too banner 2009: dressbarn acquires Justice 2005: dressbarn acquires maurices 2011: ascena Retail Group, Inc. becomes the successor reporting company to The Dre
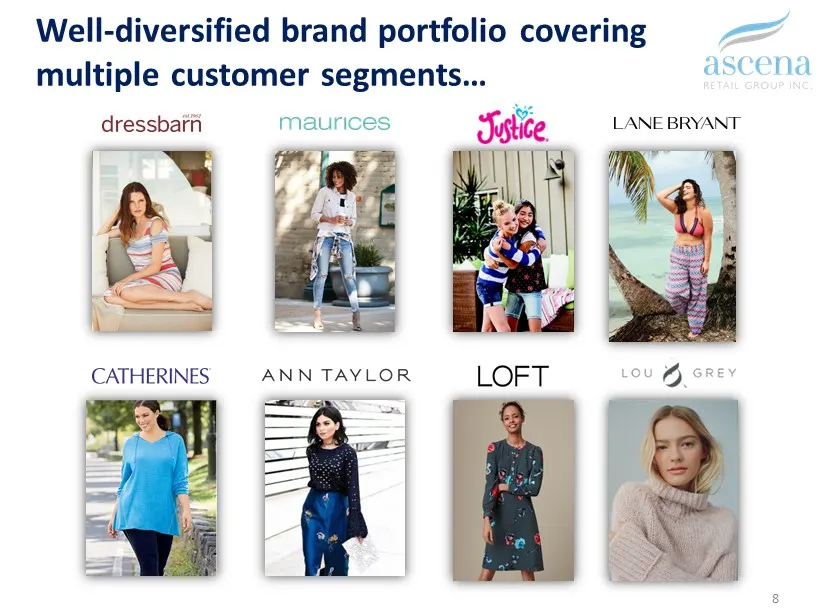
Slide 8: Well-diversified brand portfolio covering multiple customer segments
8 Well - diversified brand portfolio covering multiple customer segments…
Slide 9: Diversified revenue base across multiple real estate formats
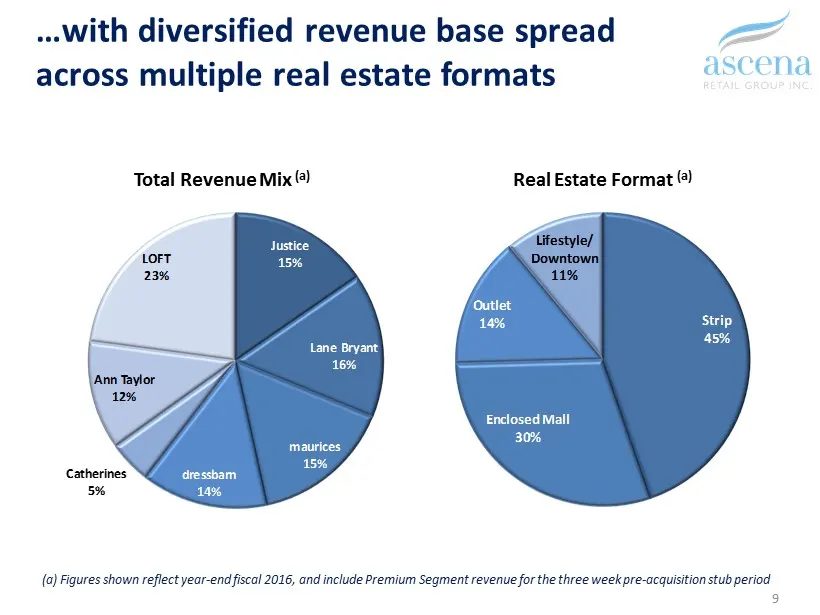
9 …with diversified revenue base spread across multiple real estate formats (a) Figures shown reflect year - end fiscal 2016, and include Premium Segment revenue for the three week pre - acquisition stub period Total Revenue Mix (a) Justice 15% Lane Bryant 16% maurices 15% dressbarn 14% Catherines 5
Slide 10: Scalable shared services platform
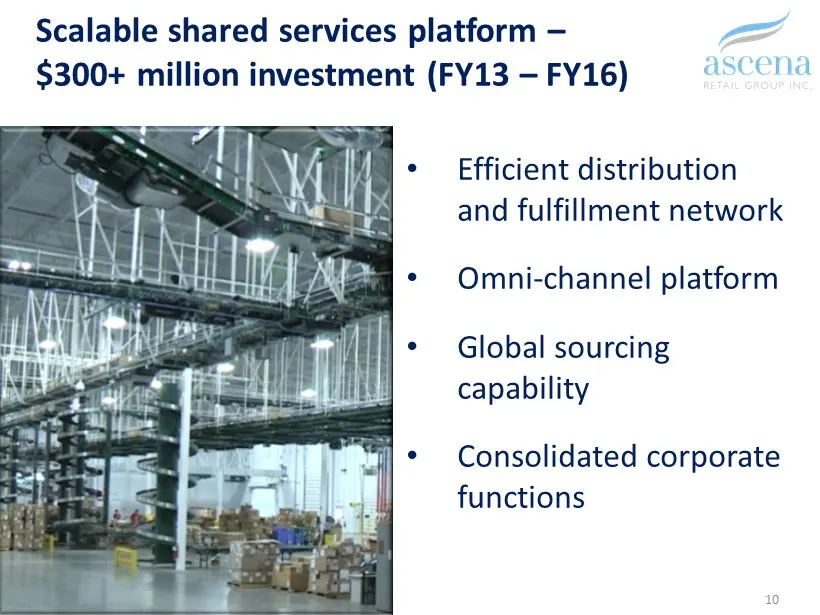
Scalable shared services platform – $300+ million investment (FY13 – FY16) • Efficient distribution and fulfillment network • Omni - channel platform • Global sourcing capability • Consolidated corporate functions 10

Slide 11: Operating Environment
Operating Environment
Slide 12: Widespread consumer changes have impacted our business: spending shift
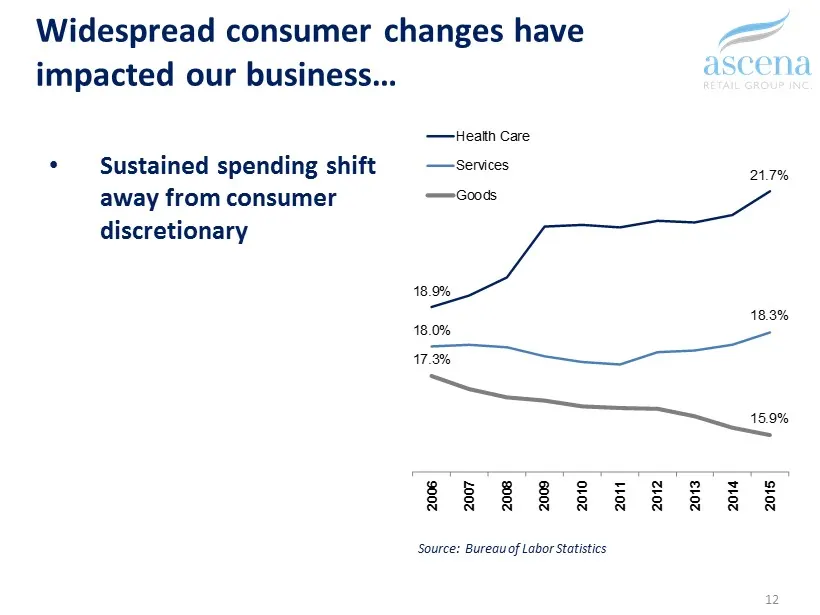
Widespread consumer changes have impacted our business… • Sustained spending shift away from consumer discretionary 12 Source: Bureau of Labor Statistics 18.9% 21.7% 18.0% 18.3% 17.3% 15.9% 2006 2007 2008 2009 2010 2011 2012 2013 2014 2015 Health Care Services Goods
Slide 13: Widespread consumer changes: Amazon effect
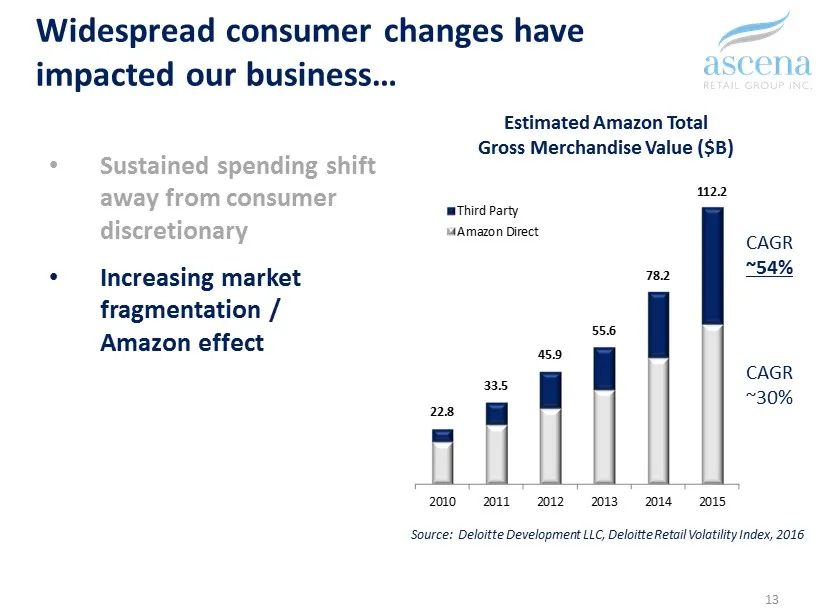
Widespread consumer changes have impacted our business… • Sustained spending shift away from consumer discretionary • Increasing market fragmentation / Amazon effect 13 Source: Deloitte Development LLC, Deloitte Retail Volatility Index, 2016 22.8 33.5 45.9 55.6 78.2 112.2 2010 2011 2012 2013 2014 20
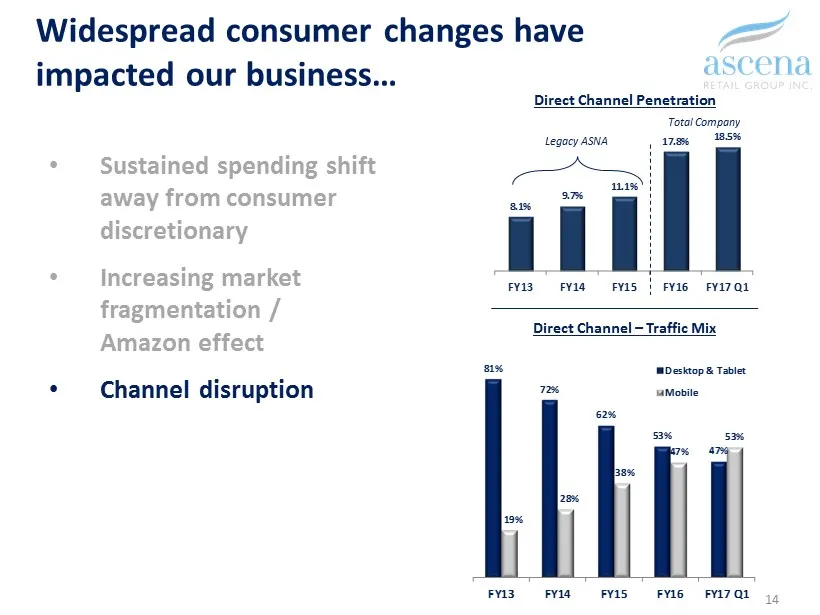
Slide 14: Widespread consumer changes: channel disruption
Widespread consumer changes have impacted our business… • Sustained spending shift away from consumer discretionary • Increasing market fragmentation / Amazon effect • Channel disruption 14 81% 72% 62% 53% 47% 19% 28% 38% 47% 53% FY13 FY14 FY15 FY16 FY17 Q1 Desktop & Tablet Mobile Direct Channel – T
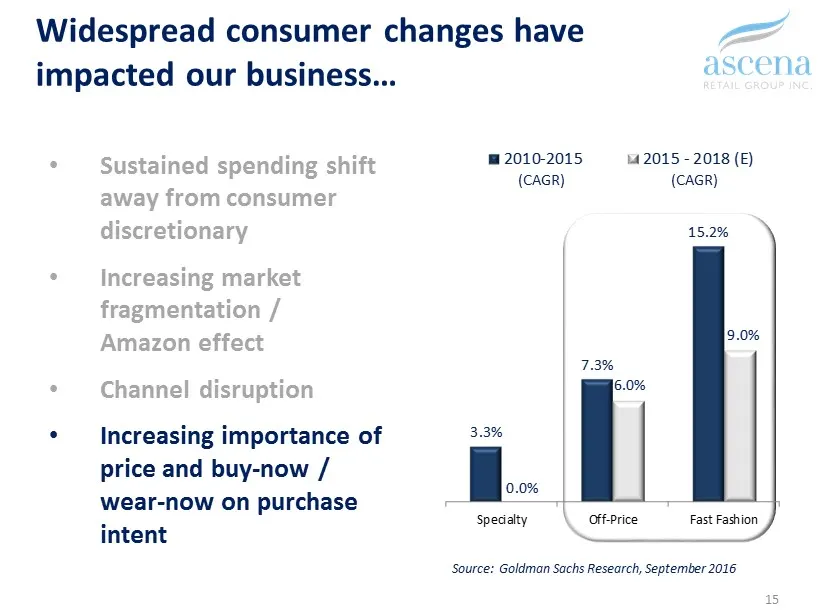
Slide 15: Widespread consumer changes: price and buy-now/wear-now
Widespread consumer changes have impacted our business… • Sustained spending shift away from consumer discretionary • Increasing market fragmentation / Amazon effect • Channel disruption • Increasing importance of price and buy - now / wear - now on purchase intent 15 3.3% 7.3% 15.2% 0.0% 6.0% 9.0%
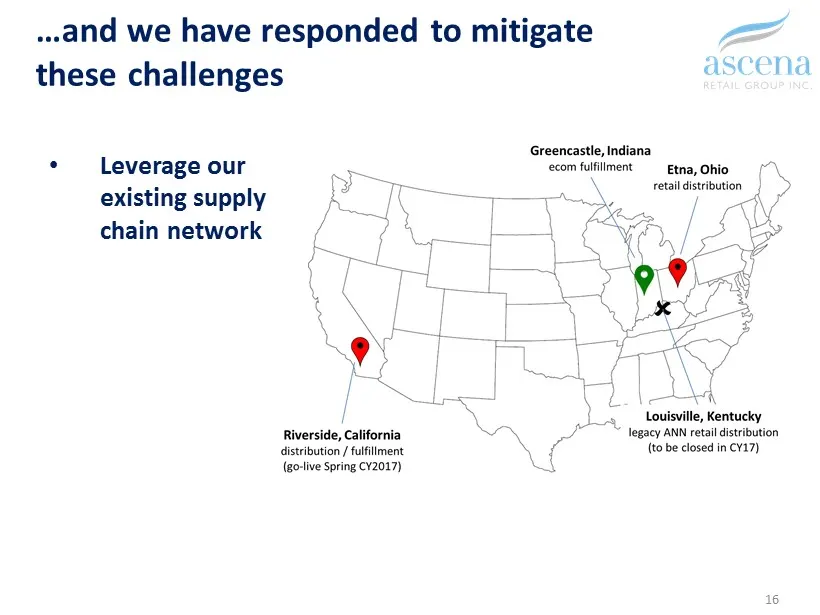
Slide 16: We have responded to mitigate these challenges
…and we have responded to mitigate these challenges • Leverage our existing supply chain network 16
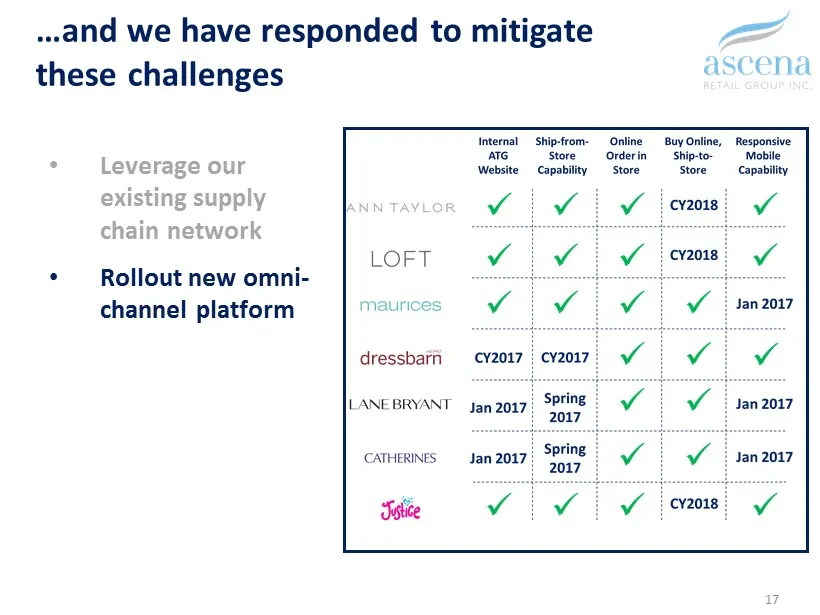
Slide 17: Rollout new omni-channel platform
…and we have responded to mitigate these challenges • Leverage our existing supply chain network • Rollout new omni - channel platform 17
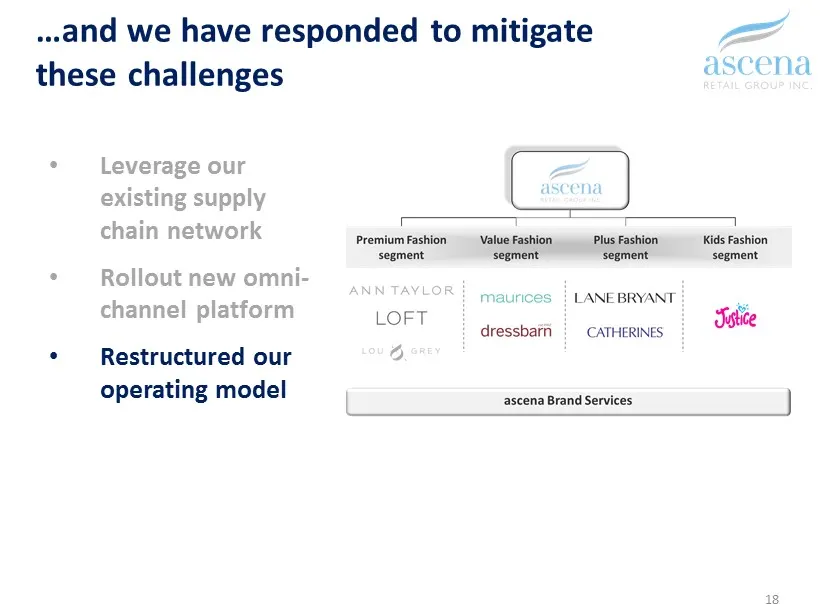
Slide 18: Restructured our operating model
…and we have responded to mitigate these challenges • Leverage our existing supply chain network • Rollout new omni - channel platform • Restructured our operating model 18
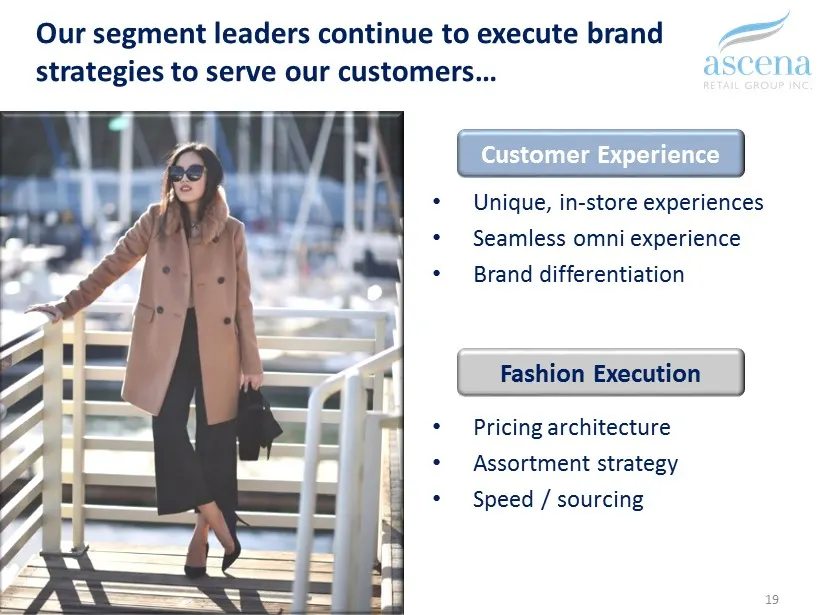
Slide 19: Segment leaders continue to execute brand strategies
• Unique, in - store experiences • Seamless omni experience • Brand differentiation • Pricing architecture • Assortment strategy • Speed / sourcing Our segment leaders continue to execute brand strategies to serve our customers… Fashion Execution Customer Experience 19
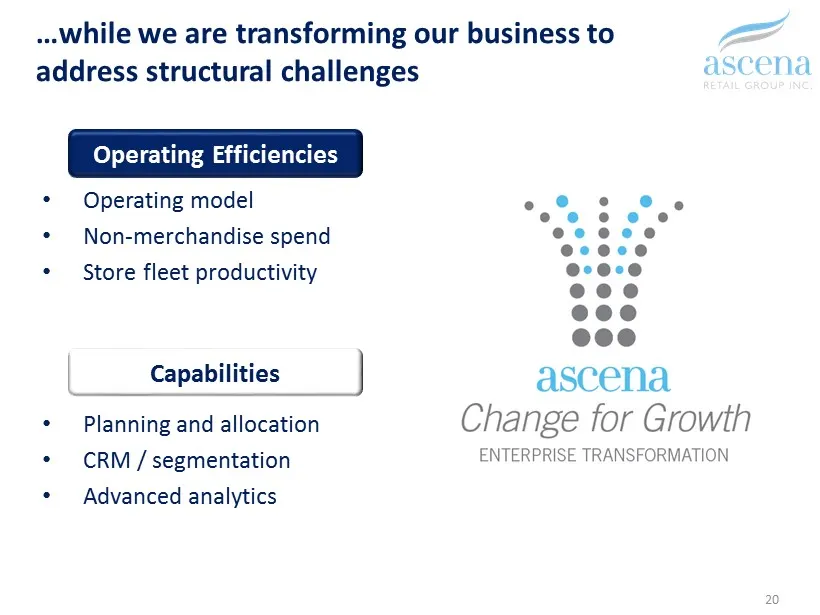
Slide 20: Transforming our business to address structural challenges
…while we are transforming our business to address structural challenges 20 Capabilities Operating Efficiencies • Operating model • Non - merchandise spend • Store fleet productivity • Planning and allocation • CRM / segmentation • Advanced analytics
Slide 21: In closing
In closing… • Our scale, diversification, and platform capabilities differentiate our competitive position • Focused enterprise transformation initiatives grounded in support of our customers • We are responding decisively to structural challenges to our business model 21
Slide 22: Brian Lynch, Chief Operating Officer
Brian Lynch Chief Operating Officer
Slide 23: Goal: evolve from seven $ billion companies into one powerhouse
ONE $ 7 BILLION OUR GOAL IS TO EVOLVE FROM SEVEN $ 1 BILLION COMPANIES INTO POWERHOUSE 23
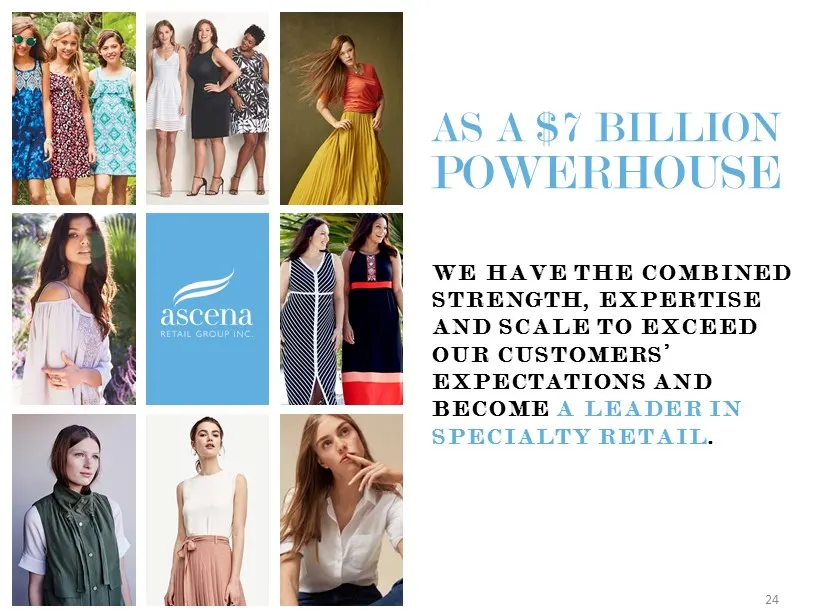
Slide 24: As a $7 billion powerhouse
AS A $7 BILLION POWERHOUSE WE HAVE THE COMBINED STRENGTH, EXPERTISE AND SCALE TO EXCEED OUR CUSTOMERS’ EXPECTATIONS AND BECOME A LEADER IN SPECIALTY RETAIL . 24
Slide 25: We must be exceptional at delivering services and solutions
WE MUST BE GREAT . WE MUST BE EXCEPTIONAL AT DELIVERING SERVICES AND SOLUTIONS TO OUR BRANDS AND CUSTOMERS THAT ARE BETTER, FASTER AND MORE COST EFFICIENT . 25
Slide 26: Centers of Excellence – Brand Services
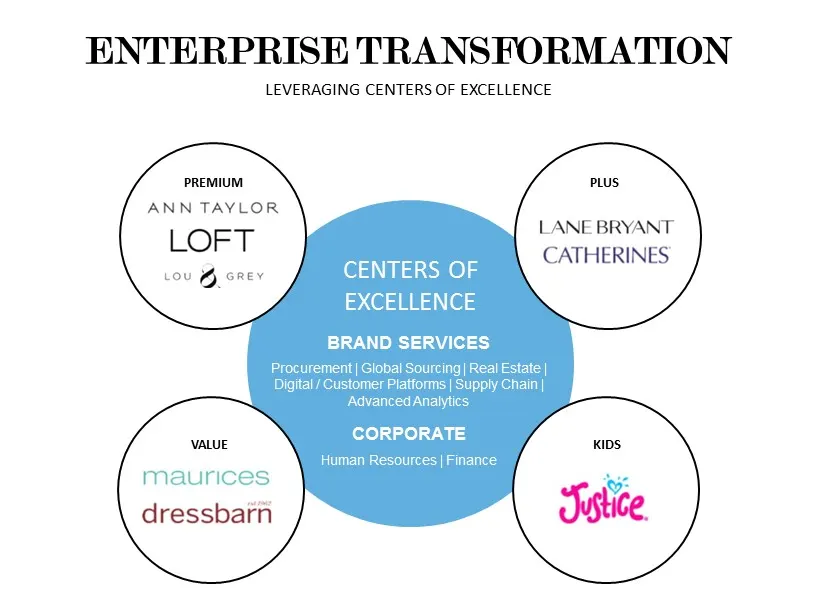
CENTERS OF EXCELLENCE BRAND SERVICES Procurement | Global Sourcing | Real Estate | Digital / Customer Platforms | Supply Chain | Advanced Analytics CORPORATE Human Resources | Finance PREMIUM PLUS VALUE KIDS ENTERPRISE TRANSFORMATION LEVERAGING CENTERS OF EXCELLENCE
Slide 27: Procurement Center of Excellence
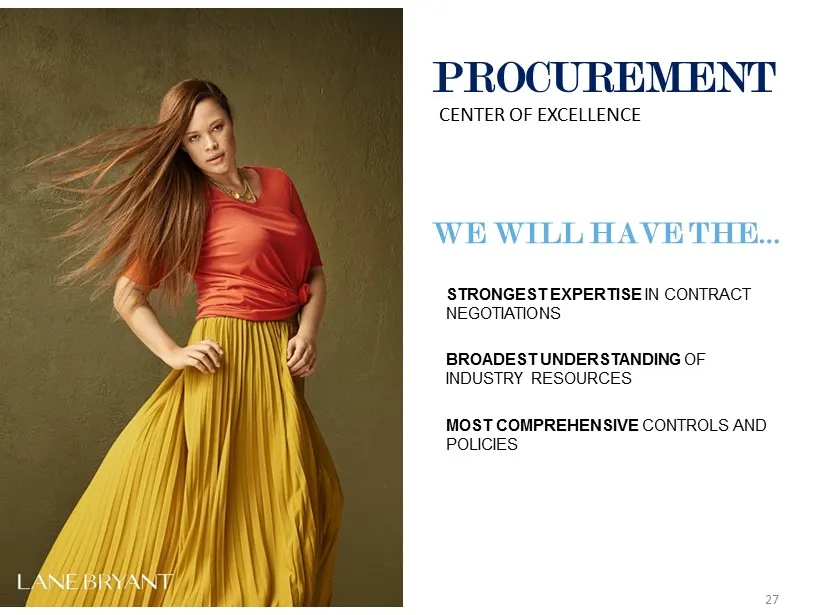
PROCUREMENT 27 CENTER OF EXCELLENCE WE WILL HAVE THE… STRONGEST EXPERTISE IN CONTRACT NEGOTIATIONS BROADEST UNDERSTANDING OF INDUSTRY RESOURCES MOST COMPREHENSIVE CONTROLS AND POLICIES
Slide 28: Global Sourcing Center of Excellence
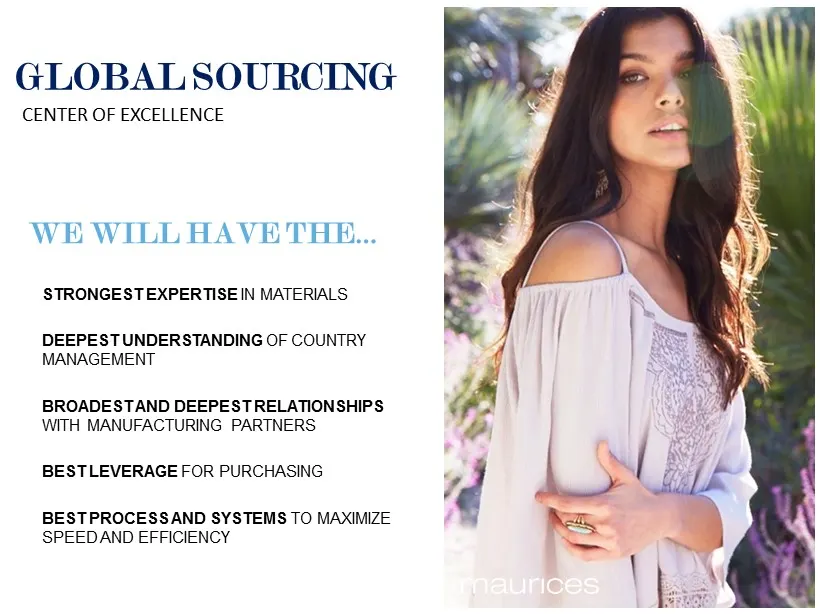
GLOBAL SOURCING 28 CENTER OF EXCELLENCE WE WILL HAVE THE… STRONGEST EXPERTISE IN MATERIALS DEEPEST UNDERSTANDING OF COUNTRY MANAGEMENT BROADEST AND DEEPEST RELATIONSHIPS WITH MANUFACTURING PARTNERS BEST LEVERAGE FOR PURCHASING BEST PROCESS AND SYSTEMS TO MAXIMIZE SPEED AND EFFICIENCY
Slide 29: Real Estate Center of Excellence
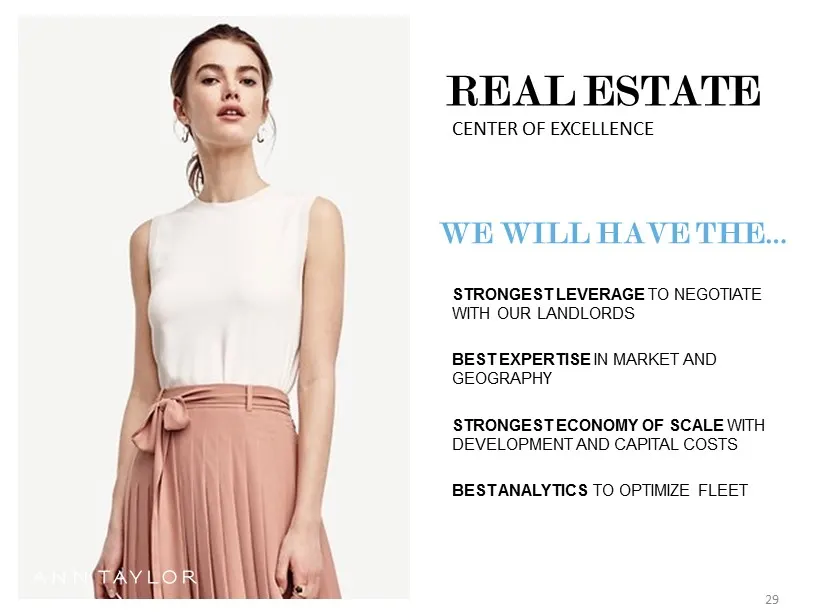
REAL ESTATE CENTER OF EXCELLENCE WE WILL HAVE THE… STRONGEST LEVERAGE TO NEGOTIATE WITH OUR LANDLORDS BEST EXPERTISE IN MARKET AND GEOGRAPHY STRONGEST ECONOMY OF SCALE WITH DEVELOPMENT AND CAPITAL COSTS BEST ANALYTICS TO OPTIMIZE FLEET 29
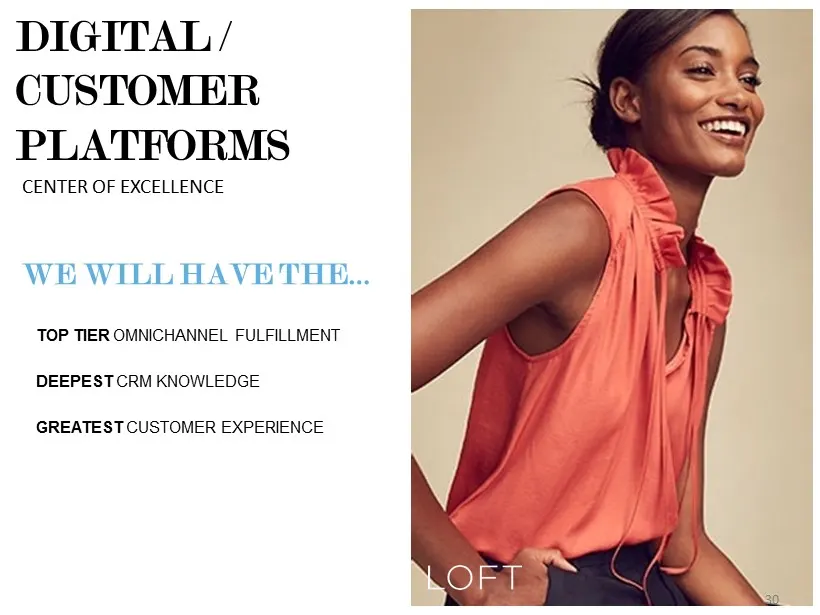
Slide 30: Digital / Customer Platforms Center of Excellence
WE WILL HAVE THE… TOP TIER OMNICHANNEL FULFILLMENT DEEPEST CRM KNOWLEDGE GREATEST CUSTOMER EXPERIENCE DIGITAL / CUSTOMER PLATFORMS CENTER OF EXCELLENCE 30
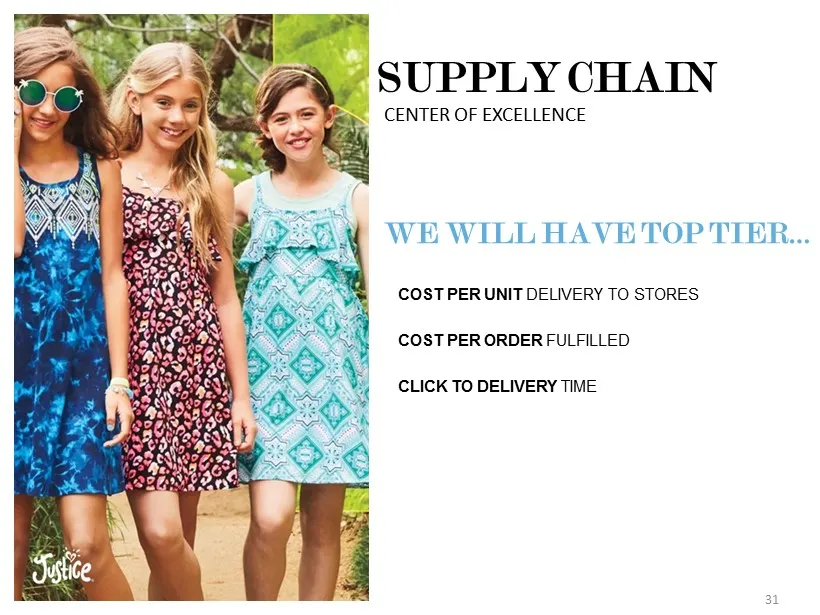
Slide 31: Supply Chain Center of Excellence
WE WILL HAVE TOP TIER… COST PER UNIT DELIVERY TO STORES COST PER ORDER FULFILLED CLICK TO DELIVERY TIME SUPPLY CHAIN CENTER OF EXCELLENCE 31
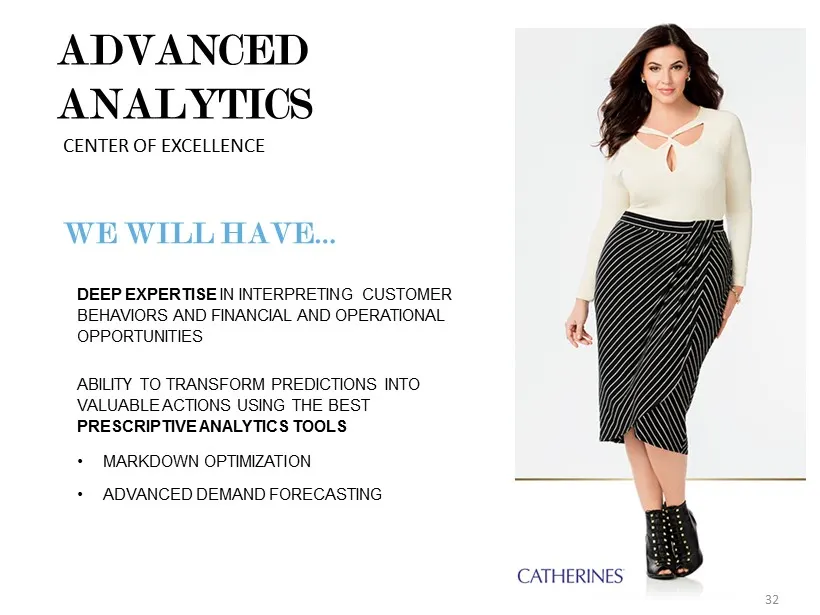
Slide 32: Advanced Analytics Center of Excellence
WE WILL HAVE… DEEP EXPERTISE IN INTERPRETING CUSTOMER BEHAVIORS AND FINANCIAL AND OPERATIONAL OPPORTUNITIES ABILITY TO TRANSFORM PREDICTIONS INTO VALUABLE ACTIONS USING THE BEST PRESCRIPTIVE ANALYTICS TOOLS • MARKDOWN OPTIMIZATION • ADVANCED DEMAND FORECASTING ADVANCED ANALYTICS CENTER OF EXCELLENCE
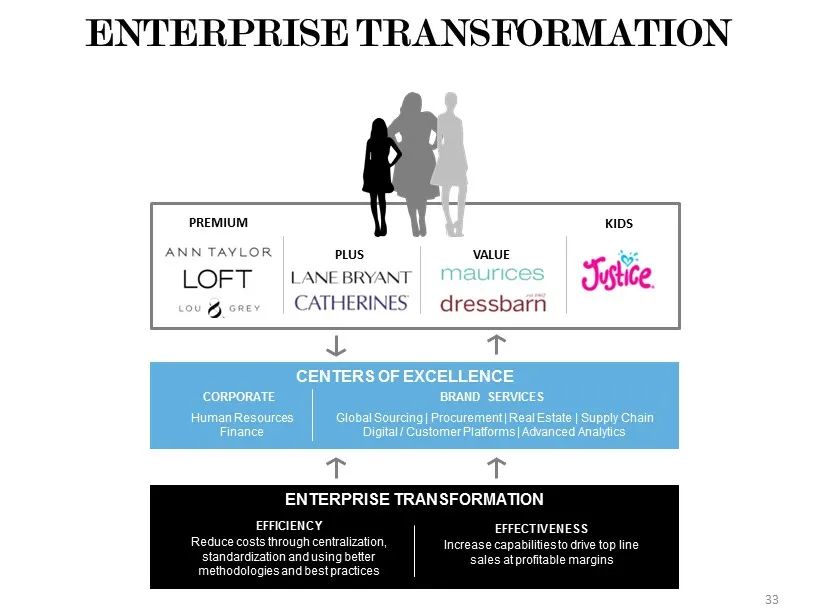
Slide 33: Enterprise transformation effectiveness and efficiency
ENTERPRISE TRANSFORMATION EFFECTIVENESS Increase capabilities to drive top line sales at profitable margins BRAND SERVICES Global Sourcing | Procurement | Real Estate | Supply Chain Digital / Customer Platforms | Advanced Analytics CORPORATE Human Resources Finance CENTERS OF EXCELLENCE EFFICIENCY R
Slide 34: Robb Giammatteo, Chief Financial Officer
Robb Giammatteo Chief Financial Officer
Slide 35: Key financial drivers
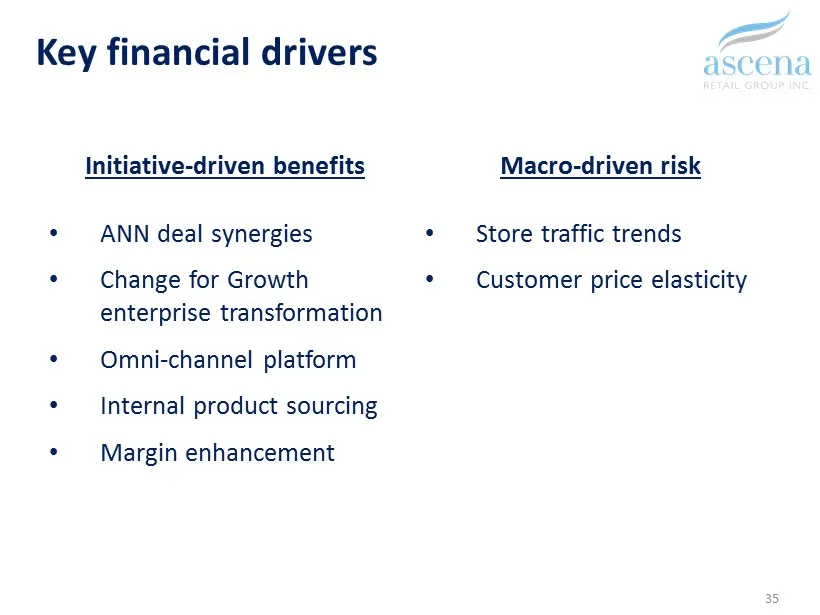
Key financial drivers Initiative - driven benefits • ANN deal synergies • Change for Growth enterprise transformation • Omni - channel platform • Internal product sourcing • Margin enhancement Macro - driven risk • Store traffic trends • Customer price elasticity 35
Slide 36: ANN deal synergies / cost savings – tracking to expectations
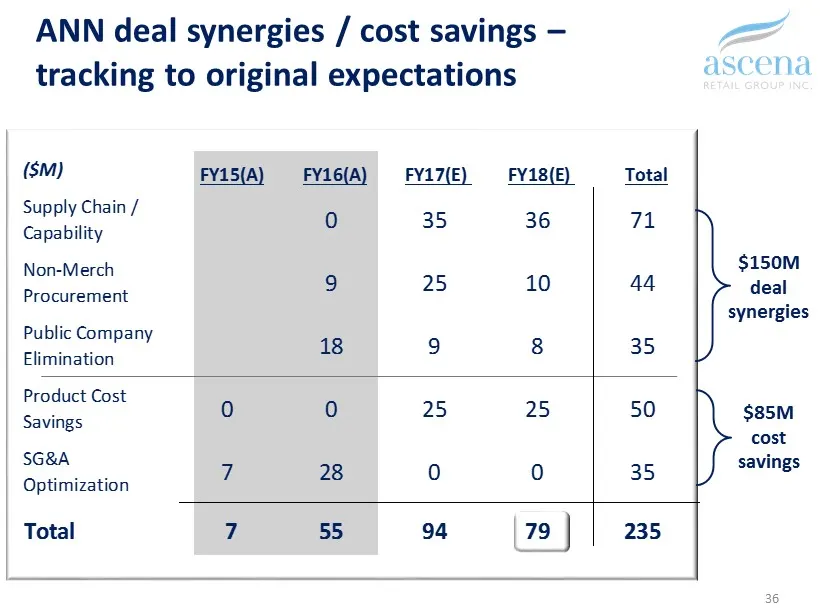
36 ANN deal synergies / cost savings – tracking to original expectations $150M deal synergies $85M cost savings ($M) FY15(A) FY16(A) FY17(E) FY18(E) Total Supply Chain / Capability 0 35 36 71 Non-Merch Procurement 9 25 10 44 Public Company Elimination 18 9 8 35 Product Cost Savings 0 0 25 25 50 SG&A
Slide 37: Enterprise transformation cost savings – at least $150 million by fiscal 2019
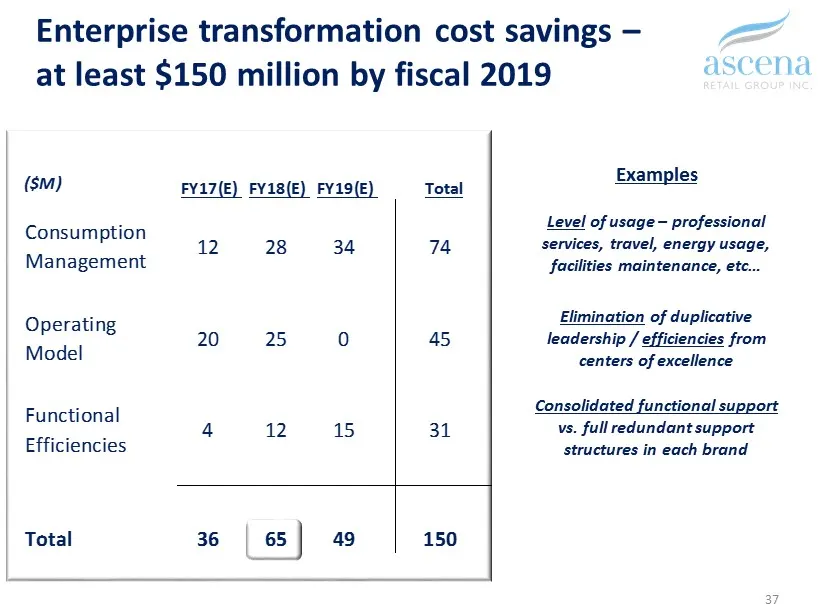
Enterprise transformation cost savings – at least $150 million by fiscal 2019 37 ($M) FY17(E) FY18(E) FY19(E) Total Consumption Management 12 28 34 74 Operating Model 20 25 0 45 Functional Efficiencies 4 12 15 31 Total 36 65 49 150 Examples Level of usage – professional services, travel, energy usag
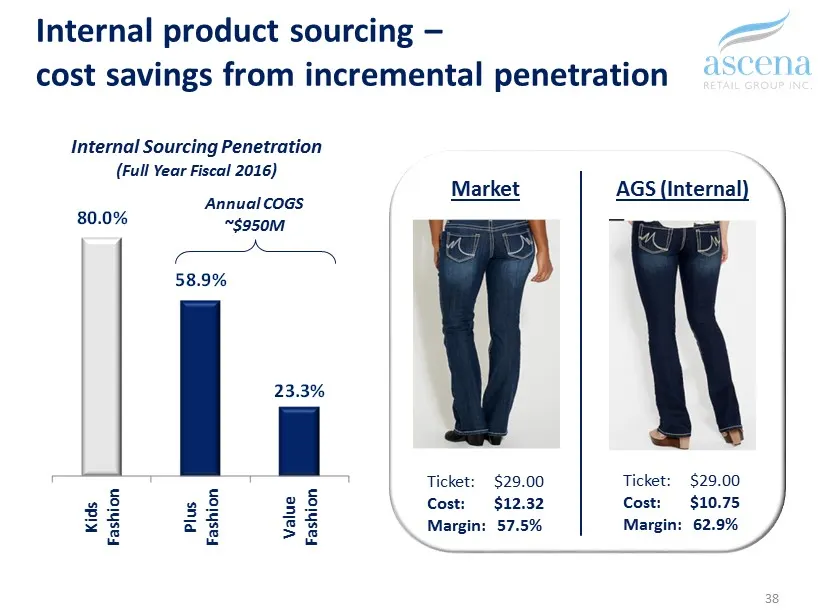
Slide 38: Internal product sourcing – cost savings
38 Internal product sourcing – cost savings from incremental penetration Internal Sourcing Penetration (Full Year Fiscal 2016) 80.0% 58.9% 23.3% Kids Fashion Plus Fashion Value Fashion Annual COGS ~$950M Market Ticket: $29.00 Cost : $12.32 Margin: 57.5% AGS (Internal) Ticket: $29.00 Cost: $ 10.75 Ma
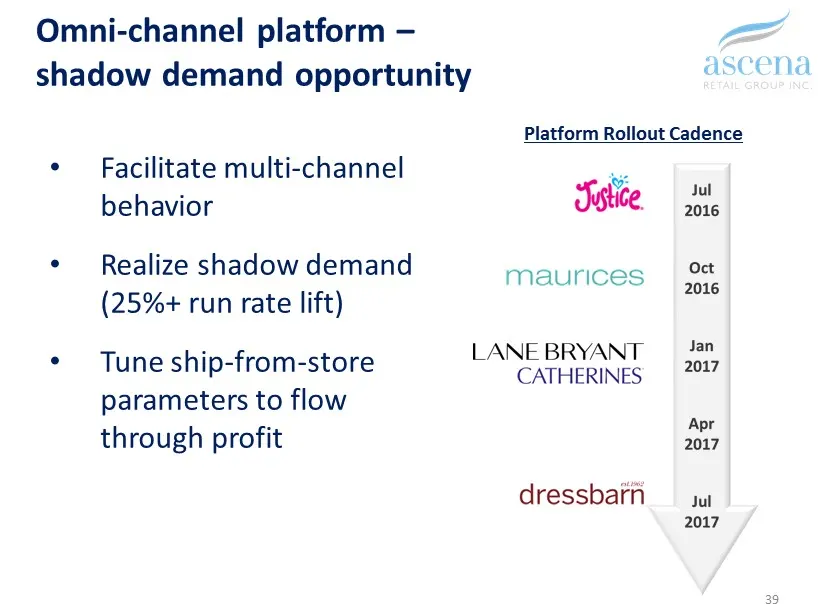
Slide 39: Omni-channel platform – shadow demand opportunity
Omni - channel platform – shadow demand opportunity • Facilitate multi - channel behavior • Realize shadow demand (25%+ run rate lift) • Tune ship - from - store parameters to flow through profit 39 Platform Rollout Cadence
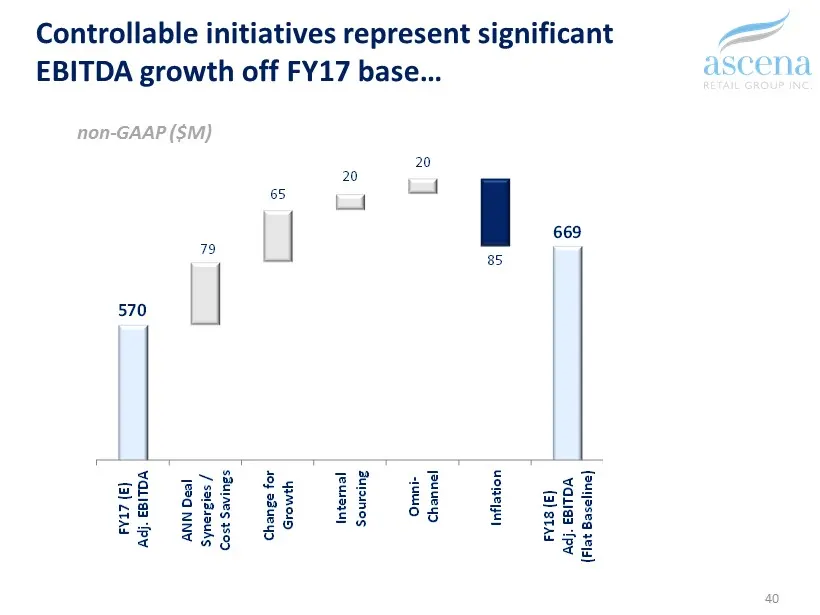
Slide 40: Controllable initiatives represent significant EBITDA growth
570 79 65 20 20 85 669 89 580 FY17 (E) Adj. EBITDA ANN Deal Synergies / Cost Savings Change for Growth Internal Sourcing Omni- Channel Inflation FY18 (E) Adj. EBITDA (Flat Baseline) Baseline Comp Risk FY18 (E) Adj. EBITDA (Trend-Risk) 40 Controllable initiatives represent significant EBITDA growth o
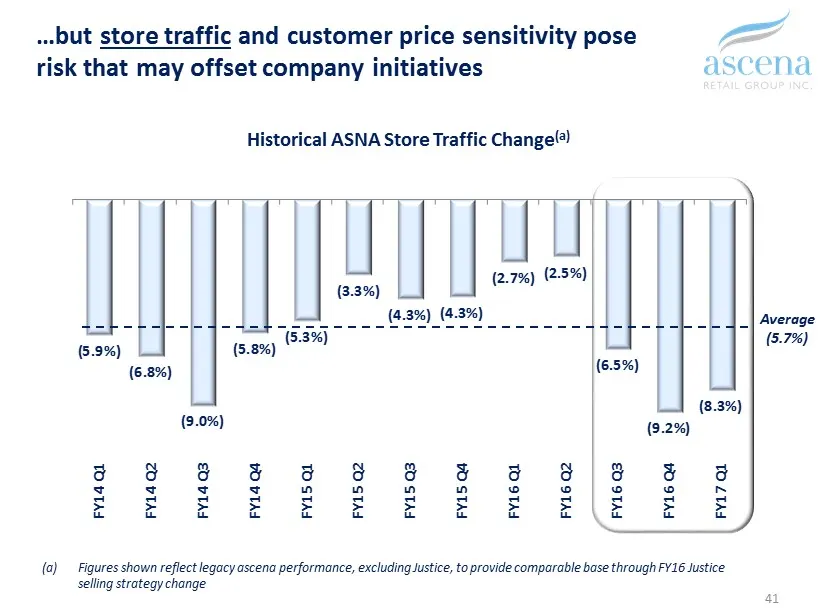
Slide 41: Store traffic and customer price sensitivity pose risk: traffic
(5.9%) (6.8%) (9.0%) (5.8%) (5.3%) (3.3%) (4.3%) (4.3%) (2.7%) (2.5%) (6.5%) (9.2%) (8.3%) FY14 Q1 FY14 Q2 FY14 Q3 FY14 Q4 FY15 Q1 FY15 Q2 FY15 Q3 FY15 Q4 FY16 Q1 FY16 Q2 FY16 Q3 FY16 Q4 FY17 Q1 41 …but store traffic and customer price sensitivity pose risk that may offset company initiatives Histor
Slide 42: Store traffic and customer price sensitivity pose risk: return on visit
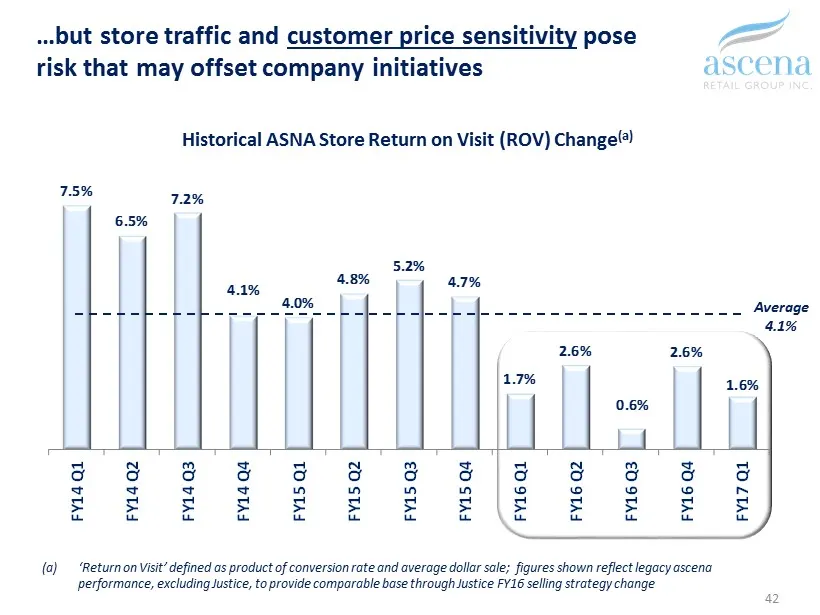
7.5% 6.5% 7.2% 4.1% 4.0% 4.8% 5.2% 4.7% 1.7% 2.6% 0.6% 2.6% 1.6% FY14 Q1 FY14 Q2 FY14 Q3 FY14 Q4 FY15 Q1 FY15 Q2 FY15 Q3 FY15 Q4 FY16 Q1 FY16 Q2 FY16 Q3 FY16 Q4 FY17 Q1 42 …but store traffic and customer price sensitivity pose risk that may offset company initiatives Historical ASNA Store Return on
Slide 43: Forward EBITDA range contemplates negative comp risk
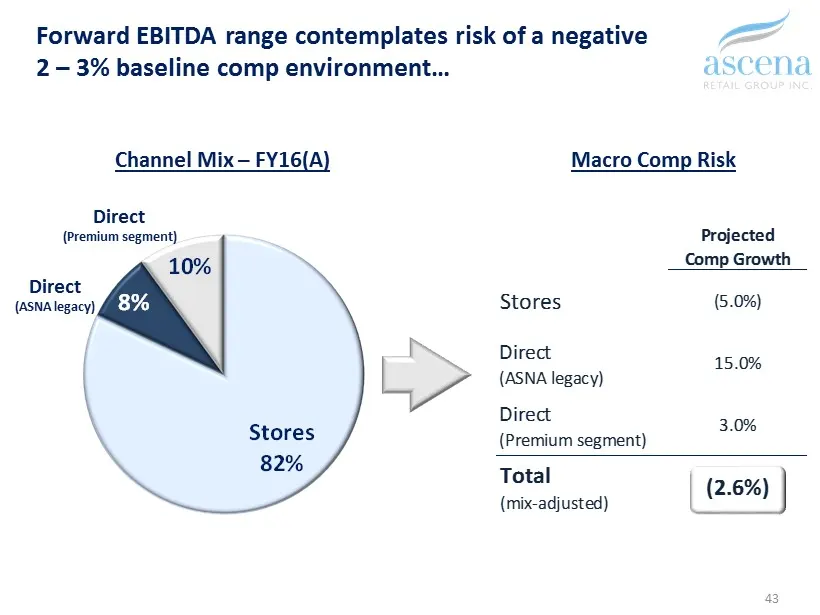
Projected Comp Growth Stores (5.0%) Direct (ASNA legacy) 15.0% Direct (Premium segment) 3.0% Total (mix-adjusted) (2.6%) 43 Forward EBITDA range contemplates risk of a negative 2 – 3% baseline comp environment… Stores 82% 8% 10% Channel Mix – FY16(A) Macro Comp Risk Direct (ASNA legacy) Direct (Prem
Slide 44: Continued improvement in gross margin rate
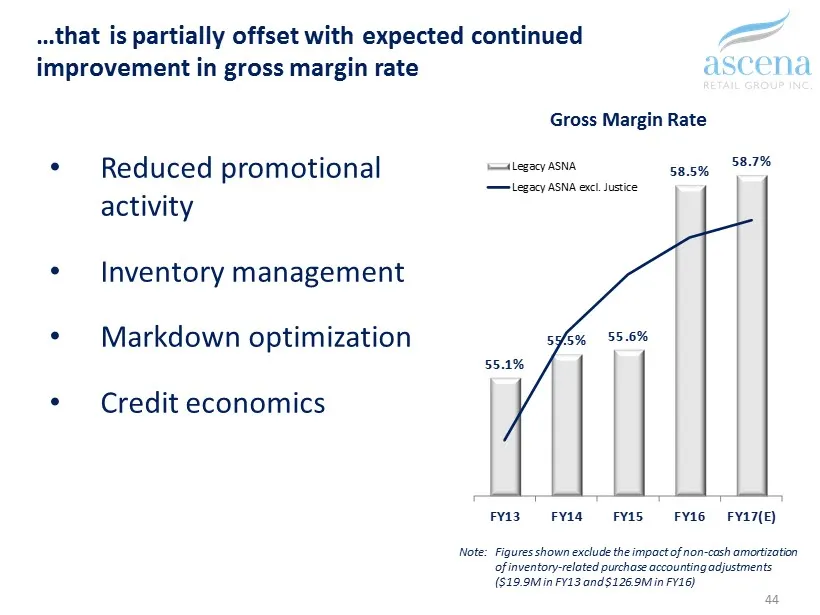
…that is partially offset with expected continued improvement in gross margin rate • Reduced promotional activity • Inventory management • Markdown optimization • Credit economics 44 Gross Margin Rate 55.1% 55.5% 55.6% 58.5% 58.7% FY13 FY14 FY15 FY16 FY17(E) Legacy ASNA Legacy ASNA excl. Justice Not
Slide 45: Projected FY18 EBITDA range
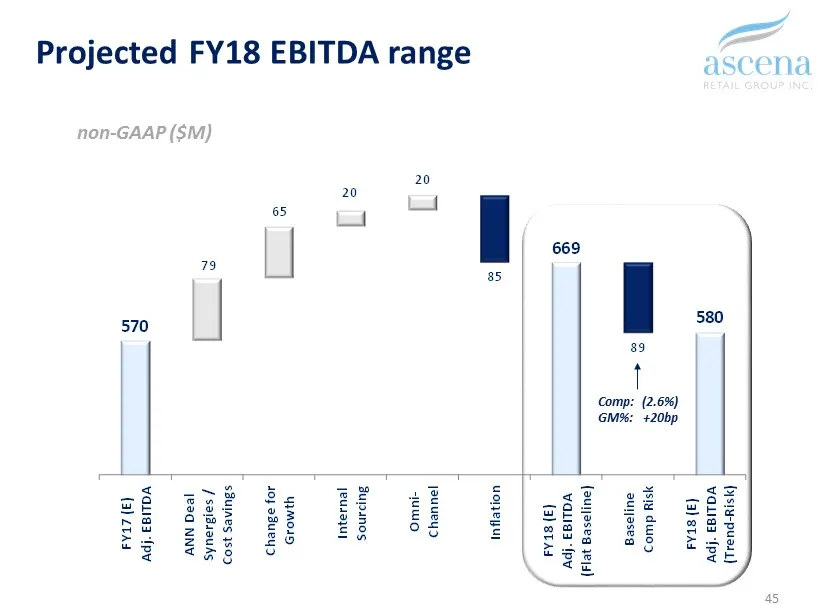
45 Projected FY18 EBITDA range non - GAAP ($M) 570 79 65 20 20 85 669 89 580 FY17 (E) Adj. EBITDA ANN Deal Synergies / Cost Savings Change for Growth Internal Sourcing Omni- Channel Inflation FY18 (E) Adj. EBITDA (Flat Baseline) Baseline Comp Risk FY18 (E) Adj. EBITDA (Trend-Risk) Comp: (2.6%) GM%:
Slide 46: Normalizing capital expenditures
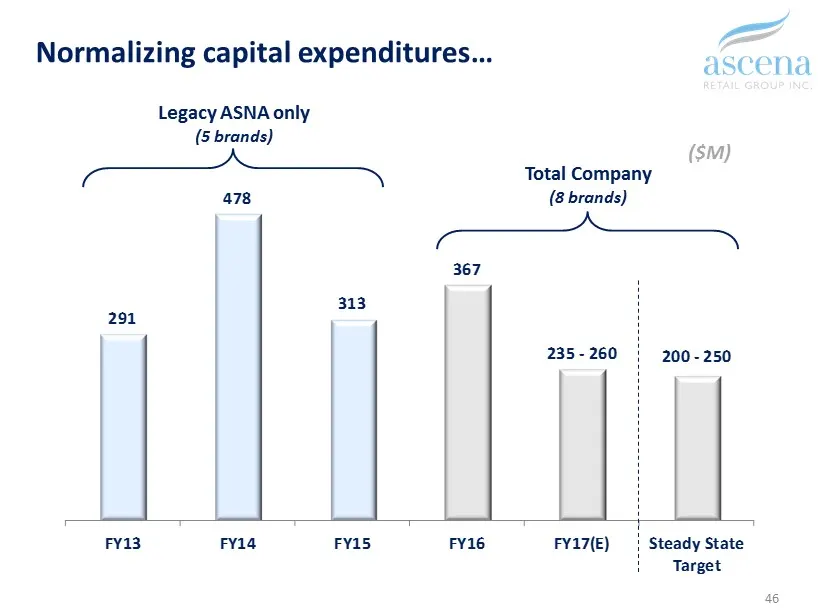
46 Normalizing capital expenditures… ($M) 291 478 313 367 235 - 260 200 - 250 FY13 FY14 FY15 FY16 FY17(E) Steady State Target Legacy ASNA only (5 brands) Total Company (8 brands)
Slide 47: Strong Fiscal 2018 cash flow and capital allocation optionality
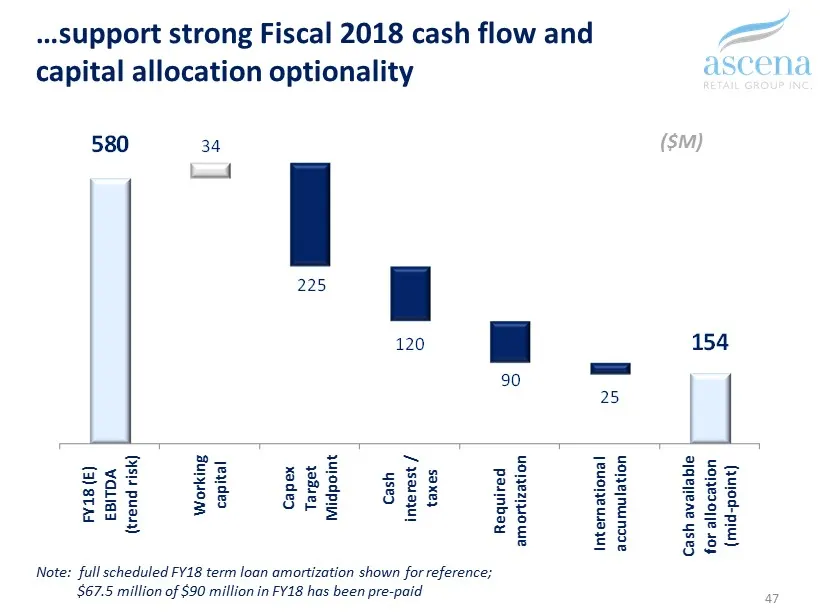
580 34 225 120 90 25 154 FY18 (E) EBITDA (trend risk) Working capital Capex Target Midpoint Cash interest / taxes Required amortization International accumulation Cash available for allocation (mid-point) 47 …support strong Fiscal 2018 cash flow and capital allocation optionality ($M) Note: full sch
Slide 48: Liquidity remains strong as we de-lever
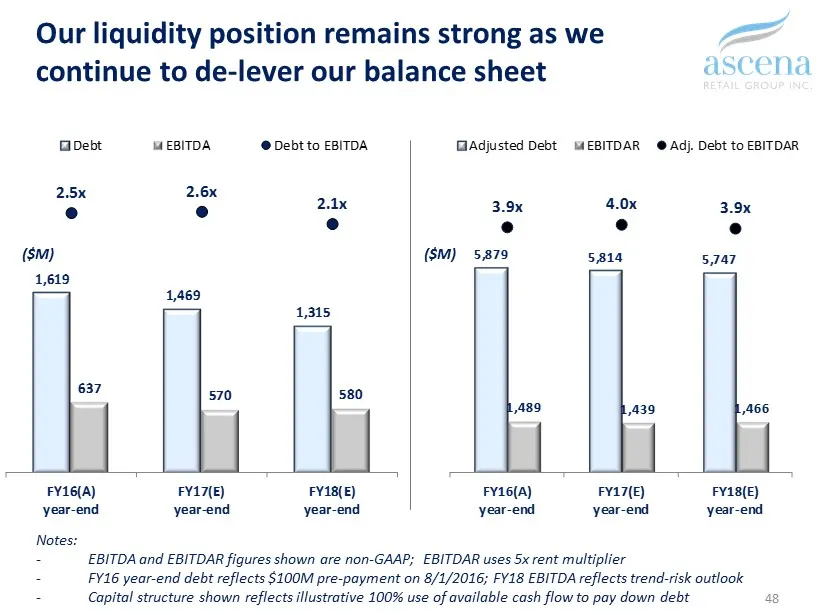
1,619 1,469 1,315 637 570 580 2.5x 2.6x 2.1x FY16(A) year-end FY17(E) year-end FY18(E) year-end Debt EBITDA Debt to EBITDA 48 Our liquidity position remains strong as we continue to de - lever our balance sheet 5,879 5,814 5,747 1,489 1,439 1,466 3.9x 4.0x 3.9x FY16(A) year-end FY17(E) year-end FY18
Slide 49: Capital allocation – considerations
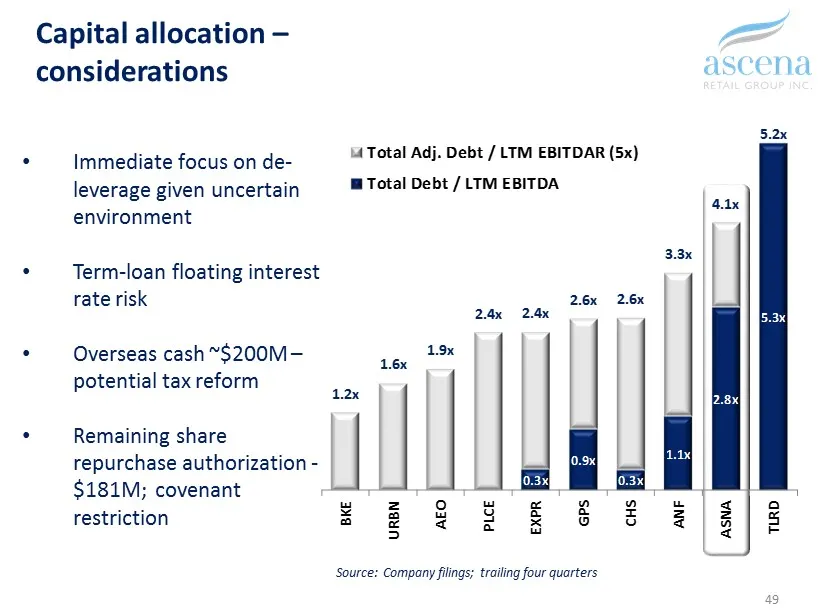
Capital allocation – considerations • Immediate focus on de - leverage given uncertain environment • Term - loan floating interest rate risk • Overseas cash ~$200M – potential tax reform • Remaining share repurchase authorization - $181M; covenant restriction 49 0.3x 0.9x 0.3x 1.1x 2.8x 5.3x 1.2x 1.

Slide 50: Break
50 BREAK
Slide 51: Premium Fashion Segment
Premium Fashion Segment Gary Muto President and CEO
Slide 52: Strong brands with deep relevance
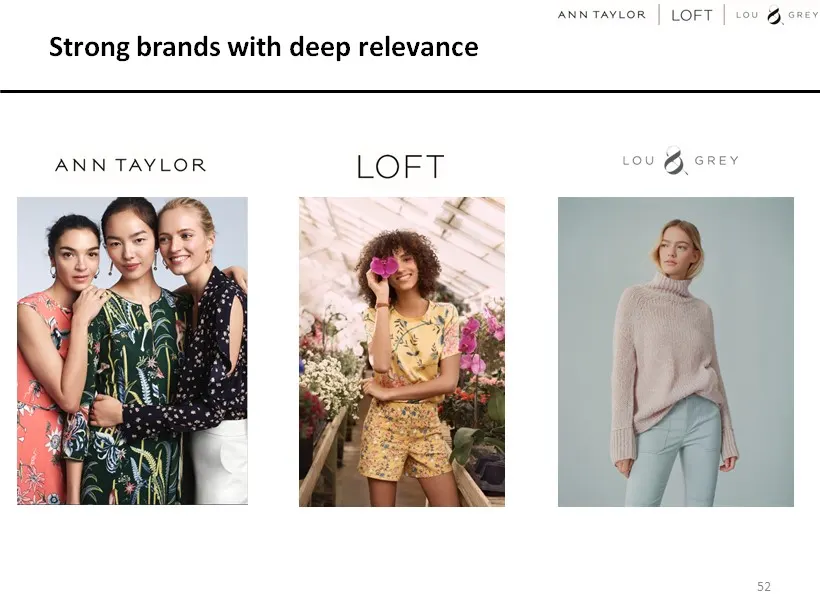
Strong brands with deep relevance 52
Slide 53: Client-focused strategic priorities
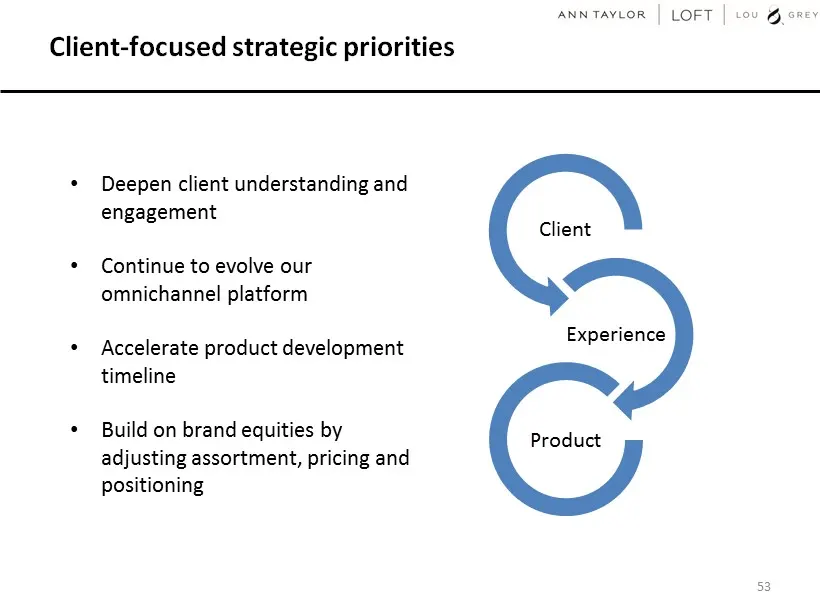
Client - focused strategic priorities • Deepen client understanding and engagement • Continue to evolve our omnichannel platform • Accelerate product development timeline • Build on brand equities by adjusting assortment, pricing and positioning 53 Client Experience Product
Slide 54: Enhancing client understanding and engagement
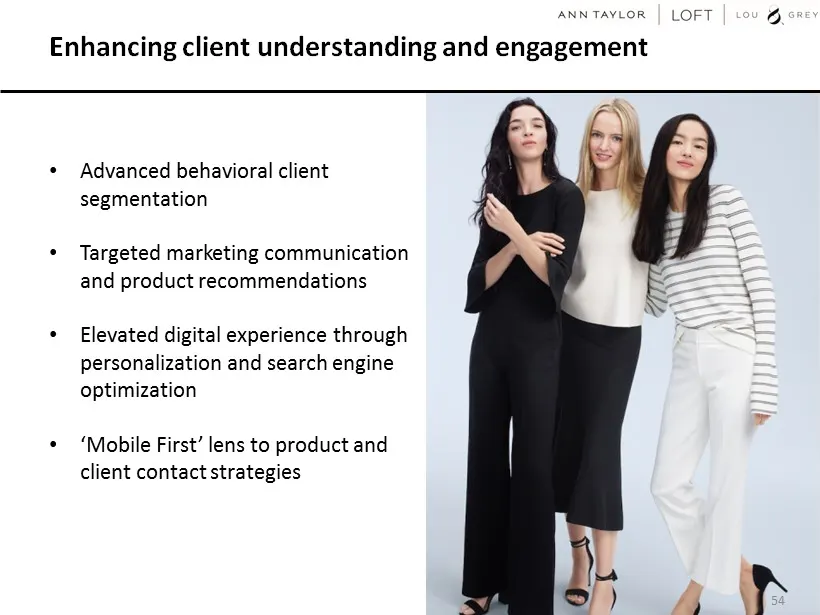
Enhancing client understanding and engagement • Advanced behavioral client segmentation • Targeted marketing communication and product recommendations • Elevated digital experience through personalization and search engine optimization • ‘ Mobile First’ lens to product and client contact strategies
Slide 55: Industry leading omnichannel platform
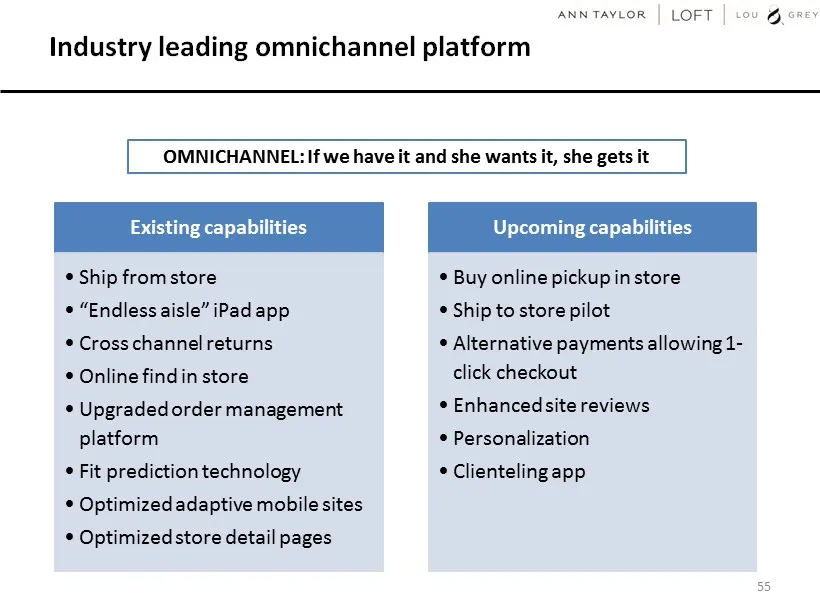
Industry leading omnichannel platform 55 OMNICHANNEL: If we have it and she wants it, she gets it Existing capabilities • Ship from store • “Endless aisle” iPad app • Cross channel returns • Online find in store • Upgraded order management platform • Fit prediction technology • Optimized adaptive mo
Slide 56: Evolving the omnichannel client experience
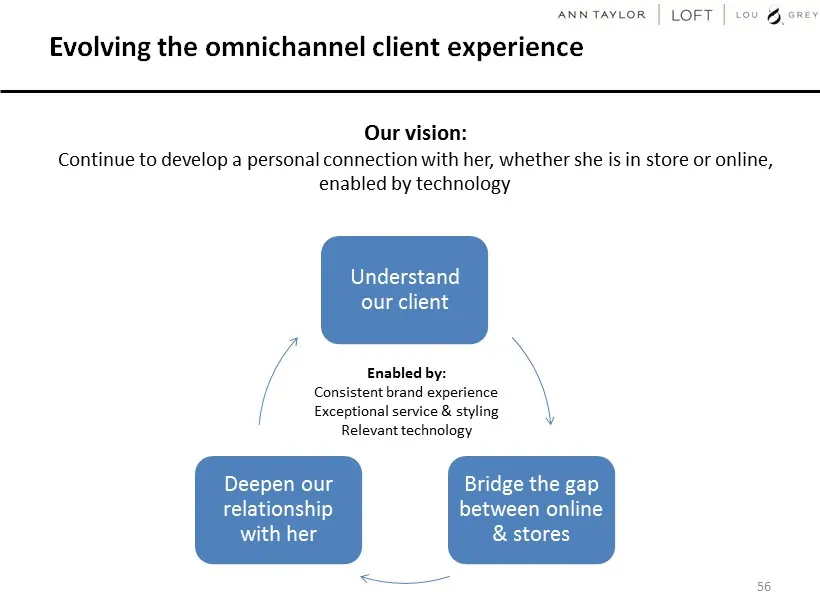
Evolving the omnichannel client experience 56 Our vision: Continue to develop a personal connection with her, whether she is in store or online, enabled by technology Understand our client Bridge the gap between online & stores Deepen our relationship with her Enabled by: Consistent brand experience
Slide 57: Accelerating product development timeline
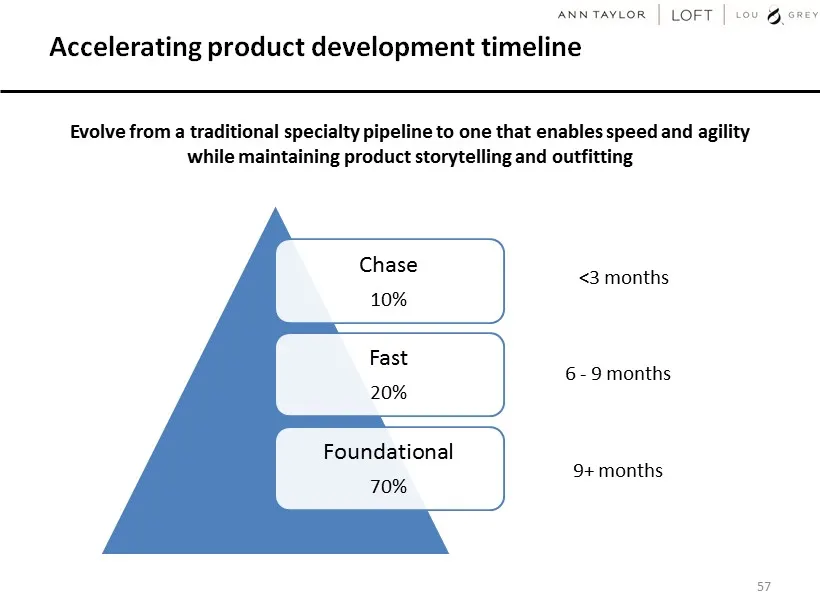
Accelerating product development timeline 57 Evolve from a traditional specialty pipeline to one that enables speed and agility while maintaining product storytelling and outfitting <3 months 6 - 9 months 9+ months Chase 10% Fast 20% Foundational 70%
Slide 58: Ann Taylor
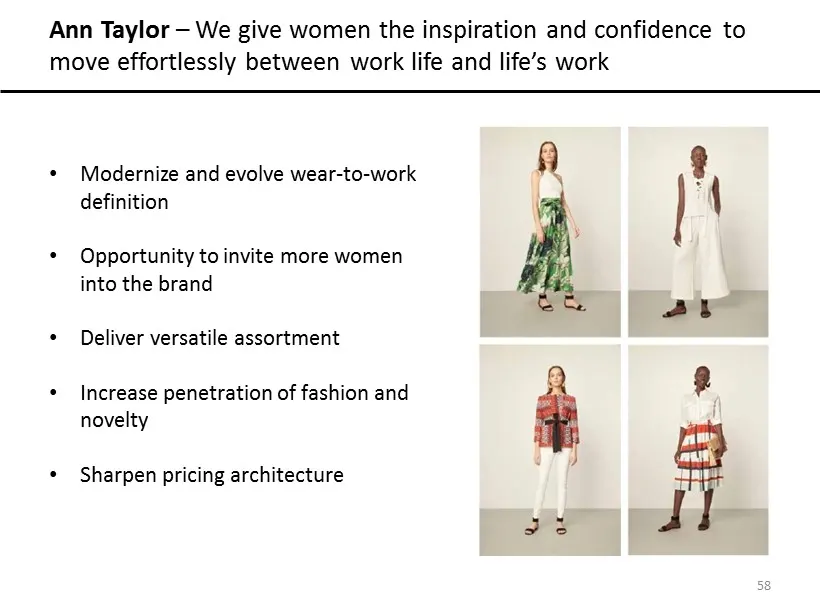
Ann Taylor – We give women the inspiration and confidence to move effortlessly between work life and life’s work 58 • Modernize and evolve wear - to - work definition • Opportunity to invite more women into the brand • Deliver versatile assortment • Increase penetration of fashion and novelty • Shar

Slide 59: 59
59
Slide 60: LOFT
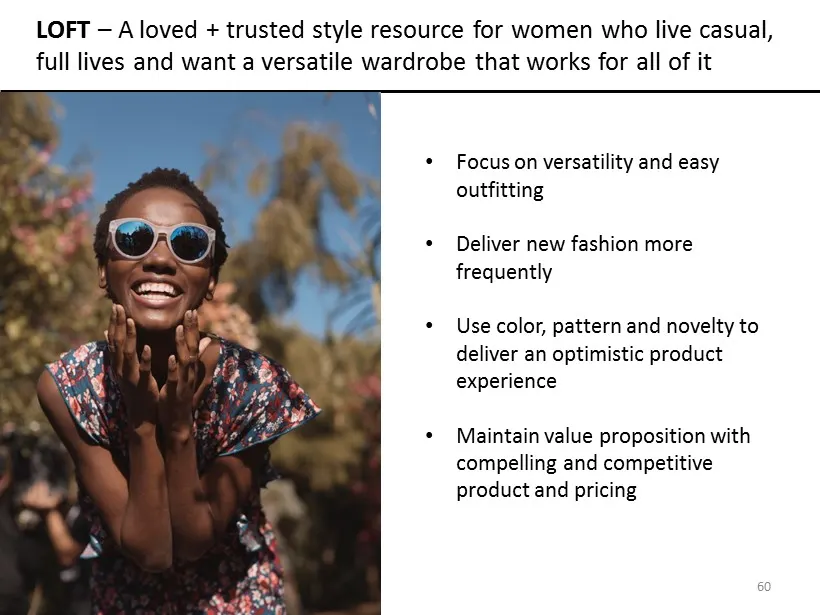
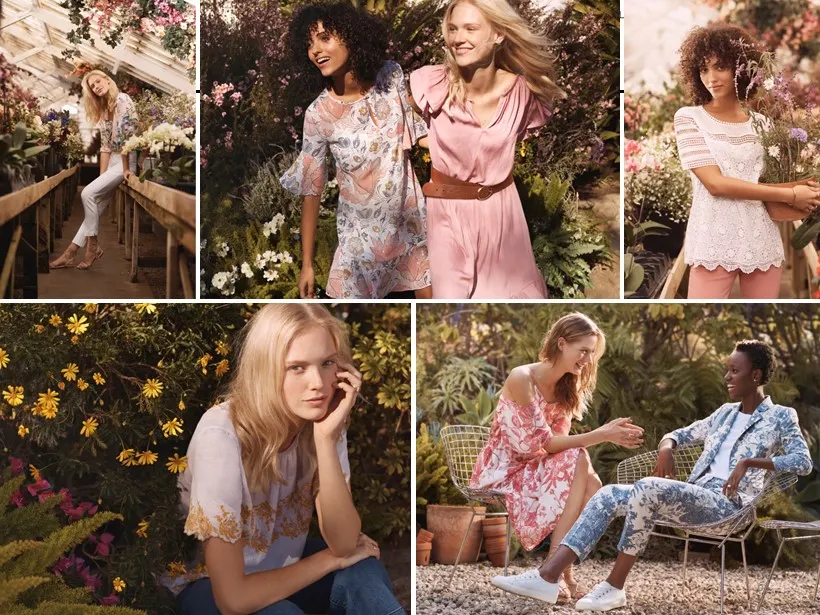
LOFT – A loved + trusted style resource for women who live casual, full lives and want a versatile wardrobe that works for all of it • Focus on versatility and easy outfitting • Deliver new fashion more frequently • Use color, pattern and novelty to deliver an optimistic product experience • Maintai
Slide 61: 61
61
Slide 62: Lou & Grey
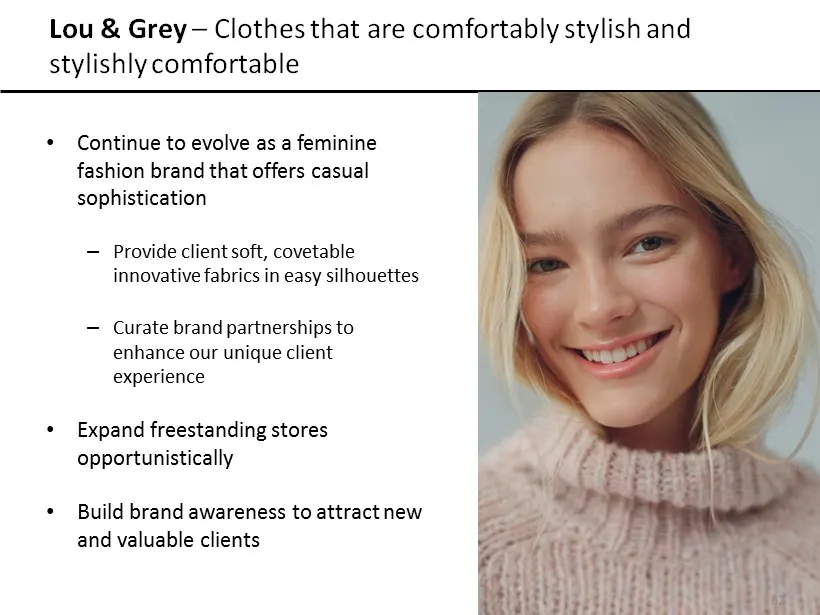
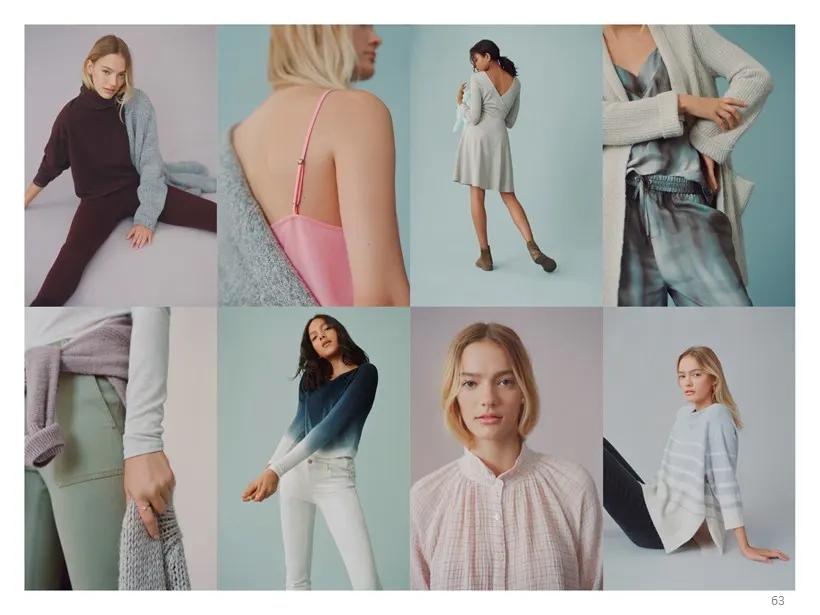
Lou & Grey – Clothes that are comfortably stylish and stylishly comfortable 62 • Continue to evolve as a feminine fashion brand that offers casual sophistication – Provide client soft, covetable innovative fabrics in easy silhouettes – Curate brand partnerships to enhance our unique client experienc
Slide 63: Lou & Grey – Photo Collage
Lou & Grey – Photo Collage 63 63
Slide 64: Our evolution
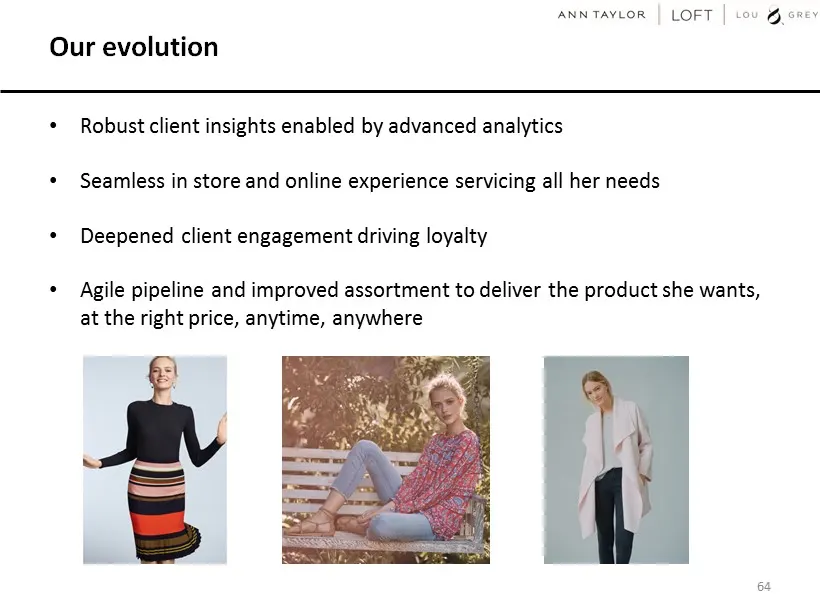
Our evolution • Robust client insights enabled by advanced analytics • Seamless in store and online experience servicing all her needs • Deepened client engagement driving loyalty • Agile pipeline and improved assortment to deliver the product she wants, at the right price, anytime, anywhere 64
Slide 65: Value Fashion Segment
Value Fashion Segment George Goldfarb President and CEO
Slide 66: Value Fashion Segment brands
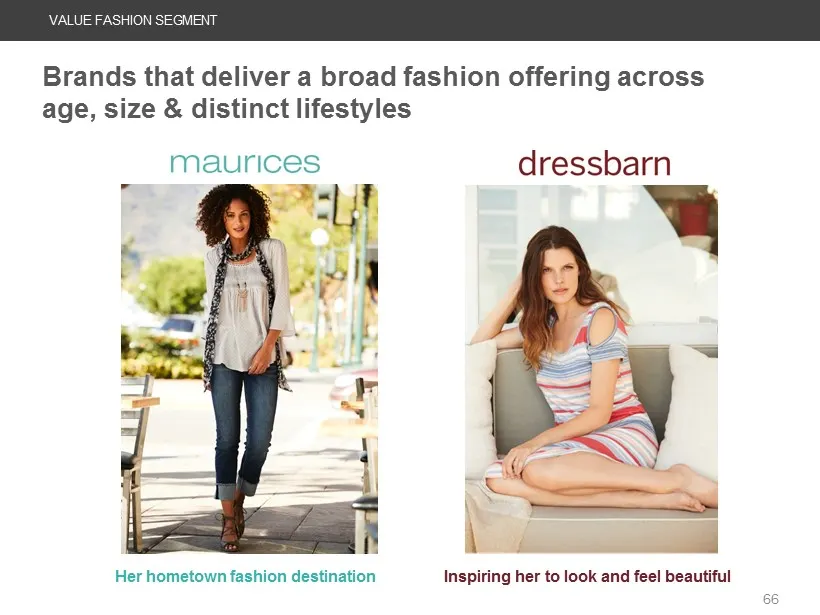
VALUE FASHION SEGMENT Brands that deliver a broad fashion offering across age, size & distinct lifestyles Her hometown f ashion d estination Inspiring her to look and feel beautiful 66
Slide 67: Priorities to leverage the segment model
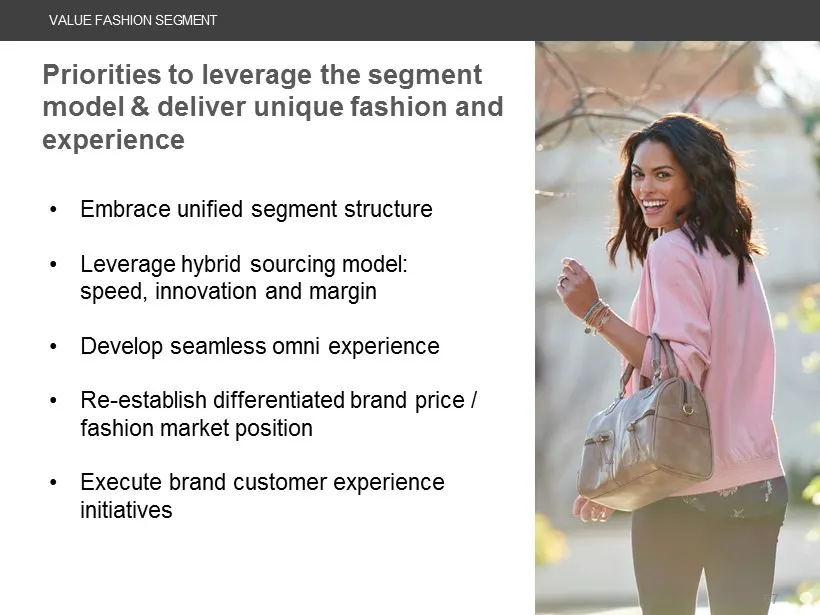
VALUE FASHION SEGMENT Priorities to leverage the segment model & deliver unique fashion and experience • Embrace unified segment structure • Leverage hybrid sourcing model: speed, innovation and margin • Develop seamless omni experience • Re - establish differentiated brand price / fashion market po
Slide 68: Embrace unified segment structure
VALUE FASHION SEGMENT Embrace unified segment structure • Unified leadership team • Leverage similarities • Cost structure opportunities • Leverage unique brand capabilities 68
Slide 69: Hybrid sourcing model: speed, innovation, margin
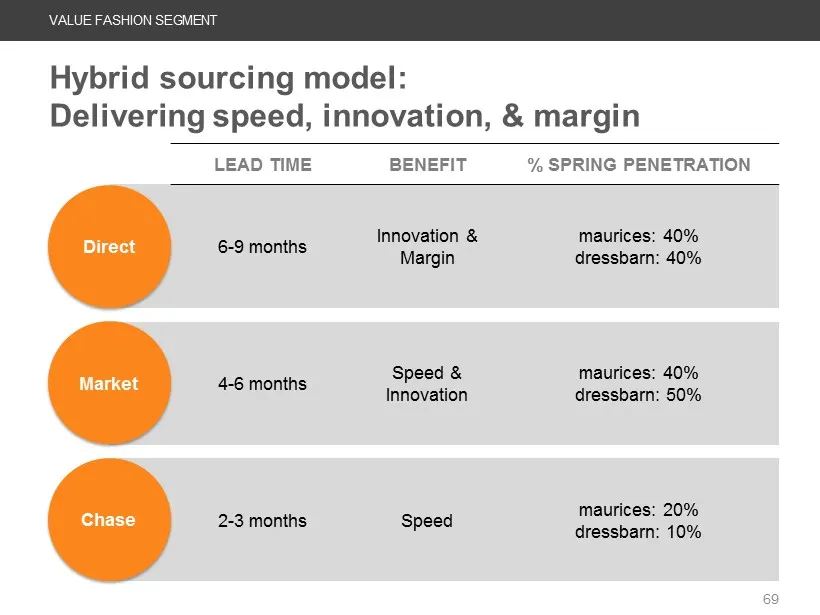
VALUE FASHION SEGMENT LEAD TIME BENEFIT % SPRING PENETRATION 6 - 9 months Innovation & Margin maurices: 40% dressbarn: 40% 4 - 6 months Speed & Innovation maurices: 40% dressbarn: 50 % 2 - 3 months Speed maurices: 20% dressbarn: 10% Hybrid sourcing model: Delivering speed, innovation, & margin Chase
Slide 70: Seamless omni experience evolves the customer relationship
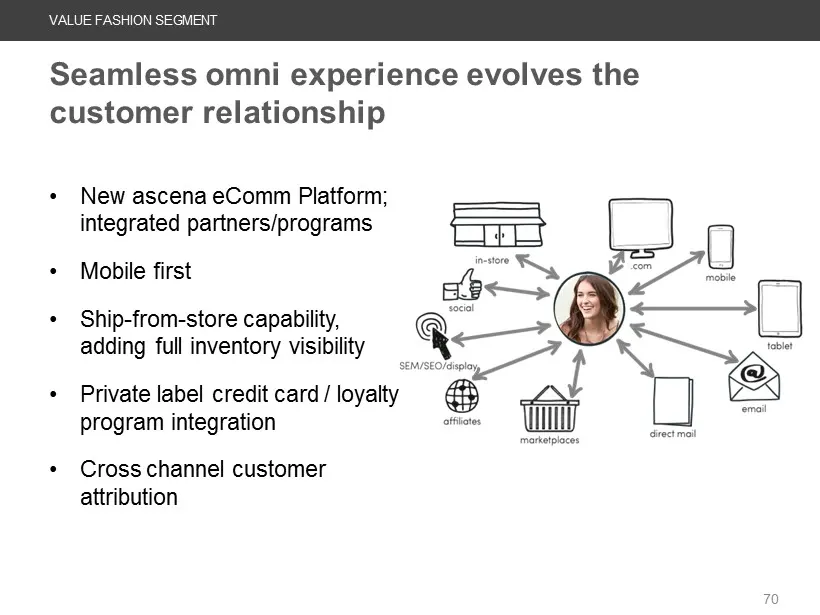
VALUE FASHION SEGMENT Seamless omni experience evolves the customer relationship • New ascena eComm Platform ; integrated partners/programs • Mobile first • S hip - from - store capability, adding full inventory visibility • Private label credit card / loyalty program integration • Cross channel cus
Slide 71: Competitive positioning
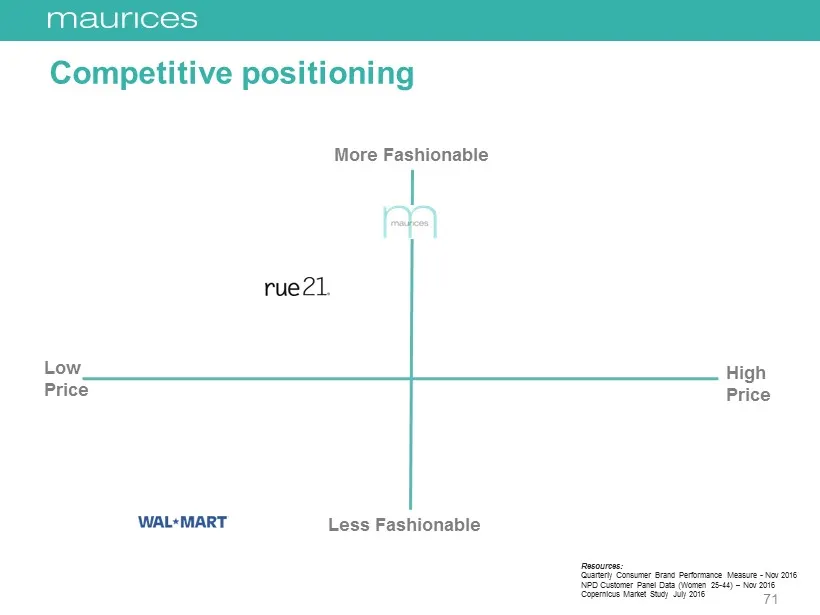
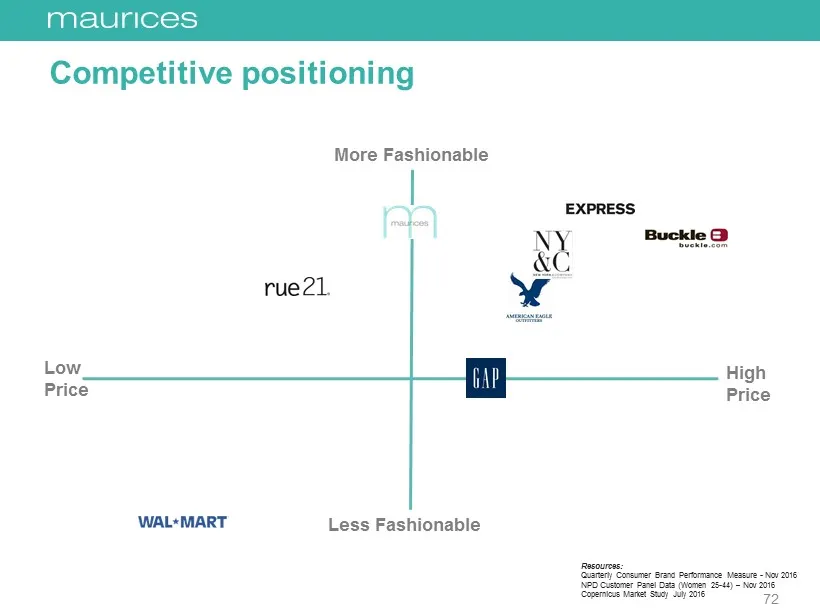
High Price Low Price More Fashionable Less Fashionable Resources: Quarterly Consumer Brand Performance Measure - Nov 2016 NPD Customer Panel Data (Women 25 - 44) – Nov 2016 Copernicus Market Study July 2016 Competitive positioning 71
Slide 72: Competitive positioning
High Price Low Price More Fashionable Less Fashionable Resources: Quarterly Consumer Brand Performance Measure - Nov 2016 NPD Customer Panel Data (Women 25 - 44) – Nov 2016 Copernicus Market Study July 2016 Competitive positioning 72
Slide 73: Competitive positioning
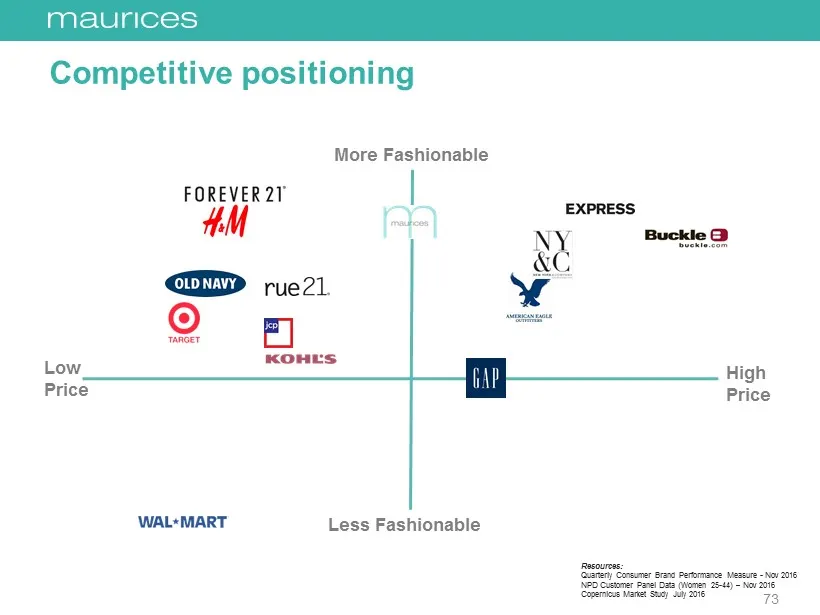
High Price Low Price More Fashionable Less Fashionable Resources: Quarterly Consumer Brand Performance Measure - Nov 2016 NPD Customer Panel Data (Women 25 - 44) – Nov 2016 Copernicus Market Study July 2016 Competitive positioning 73
Slide 74: Differentiated price / fashion position
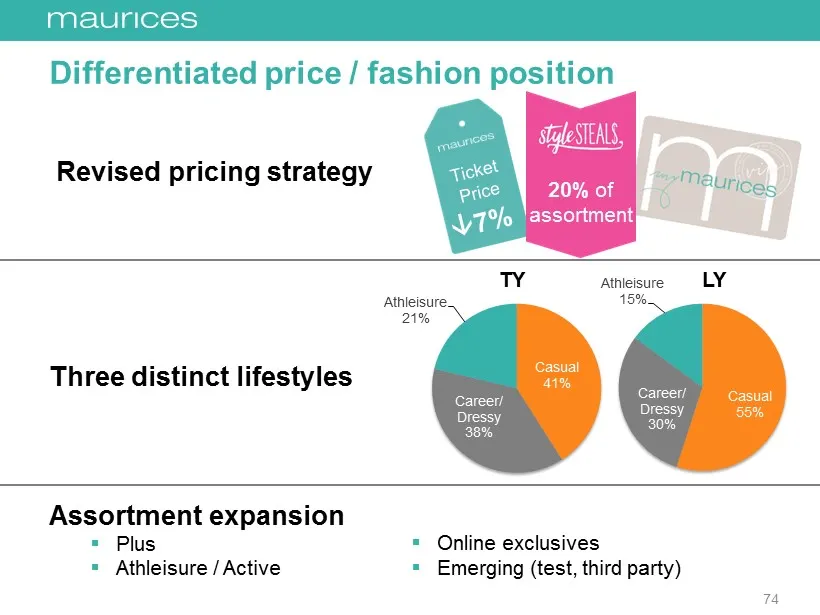
Casual 41% Career / Dressy 38% Athleisure 21% TY Differentiated price / fashion position Three distinct lifestyles Assortment expansion ▪ Plus ▪ Athleisure / Active Revised pricing strategy ▪ Online exclusives ▪ Emerging (test, third party) 20% of assortment Casual 55% Career / Dressy 30% Athleisure
Slide 75: Unique customer experience
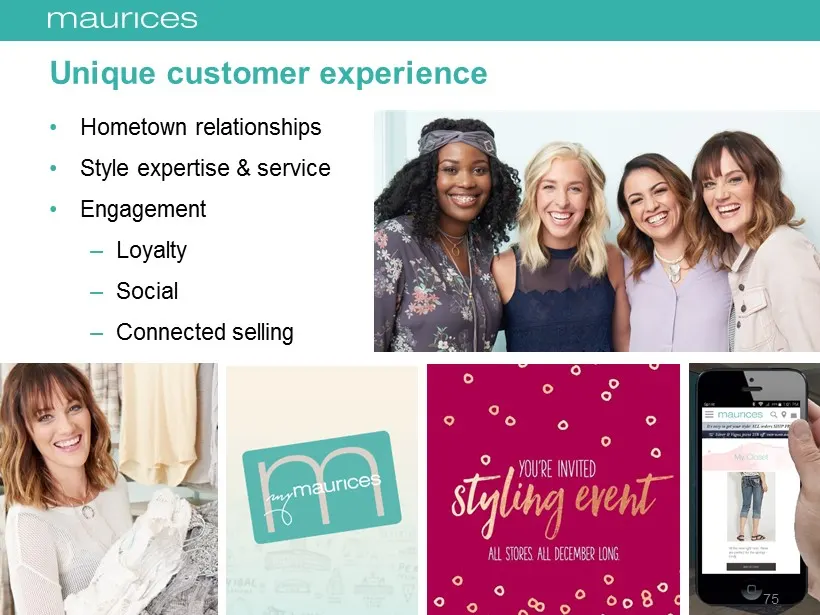
Unique customer experience • Hometown relationships • Style expertise & service • Engagement – Loyalty – Social – Connected selling 9 75
Slide 76: Competitive positioning
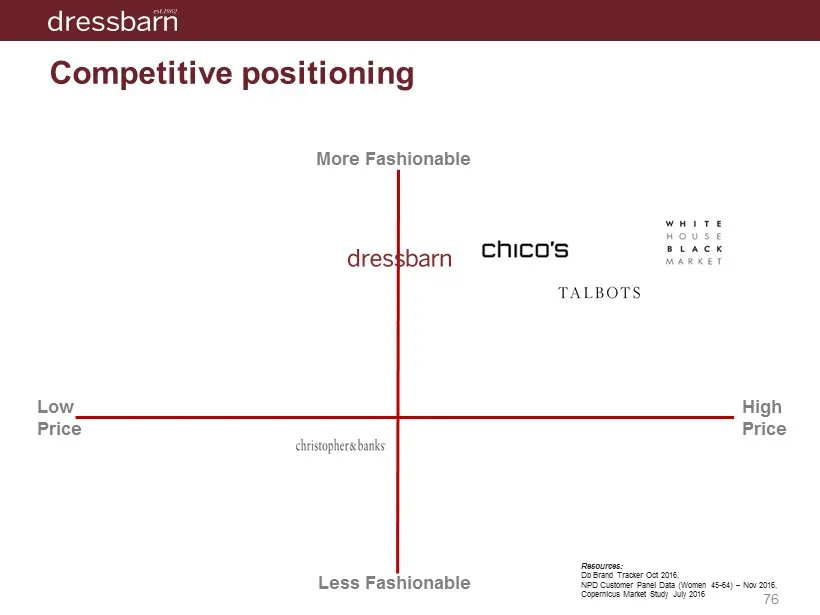
C ompetitive positioning More Fashionable High Price Low Price Less Fashionable Resources: Db Brand Tracker Oct 2016, NPD Customer Panel Data (Women 45 - 64 ) – Nov 2016, Copernicus Market Study July 2016 76
Slide 77: Competitive positioning
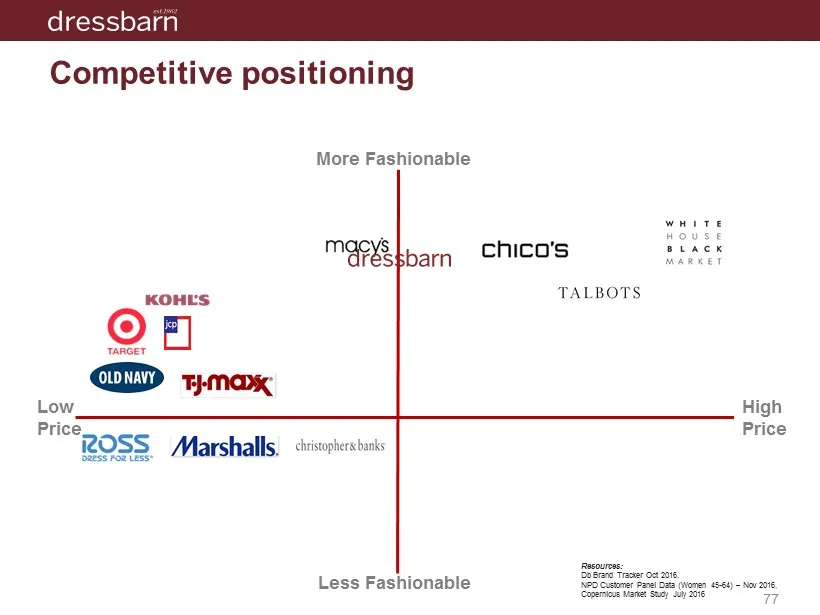
Competitive positioning More Fashionable High Price Low Price Less Fashionable Resources: Db Brand Tracker Oct 2016, NPD Customer Panel Data (Women 45 - 64 ) – Nov 2016, Copernicus Market Study July 2016 77
Slide 78: Immediate focus areas
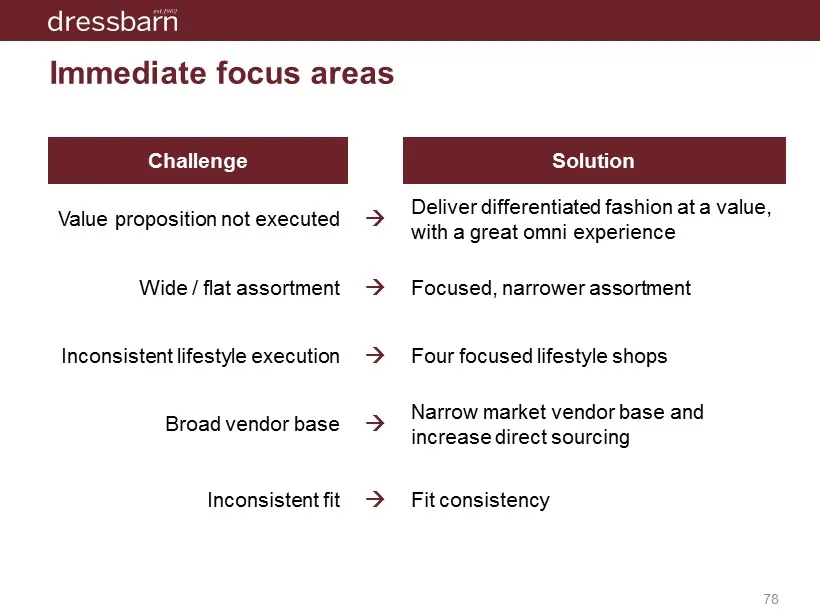
Immediate focus areas 11 Challenge Solution Value proposition not executed ; Deliver differentiated fashion at a value, with a great omni experience Wide / flat assortment ; Focused, narrower assortment Inconsistent lifestyle execution ; Four focused lifestyle shops Broad vendor base ; Narrow market
Slide 79: Differentiated fashion position
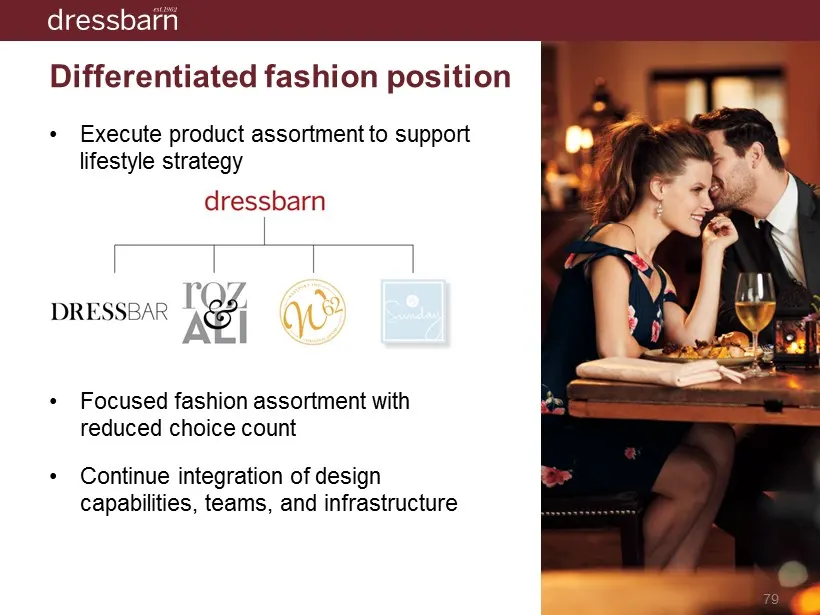
Differentiated fashion position • Execute product assortment to support lifestyle strategy • Focused fashion assortment with reduced choice count • Continue integration of design capabilities, teams, and infrastructure 79
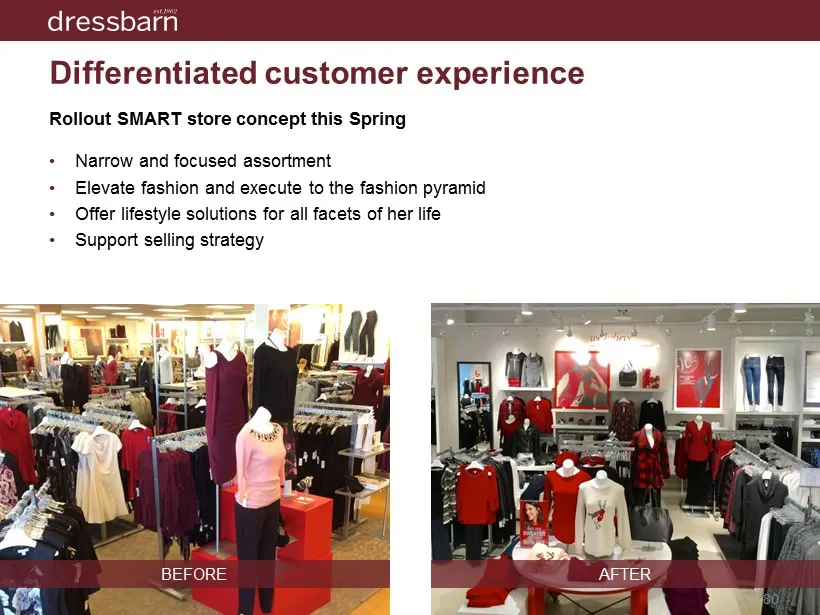
Slide 80: Differentiated customer experience: SMART store concept
Differentiated customer experience Rollout SMART store concept this Spring • Narrow and focused assortment • Elevate fashion and execute to the fashion pyramid • Offer lifestyle solutions for all facets of her life • Support selling strategy BEFORE AFTER 80
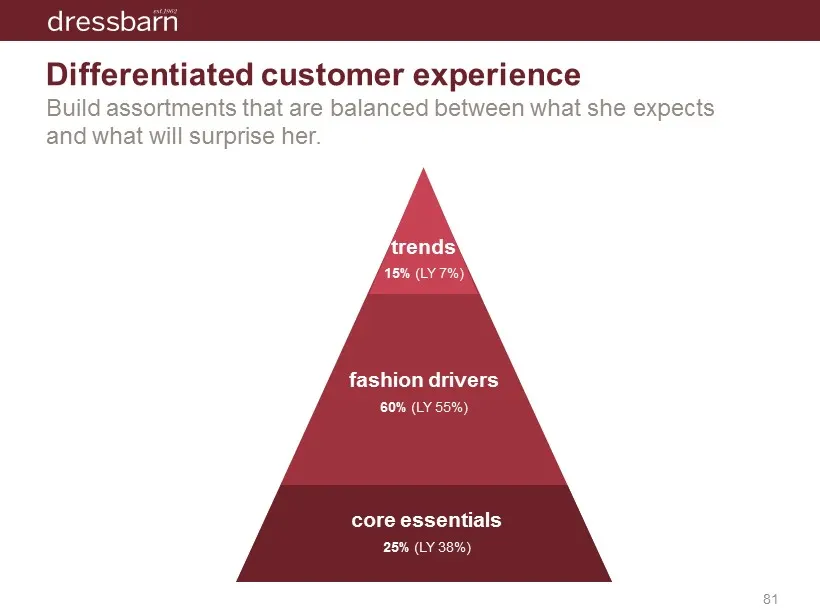
Slide 81: Differentiated customer experience: assortment balance
Differentiated customer experience B uild assortments that are balanced between what she expects and what will surprise her. core essentials 25 % (LY 38%) fashion drivers 60% (LY 55 %) trends 15% (LY 7%) 81
Slide 82: Differentiated customer experience: digital
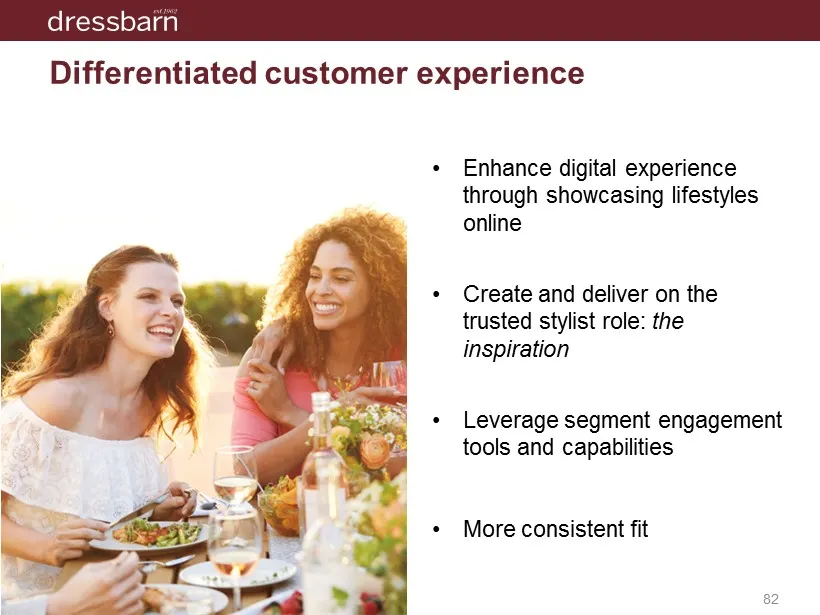
Differentiated customer experience • Enhance digital experience through showcasing lifestyles online • Create and deliver on the t rusted stylist role: the inspiration • Leverage segment engagement tools and capabilities • More consistent fit 82
Slide 83: Key takeaways
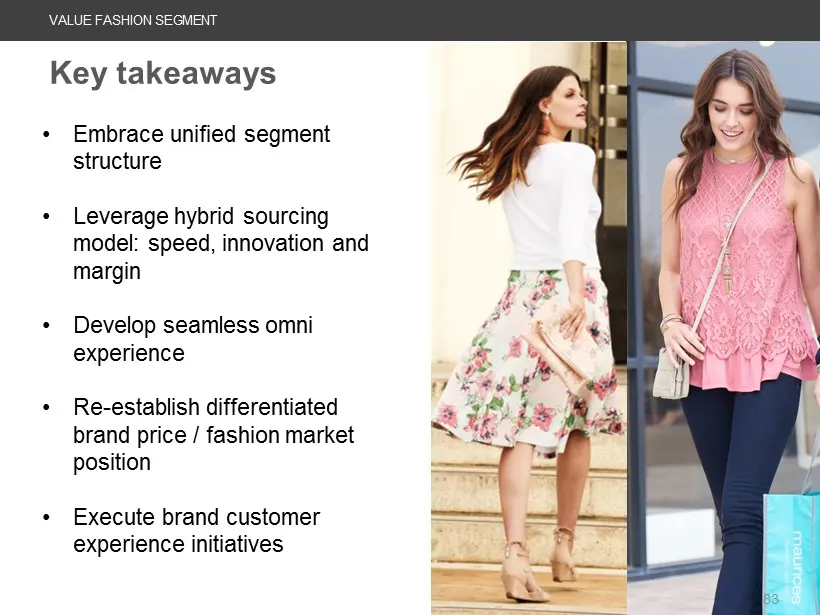
VALUE FASHION SEGMENT Key takeaways • Embrace unified segment structure • Leverage hybrid sourcing model: speed, innovation and margin • Develop seamless omni experience • Re - establish differentiated brand price / fashion market position • Execute brand customer experience initiatives 83
Slide 84: Plus Fashion Segment
Plus Fashion Segment Scott Glaser SVP – Chief Financial Officer
Slide 85: Purpose-driven brands
Purpose - driven brands 85
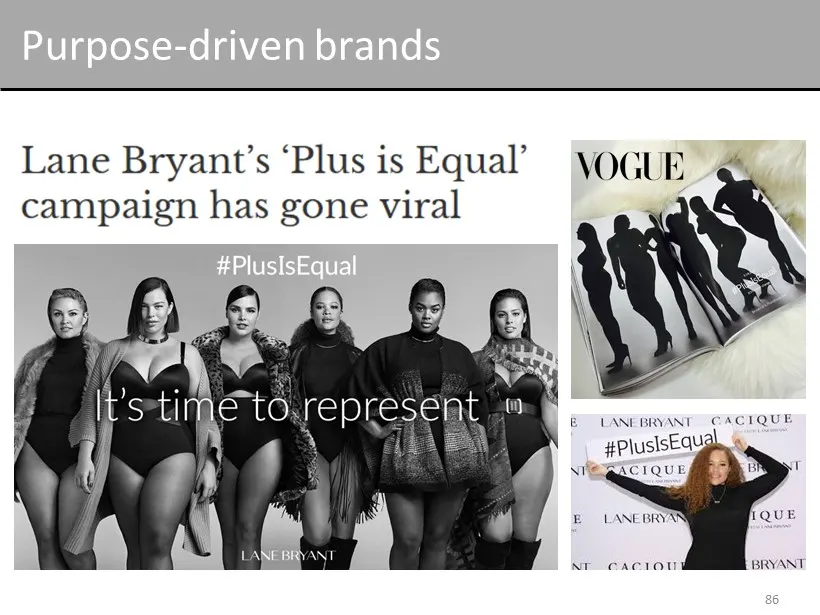
Slide 86: Lane Bryant's 'Plus is Equal' campaign has gone viral
Lane Bryant’s ‘Plus is Equal’ \OQGUE campaign has gone viral UANEBRVANT CG ACIQUE #Plusisequgh BE LANEBRYS' QUE Nr eaciat BRYANT
Slide 87: Purpose-driven brands
Purpose - driven brands 87
Slide 88: Purpose-driven brands
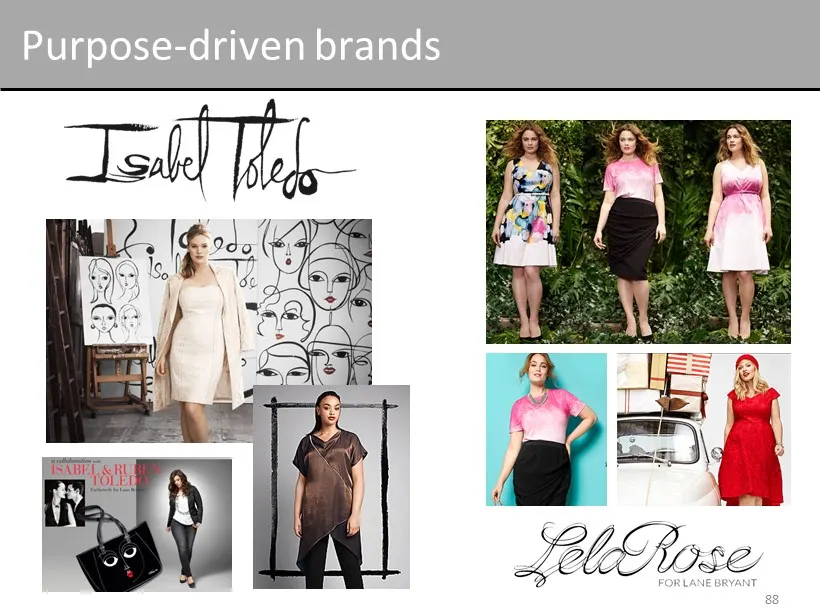
Purpose - driven brands 88
Slide 89: Sophie Theallet for Cacique
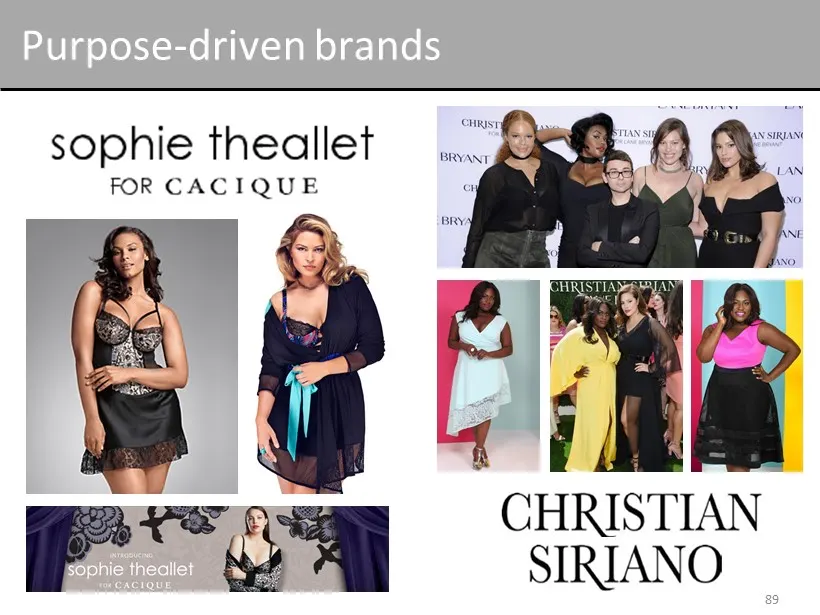
sophie theallet FOR CACIQUE Poo
Slide 90: Purpose-driven brands: Changing the Conversation
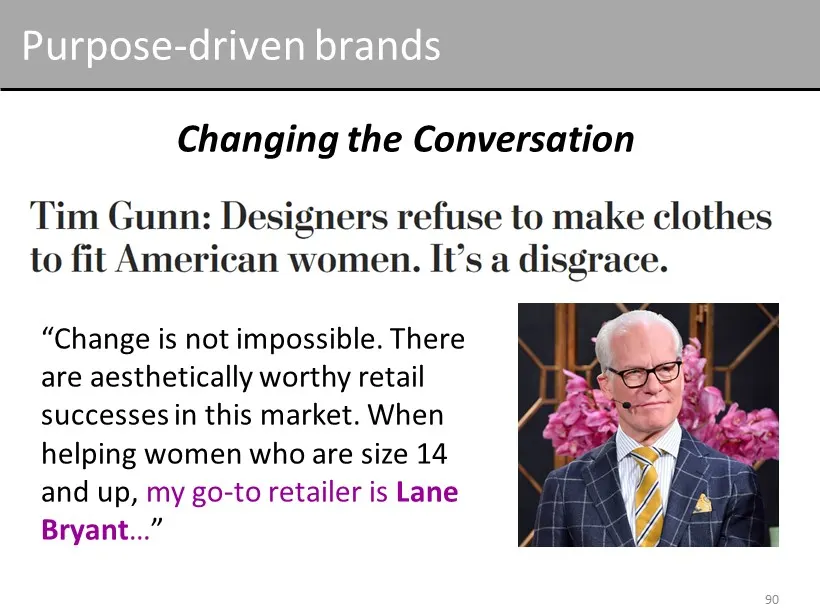
Purpose - driven brands “Change is not impossible. There are aesthetically worthy retail successes in this market. When helping women who are size 14 and up, my go - to retailer is Lane Bryant … ” Changing the Conversation 90
Slide 91: Compelling market
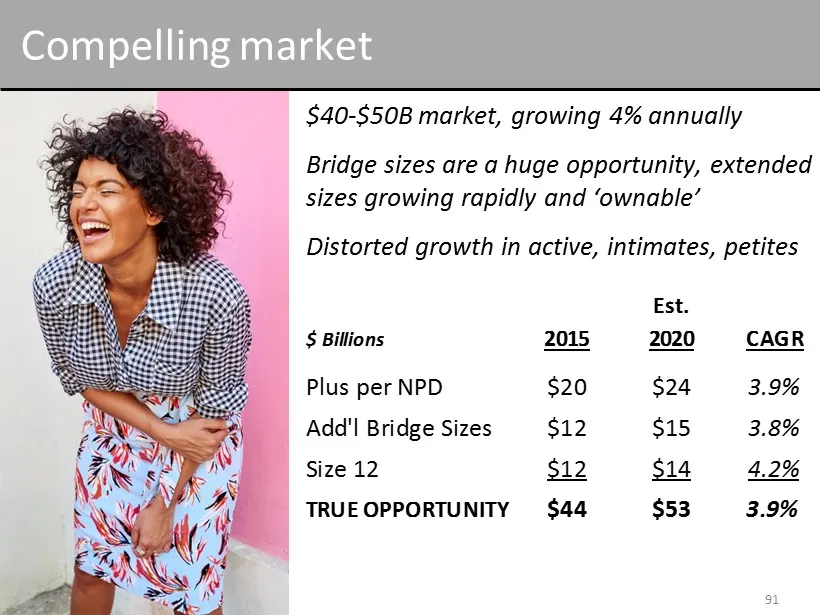
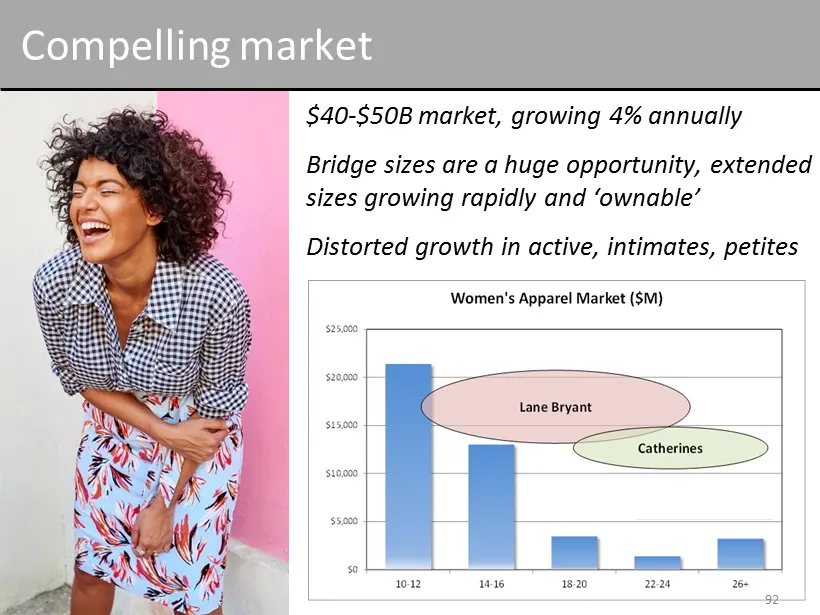
Compelling market $40 - $50B market, growing 4% annually Bridge sizes are a huge opportunity, extended sizes growing rapidly and ‘ ownable ’ Distorted growth in active, intimates, petites Est. $ Billions 2015 2020 CAGR Plus per NPD $20 $24 3.9% Add'l Bridge Sizes $12 $15 3.8% Size 12 $12 $14 4.2% TR
Slide 92: Compelling market
Compelling market $40 - $50B market, growing 4% annually Bridge sizes are a huge opportunity, extended sizes growing rapidly and ‘ ownable ’ Distorted growth in active, intimates, petites 92
Slide 93: Segment model benefits
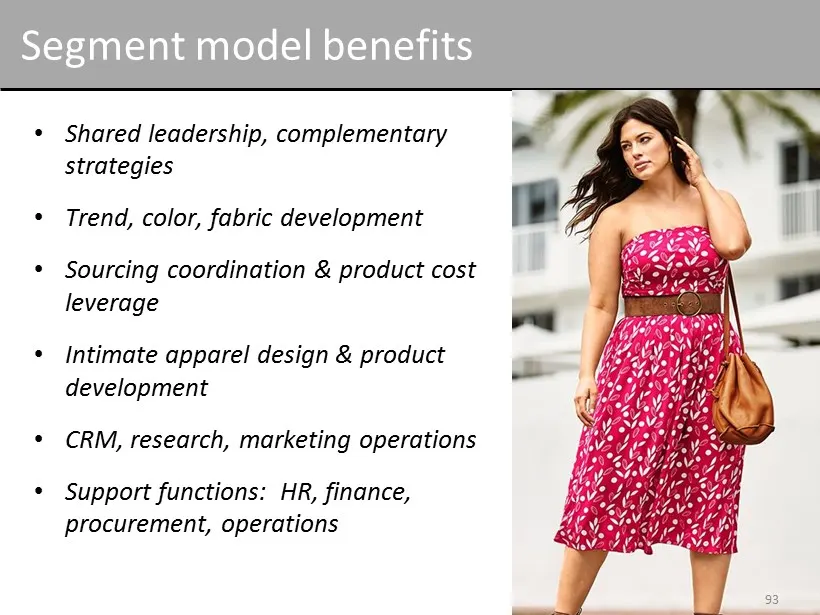
Segment model benefits • Shared leadership, complementary strategies • Trend, color, fabric development • Sourcing coordination & product cost leverage • Intimate apparel design & product development • CRM, research, marketing operations • Support functions: HR, finance, procurement, operations 93
Slide 94: Priorities: Customer Experience
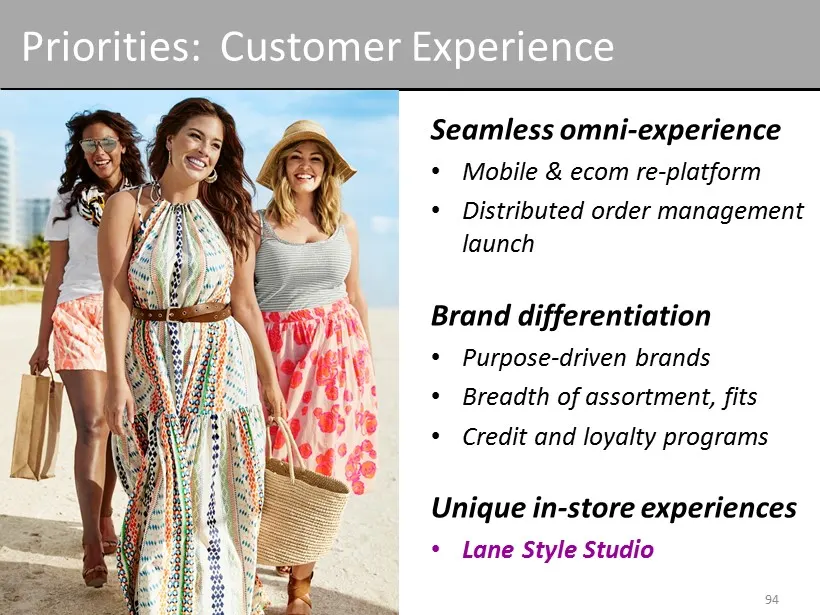
Priorities: Customer Experience Seamless omni - experience • Mobile & ecom re - platform • Distributed order management launch Brand differentiation • Purpose - driven brands • Breadth of assortment, fits • Credit and loyalty programs Unique in - store experiences • Lane Style Studio 94
Slide 95: Highly differentiated service that engages and affirms
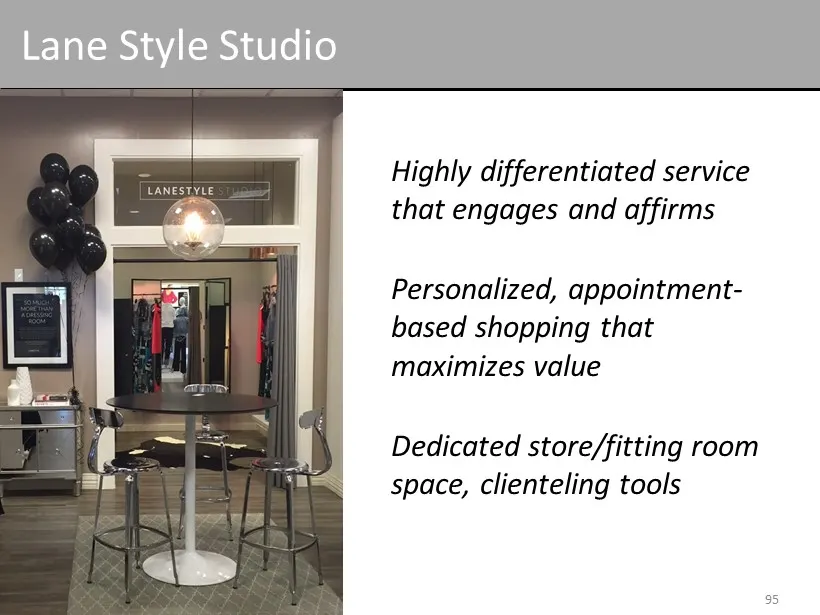
Highly differentiated service that engages and affirms Personalized, appointment - based shopping that maximizes value Dedicated store/fitting room space, clienteling tools Lane Style Studio 95 95
Slide 96: Lane Style Studio
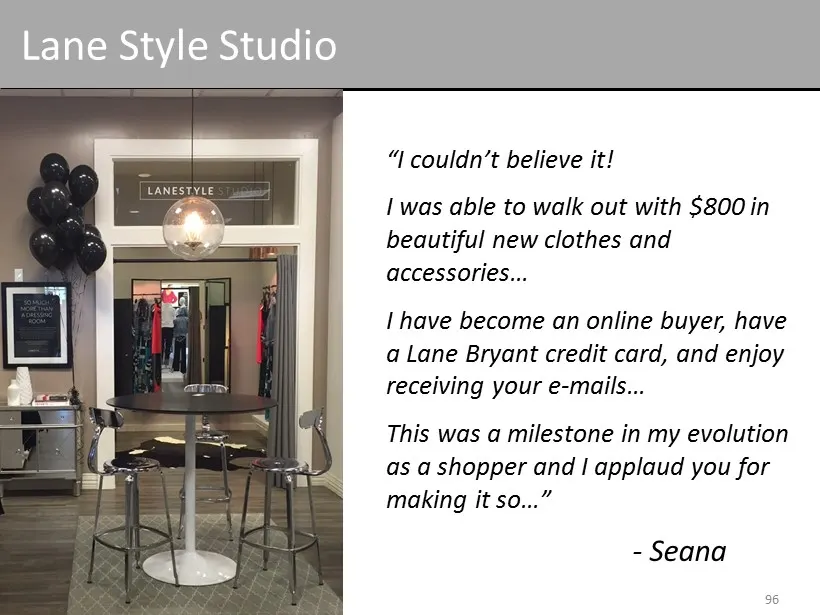
Lane Style Studio “I couldn’t believe it! I was able to walk out with $800 in beautiful new clothes and accessories… I have become an online buyer, have a Lane Bryant credit card, and enjoy receiving your e - mails… This was a milestone in my evolution as a shopper and I applaud you for making it so
Slide 97: Priorities: Fashion Execution
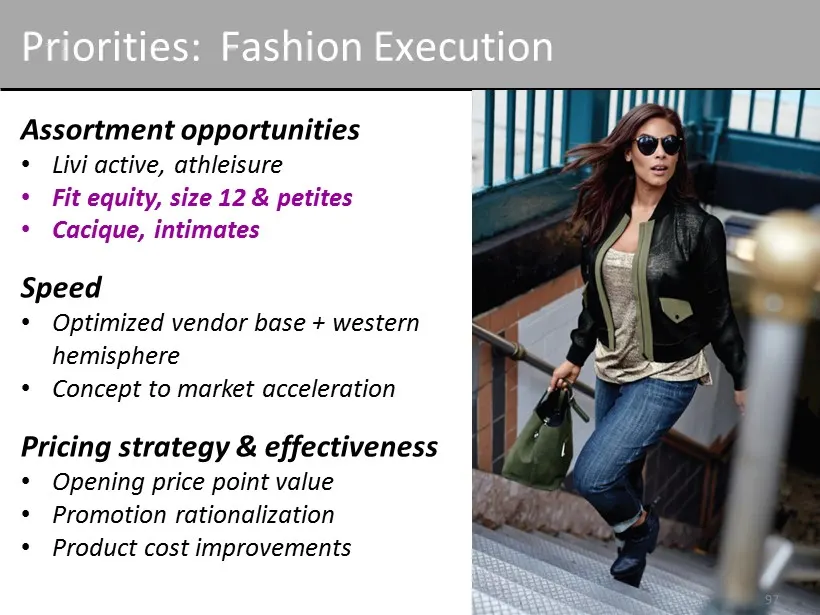
Assortment opportunities • Livi active, athleisure • Fit equity, size 12 & petites • Cacique, intimates Speed • Optimized vendor base + western hemisphere • Concept to market acceleration Pricing strategy & effectiveness • Opening price point value • Promotion rationalization • Product cost improvem
Slide 98: Fit / size opportunities
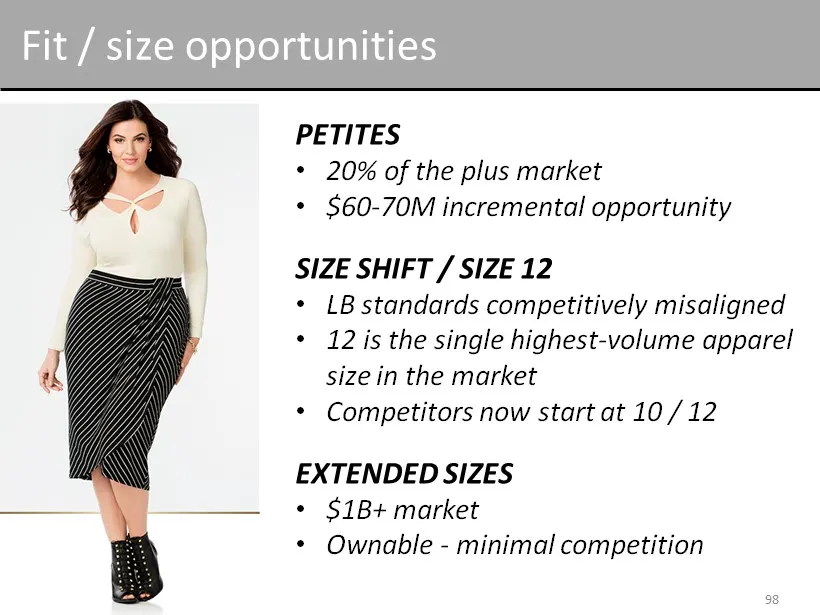
Fit / size opportunities PETITES • 20 % of the plus market • $60 - 70M incremental opportunity SIZE SHIFT / SIZE 12 • LB standards competitively misaligned • 12 is the single highest - volume apparel size in the market • Competitors now start at 10 / 12 EXTENDED SIZES • $1B+ market • Ownable - minim
Slide 99: Shapewear, Swim, Sleepwear Collections
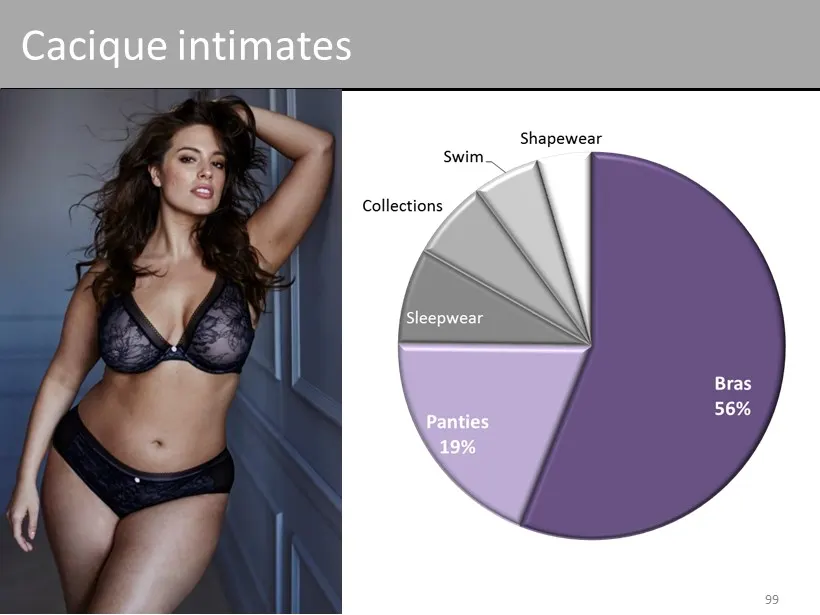
Shapewear Swim Collections / Sleepwear
Slide 100: Cacique intimates – product opportunity
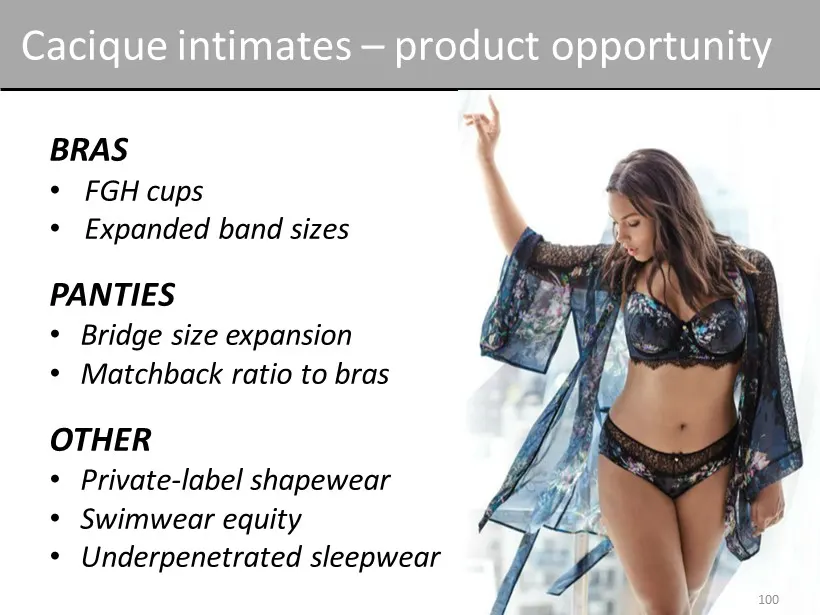
BRAS • FGH cups • Expanded band sizes PANTIES • Bridge size expansion • Matchback ratio to bras OTHER • Private - label shapewear • Swimwear equity • Underpenetrated sleepwear Cacique intimates – product opportunity 100
Slide 101: Cacique intimates – customer growth
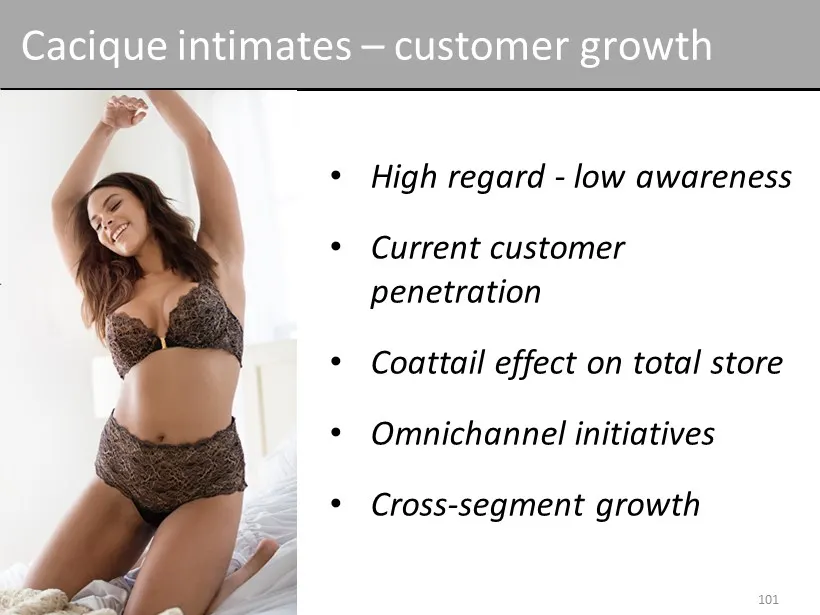
• High regard - low awareness • Current customer penetration • Coattail effect on total store • Omnichannel initiatives • Cross - segment growth Cacique intimates – customer growth 101
Slide 102: Summary
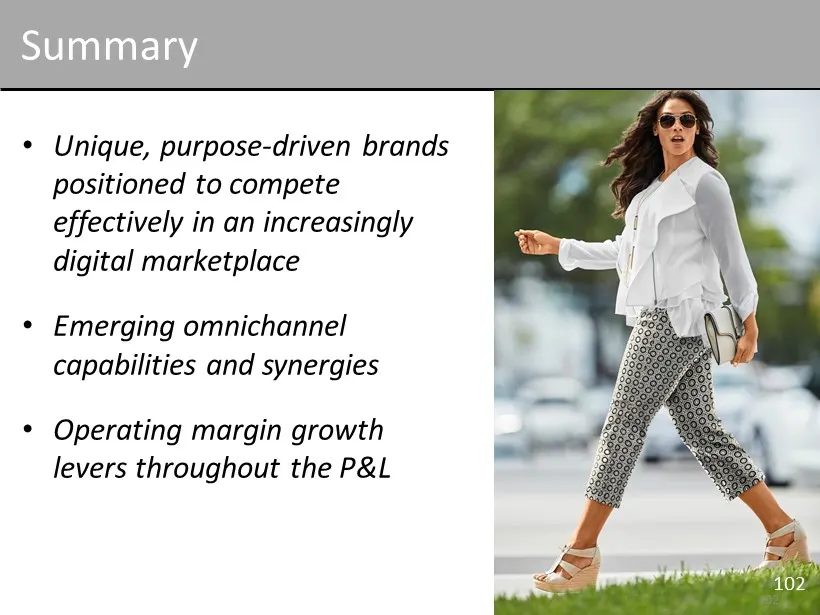
Summary 102 • Unique, purpose - driven brands positioned to compete effectively in an increasingly digital marketplace • Emerging omnichannel capabilities and synergies • Operating margin growth levers throughout the P&L 102
Slide 103: Kids Fashion Segment
Kids Fashion Segment Lece Lohr President
Slide 104: 104
104

Slide 105
Slide 106: Competitive Positioning
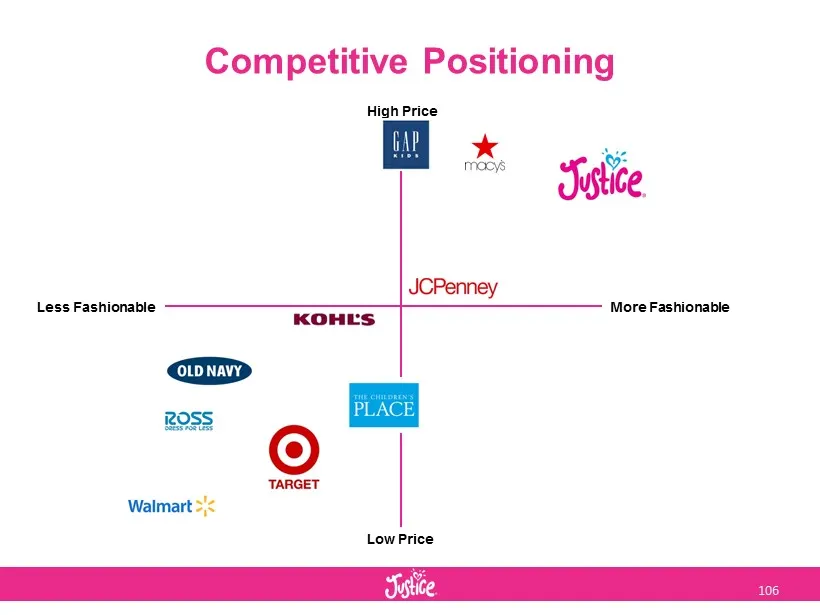
More Fashionable Less Fashionable Low Price High Price Competitive Positioning 106
Slide 107: Stabilizing Customer File
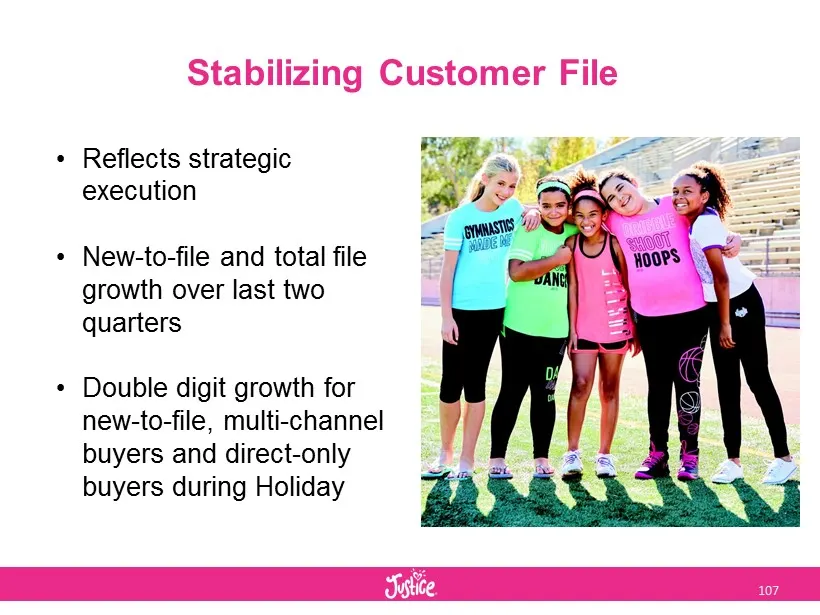
Stabilizing Customer File • Reflects strategic execution • New - to - file and total file growth over last two quarters • Double digit growth for new - to - file, multi - channel buyers and direct - only buyers during Holiday 107
Slide 108: Exclusively focused on the Tween girl (and Mom!)
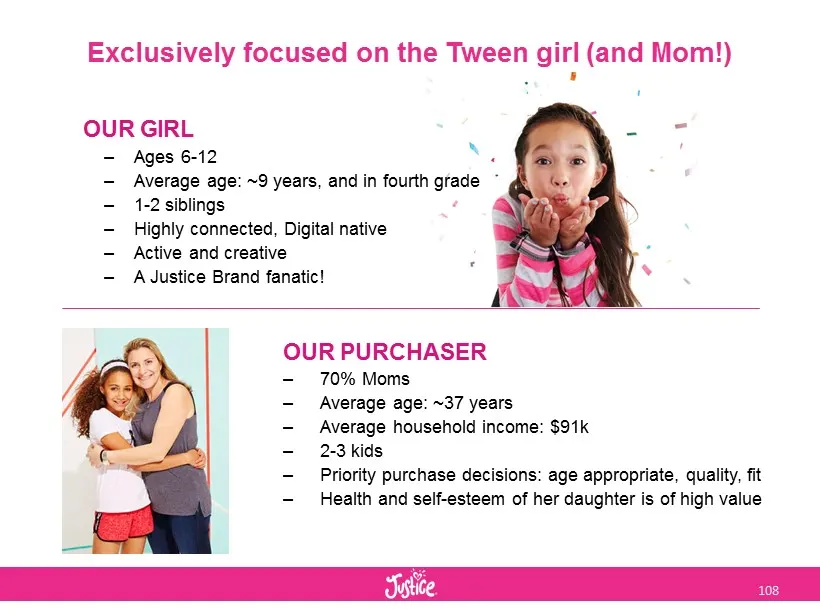
Exclusively focused on the Tween girl (and Mom!) OUR GIRL – Ages 6 - 12 – Average age: ~9 years, and in fourth grade – 1 - 2 siblings – Highly connected, Digital native – A ctive and creative – A Justice Brand fanatic! OUR PURCHASER – 70% Moms – Average age: ~37 years – Average household income: $91
Slide 109: Strategies for Growth
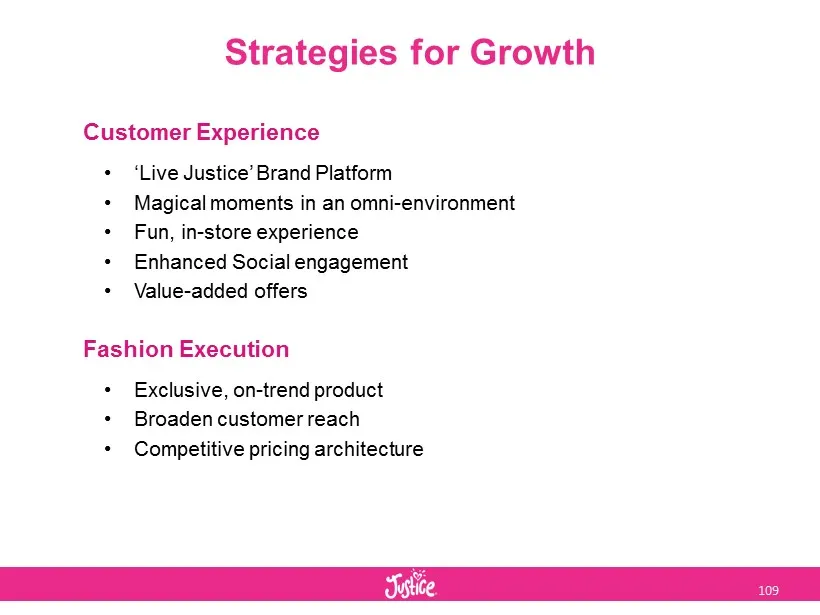
Strategies for Growth Customer Experience • ‘Live Justice’ Brand Platform • Magical moments in an omni - environment • Fun, in - store experience • Enhanced Social engagement • Value - added offers Fashion Execution • Exclusive, on - trend product • Broaden customer reach • Competitive pricing archi
Slide 110: Customer Experience
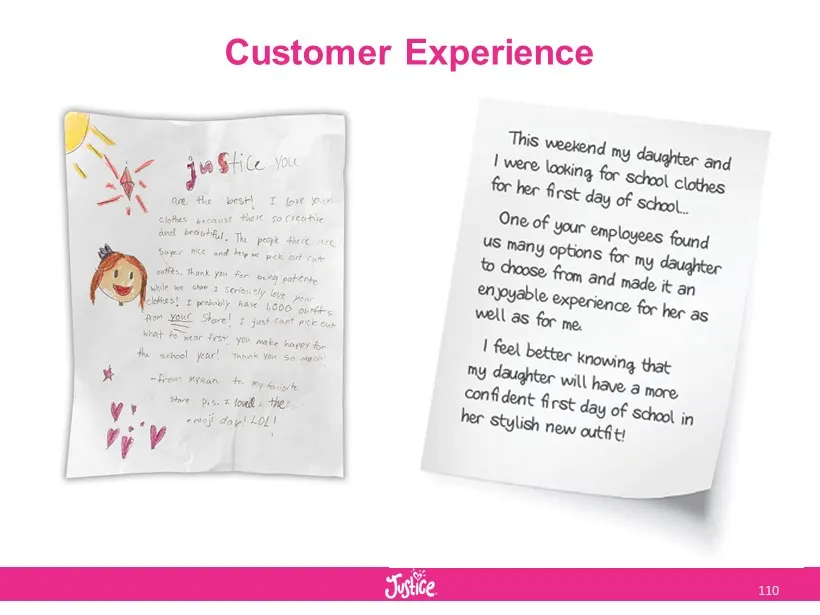
Customer Experience 110
Slide 111: 'Live Justice' Brand Platform
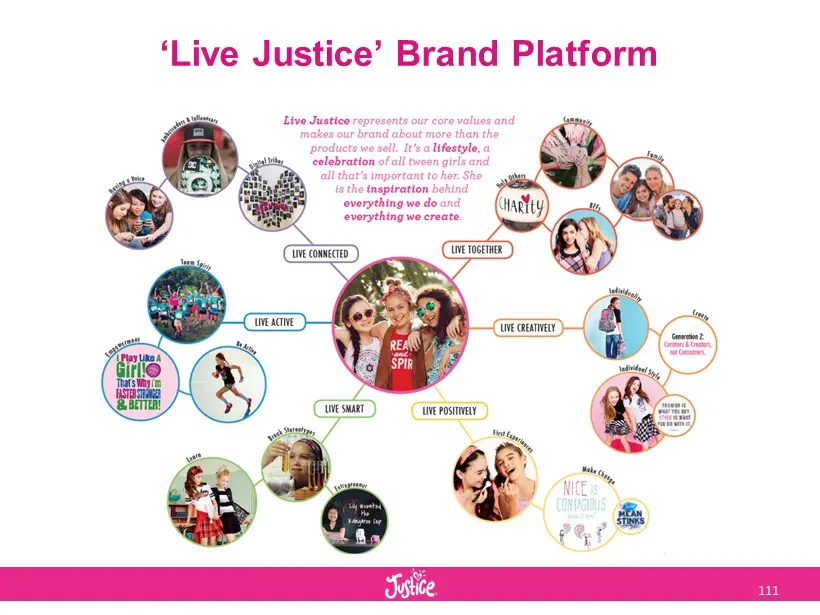
‘Live Justice’ Brand Platform 111
Slide 112: Magic Moments in an Omni-Environment
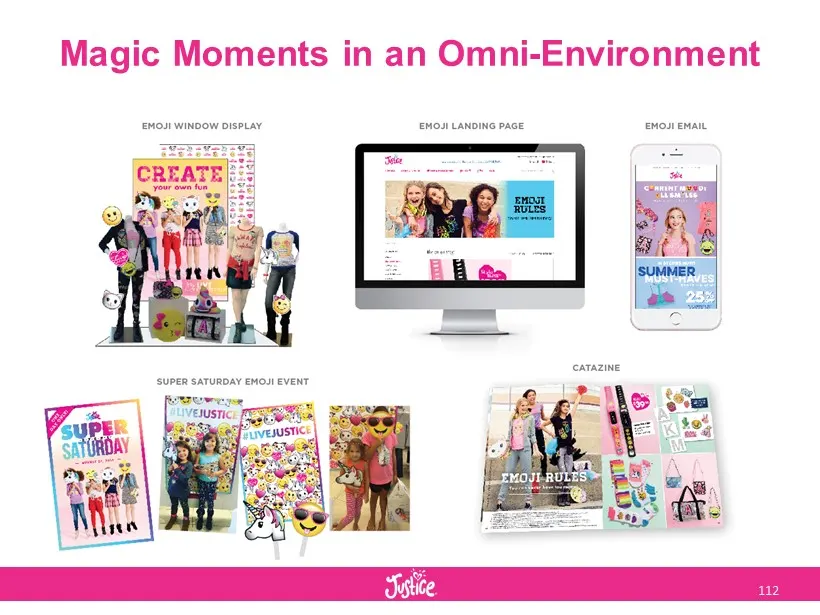
Magic Moments in an Omni - Environment 112
Slide 113: Fun In-Store Experience
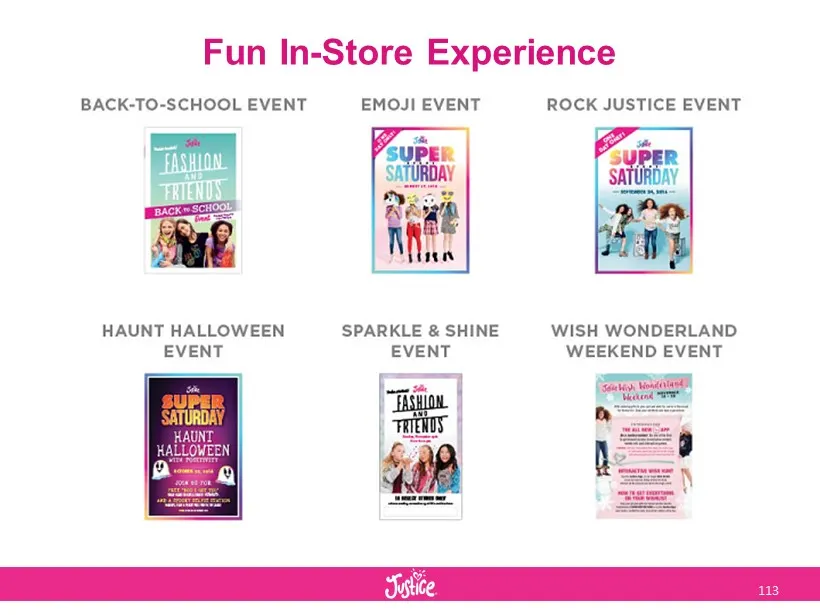
Fun In-Store Experience BACK-TO-SCHOOL EVENT EMOJI EVENT ROCK JUSTICE EVENT HAUNT HALLOWEEN SPARKLE & SHINE WISH WONDERLAND EVENT EVENT WEEKEND EVENT
Slide 114: Enhanced Social Engagement
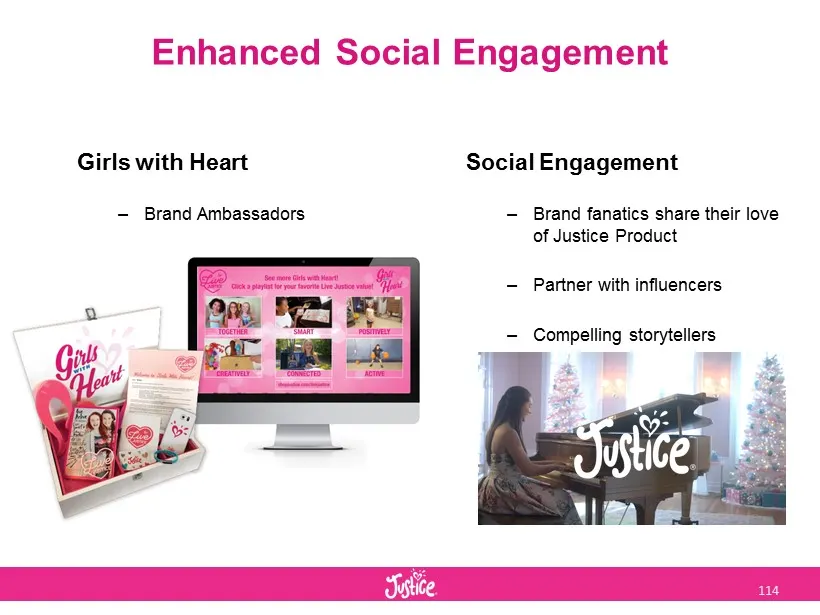
Enhanced Social Engagement Social Engagement – Brand fanatics share their love of Justice Product – Partner with influencers – Compelling storytellers Girls with Heart – Brand Ambassadors 114
Slide 115: Enhanced Social Engagement: 'Live Justice' App
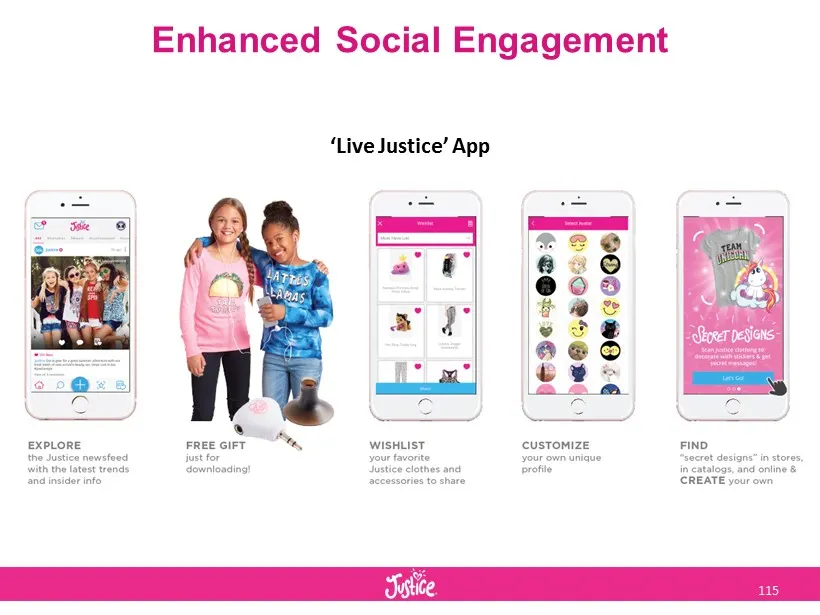
Enhanced Social Engagement ‘Live Justice’ App 115
Slide 116: Value Added Offers
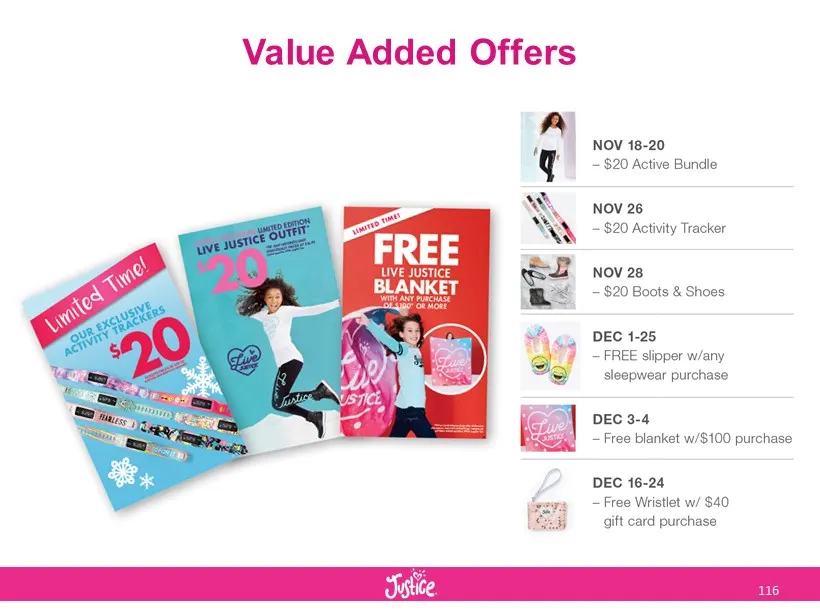
Value Added Offers Nov 18-20 ~ $20 Active Bundle Nov 26 = $20 Activity Tracker ee: Live JUSTICE Nov 28 BLANKET ~ $20 Boots & Shoes DEC 1-25 ~ FREE slipper w/any sleepwear purchase DEC 3-4 — Free blanket w/$100 purchase DEC 16-24 — Free Wristlet w/ $40 gift card purchase Tiustice
Slide 117: Fashion Execution
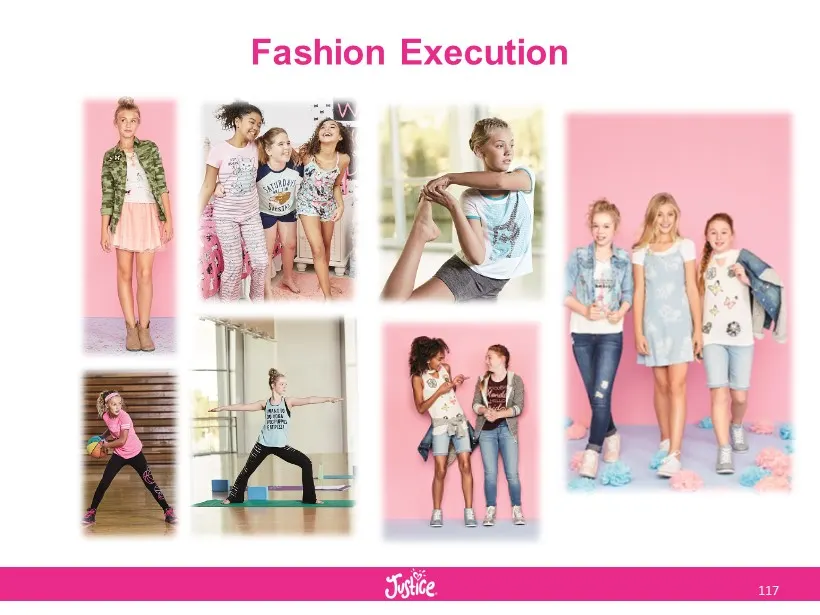
Fashion Execution 117
Slide 118: Exclusive, On-Trend Product
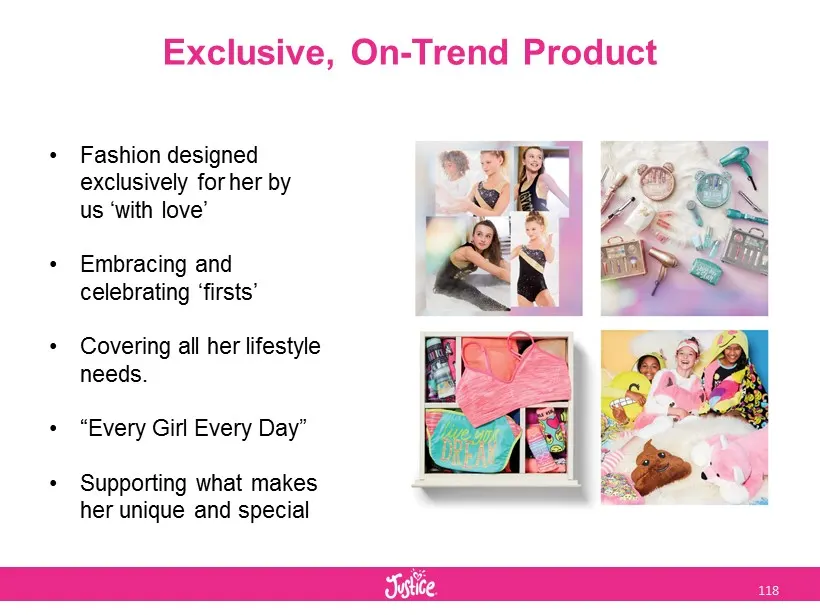
Exclusive, On - Trend Product • Fashion designed exclusively for her by us ‘with love’ • Embracing and celebrating ‘firsts’ • Covering all her lifestyle needs. • “Every Girl Every Day” • Supporting what makes her unique and special 118
Slide 119: Broaden Customer Reach
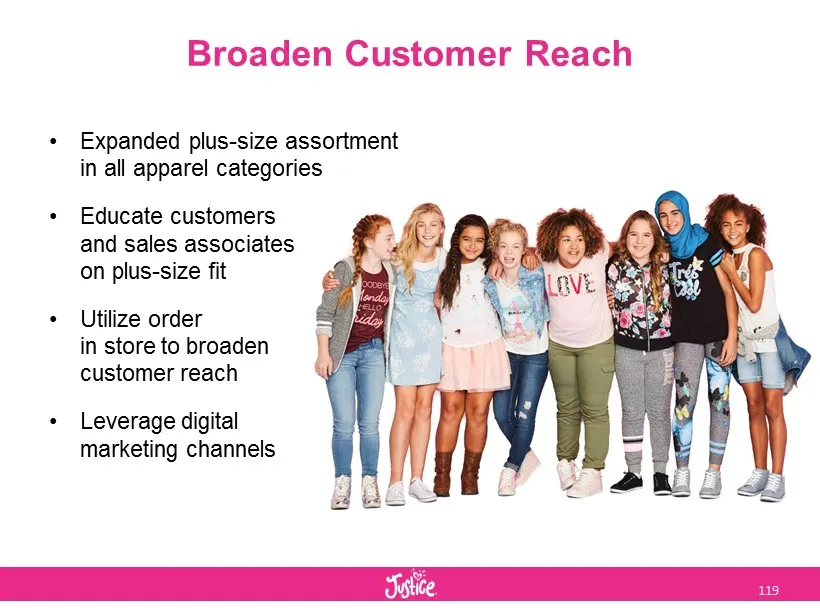
Broaden Customer Reach • Expanded plus - size assortment in all apparel categories • Educate customers and sales associates on plus - size fit • Utilize order in store to broaden customer reach • Leverage digital marketing channels 119
Slide 120: Competitive Pricing Architecture
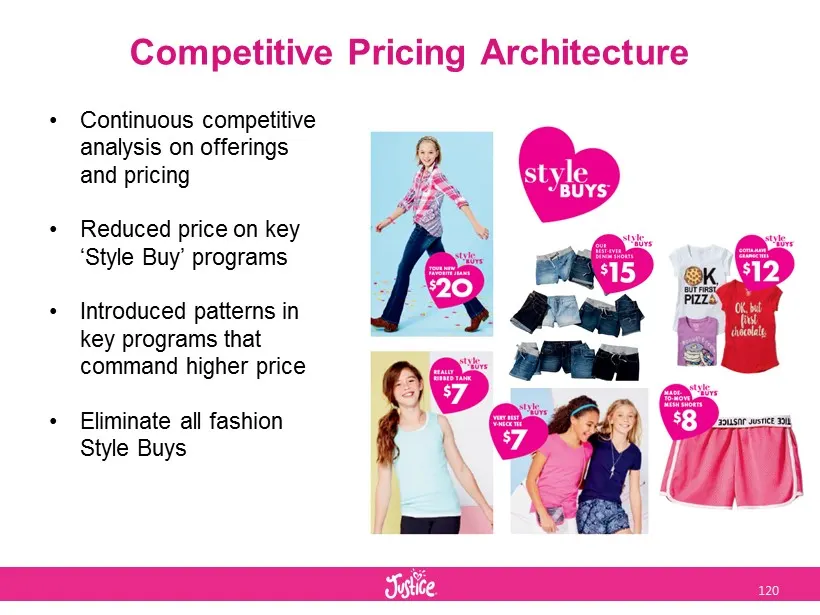
Competitive Pricing Architecture • Continuous competitive analysis on offerings and pricing • Reduced price on key ‘Style Buy’ programs • Introduced patterns in key programs that command higher price • Eliminate all f ashion Style Buys 120
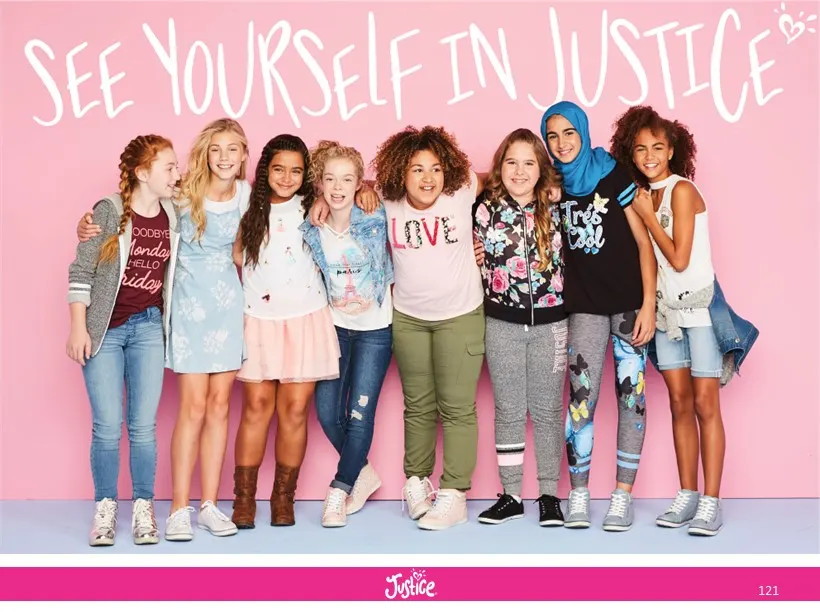
Slide 121: 121
121
Slide 122: Management Team Q&A
ascena Management Team Q&A

Slide 123: Supplemental Material
dressbarn maurices pa ascena RETAIL GROUP IN Supplemental Material ale LANEBRVANT CATHERINES ANN TA
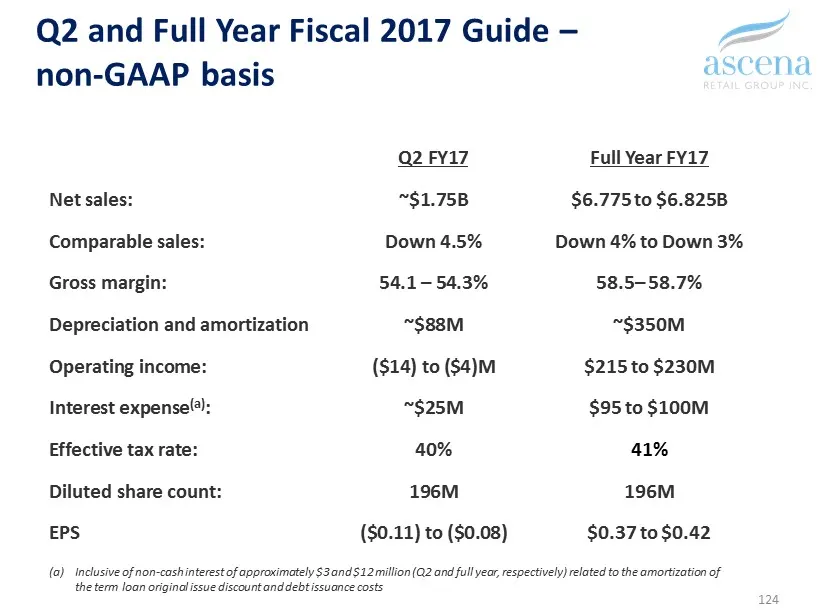
Slide 124: Q2 and Full Year Fiscal 2017 Guide – non-GAAP basis
Q2 and Full Year Fiscal 2017 Guide – non - GAAP basis 124 Q2 FY17 Full Year FY17 Net sales: ~$1.75B $6.775 to $6.825B Comparable sales: Down 4.5% Down 4% to Down 3% Gross margin: 54.1 – 54.3% 58.5 – 58.7% Depreciation and amortization ~$88M ~$350M Operating income: ($14) to ($4)M $215 to $230M Inter
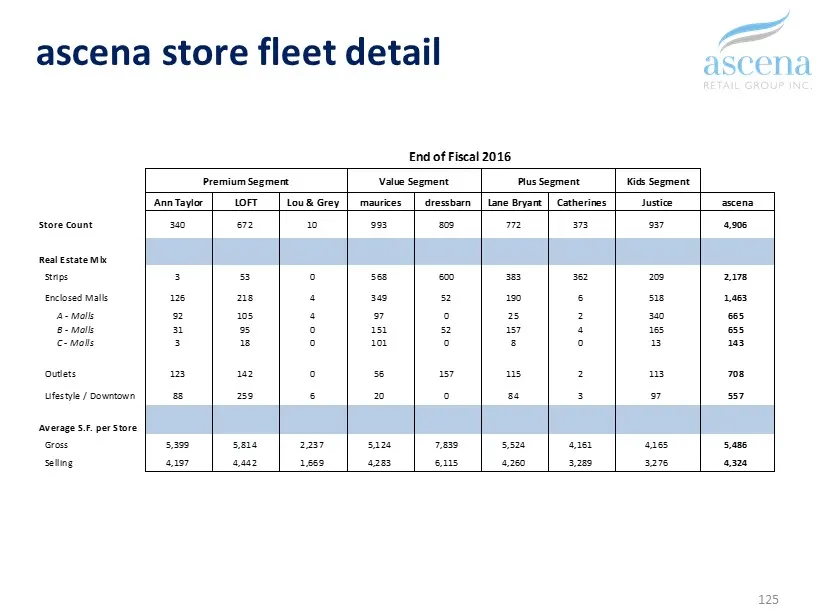
Slide 125: Ascena store fleet detail
a scena store fleet detail 125 End of Fiscal 2016 Premium Segment Value Segment Plus Segment Kids Segment Ann Taylor LOFT Lou & Grey maurices dressbarn Lane Bryant Catherines Justice ascena Store Count 340 672 10 993 809 772 373 937 4,906 Real Estate Mix Strips 3 53 0 568 600 383 362 209 2,178 Enclo
Slide 126: Premium Fashion segment – Ann Taylor overview
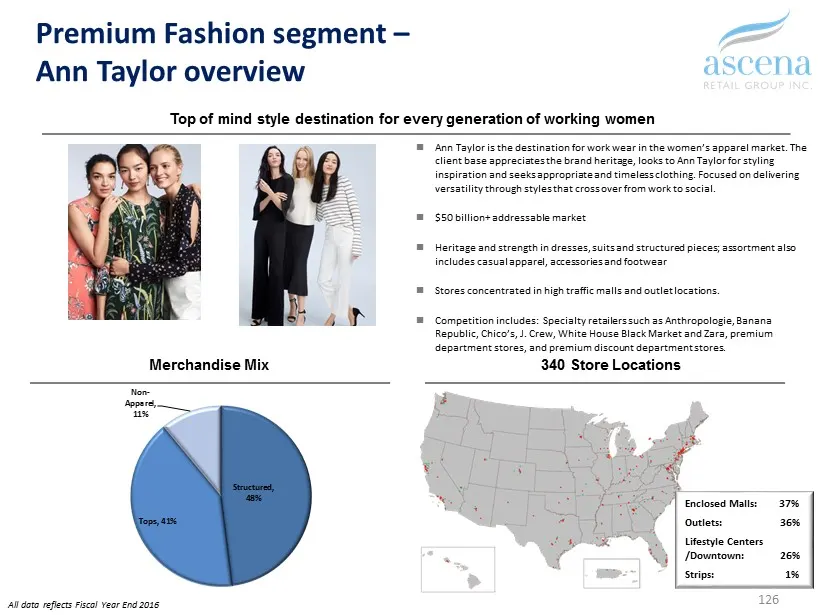
Premium Fashion segment – Ann Taylor overview 126 Top of mind style destination for every generation of working women Merchandise Mix 340 Store Locations Enclosed Malls: 37% Outlets: 36% Lifestyle Centers / Downtown: 26 % Strips : 1 % All data reflects Fiscal Year End 2016 ; Ann Taylor is the destin
Slide 127: Premium Fashion segment – LOFT overview
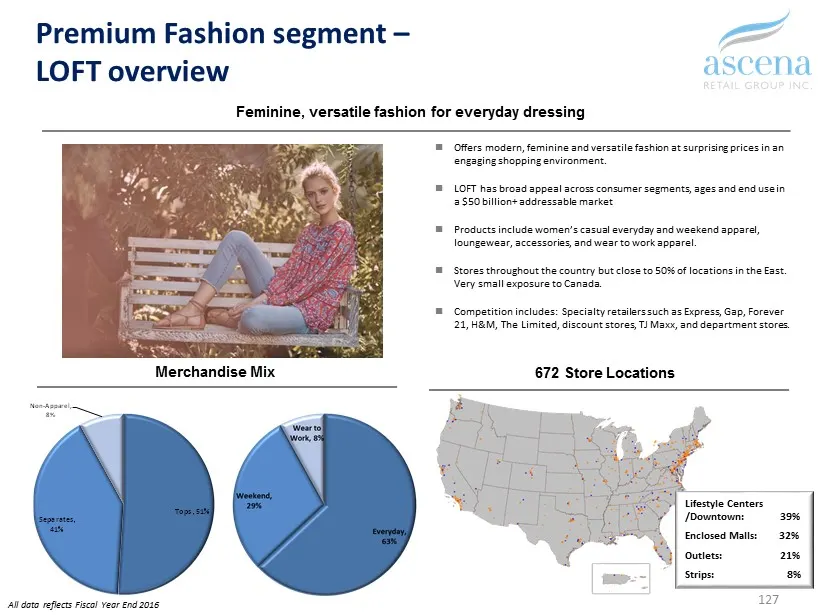
Premium Fashion segment – LOFT overview 127 Feminine , versatile fashion for everyday dressing Merchandise Mix 672 Store Locations Tops, 51% Separates, 41% Non - Apparel, 8% ; Offers modern, feminine and versatile fashion at surprising prices in an engaging shopping environment. ; LOFT has broad app
Slide 128: Premium Fashion segment – Lou & Grey overview
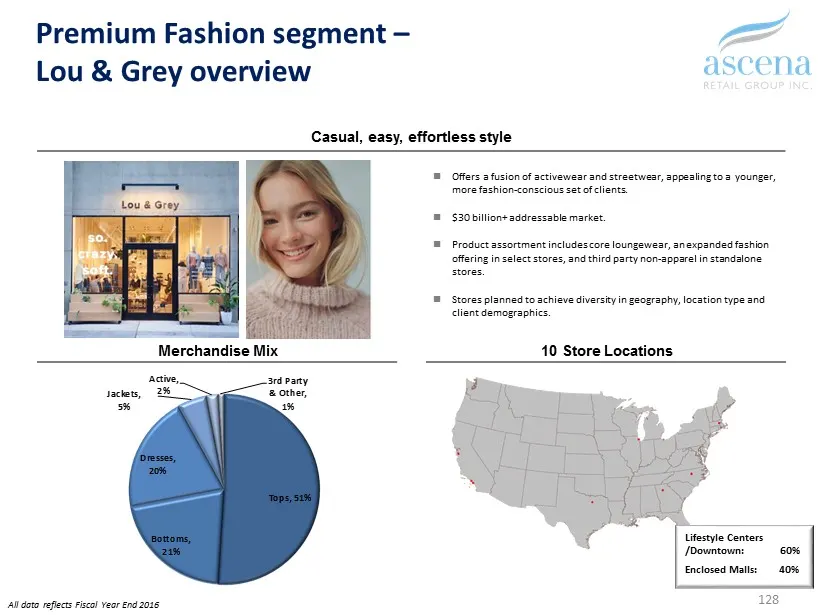
Tops, 51% Bottoms, 21% Dresses, 20% Jackets, 5% Active, 2% 3rd Party & Other, 1% Premium Fashion segment – Lou & Grey overview 128 Casual, easy, effortless style Merchandise Mix 10 Store Locations ; Offers a fusion of activewear and streetwear, appealing to a younger, more fashion - conscious set of
Slide 129: Value Fashion segment – maurices overview
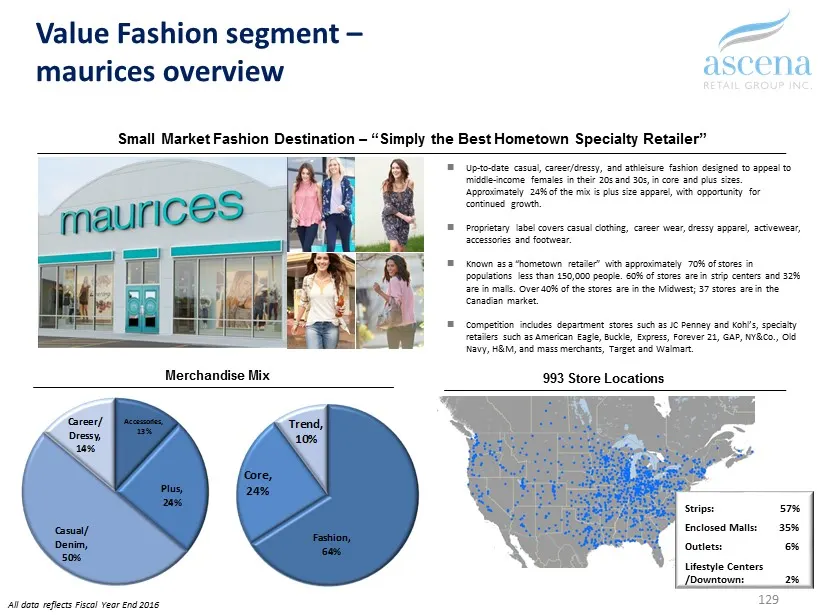
Value Fashion segment – maurices overview 129 993 Store Locations Merchandise Mix Small Market Fashion Destination – “Simply the Best Hometown Specialty Retailer” All data reflects Fiscal Year End 2016 ; Up - to - date casual, career/dressy, and athleisure fashion designed to appeal to middle - inco
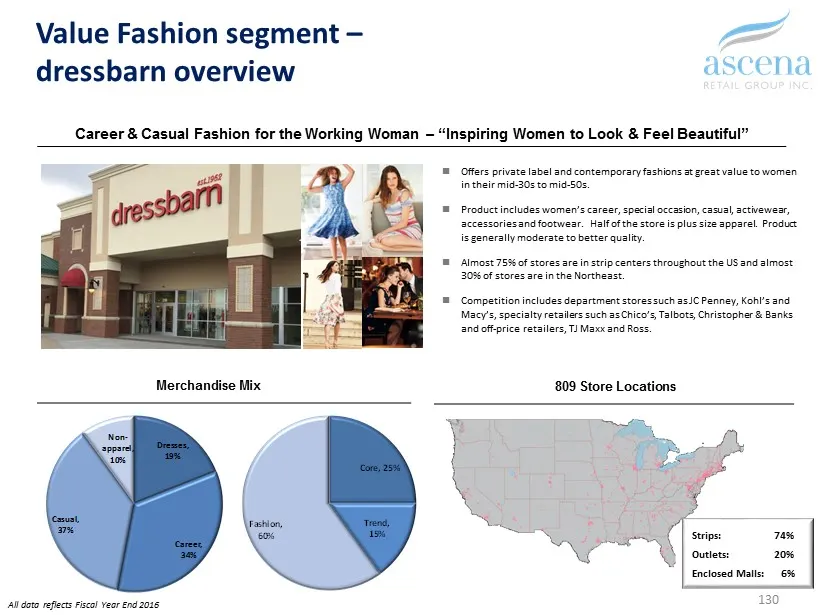
Slide 130: Value Fashion segment – dressbarn overview
Value Fashion segment – dressbarn overview 130 Career & Casual Fashion for the Working Woman – “Inspiring Women to Look & Feel Beautiful” Merchandise Mix 809 Store Locations Dresses, 19% Career, 34% Casual, 37% Non - apparel, 10% Strips: 74% Outlets: 20% Enclosed Malls: 6% All data reflects Fiscal Y
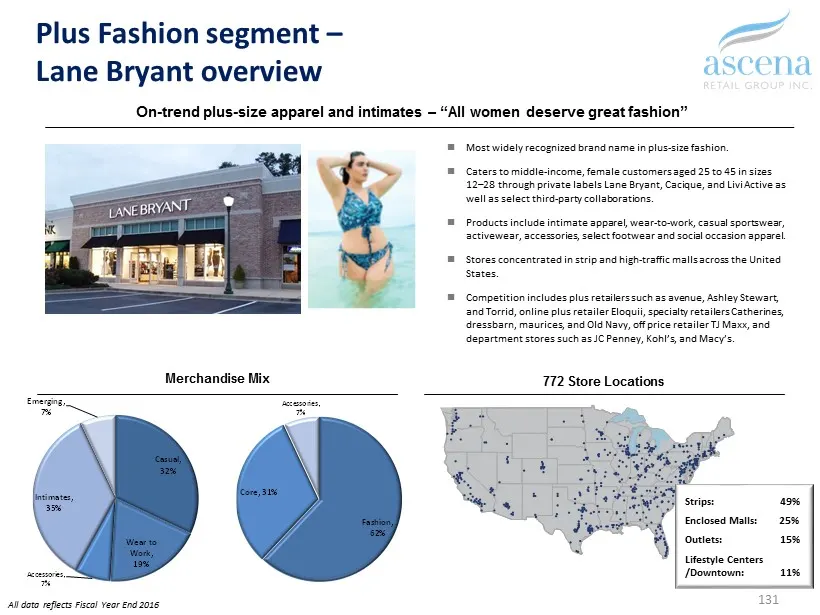
Slide 131: Plus Fashion segment – Lane Bryant overview
Fashion, 62% Core, 31% Accessories, 7% Plus Fashion segment – Lane Bryant overview 131 On - trend plus - size apparel and intimates – “All women deserve great fashion ” ; Most widely recognized brand name in plus - size fashion. ; Caters to middle - income, female customers aged 25 to 45 in sizes 12
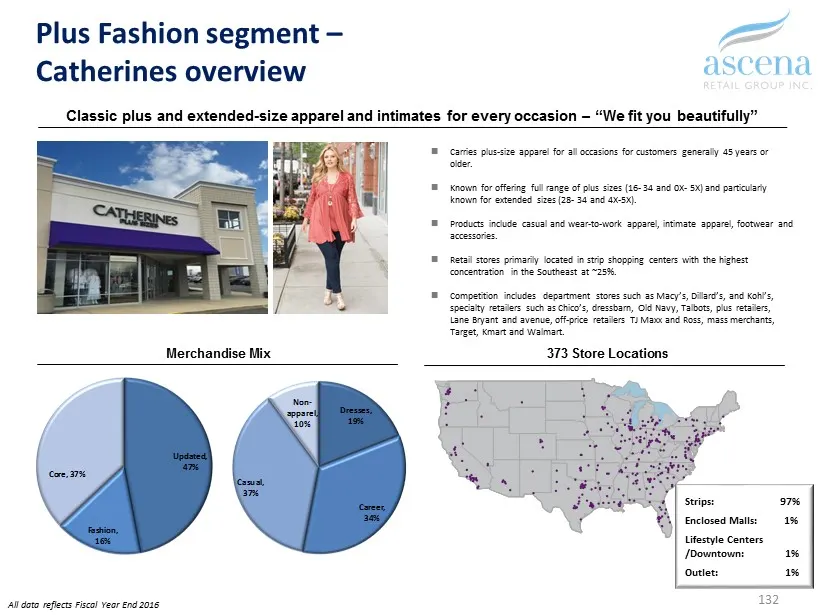
Slide 132: Plus Fashion segment – Catherines overview
Dresses, 19% Career, 34% Casual, 37% Non - apparel, 10% Plus Fashion segment – Catherines overview 132 Merchandise Mix Classic plus and extended - size apparel and intimates for every occasion – “We fit you beautifully” ; Carries plus - size apparel for all occasions for customers generally 45 years
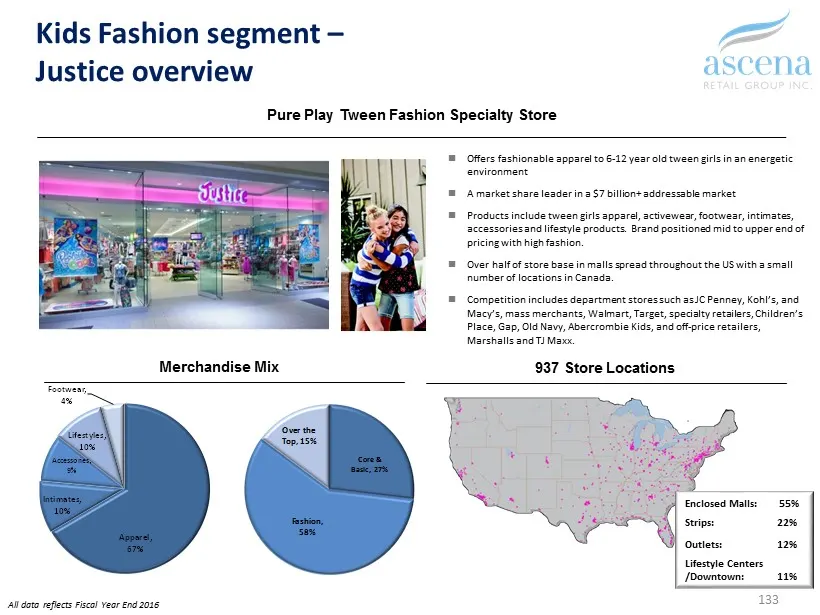
Slide 133: Kids Fashion segment – Justice overview
Core & Basic, 27% Fashion, 58% Over the Top, 15% All data reflects Fiscal Year End 2016 Kids Fashion segment – Justice overview 133 Pure Play Tween Fashion Specialty Store Merchandise Mix 937 Store Locations ; Offers fashionable apparel to 6 - 12 year old tween girls in an energetic environment ; A
Source: SEC EDGAR · 8-K filed Jan 18, 2017
More decks from Ascena Retail Group Inc
 Q2 FY2020 Earnings Presentation9 slides · Mar 9, 2020
 Q1 FY2020 Earnings Presentation9 slides · Dec 9, 2019
 Q4 FY2019 Earnings Presentation9 slides · Oct 3, 2019
 Earnings Presentation (June 2019)5 slides · Jun 10, 2019
 Q3 2019 Earnings Presentation11 slides · Jun 10, 2019
 Q2 FY2019 Earnings Presentation12 slides · Mar 14, 2019