Home Loan Servicing Solutions Ltd
Home Loan Servicing Solutions — Investor Presentation (May 2013)
16 slides from Home Loan Servicing Solutions's investor presentation, May 13, 2013
Slide 1: Investor Presentation May 2013
Exhibit 99.1 Investor Presentation May 2013
Slide 2: Forward-Looking Statement and Non-GAAP Measures
FORWARD-LOOKING STATEMENT: This presentation contains forward-looking statements that involve substantial risks and uncertainties. All statements, other than statements of historical facts, included in this presentation, including, without limitation, statements regarding the assumptions we make abo
Slide 3: Leadership Team
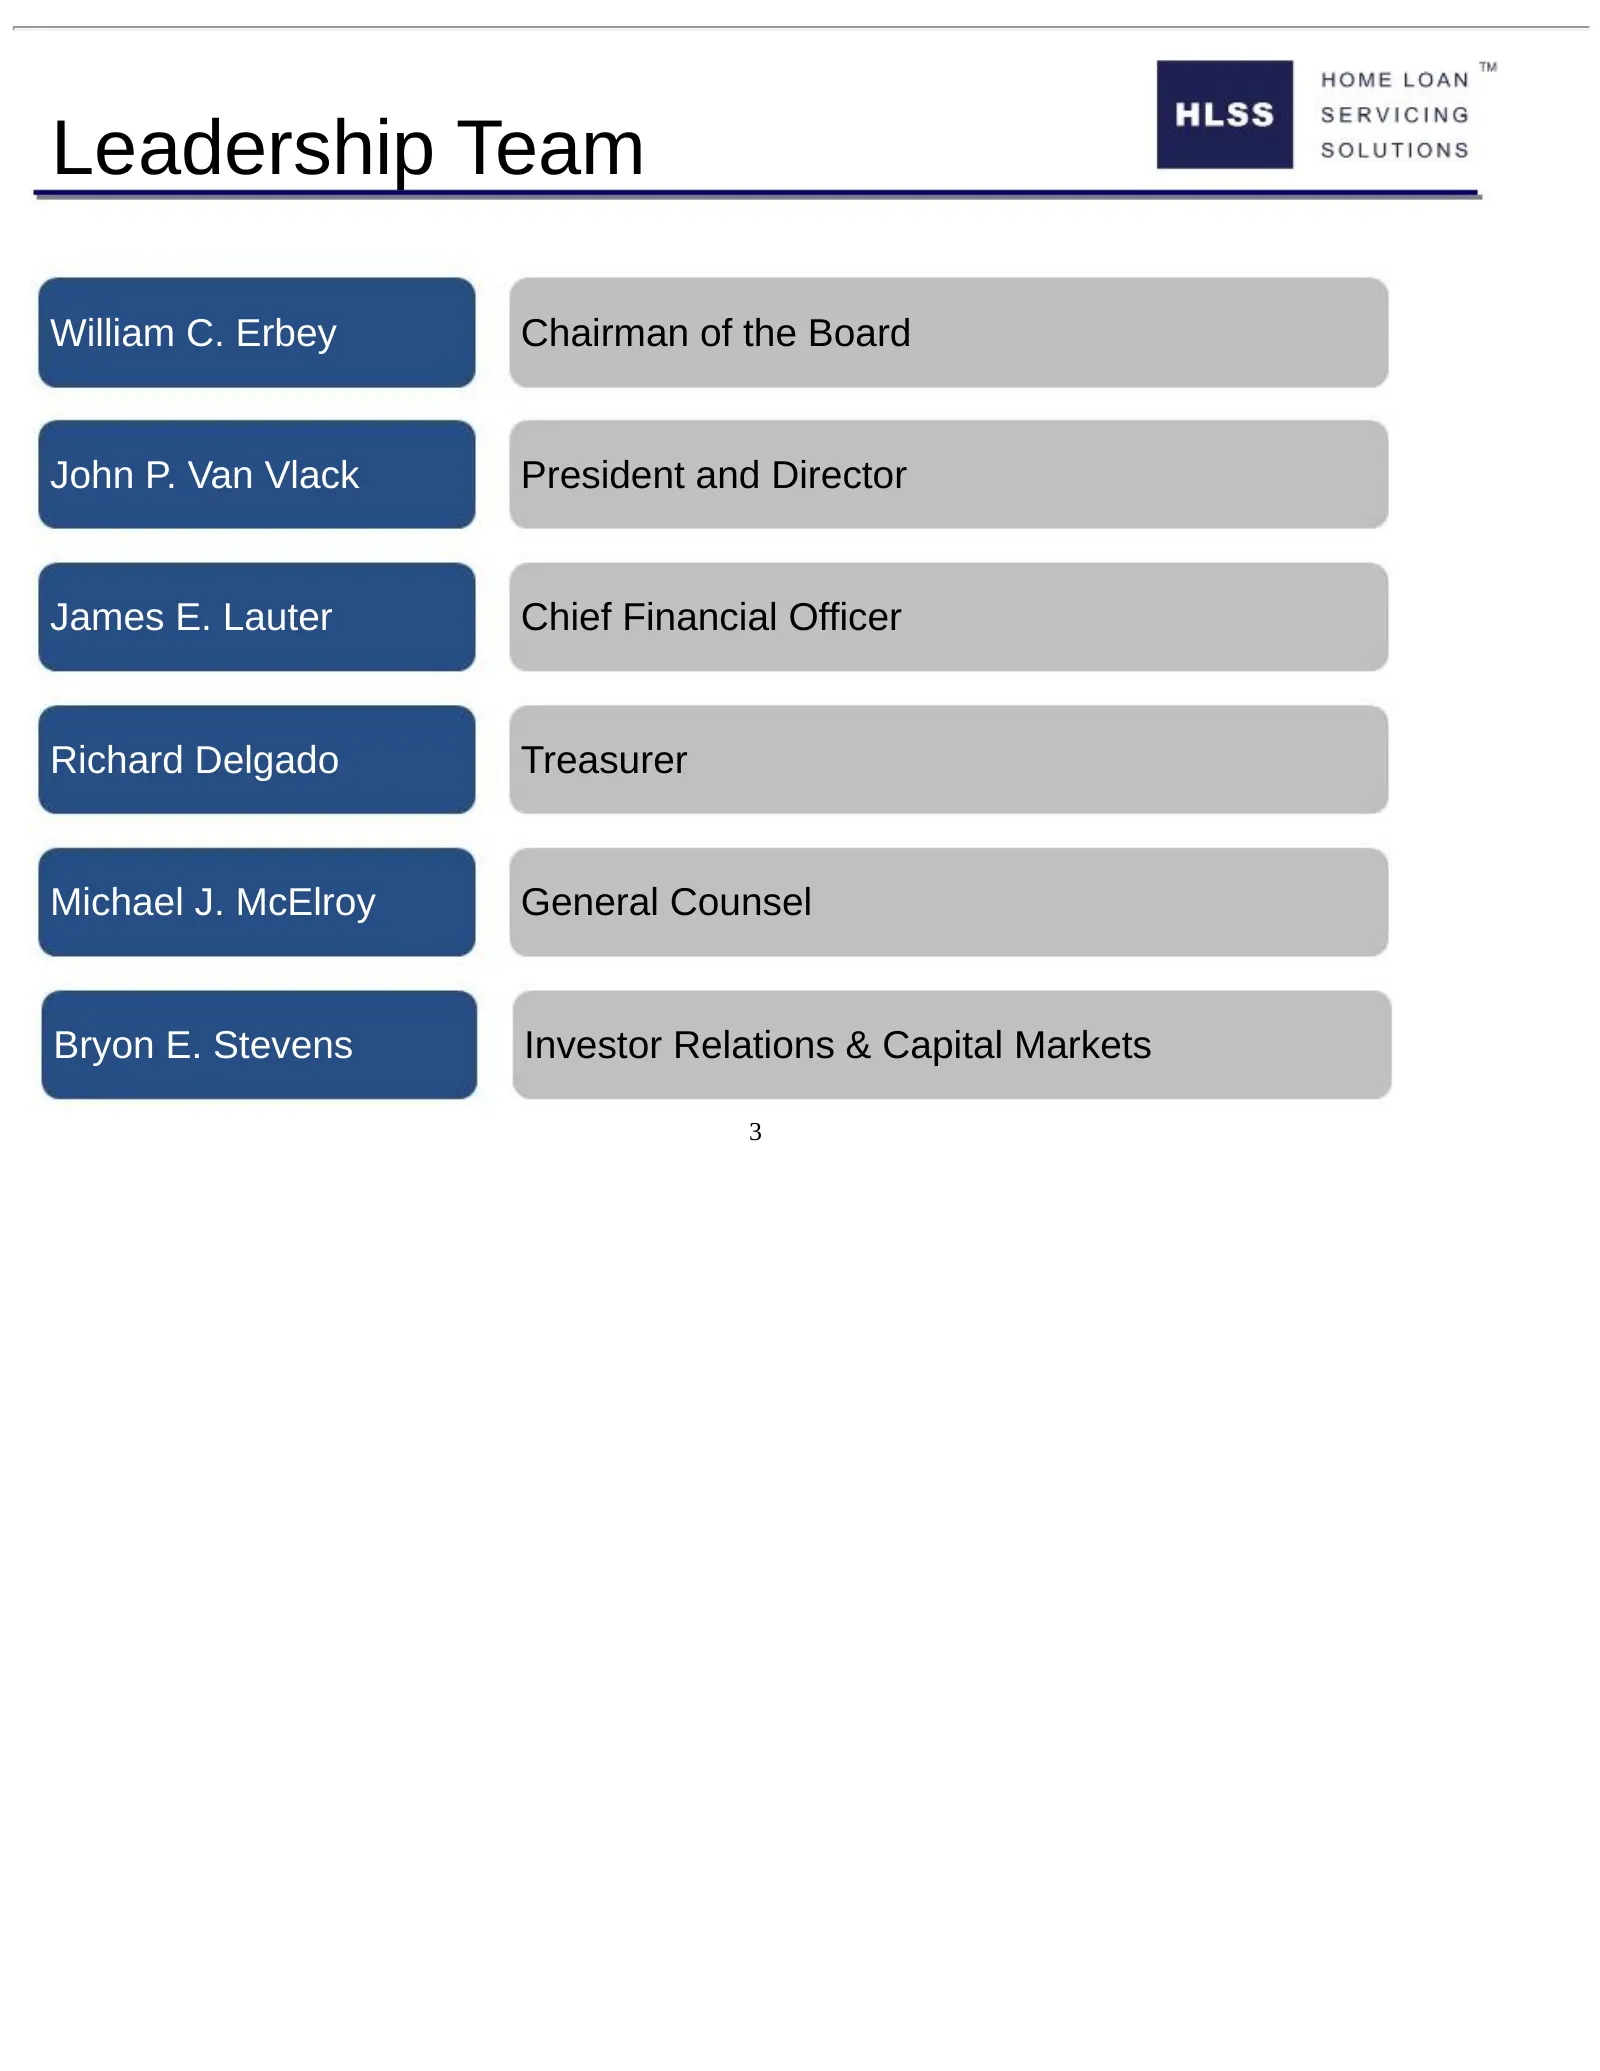
Leadership Team William C. Erbey Chairman of the Board John P. Van Vlack President and Director James E. Lauter Chief Financial Officer Richard Delgado Treasurer Michael J. McElroy General Counsel Bryon E. Stevens Investor Relations & Capital Markets 3
Slide 4: HLSS Overview
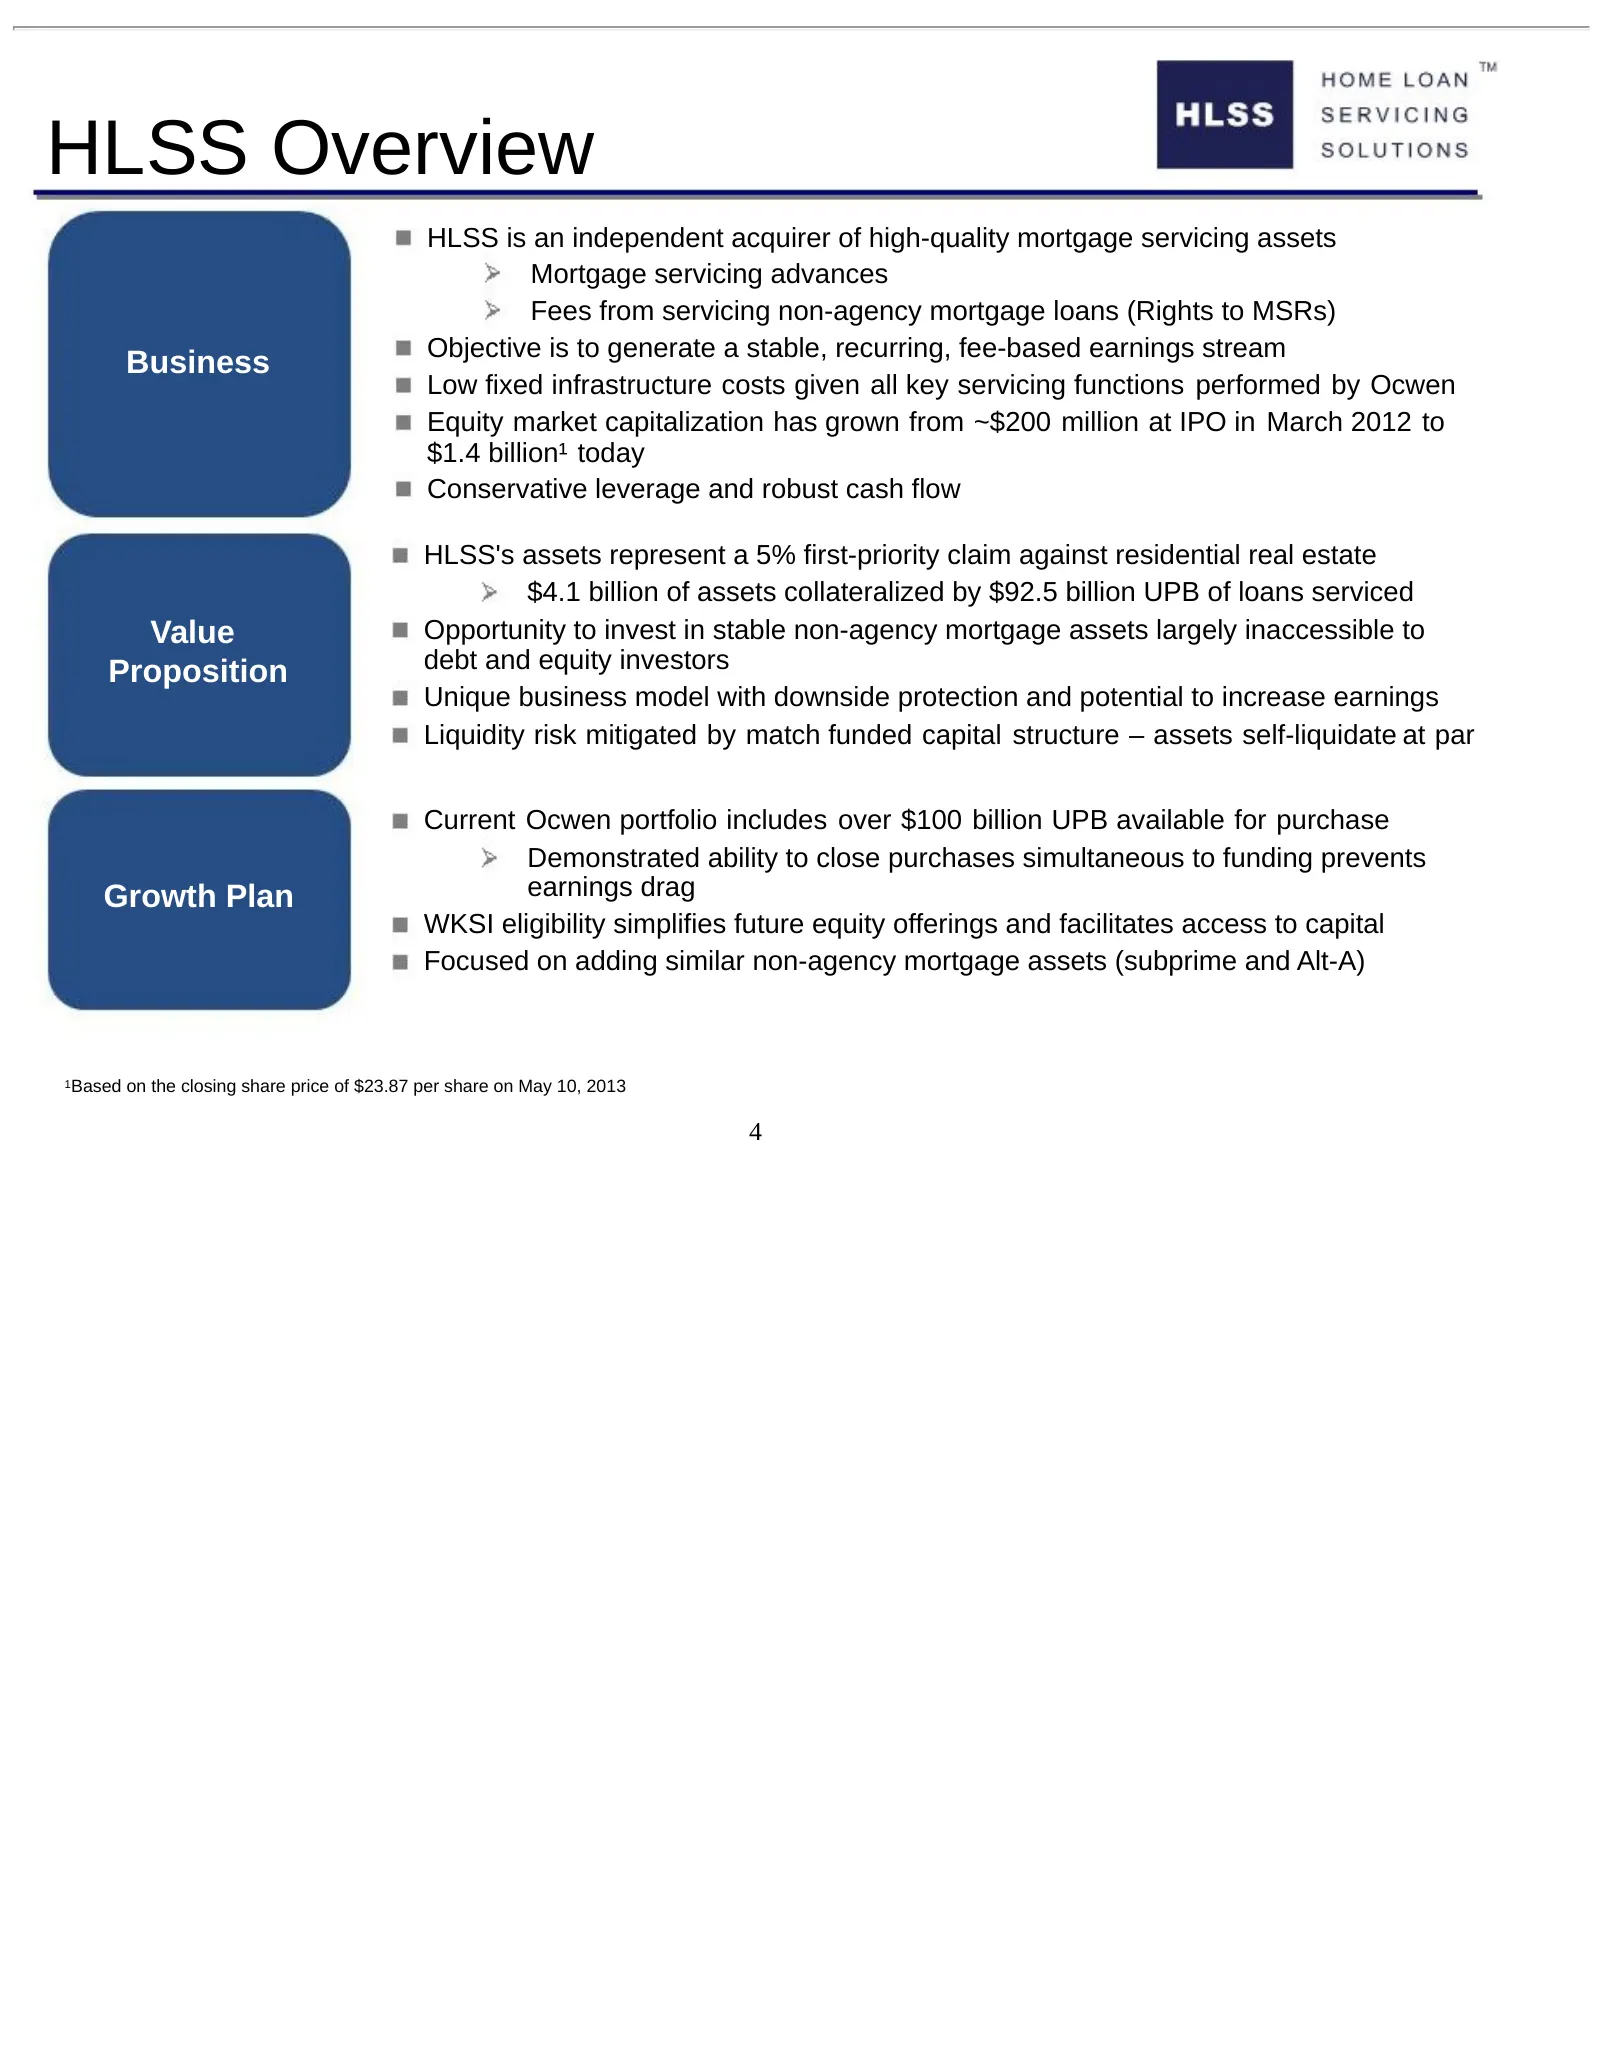
HLSS Overview HLSS is an independent acquirer of high-quality mortgage servicing assets Mortgage servicing advances Fees from servicing non-agency mortgage loans (Rights to MSRs) Objective is to generate a stable, recurring, fee-based earnings stream Business Low fixed infrastructure costs given all
Slide 5: Mortgage Servicing
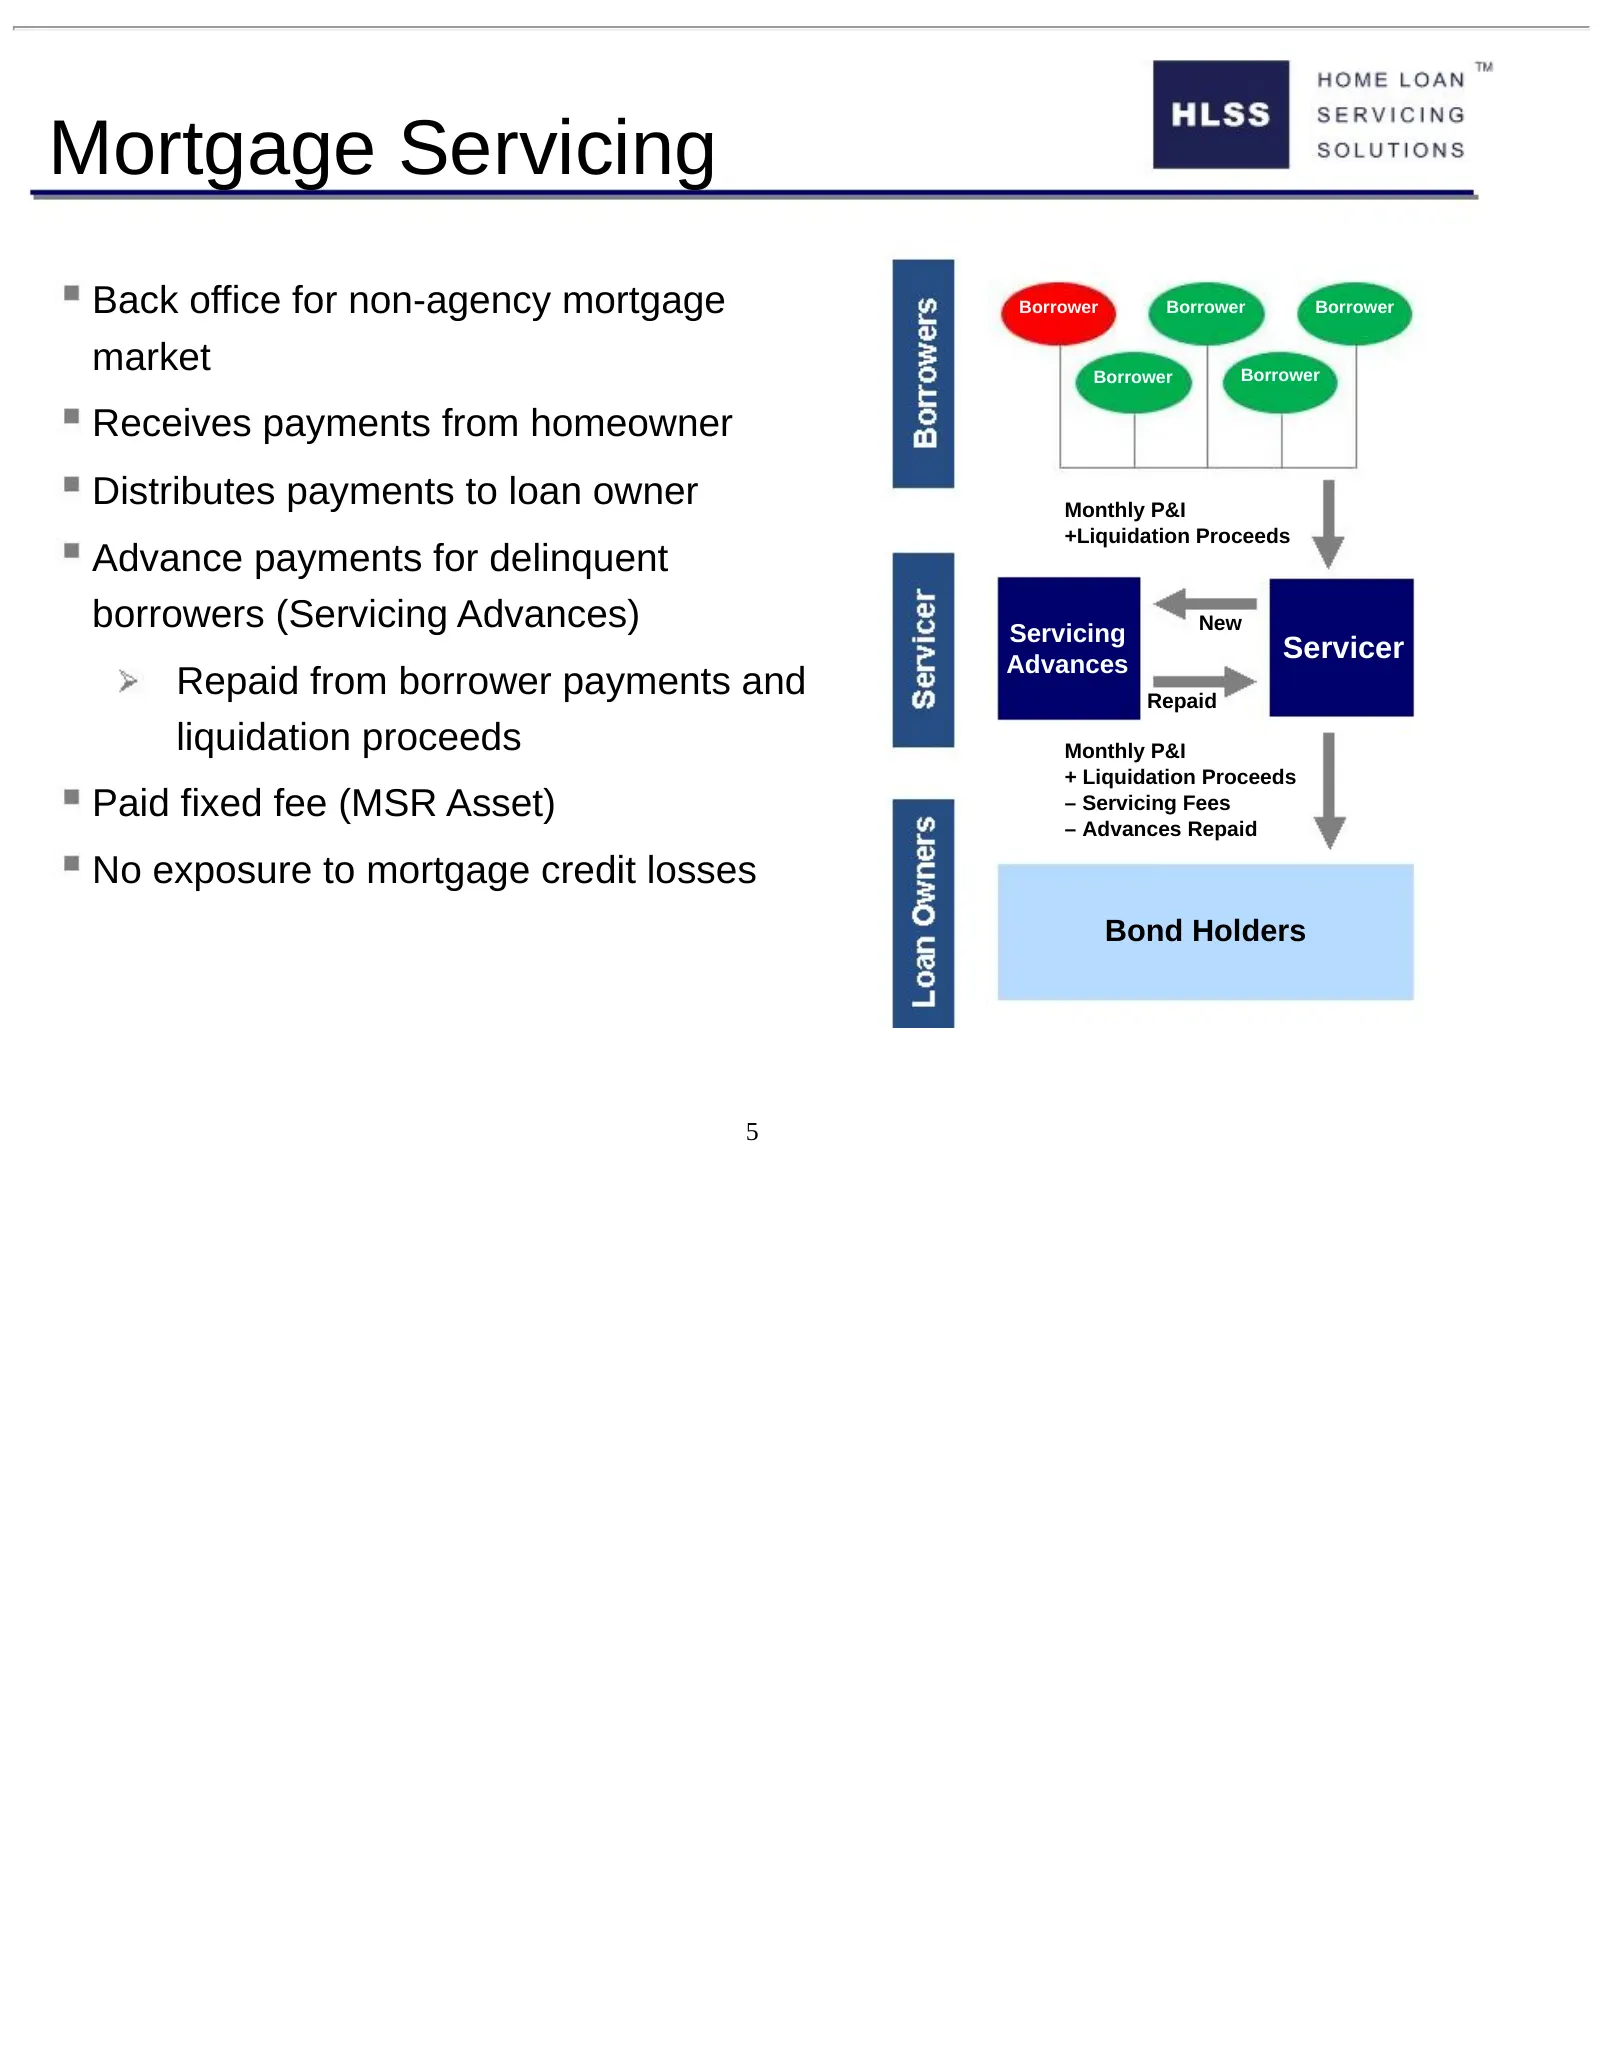
Mortgage Servicing Back office for non-agency mortgage Borrower Borrower Borrower market Borrower Borrower Receives payments from homeowner Distributes payments to loan owner Monthly P&I +Liquidation Proceeds Advance payments for delinquent borrowers (Servicing Advances) Servicing New Advances Servi
Slide 6: Assets Are a 5% First-Priority Claim
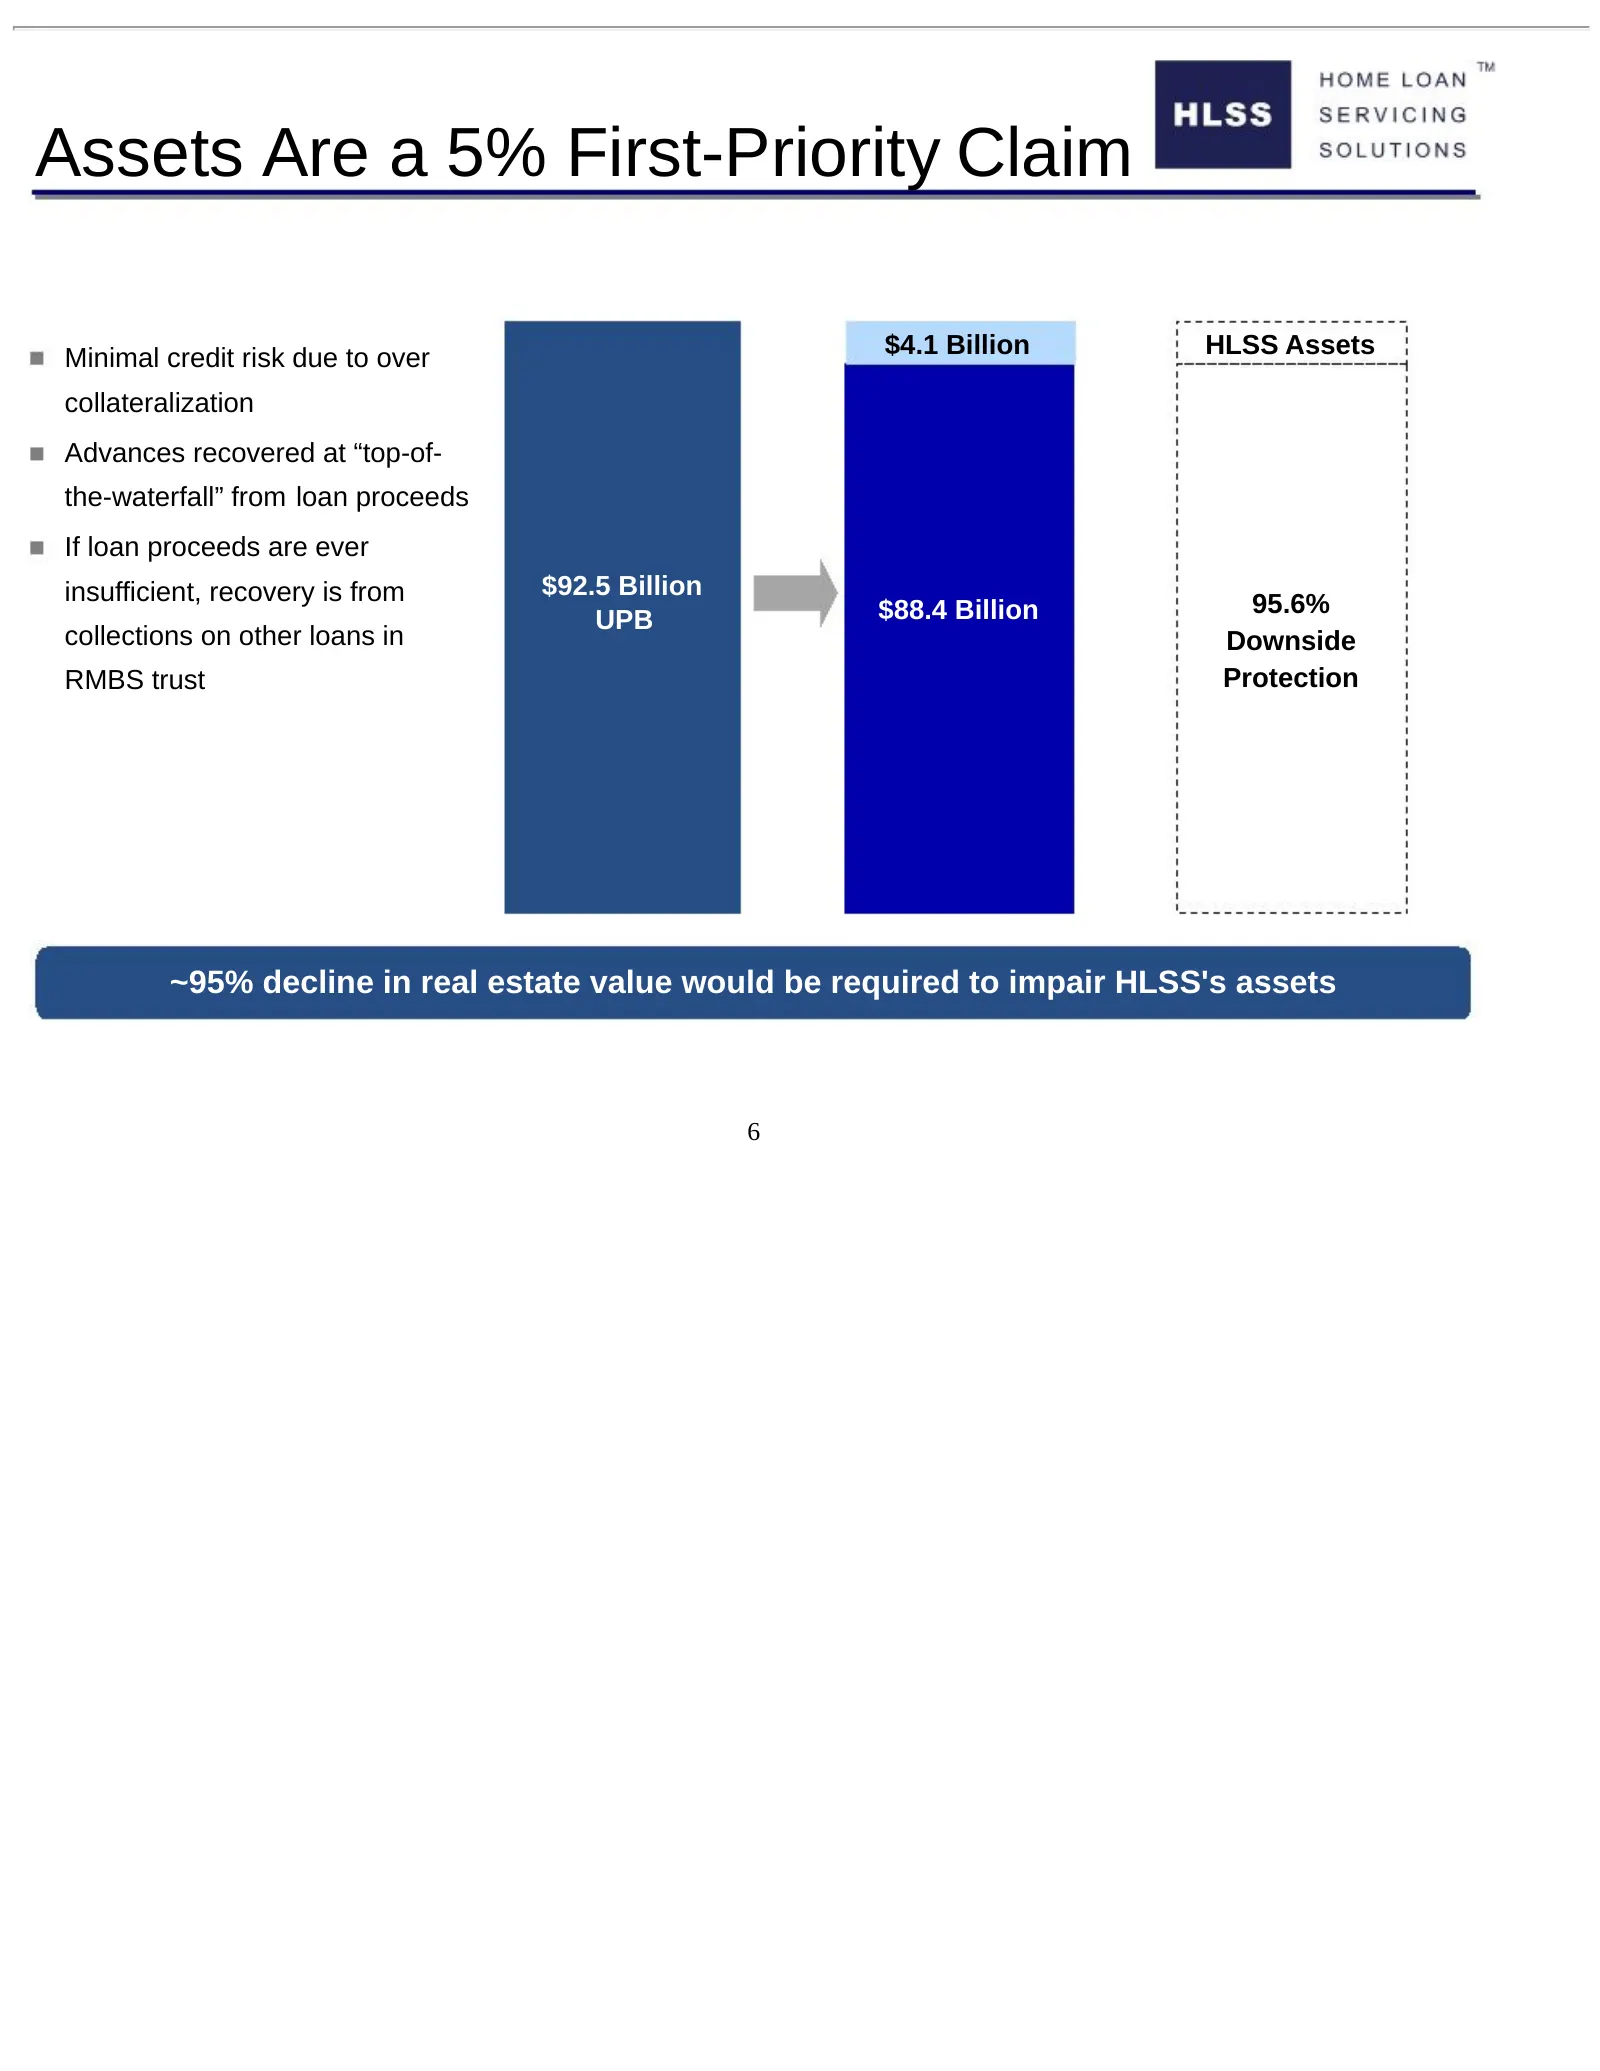
Assets Are a 5% First-Priority Claim Minimal credit risk due to over $4.1 Billion HLSS Assets collateralization Advances recovered at “top-of- the-waterfall” from loan proceeds If loan proceeds are ever insufficient, recovery is from $92.5 Billion $88.4 Billion 95.6% UPB collections on other loans i
Slide 7: Limited Valuation Risk
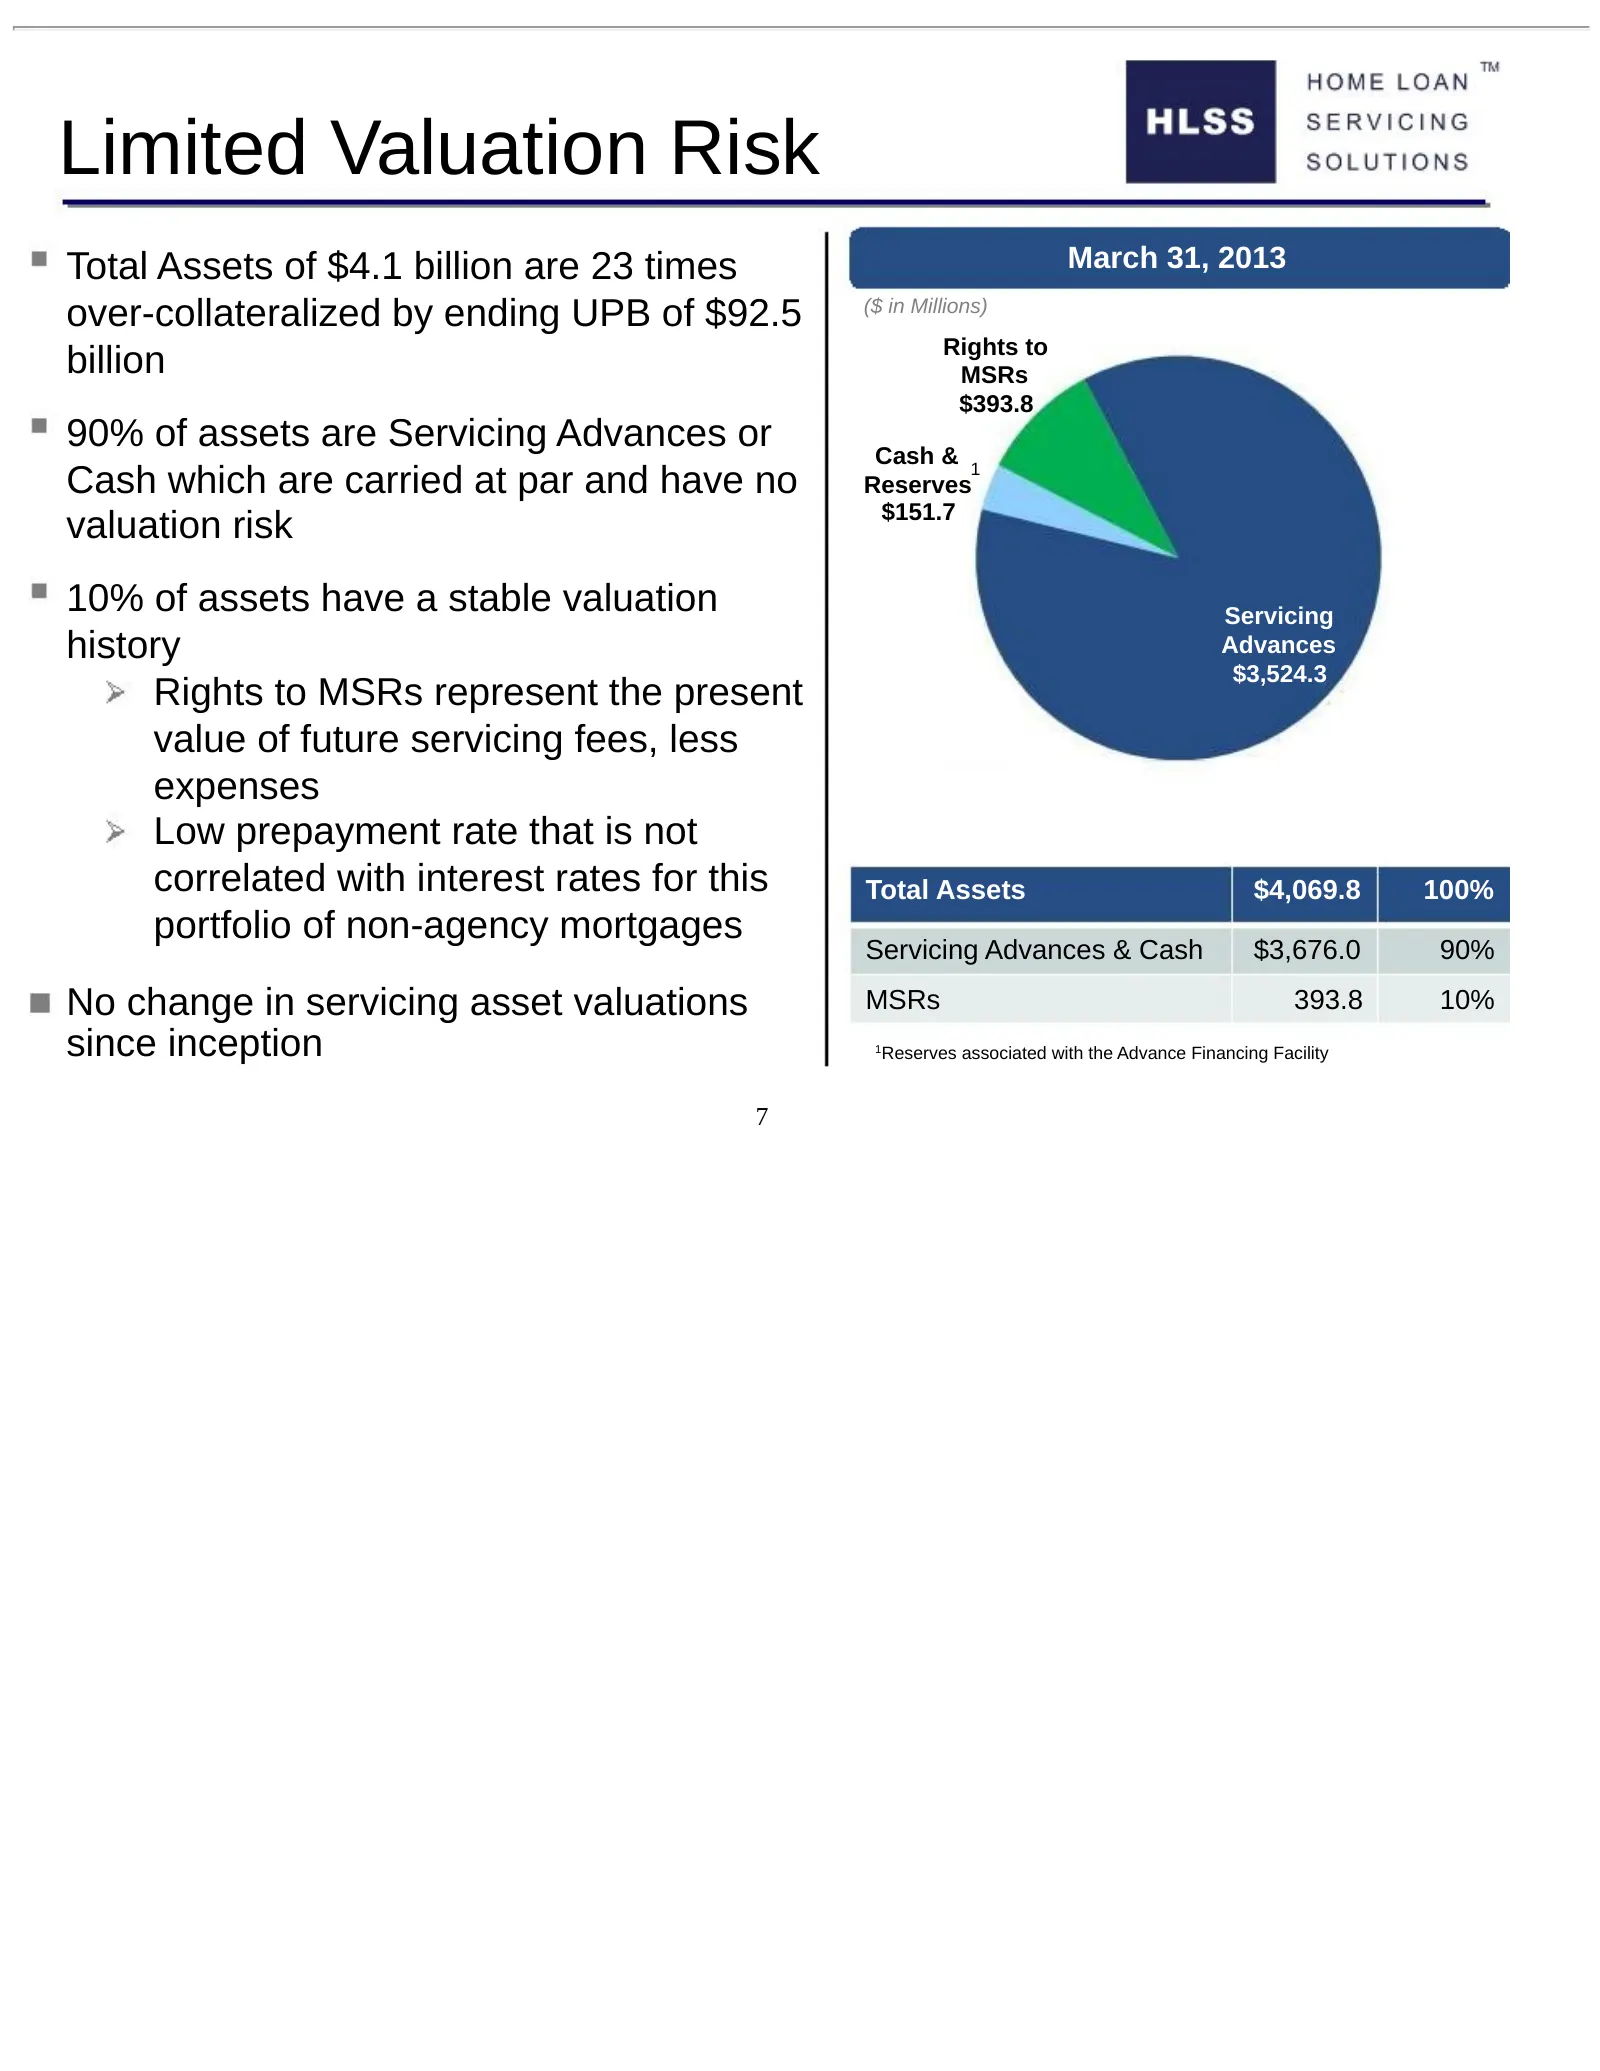
Limited Valuation Risk Total Assets of $4.1 billion are 23 times March 31, 2013 over-collateralized by ending UPB of $92.5 ($ in Millions) Rights to billion MSRs $393.8 90% of assets are Servicing Advances or Cash & 1 Cash which are carried at par and have no Reserves $151.7 valuation risk 10% of as
Slide 8: Stable Revenue and Expenses
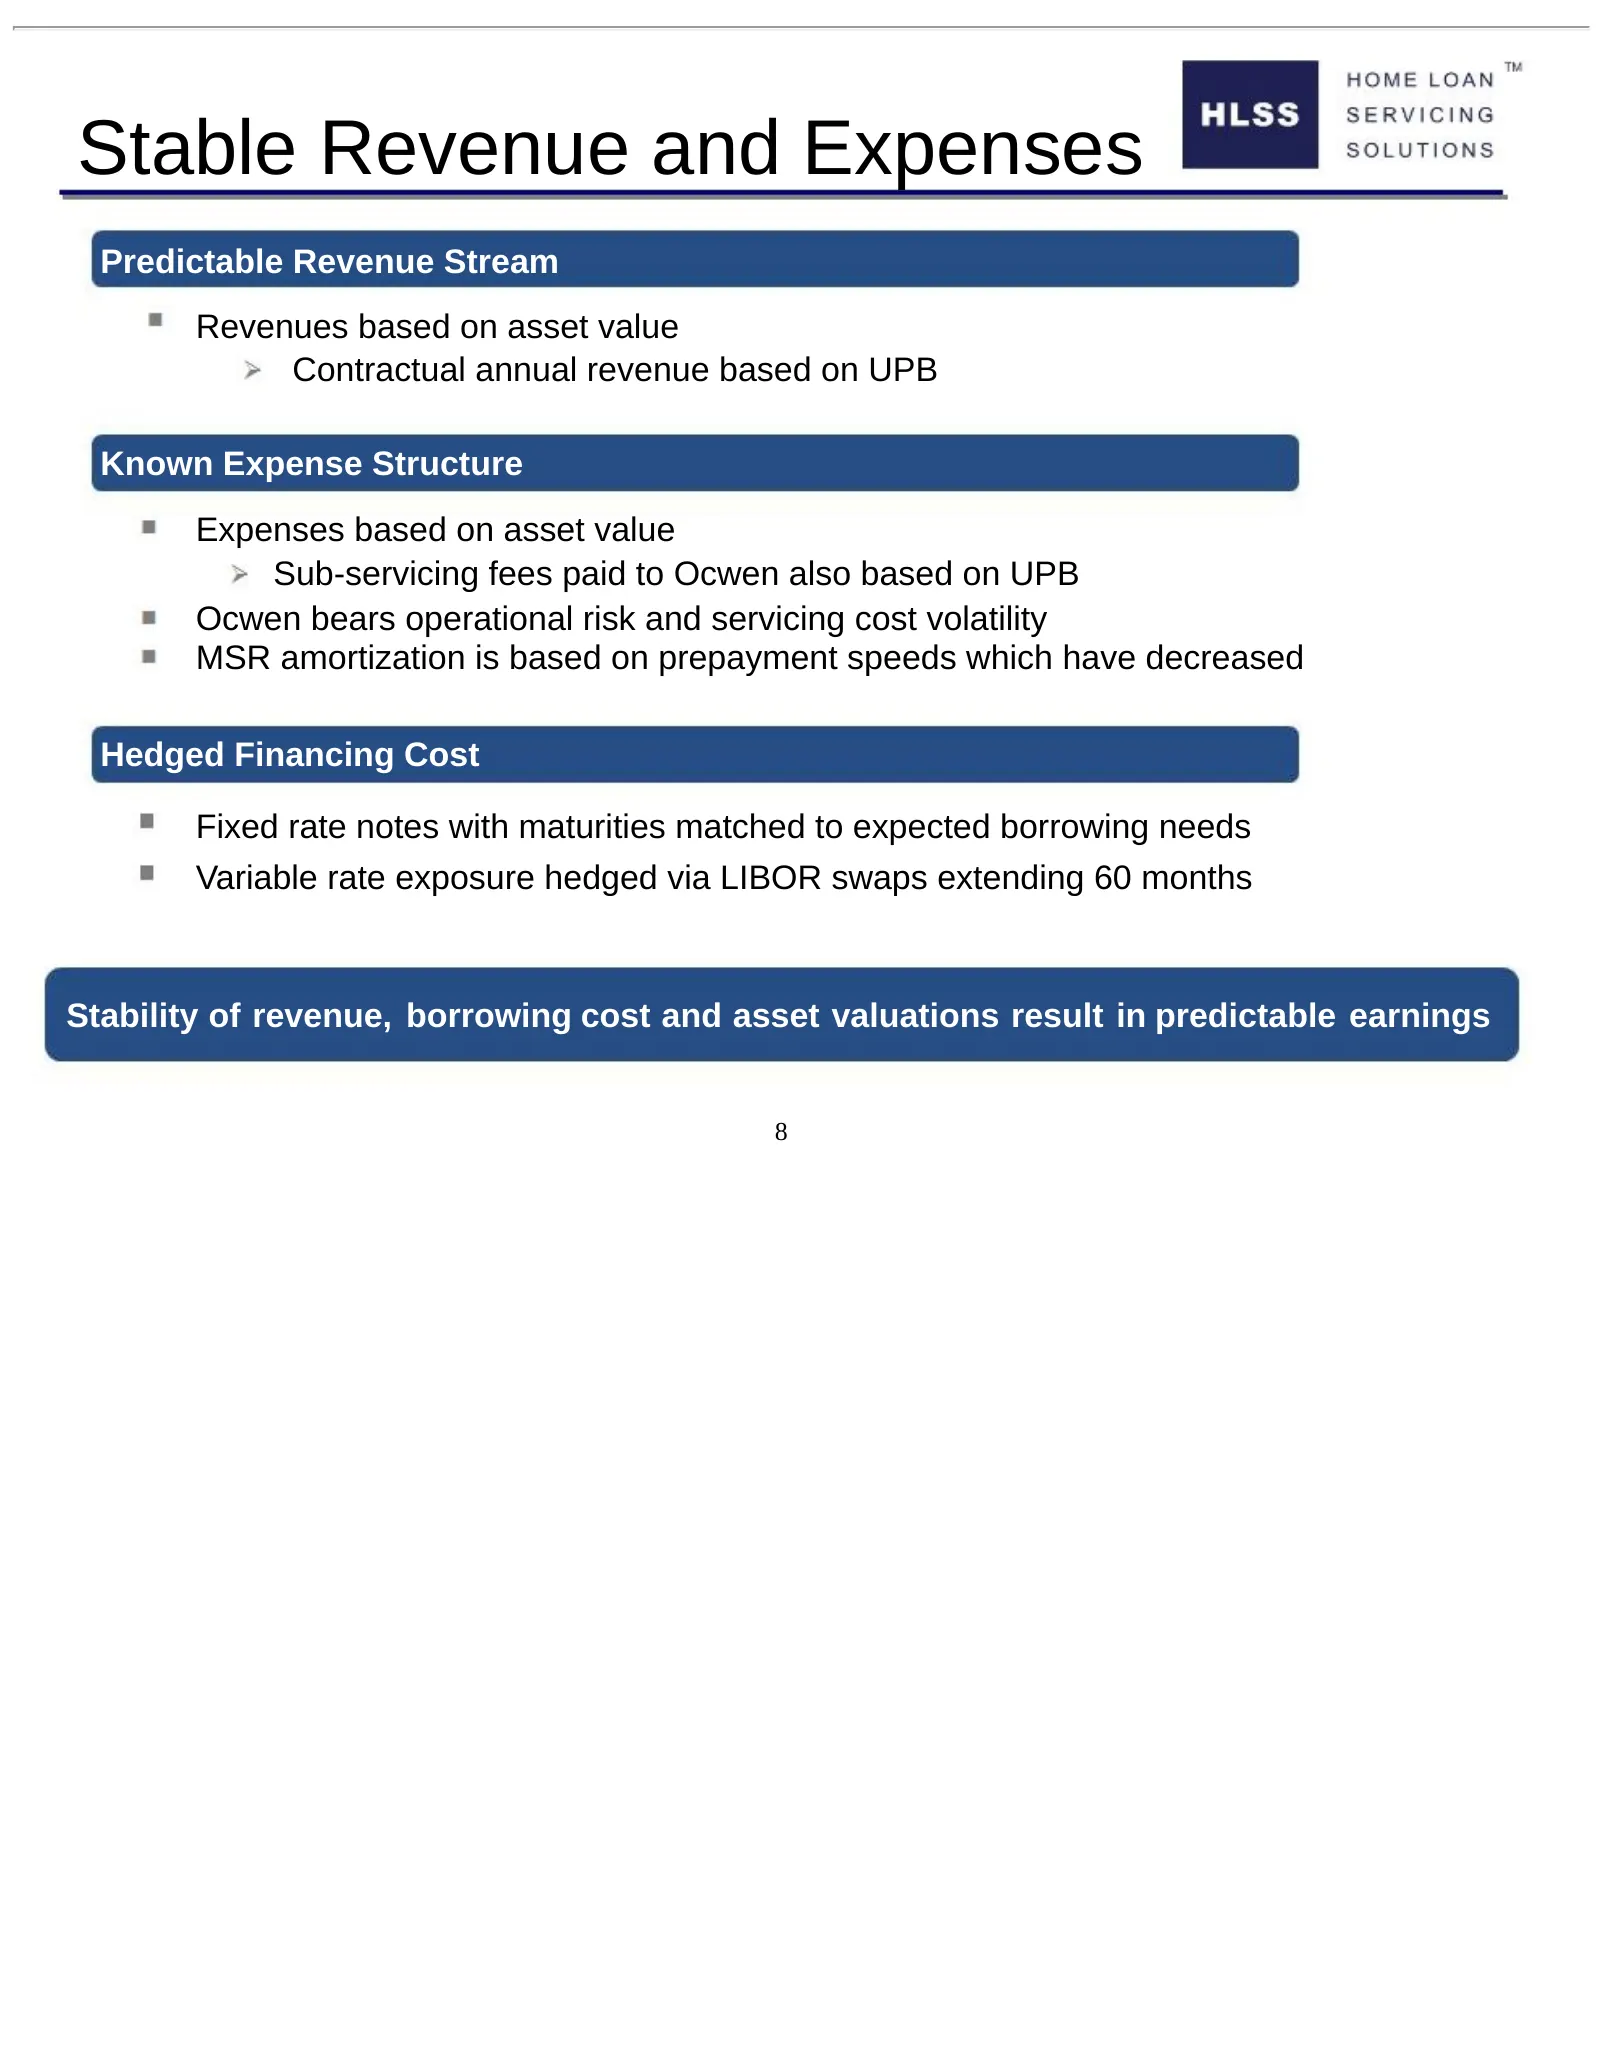
Stable Revenue and Expenses Predictable Revenue Stream Revenues based on asset value Contractual annual revenue based on UPB Known Expense Structure Expenses based on asset value Sub-servicing fees paid to Ocwen also based on UPB Ocwen bears operational risk and servicing cost volatility MSR amortiz
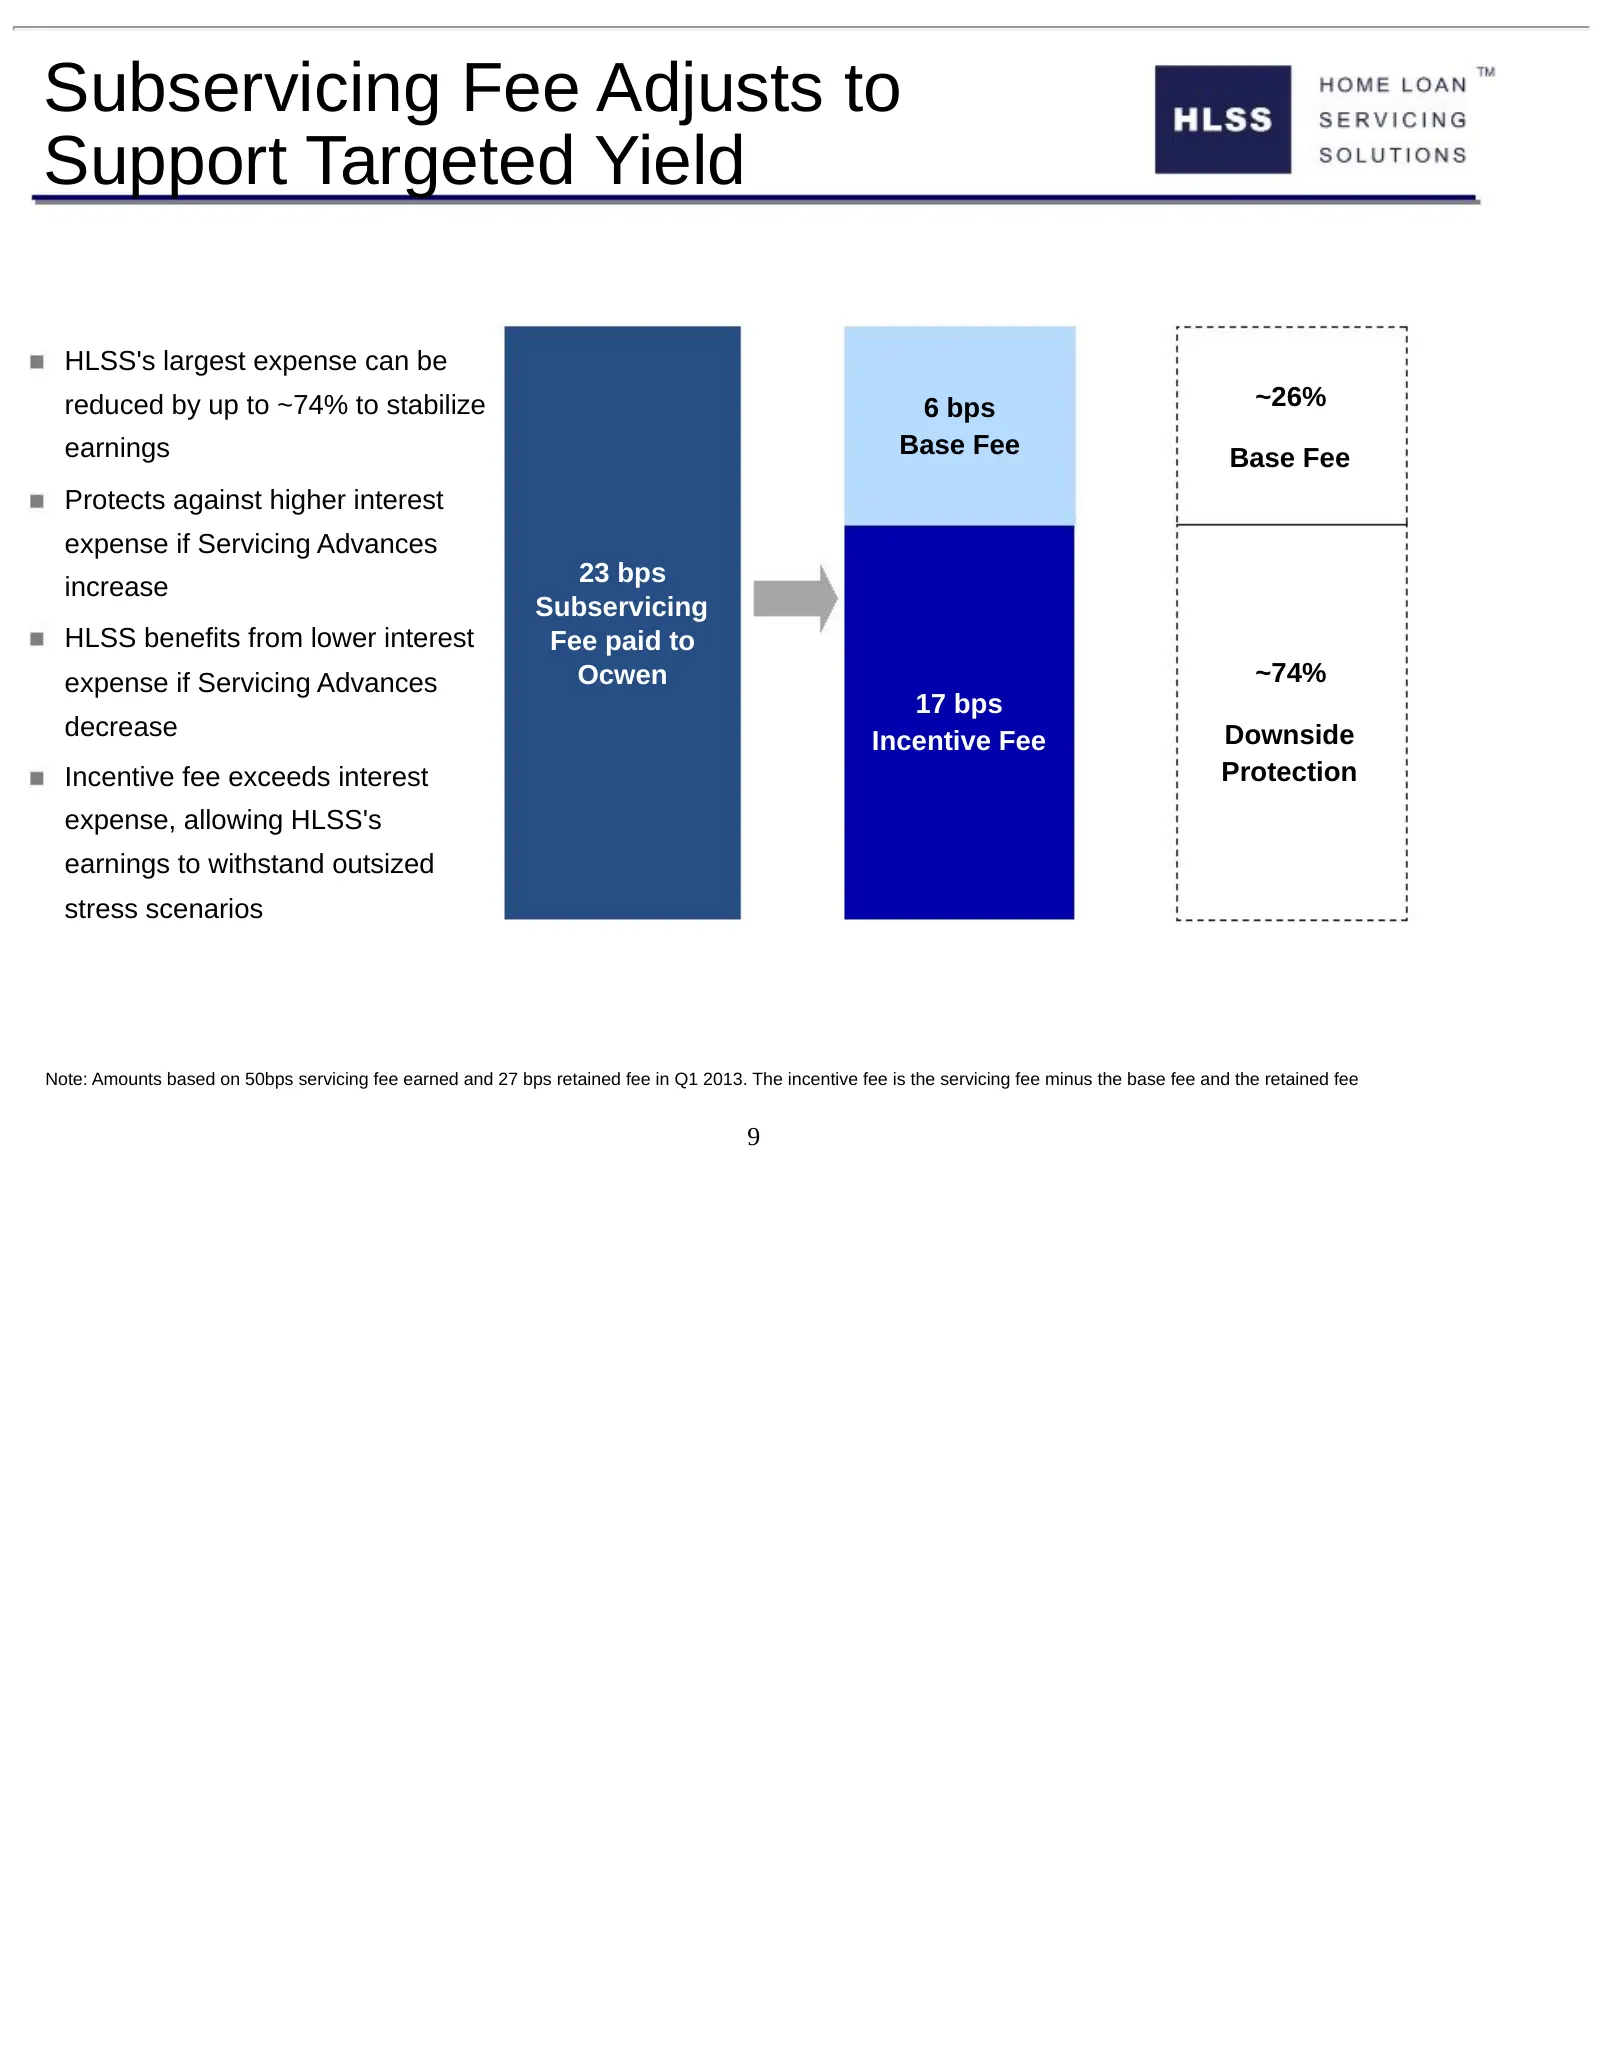
Slide 9: Subservicing Fee Adjusts to Support Targeted Yield
Subservicing Fee Adjusts to Support Targeted Yield HLSS's largest expense can be reduced by up to ~74% to stabilize 6 bps ~26% earnings Base Fee Base Fee Protects against higher interest expense if Servicing Advances 23 bps increase Subservicing HLSS benefits from lower interest Fee paid to expense
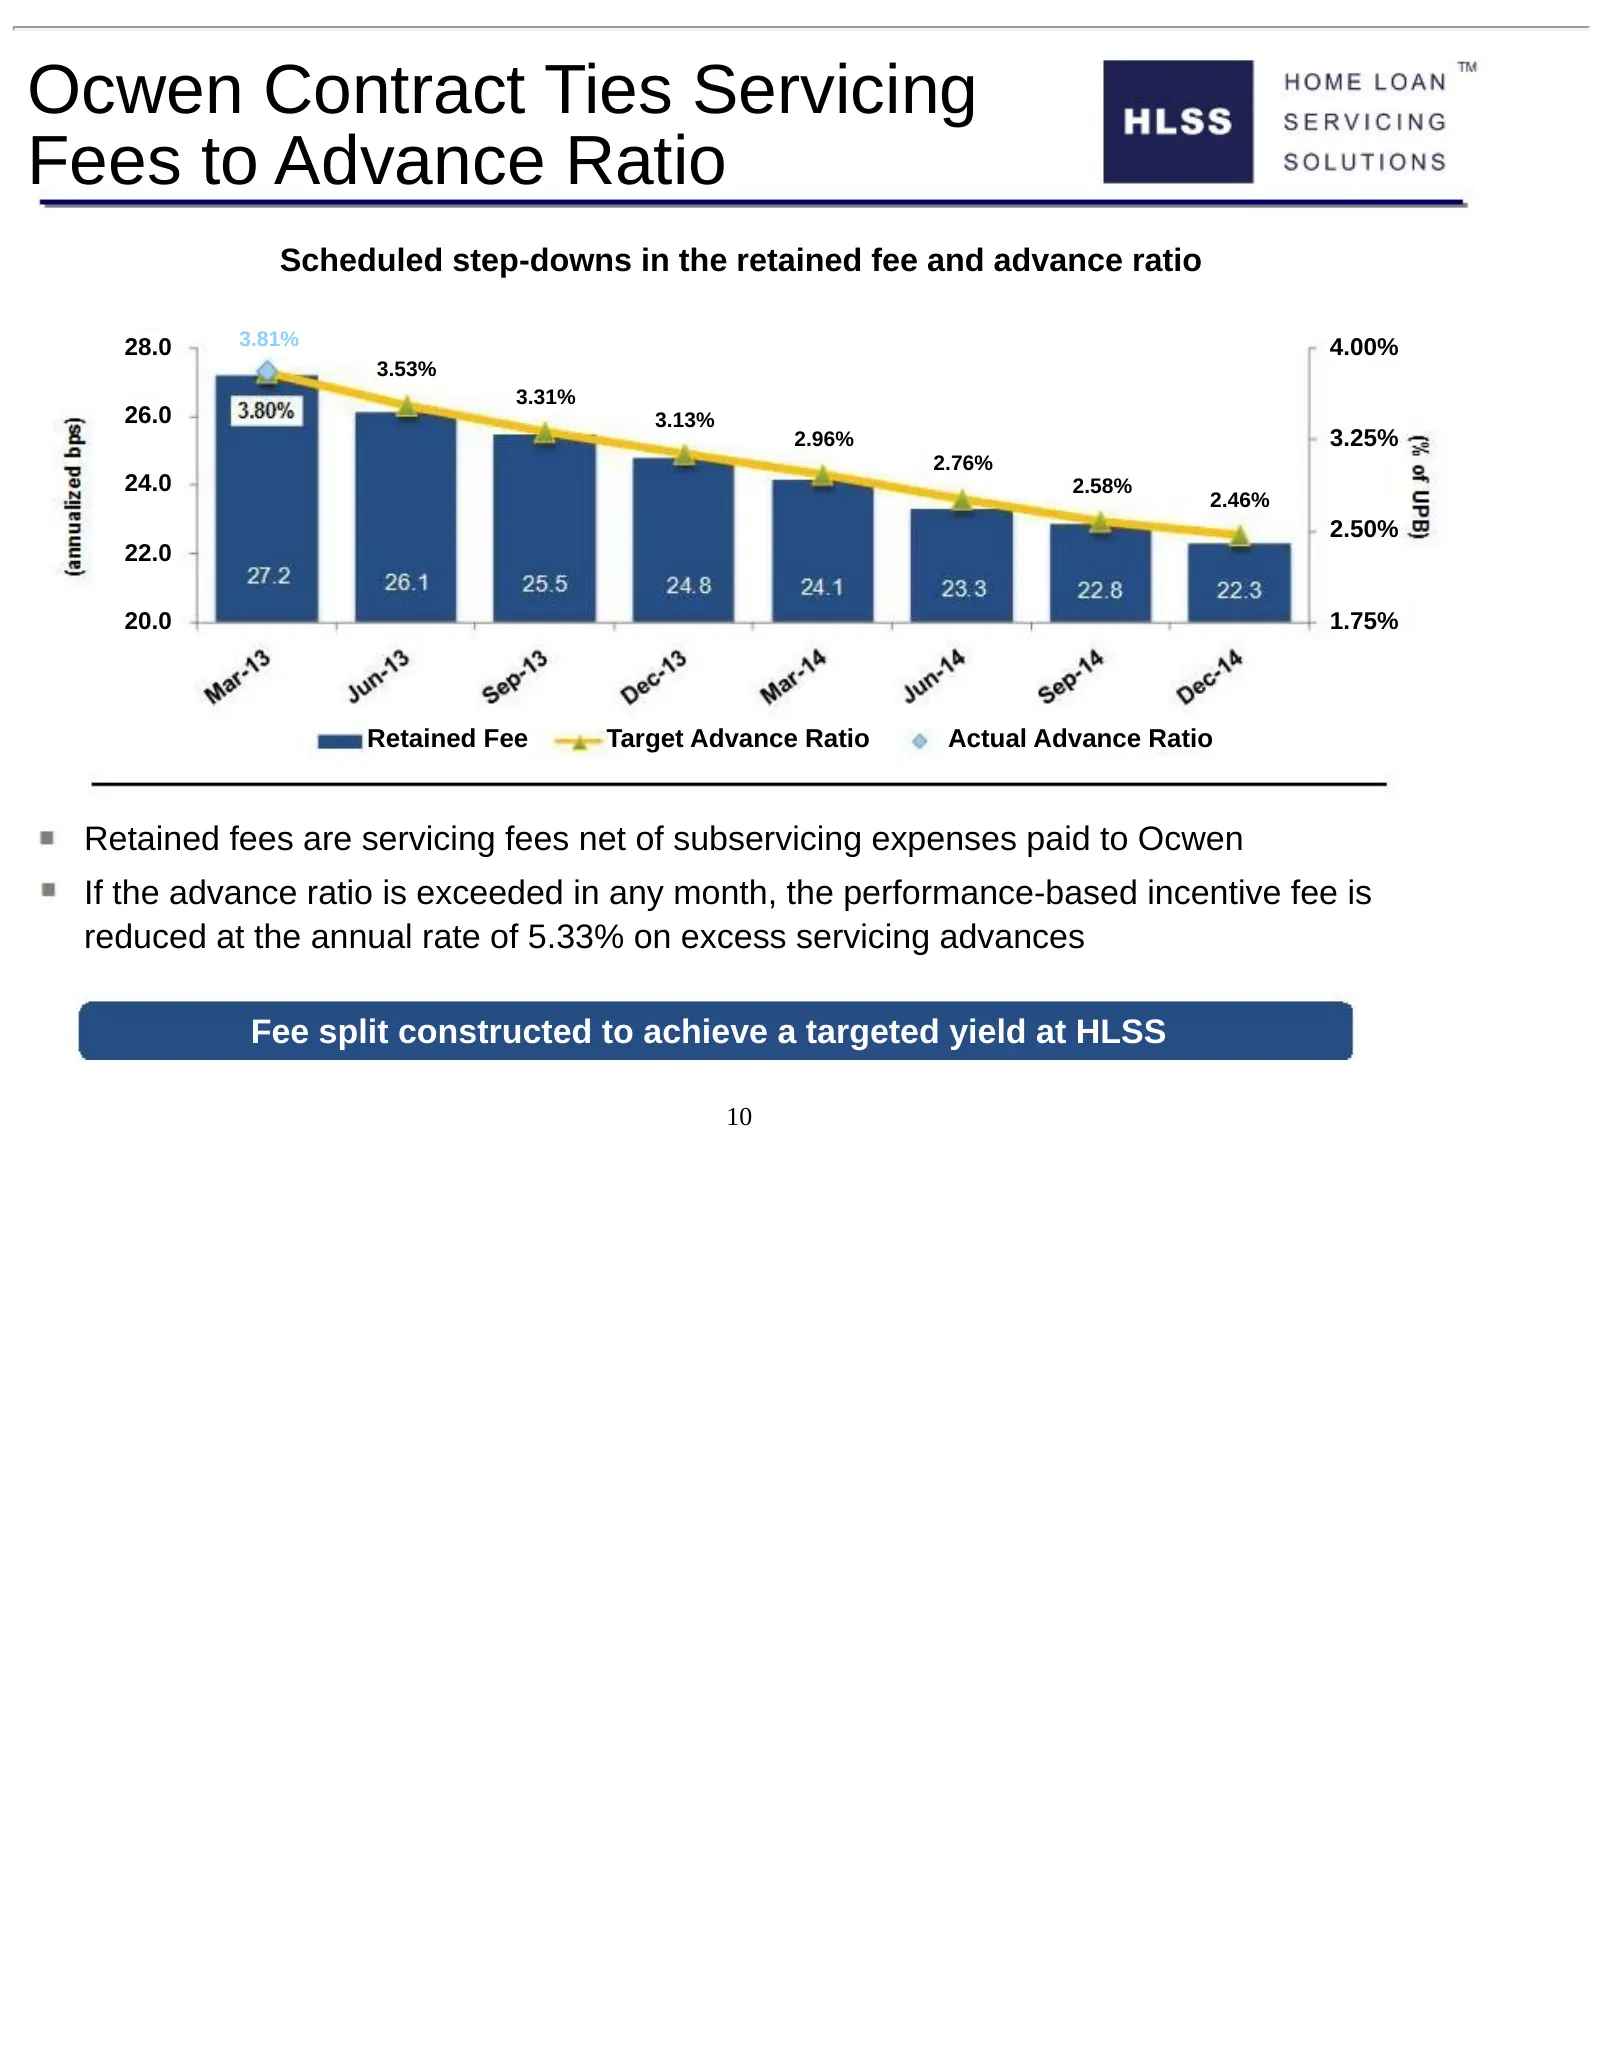
Slide 10: Ocwen Contract Ties Servicing Fees to Advance Ratio
Ocwen Contract Ties Servicing Fees to Advance Ratio Scheduled step-downs in the retained fee and advance ratio 28.0 3.81% 4.00% 3.53% 3.31% 26.0 3.13% 2.96% 3.25% 2.76% 24.0 2.58% 2.46% 2.50% 22.0 20.0 1.75% Retained Fee Target Advance Ratio Actual Advance Ratio Retained fees are servicing fees net
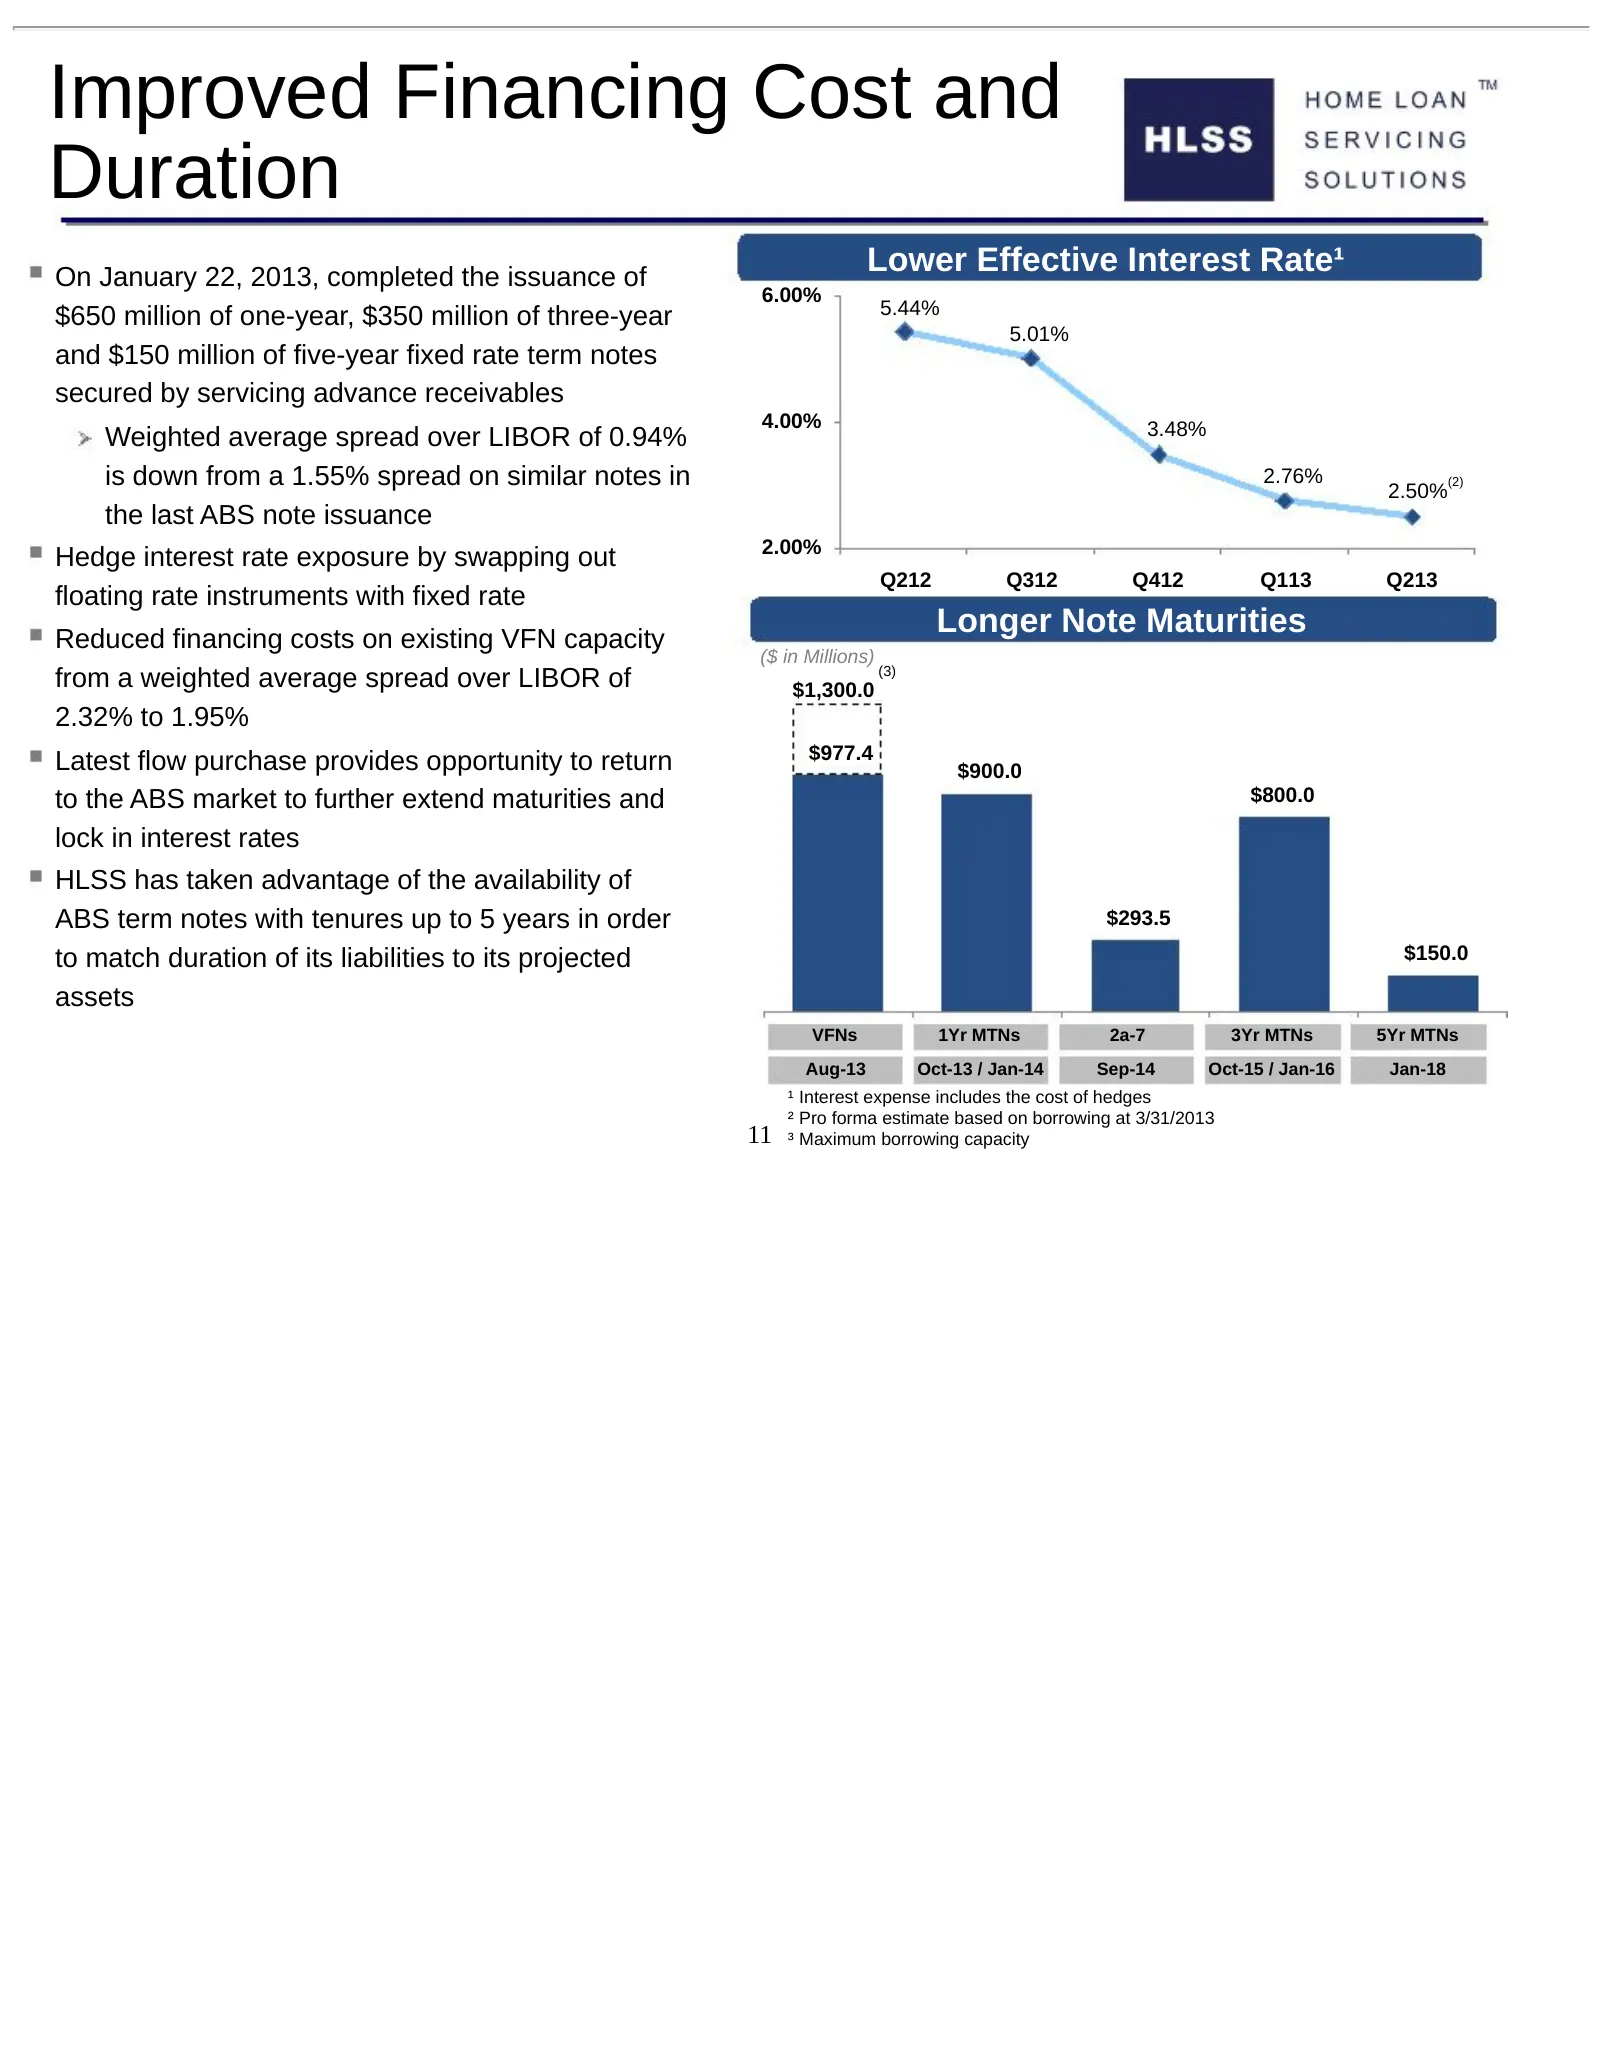
Slide 11: Improved Financing Cost and Duration
Improved Financing Cost and Duration On January 22, 2013, completed the issuance of Lower Effective Interest Rate¹ 6.00% $650 million of one-year, $350 million of three-year 5.44% 5.01% and $150 million of five-year fixed rate term notes secured by servicing advance receivables 4.00% 3.48% Weighted
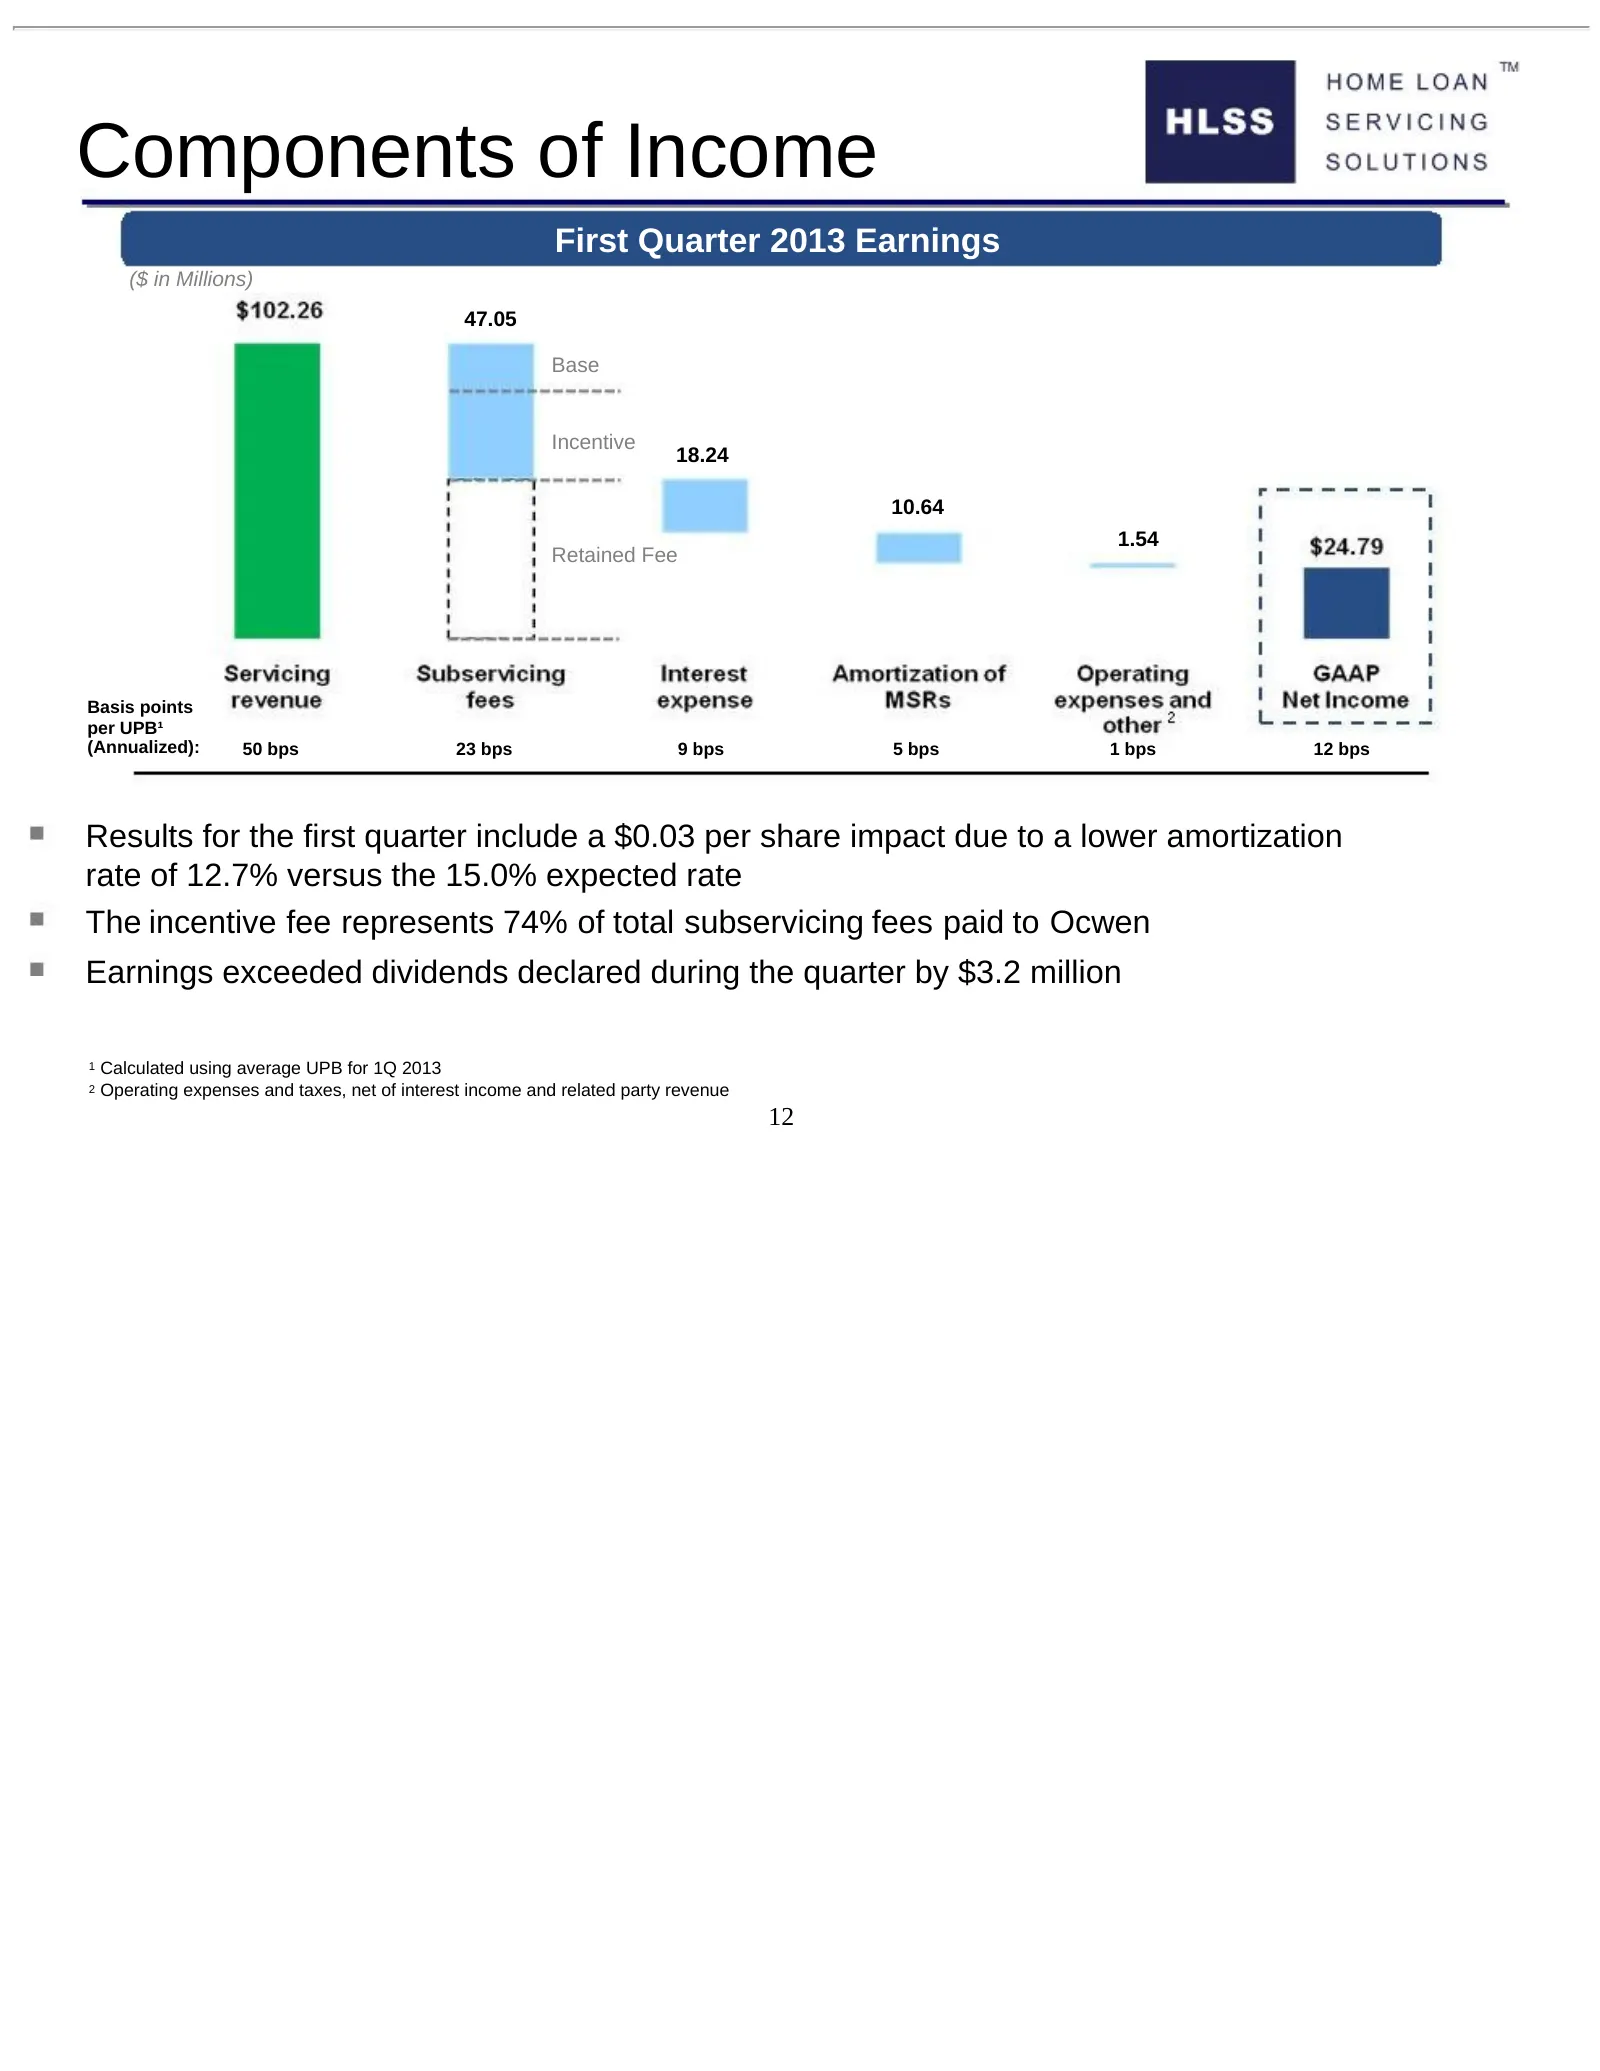
Slide 12: Components of Income
Components of Income First Quarter 2013 Earnings ($ in Millions) 47.05 Base Incentive 18.24 10.64 1.54 Retained Fee Basis points per UPB¹ (Annualized): 50 bps 23 bps 9 bps 5 bps 1 bps 12 bps Results for the first quarter include a $0.03 per share impact due to a lower amortization rate of 12.7% vers
Slide 13: Components of Cash Flow
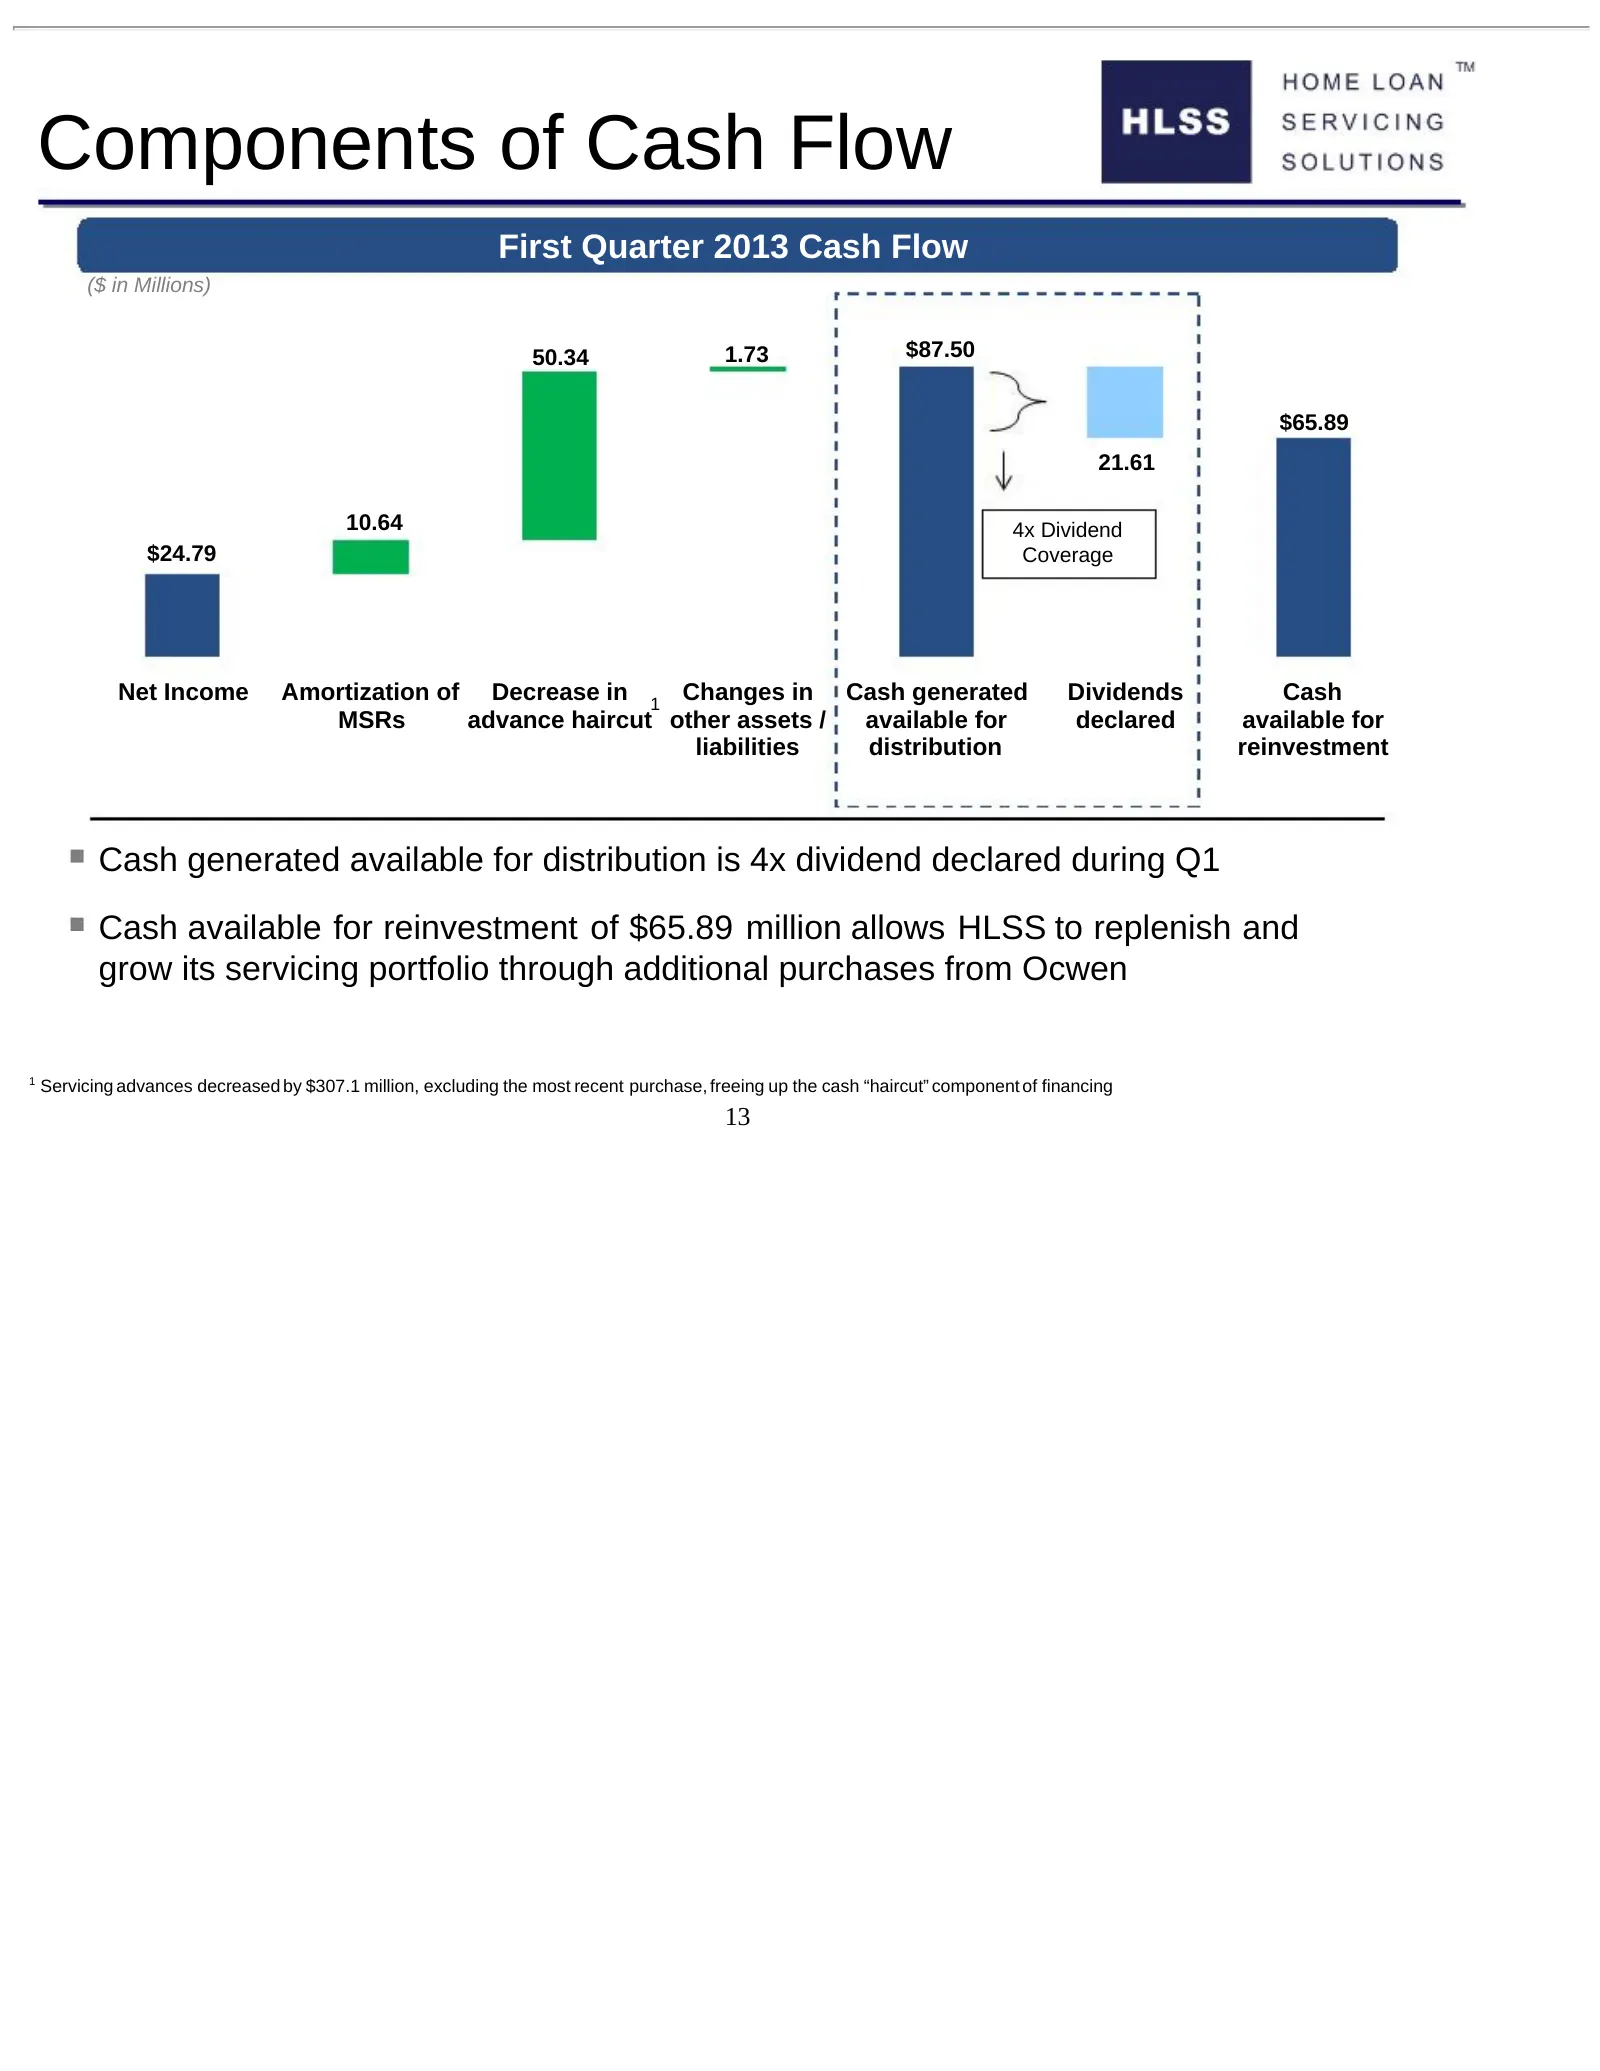
Components of Cash Flow First Quarter 2013 Cash Flow ($ in Millions) 50.34 1.73 $87.50 $65.89 21.61 10.64 4x Dividend $24.79 Coverage Net Income Amortization of Decrease in 1 Changes in Cash generated Dividends Cash MSRs advance haircut other assets / available for declared available for liabilities
Slide 14: HLSS Expects to Maintain Yield Under Economic Shocks
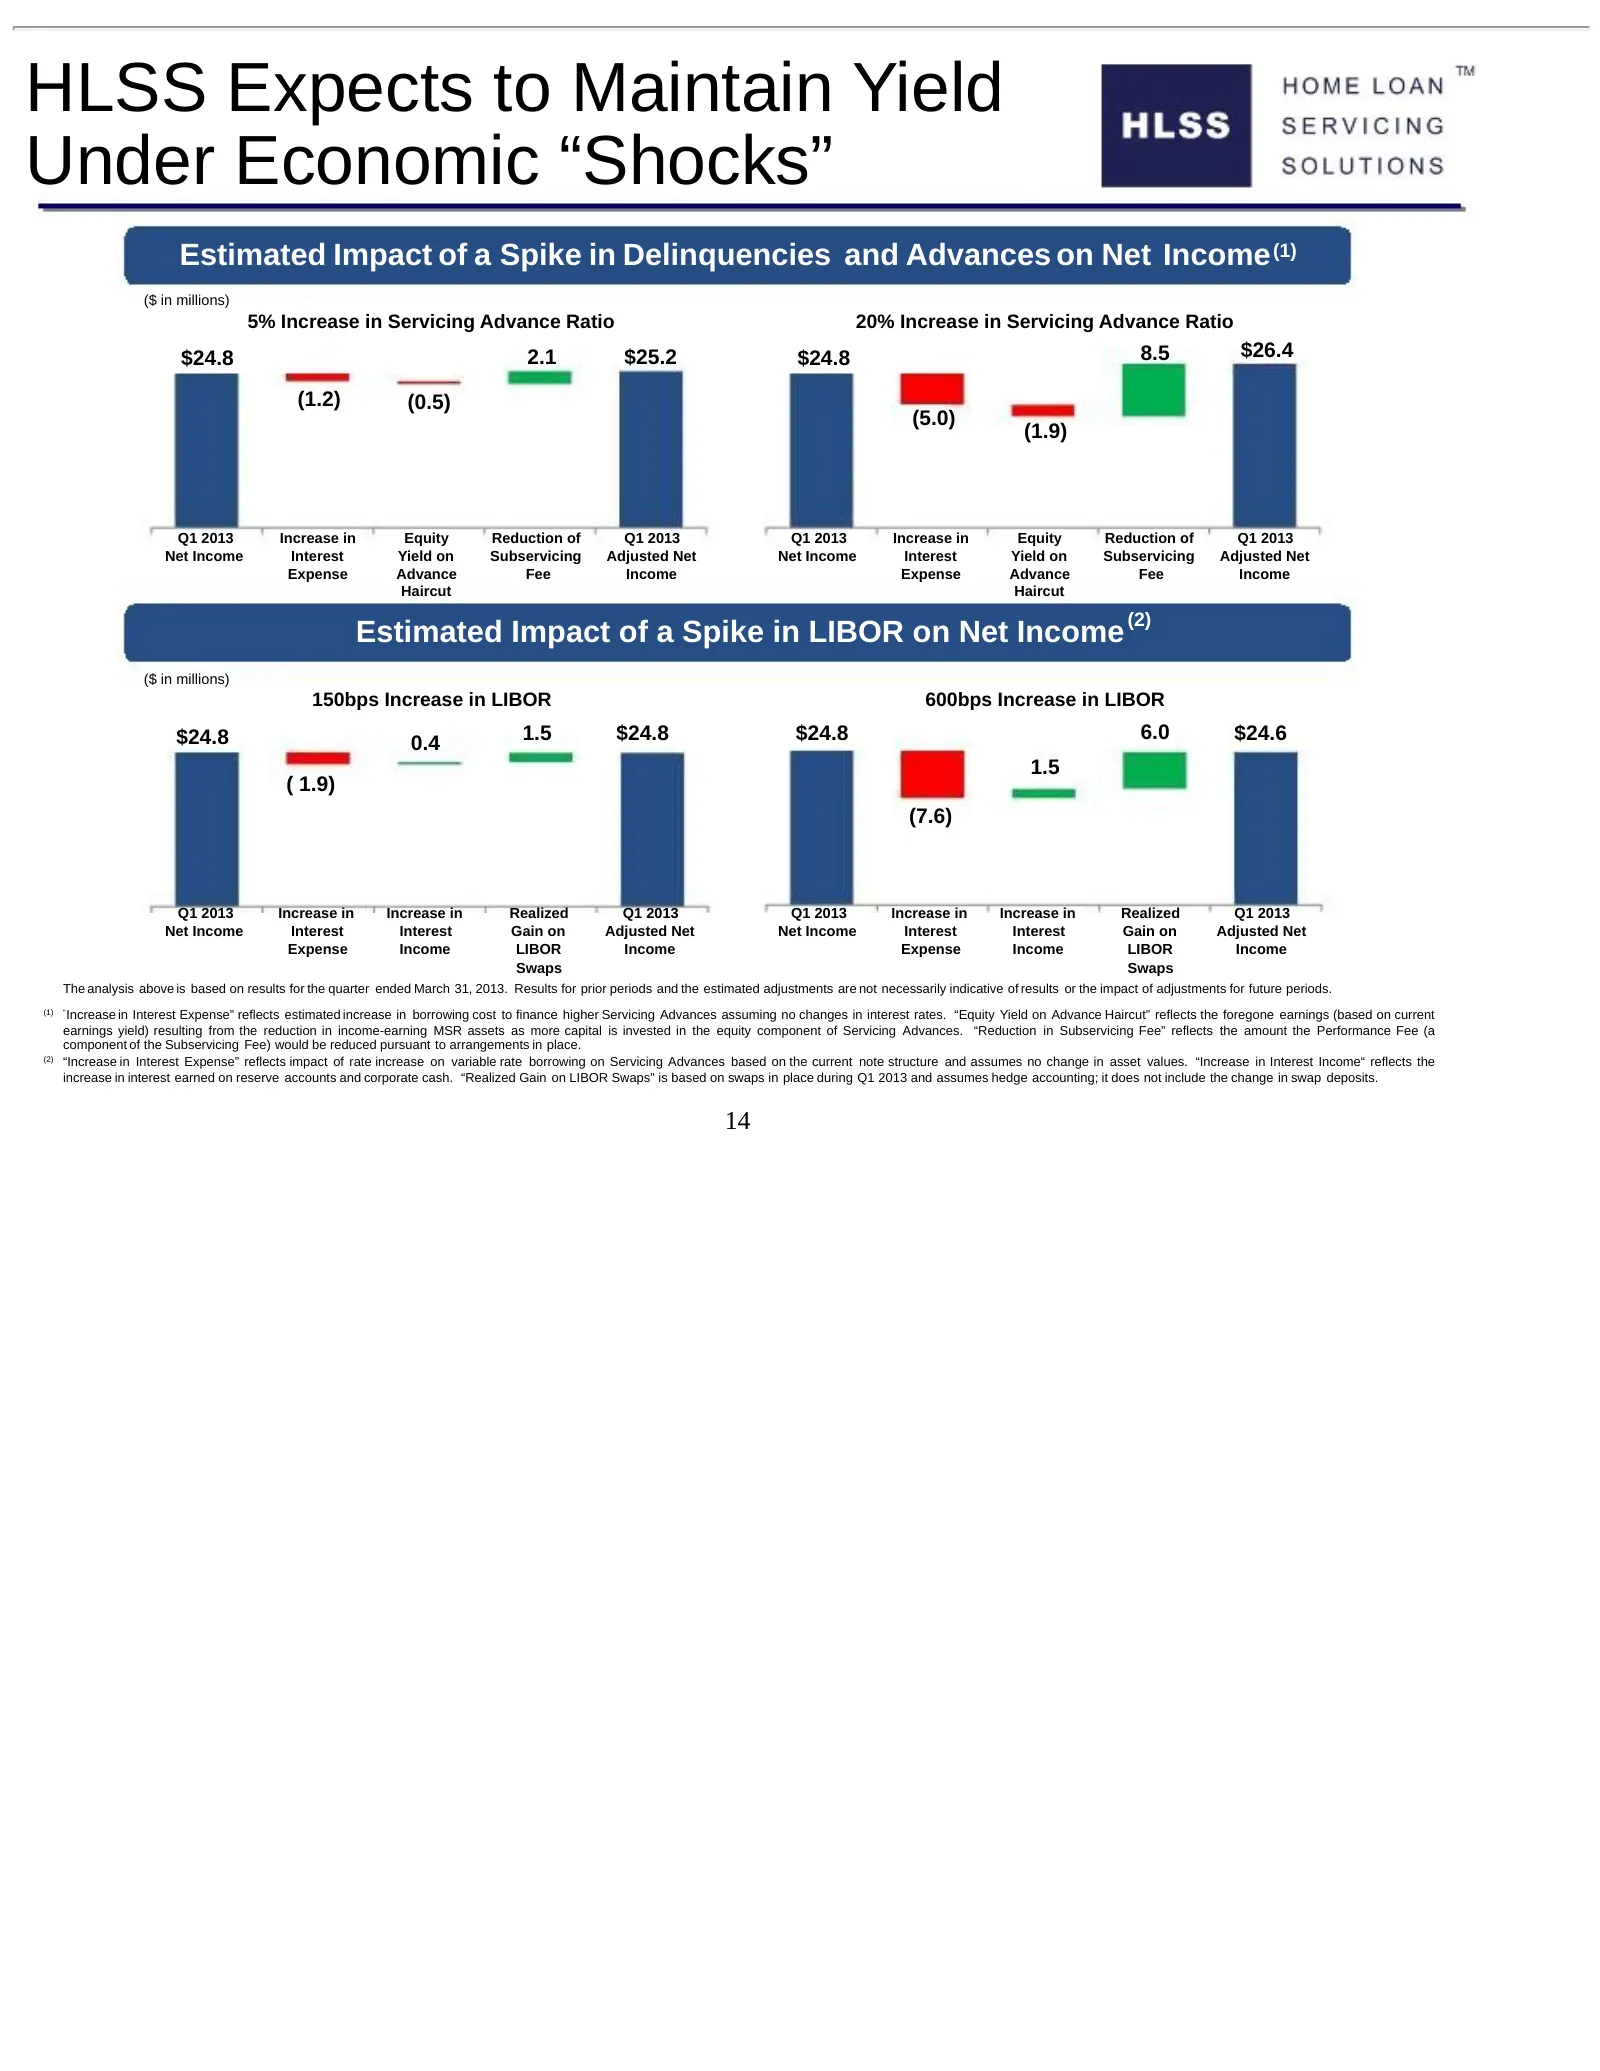
HLSS Expects to Maintain Yield Under Economic “Shocks” Estimated Impact of a Spike in Delinquencies and Advances on Net Income (1) ($ in millions) 5% Increase in Servicing Advance Ratio 20% Increase in Servicing Advance Ratio $24.8 2.1 $25.2 $24.8 8.5 $26.4 (1.2) (0.5) (5.0) (1.9) Q1 2013 Increase i
Slide 15: Equity and Debt Yields
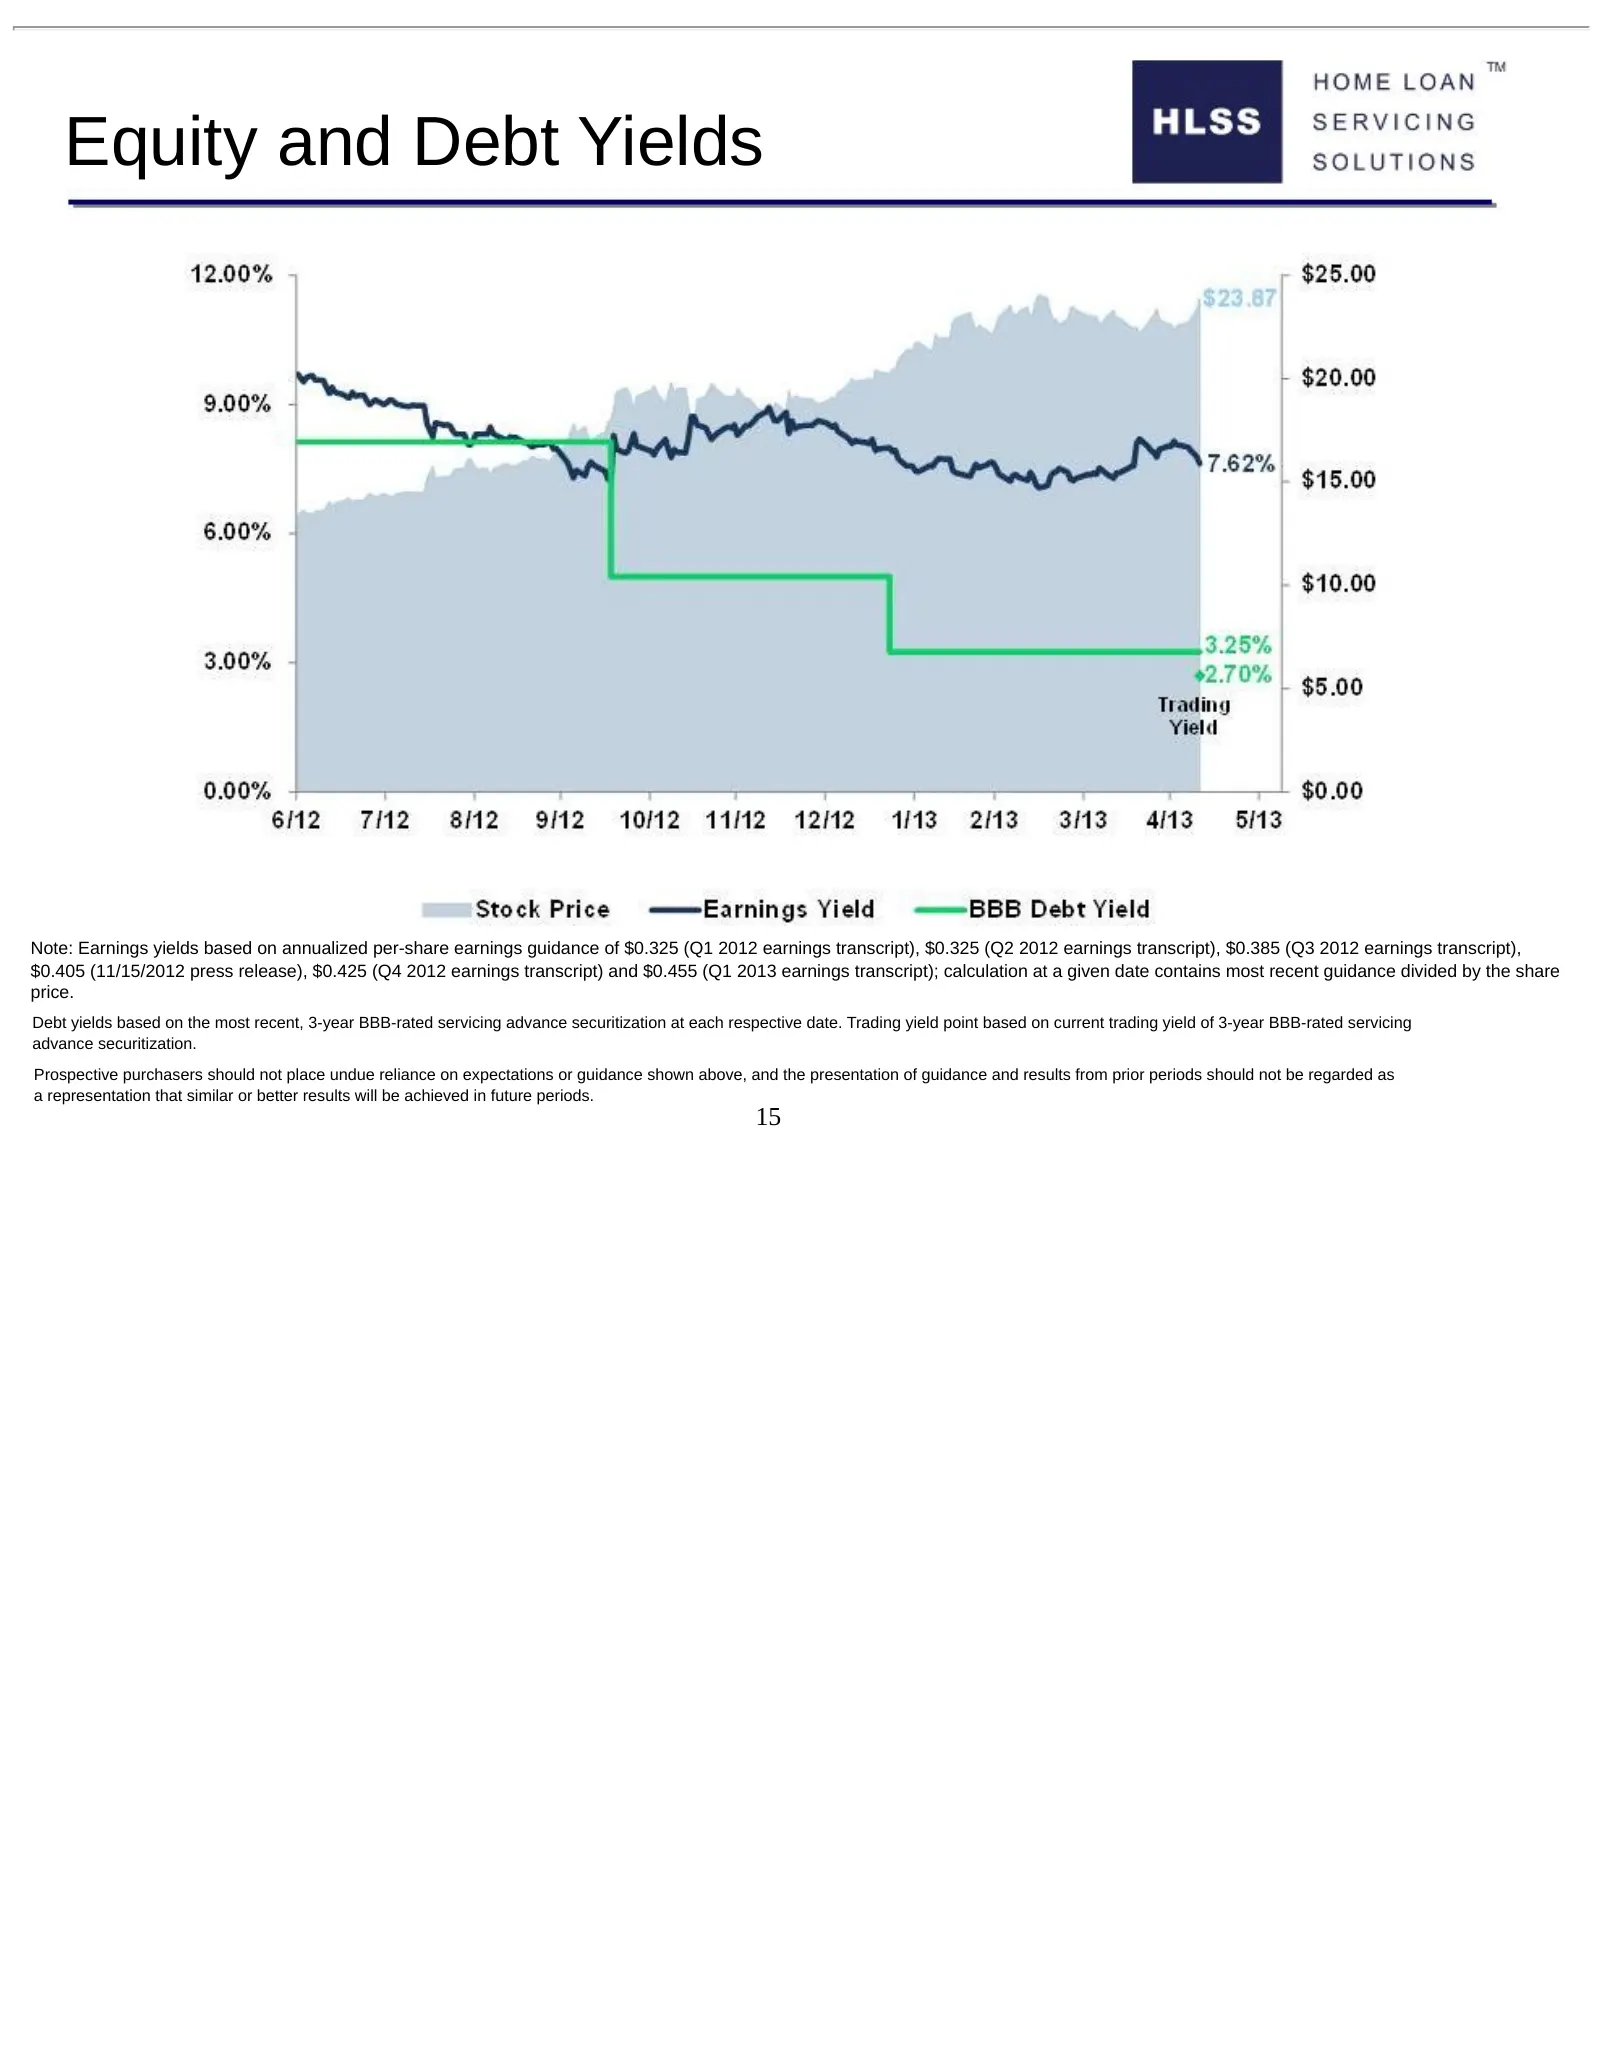
Equity and Debt Yields Note: Earnings yields based on annualized per-share earnings guidance of $0.325 (Q1 2012 earnings transcript), $0.325 (Q2 2012 earnings transcript), $0.385 (Q3 2012 earnings transcript), $0.405 (11/15/2012 press release), $0.425 (Q4 2012 earnings transcript) and $0.455 (Q1 201
Slide 16: Investment Highlights
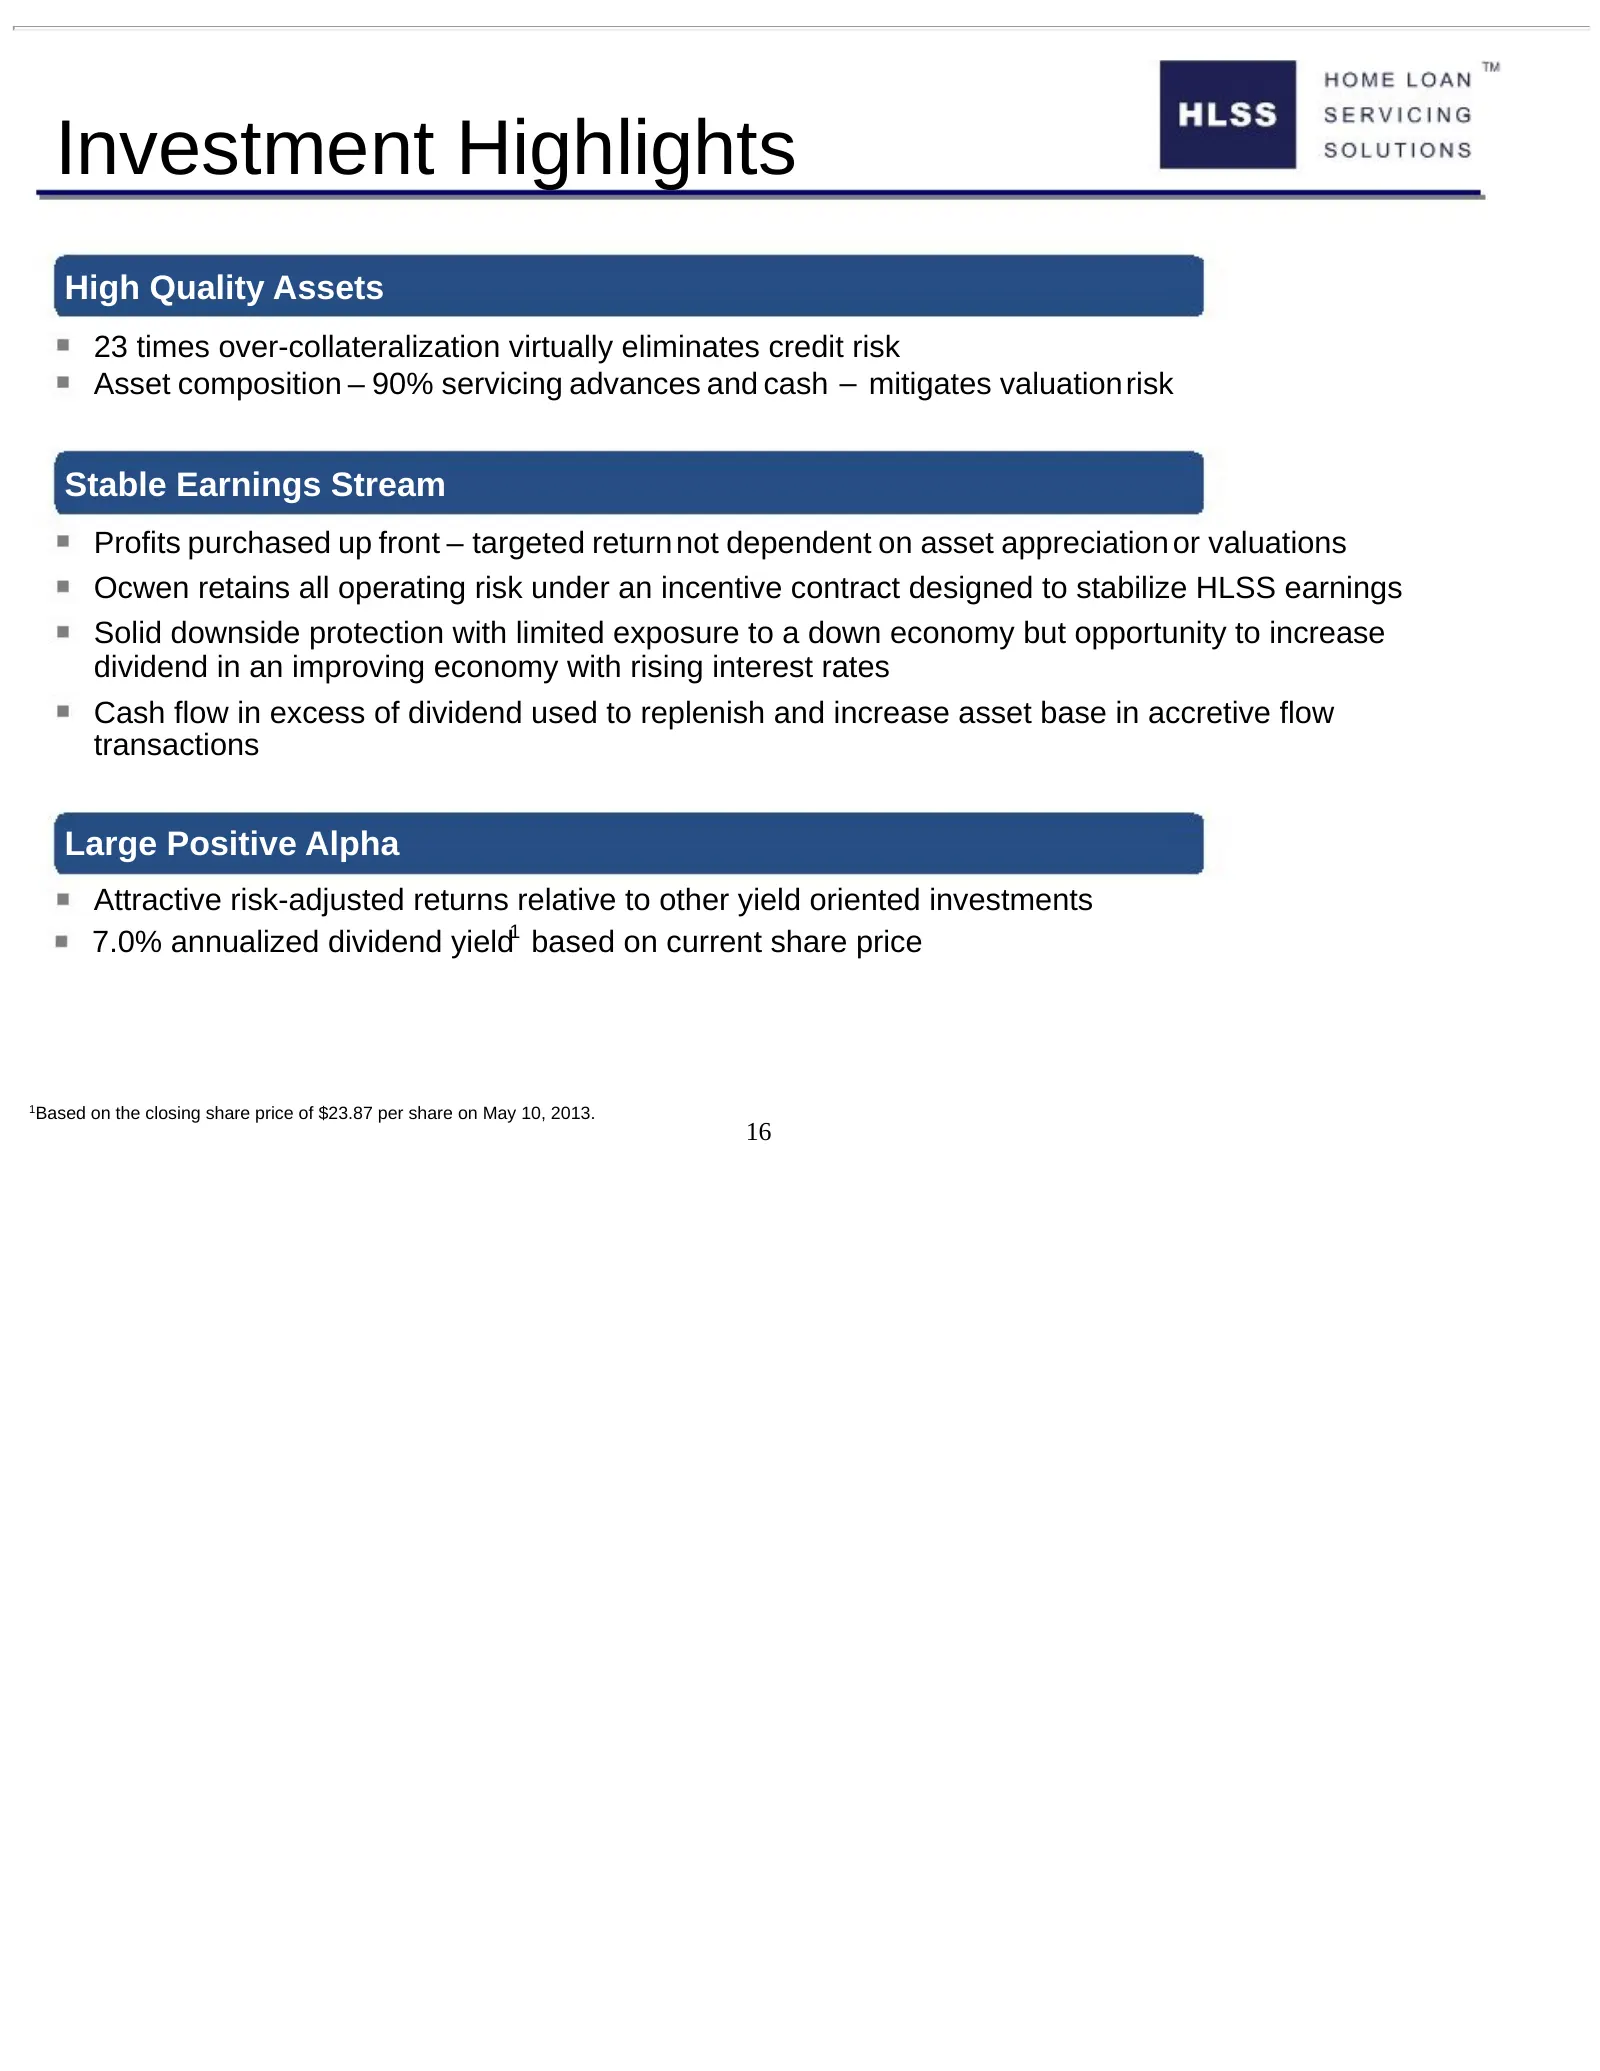
Investment Highlights High Quality Assets 23 times over-collateralization virtually eliminates credit risk Asset composition – 90% servicing advances and cash – mitigates valuation risk Stable Earnings Stream Profits purchased up front – targeted return not dependent on asset appreciation or valuati
Source: SEC EDGAR · 8-K filed May 13, 2013
More decks from Home Loan Servicing Solutions Ltd
 Merger or Acquisition (February 2015)6 slides · Feb 23, 2015
 Q3 2014 Earnings Presentation15 slides · Oct 21, 2014
 Debt Investor Presentation (September 2014)40 slides · Sep 22, 2014
 Investor Presentation (September 2014)14 slides · Sep 8, 2014
 Investor Presentation (May 2014)17 slides · May 20, 2014
 Debt Investor Presentation (January 2014)45 slides · Jan 23, 2014