E*TRADE Financial — KBW Securities Brokerage & Market Structure Conference (November 2012)
24 slides from E*TRADE Financial's conference presentation, Nov 28, 2012
Slide 1: E*TRADE Financial Corporation
Exhibit 99.1 E*TRADE Financial Corporation KBW Securities Brokerage & Market Structure Conference Matthew Audette, Chief Financial Officer November 28, 2012 © 2012 E*TRADE Financial Corporation all rights reserved.
Slide 2: Notice to investors
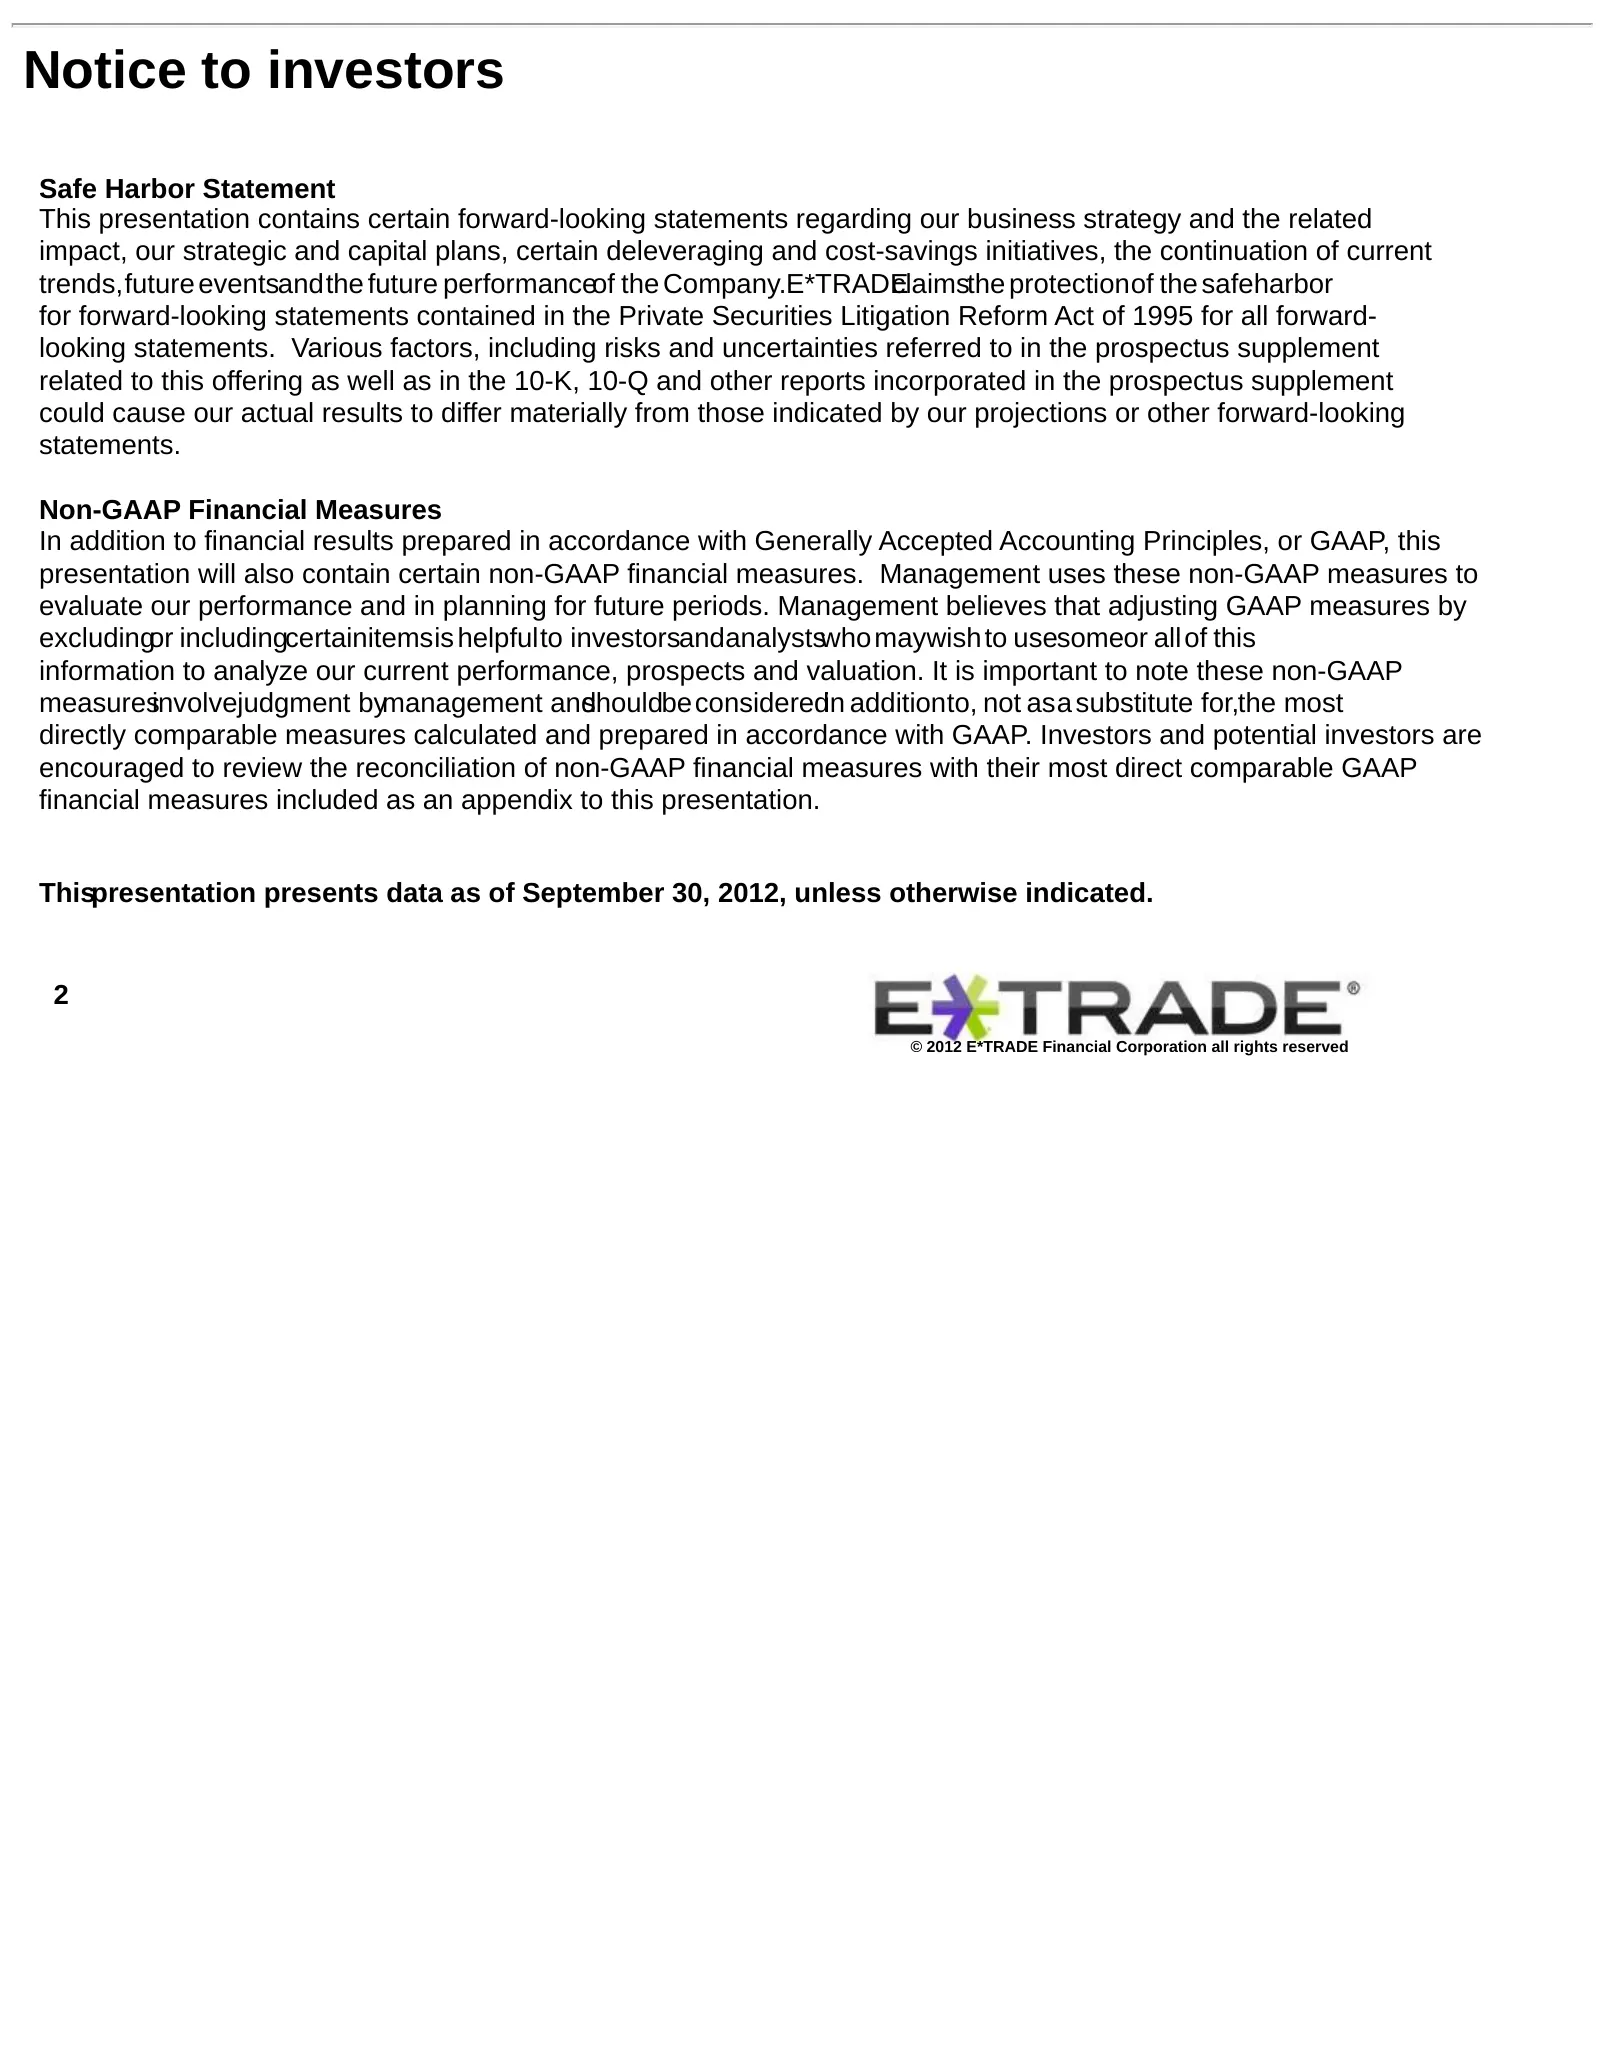
Notice to investors Safe Harbor Statement This presentation contains certain forward-looking statements regarding our business strategy and the related impact, our strategic and capital plans, certain deleveraging and cost-savings initiatives, the continuation of current trends,future eventsandthe f
Slide 3: Business strategy
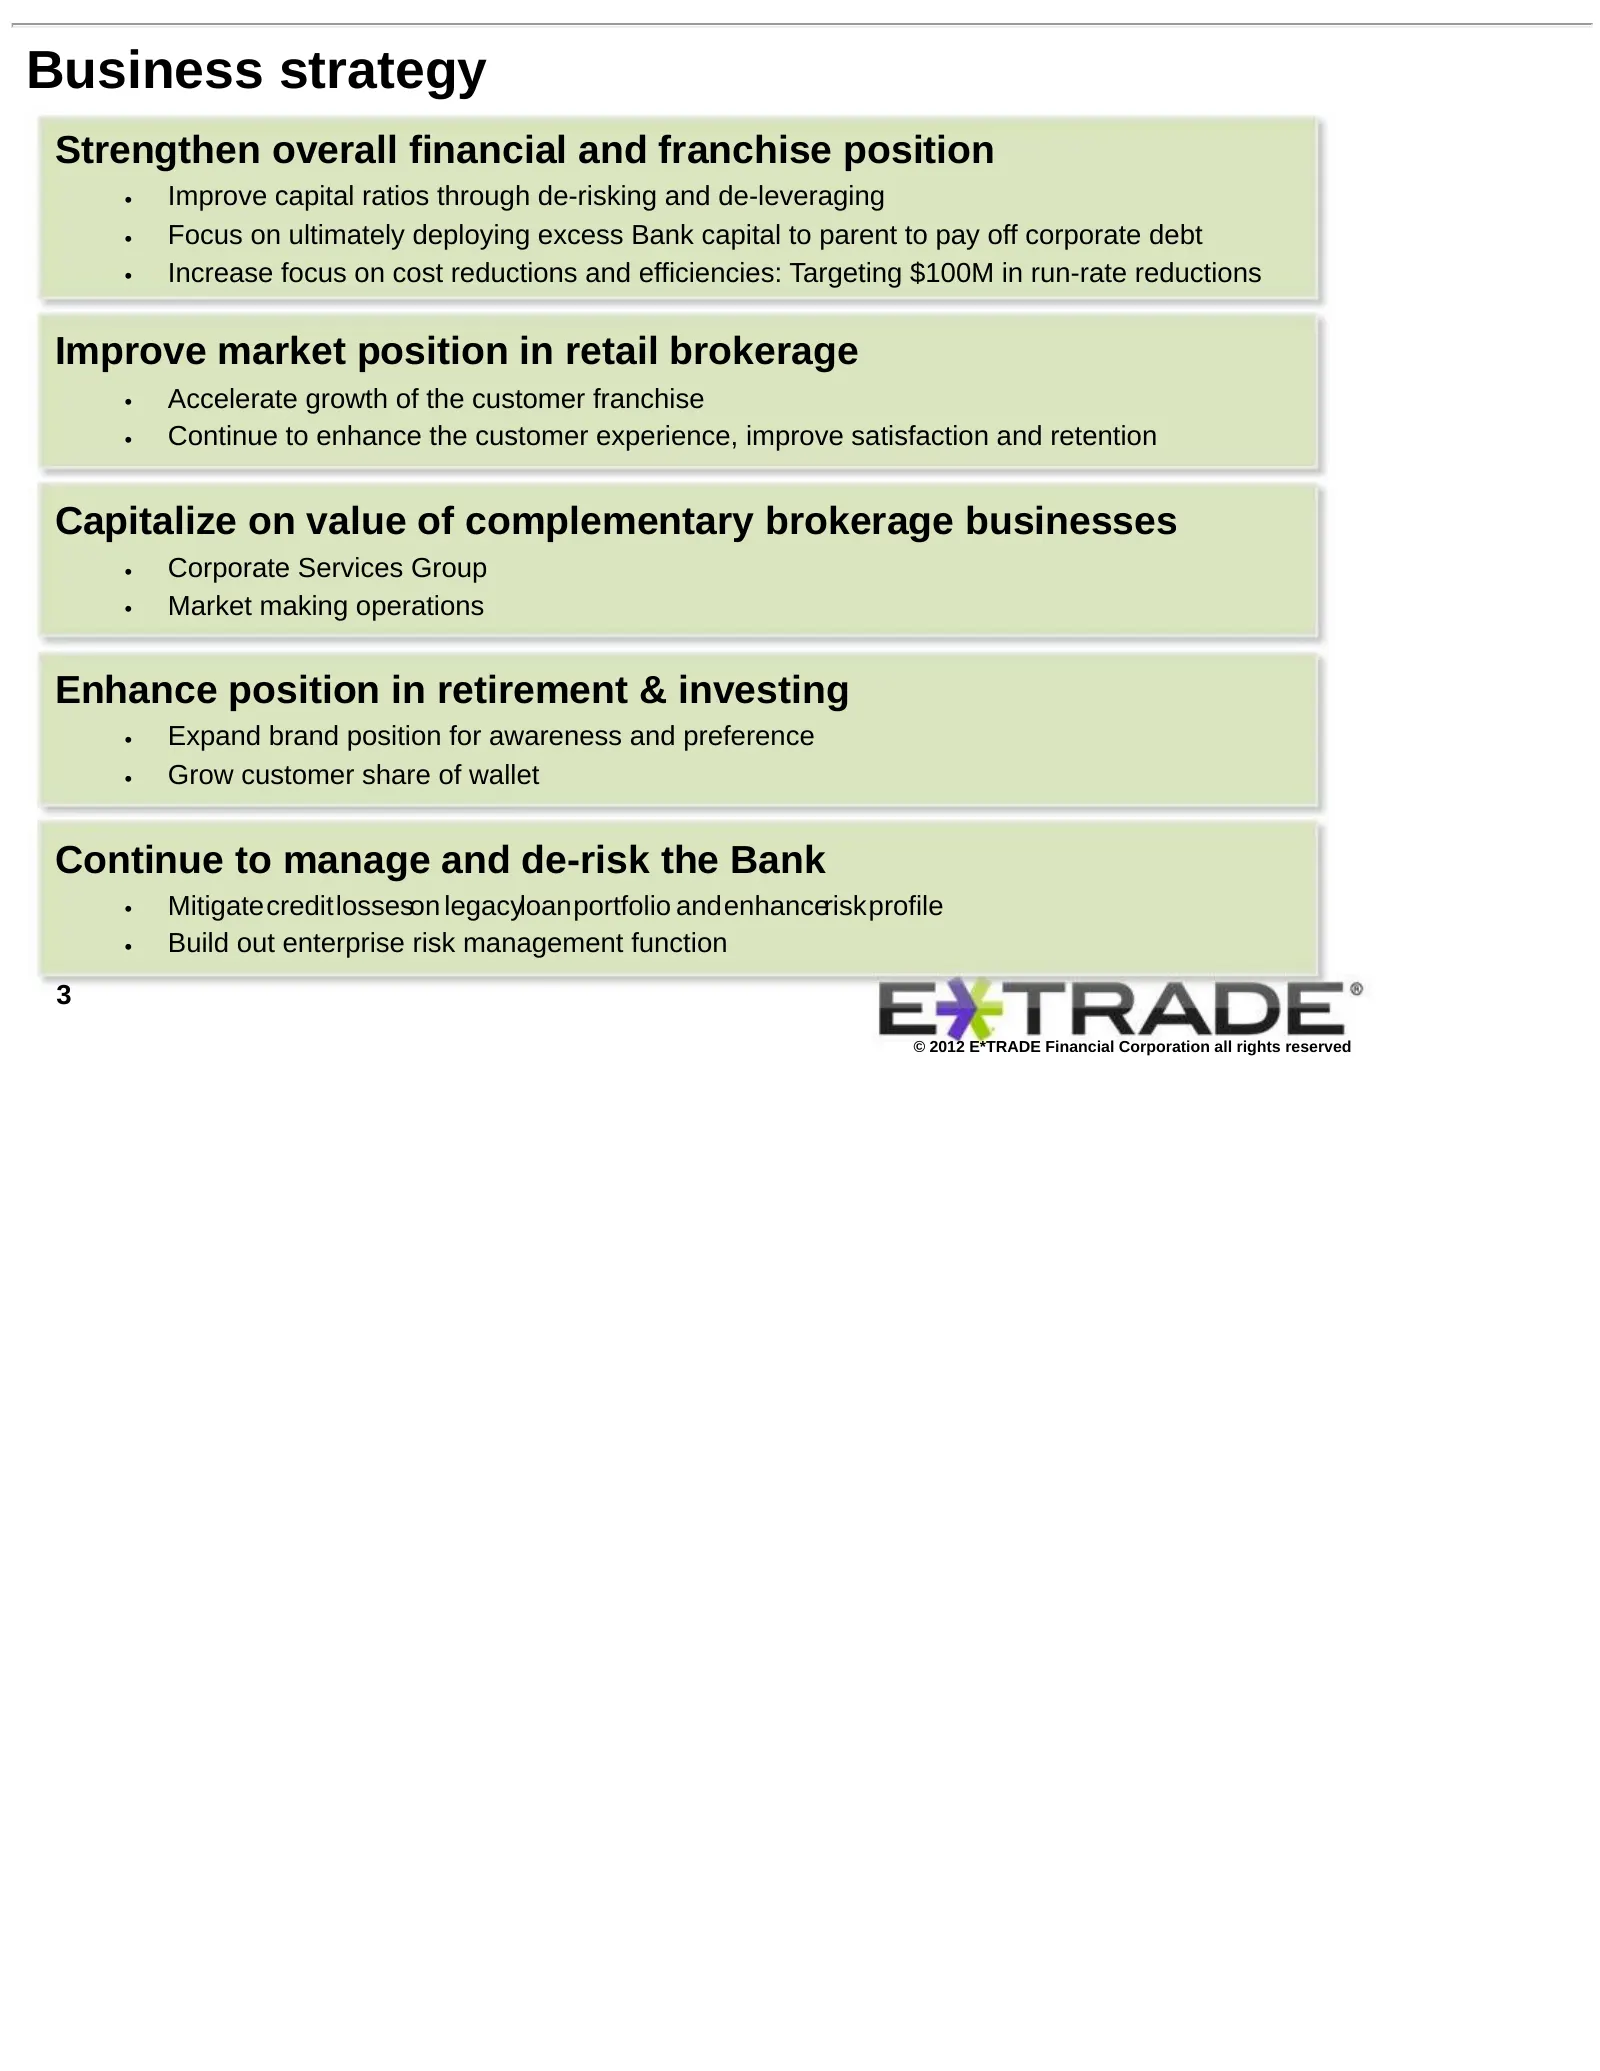
Business strategy Strengthen overall financial and franchise position • Improve capital ratios through de-risking and de-leveraging • Focus on ultimately deploying excess Bank capital to parent to pay off corporate debt • Increase focus on cost reductions and efficiencies: Targeting $100M in run-rat
Slide 4: Long-term impact of current strategy to improve earnings
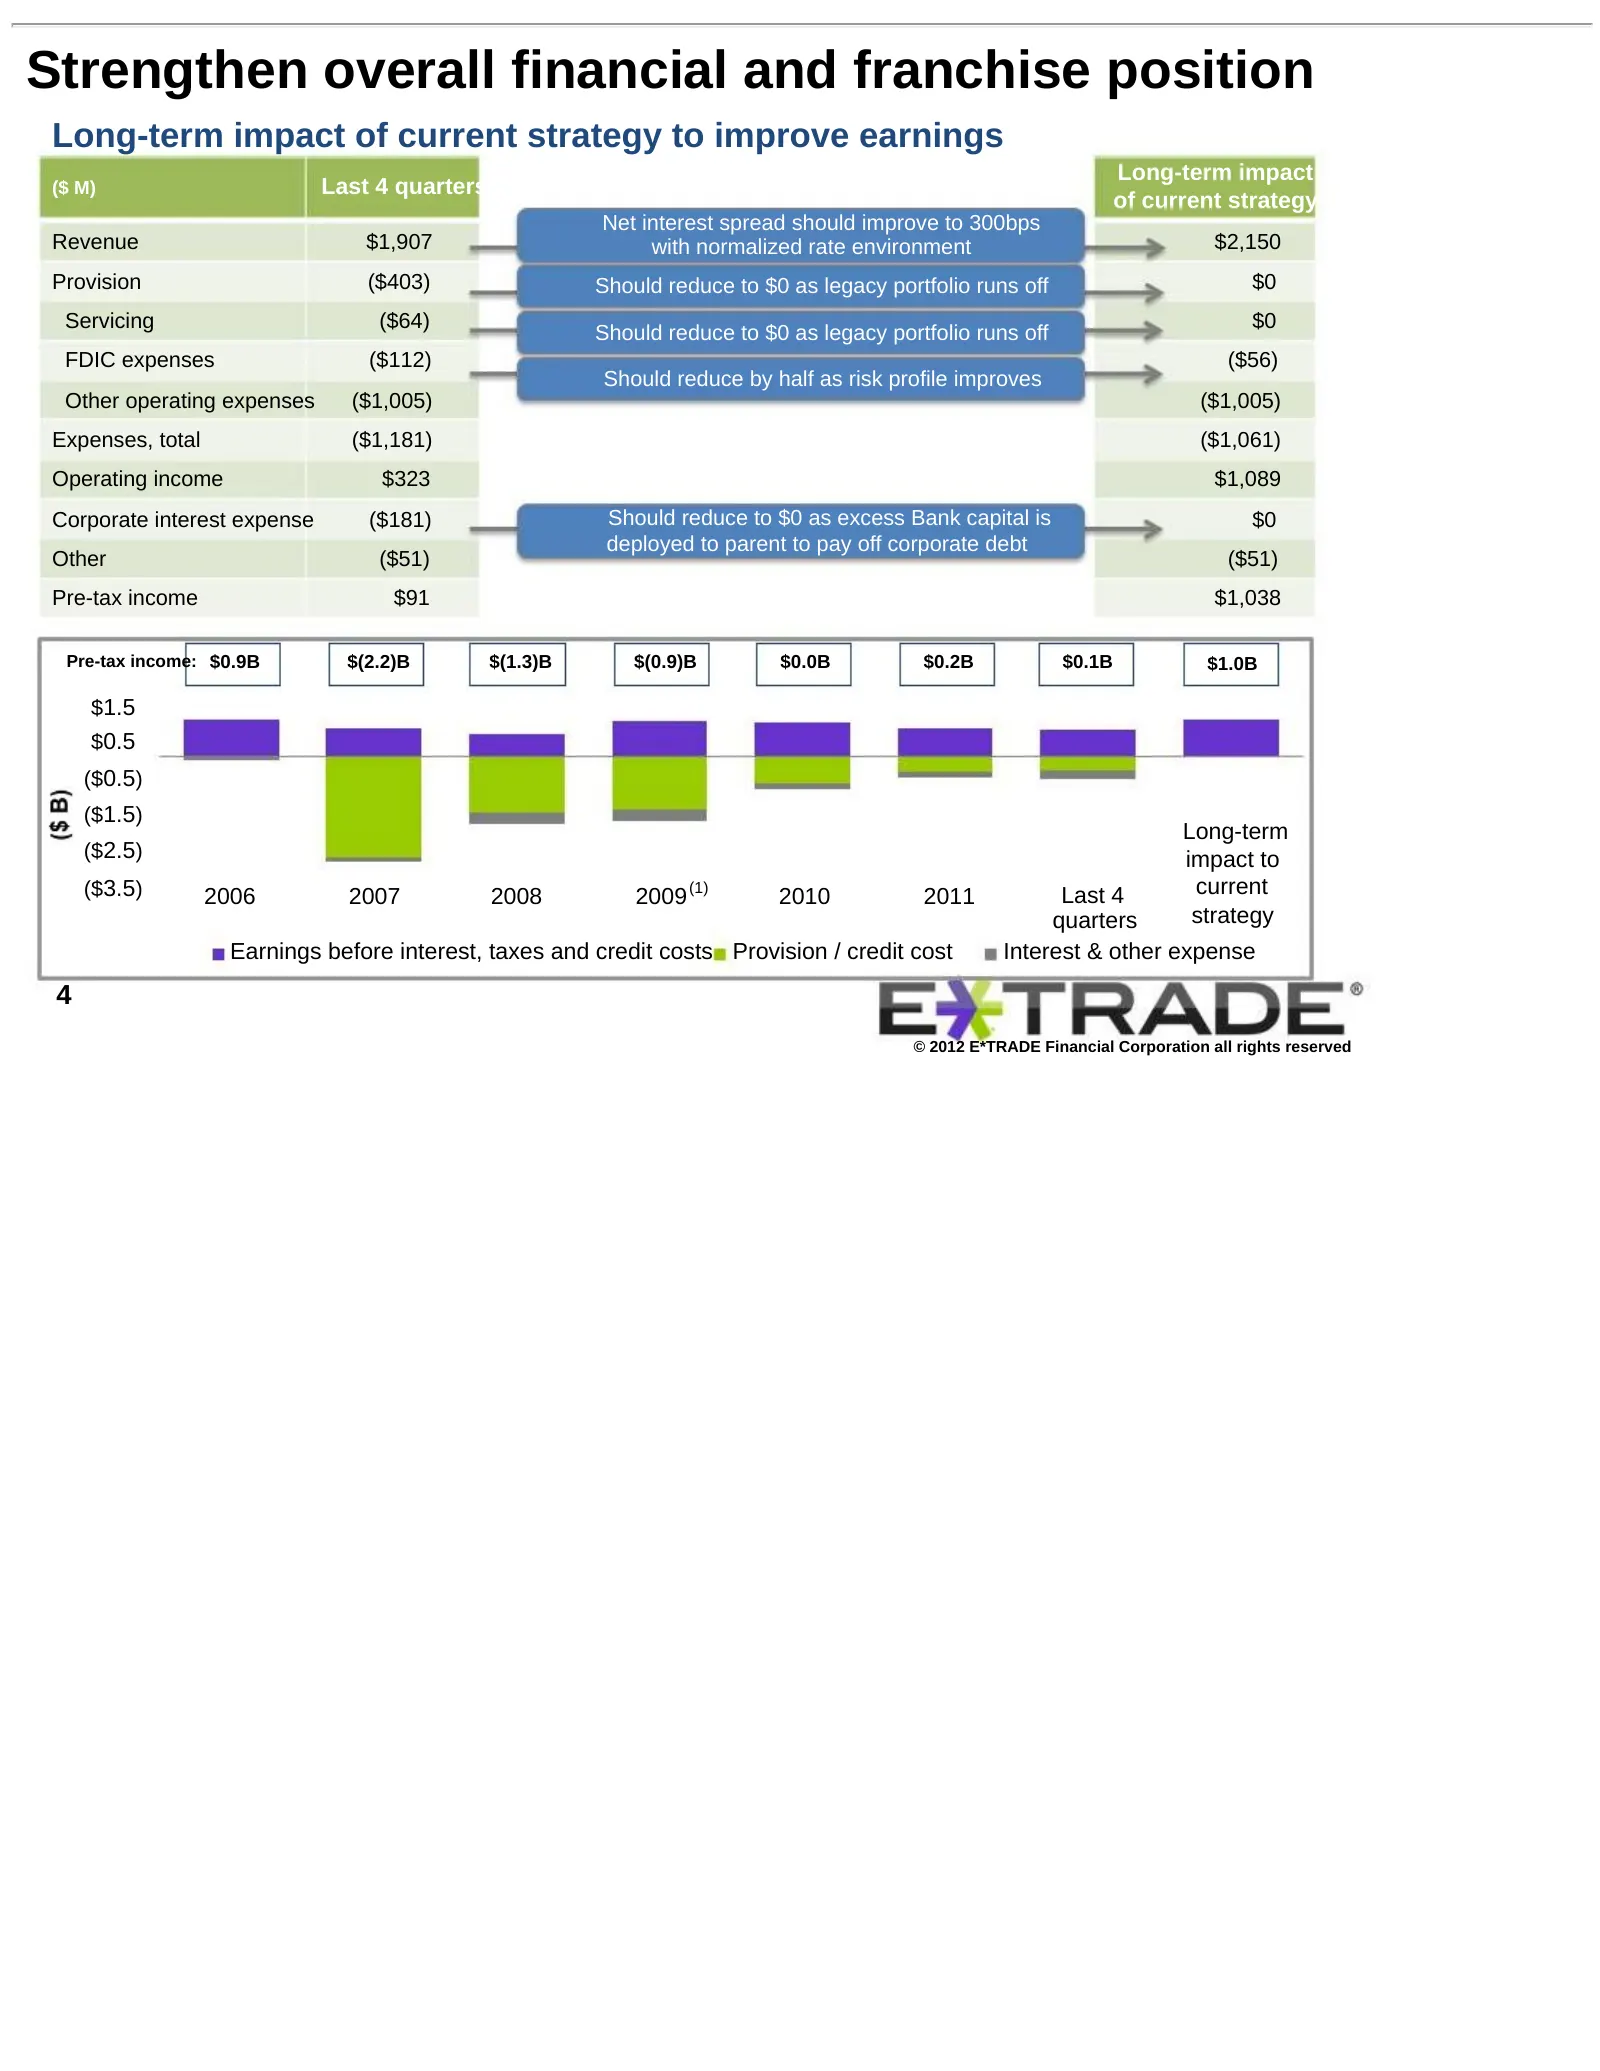
Strengthen overall financial and franchise position Long-term impact of current strategy to improve earnings Driver Long-term impact ($ M) Last 4 quarters of current strategy Net interest spread should improve to 300bps Revenue $1,907 with normalized rate environment $2,150 Provision ($403) Should r
Slide 5: Focused on deleveraging to improve most constraining ratio: Tier 1 leverage
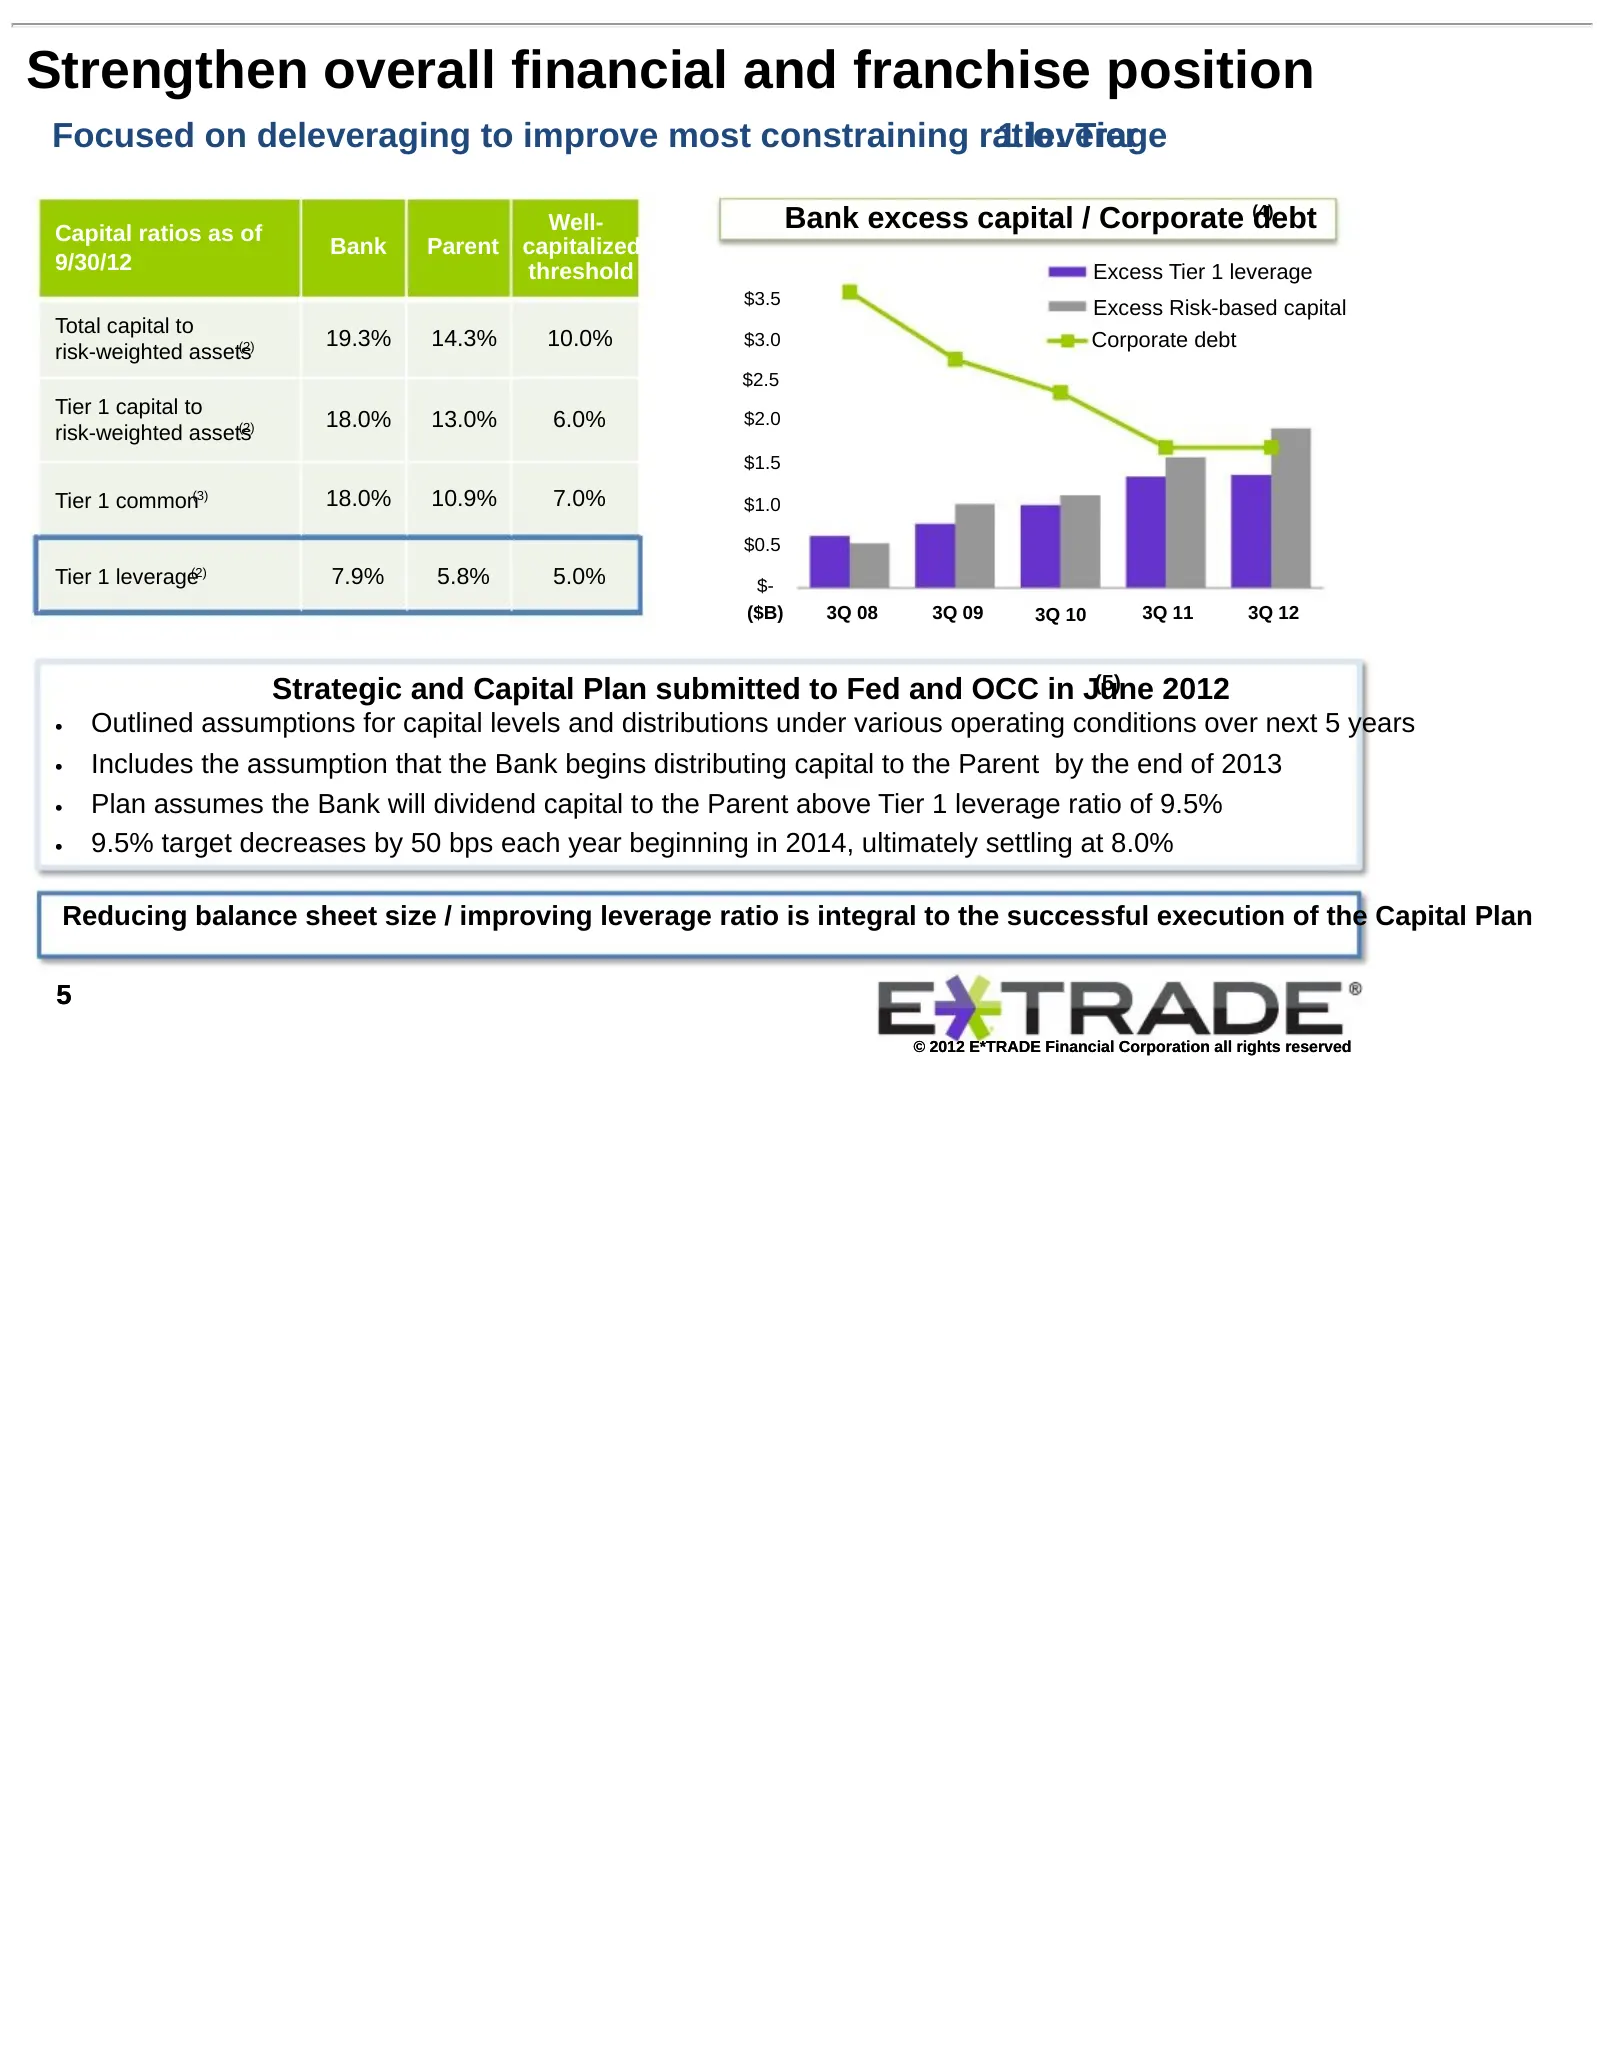
Strengthen overall financial and franchise position Focused on deleveraging to improve most constraining ratio: 1 leverage Tier Capital ratios as of Well- Bank excess capital / Corporate (4) debt Bank Parent capitalized 9/30/12 threshold Excess Tier 1 leverage $3.5 Excess Risk-based capital Total ca
Slide 6: Deleveraging actions and balance sheet size
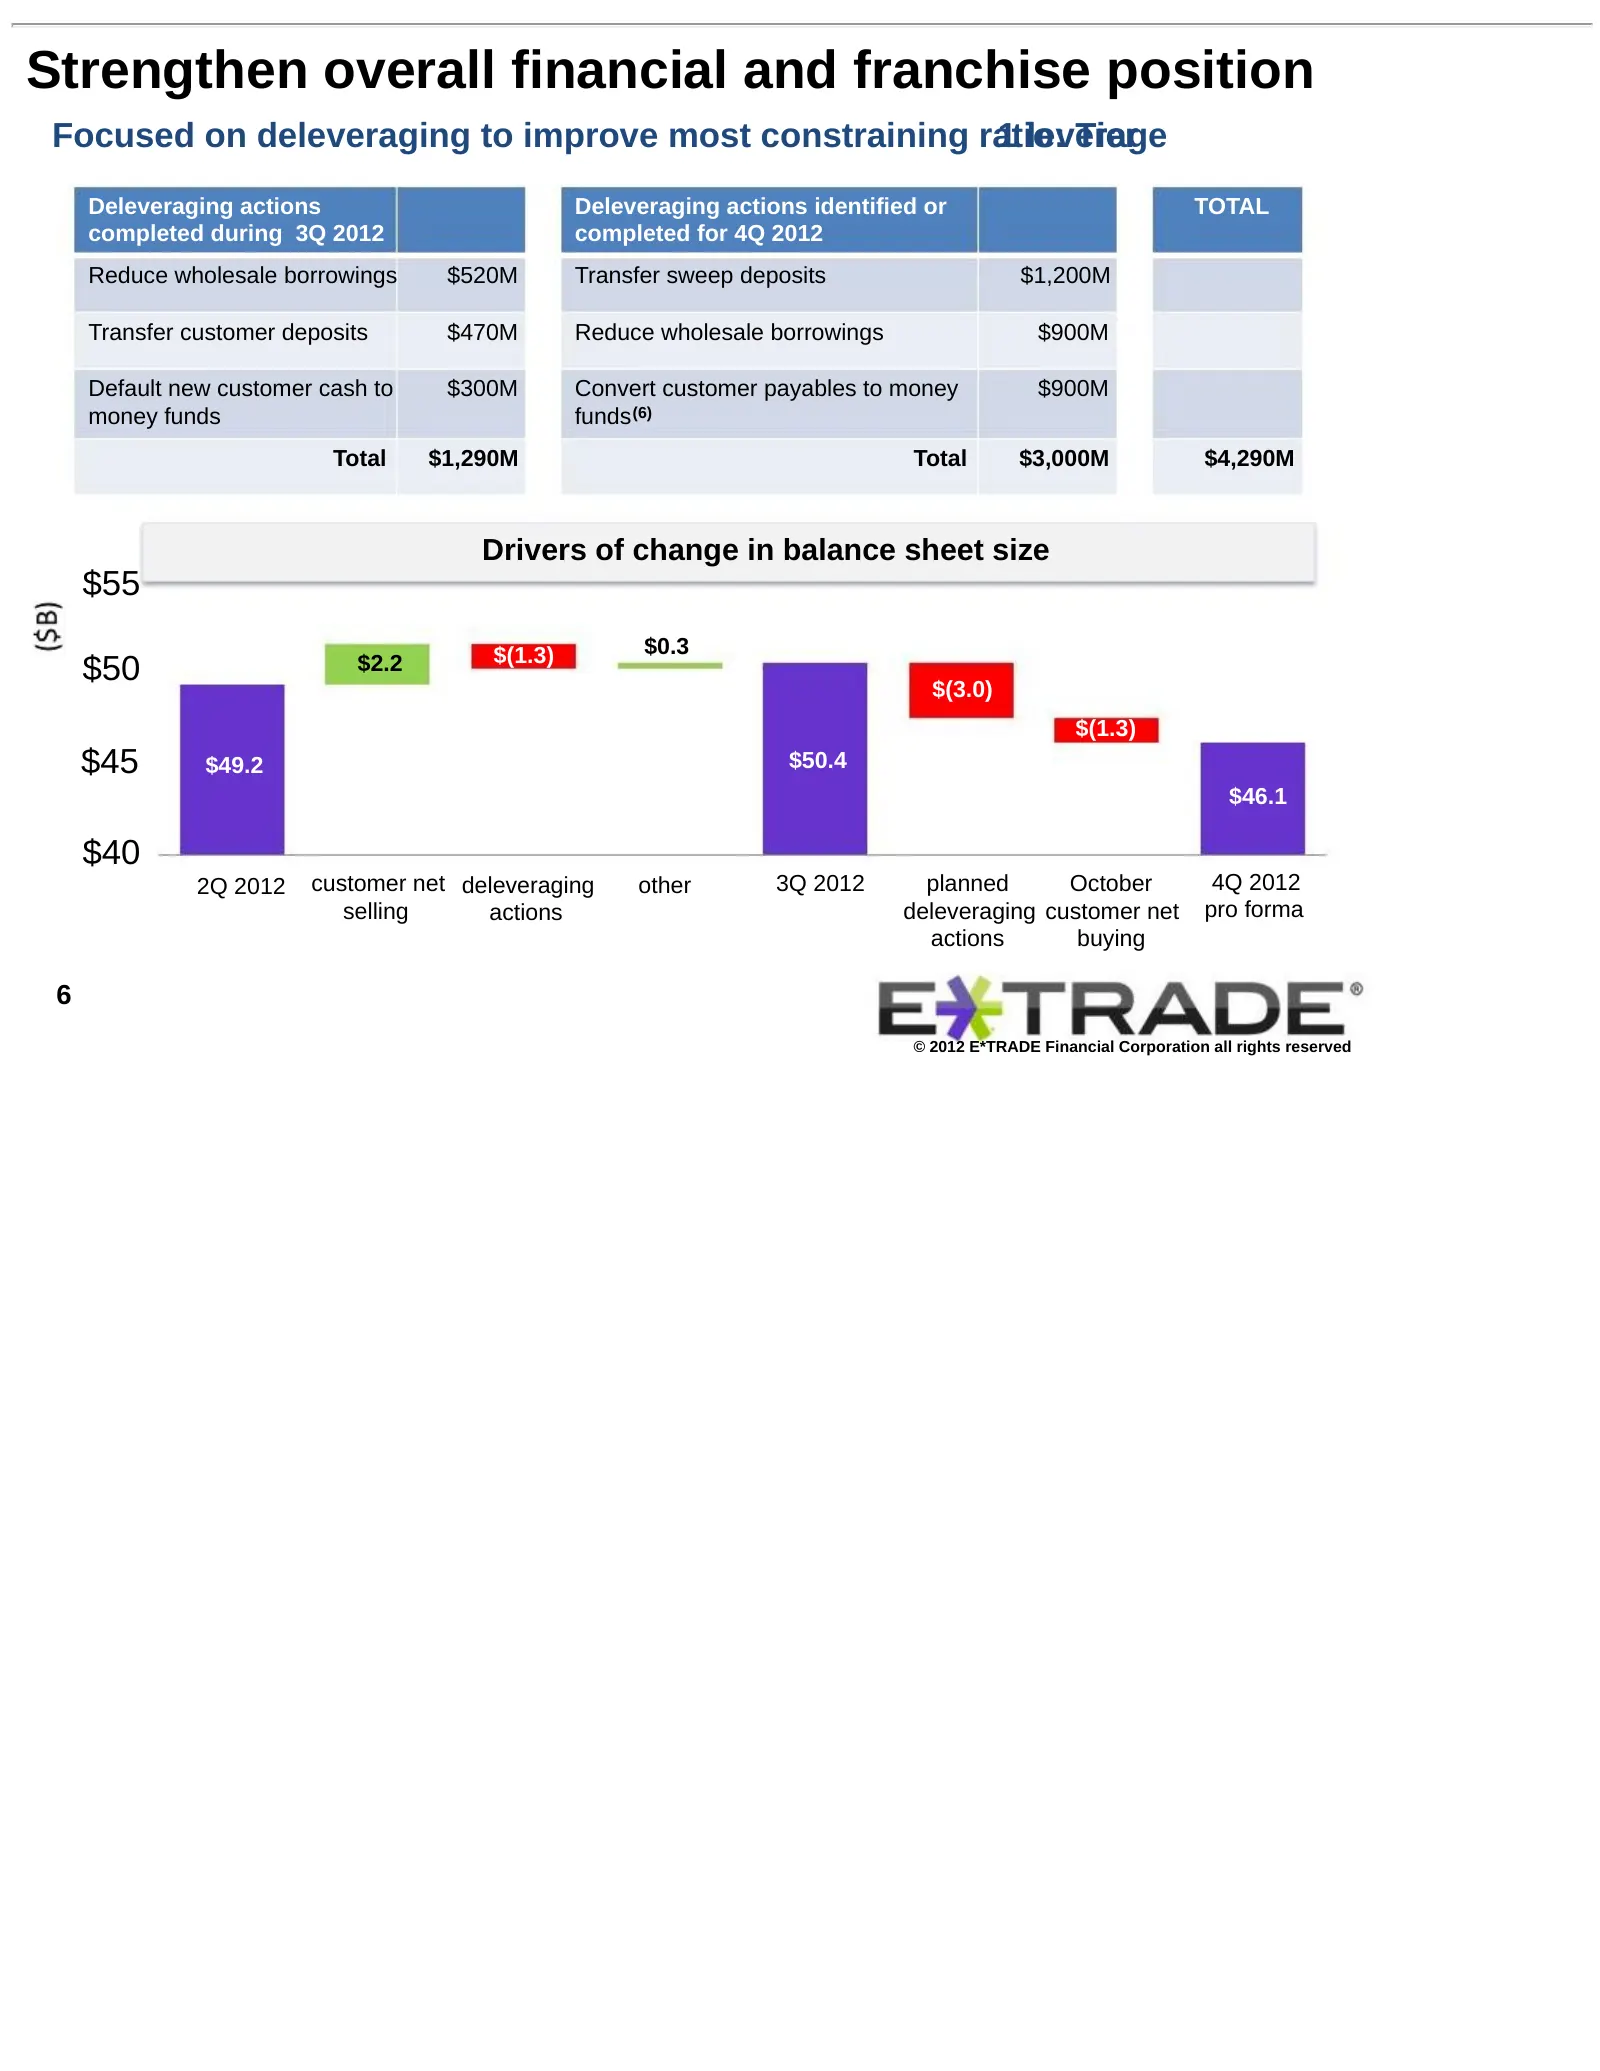
Strengthen overall financial and franchise position Focused on deleveraging to improve most constraining ratio: 1 leverage Tier Deleveraging actions Deleveraging actions identified or TOTAL completed during 3Q 2012 completed for 4Q 2012 Reduce wholesale borrowings $520M Transfer sweep deposits $1,20
Slide 7: Debt refinancing to significantly improve cash flow and reduce interest burden
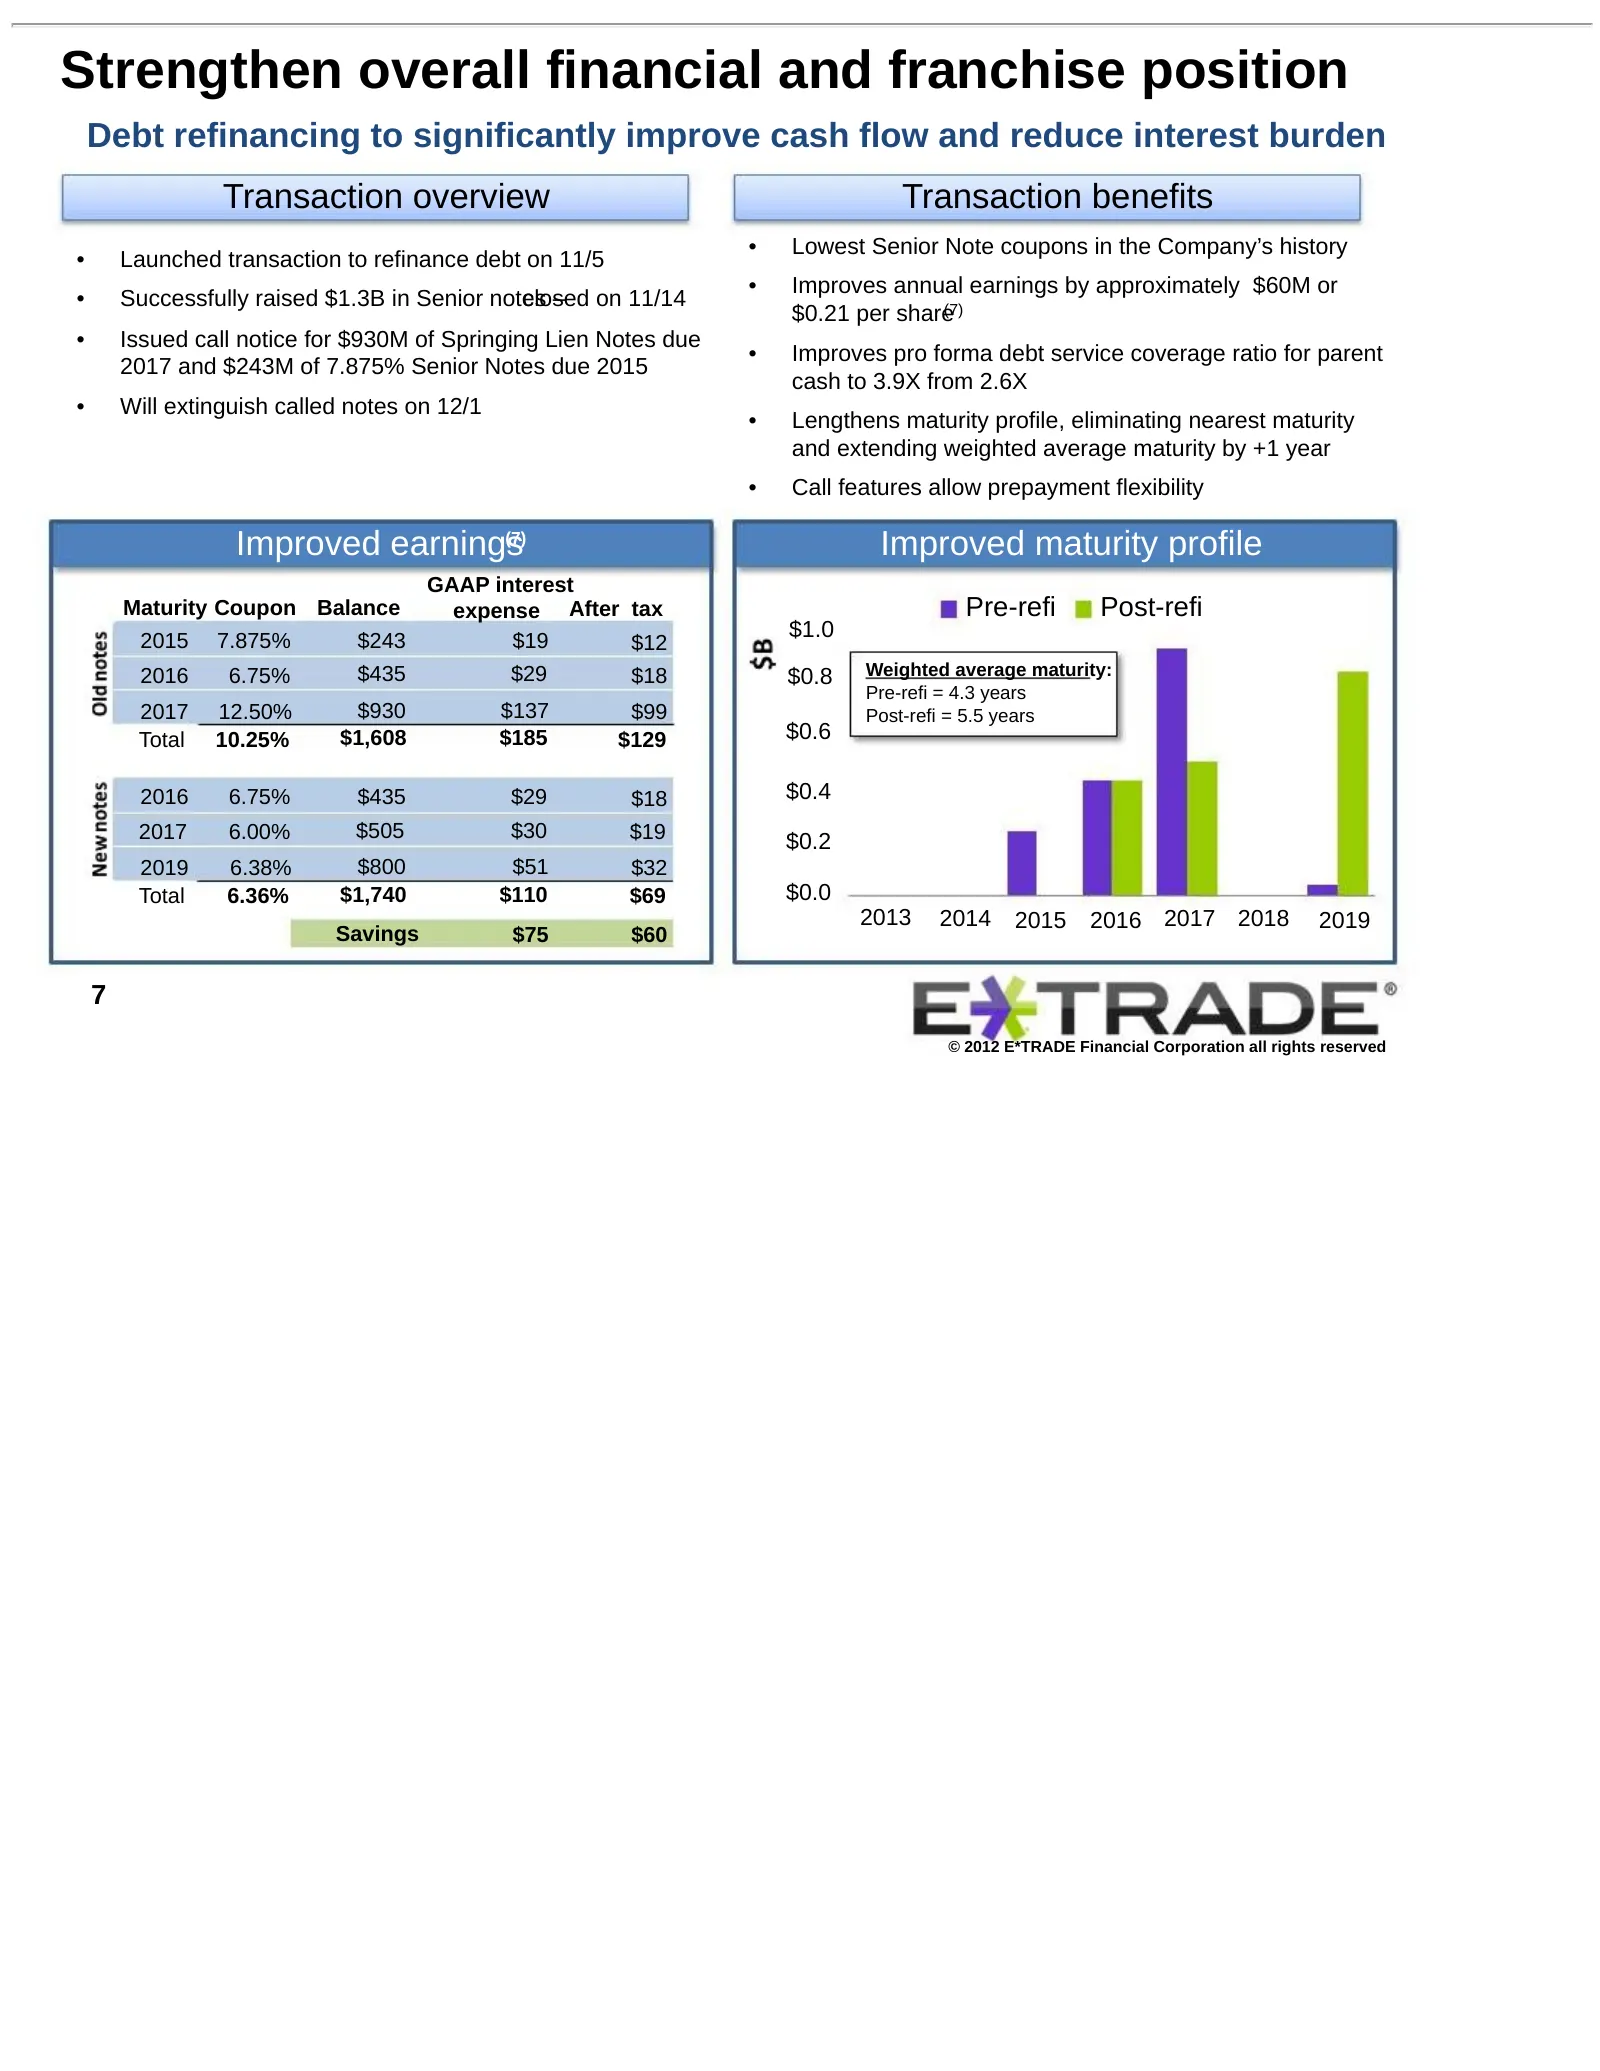
Strengthen overall financial and franchise position Debt refinancing to significantly improve cash flow and reduce interest burden Transaction overview Transaction benefits • Lowest Senior Note coupons in the Company’s history • Launched transaction to refinance debt on 11/5 • Improves annual earnin
Slide 8: Deferred tax asset: Embedded value realized with ongoing profitability
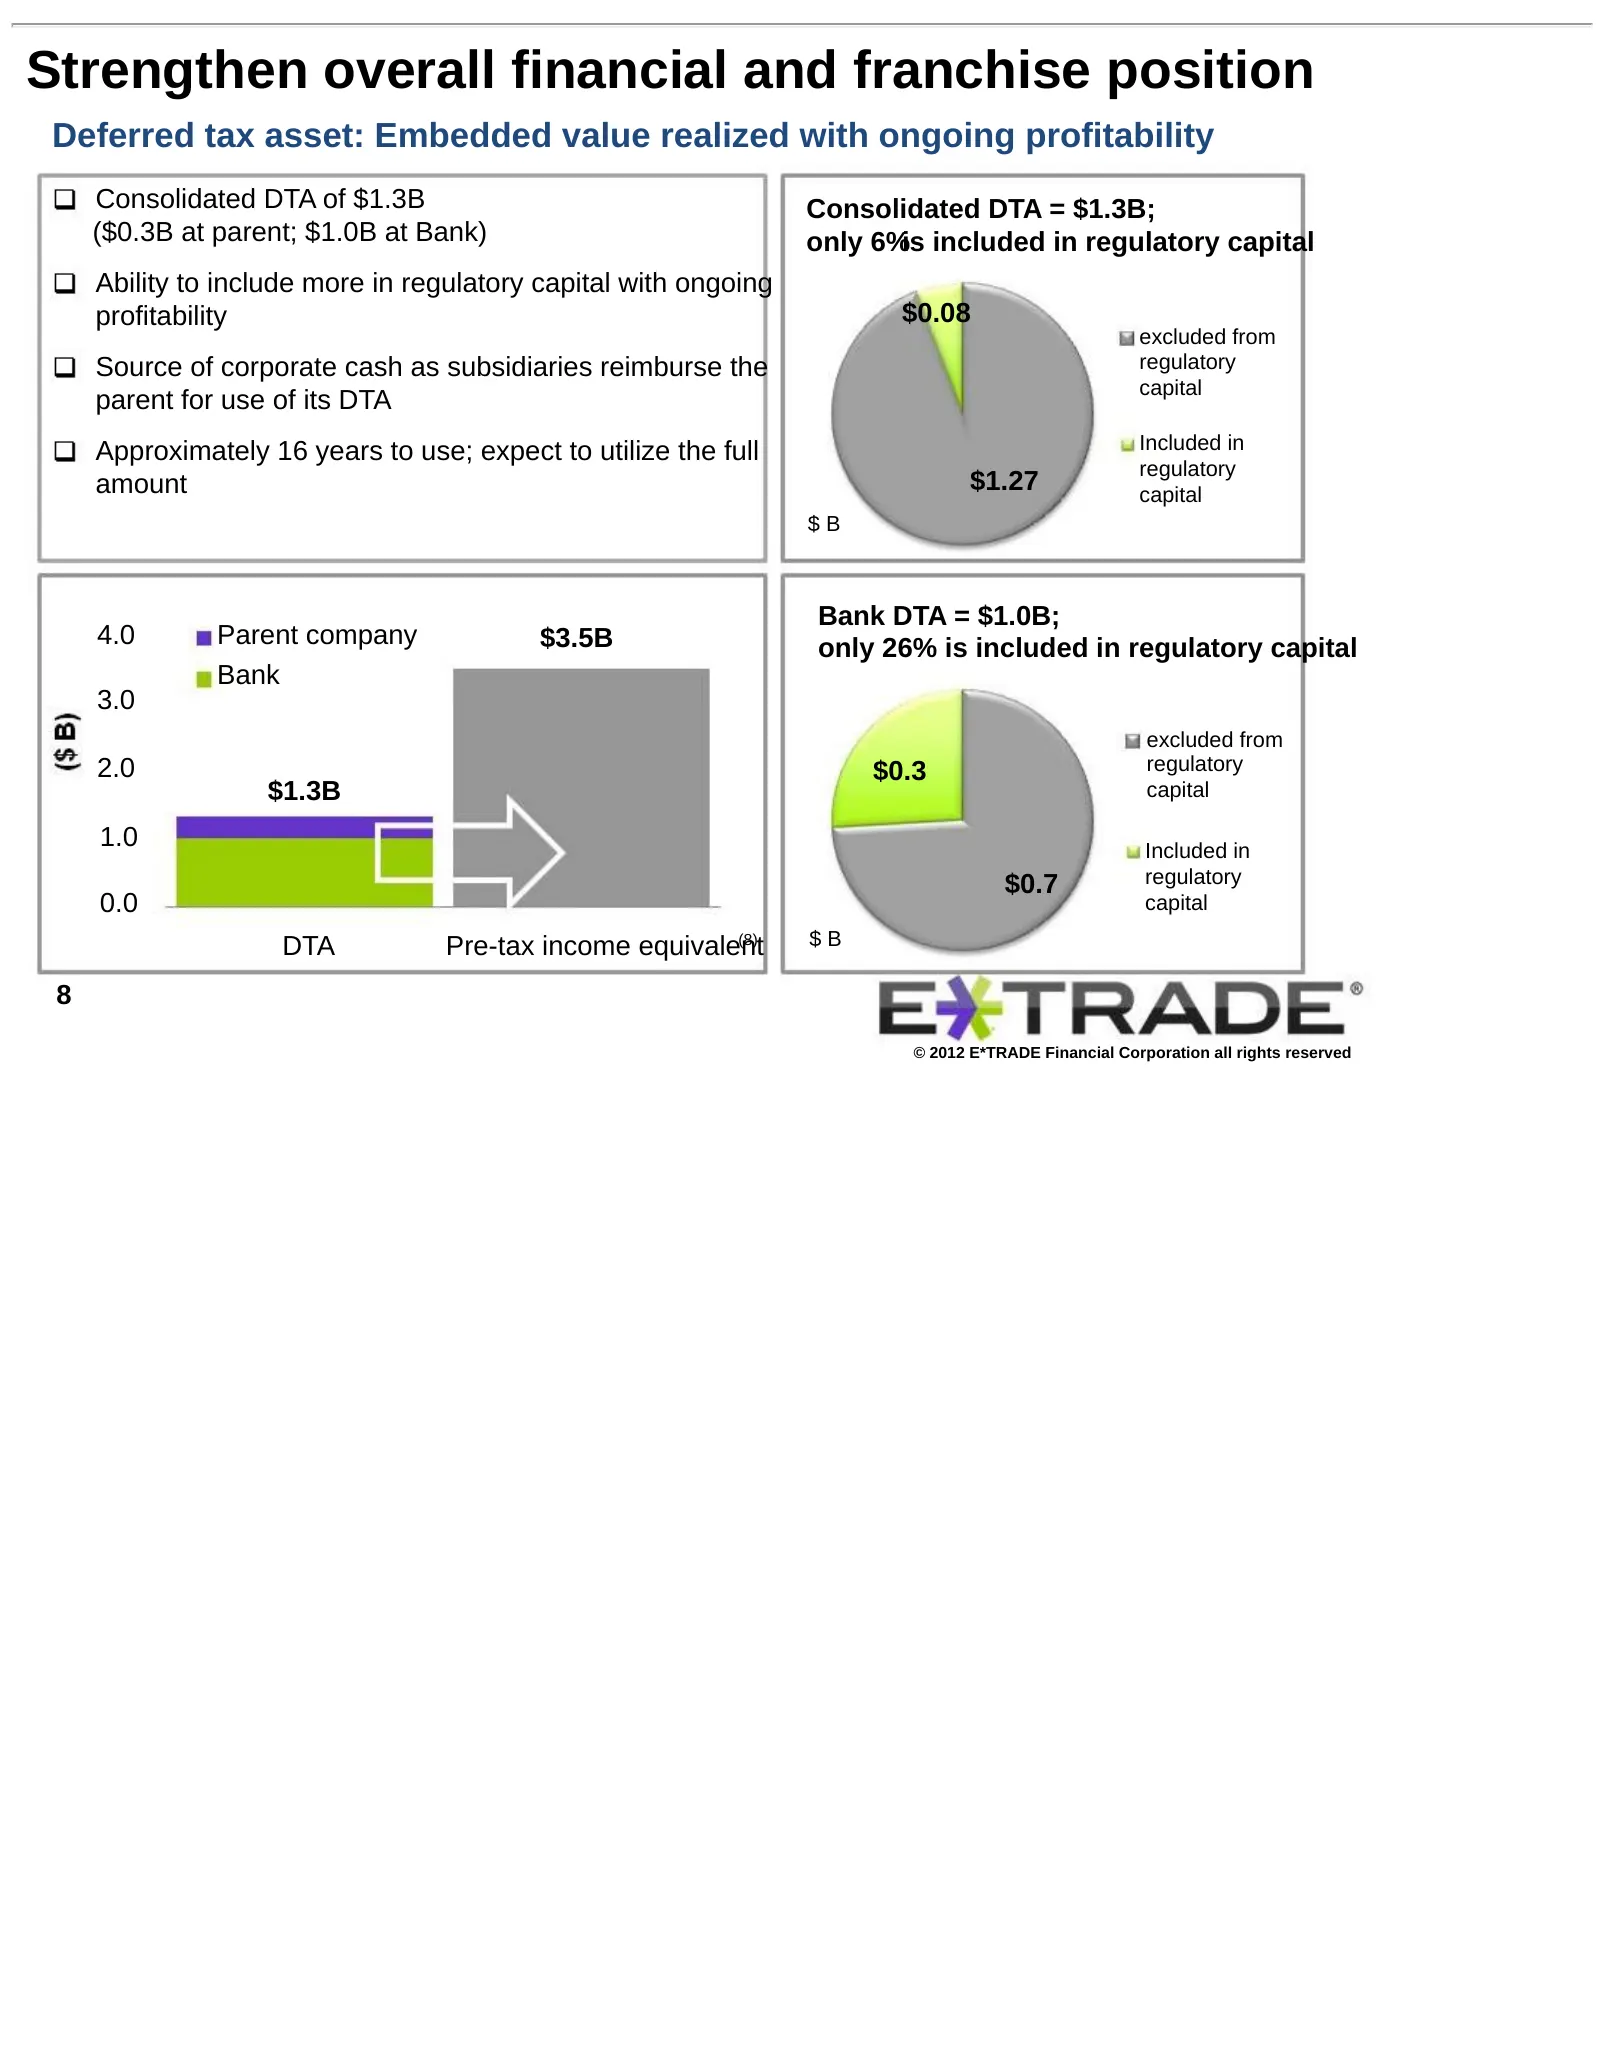
Strengthen overall financial and franchise position Deferred tax asset: Embedded value realized with ongoing profitability Consolidated DTA of $1.3B Consolidated DTA = $1.3B; ($0.3B at parent; $1.0B at Bank) only 6%is included in regulatory capital Ability to include more in regulatory capital with

Slide 9: Committed to grow as a recognized leader with iconic brand and advertising
Improve market position in retail brokerage Committed to grow as a recognized leader with iconic brand and advertizing (9) (10) (11) Redesigned public website Leading-edge platforms Award-winning iconic brand & advertising 9 © 2012 E*TRADE Financial Corporation all rights reserved
Slide 10: Key initiatives to drive success
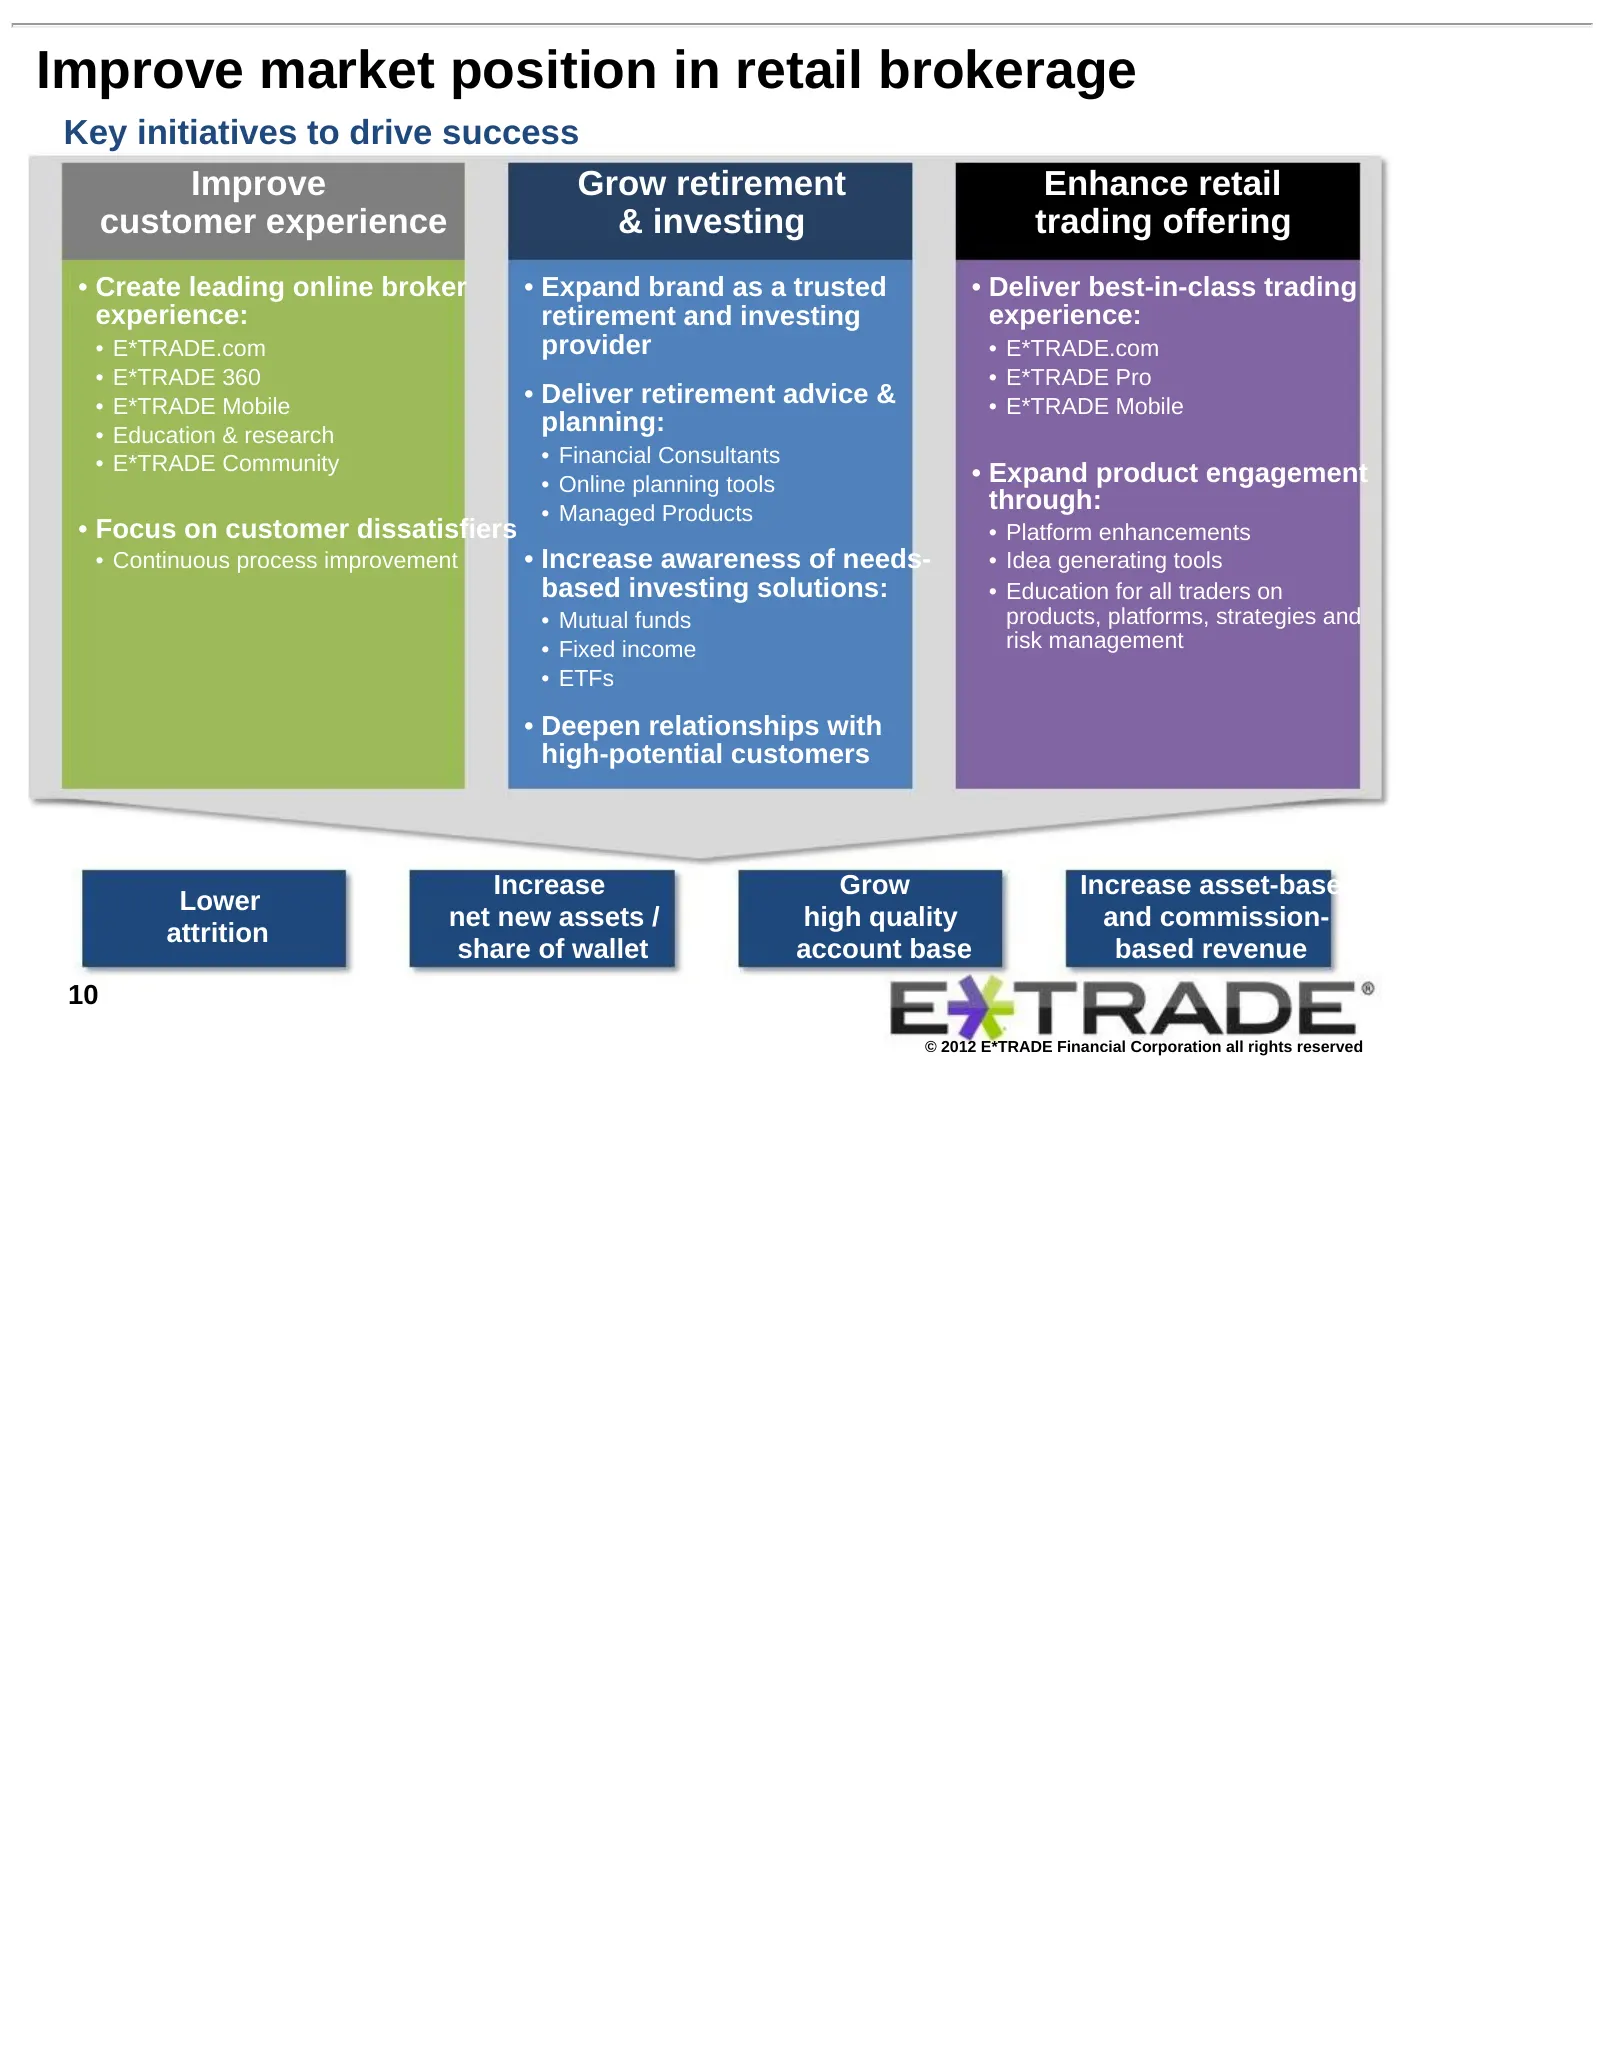
Improve market position in retail brokerage Key initiatives to drive success Improve Grow retirement Enhance retail customer experience & investing trading offering • Create leading online broker • Expand brand as a trusted • Deliver best-in-class trading experience: retirement and investing experie
Slide 11: Accelerate growth of the customer franchise
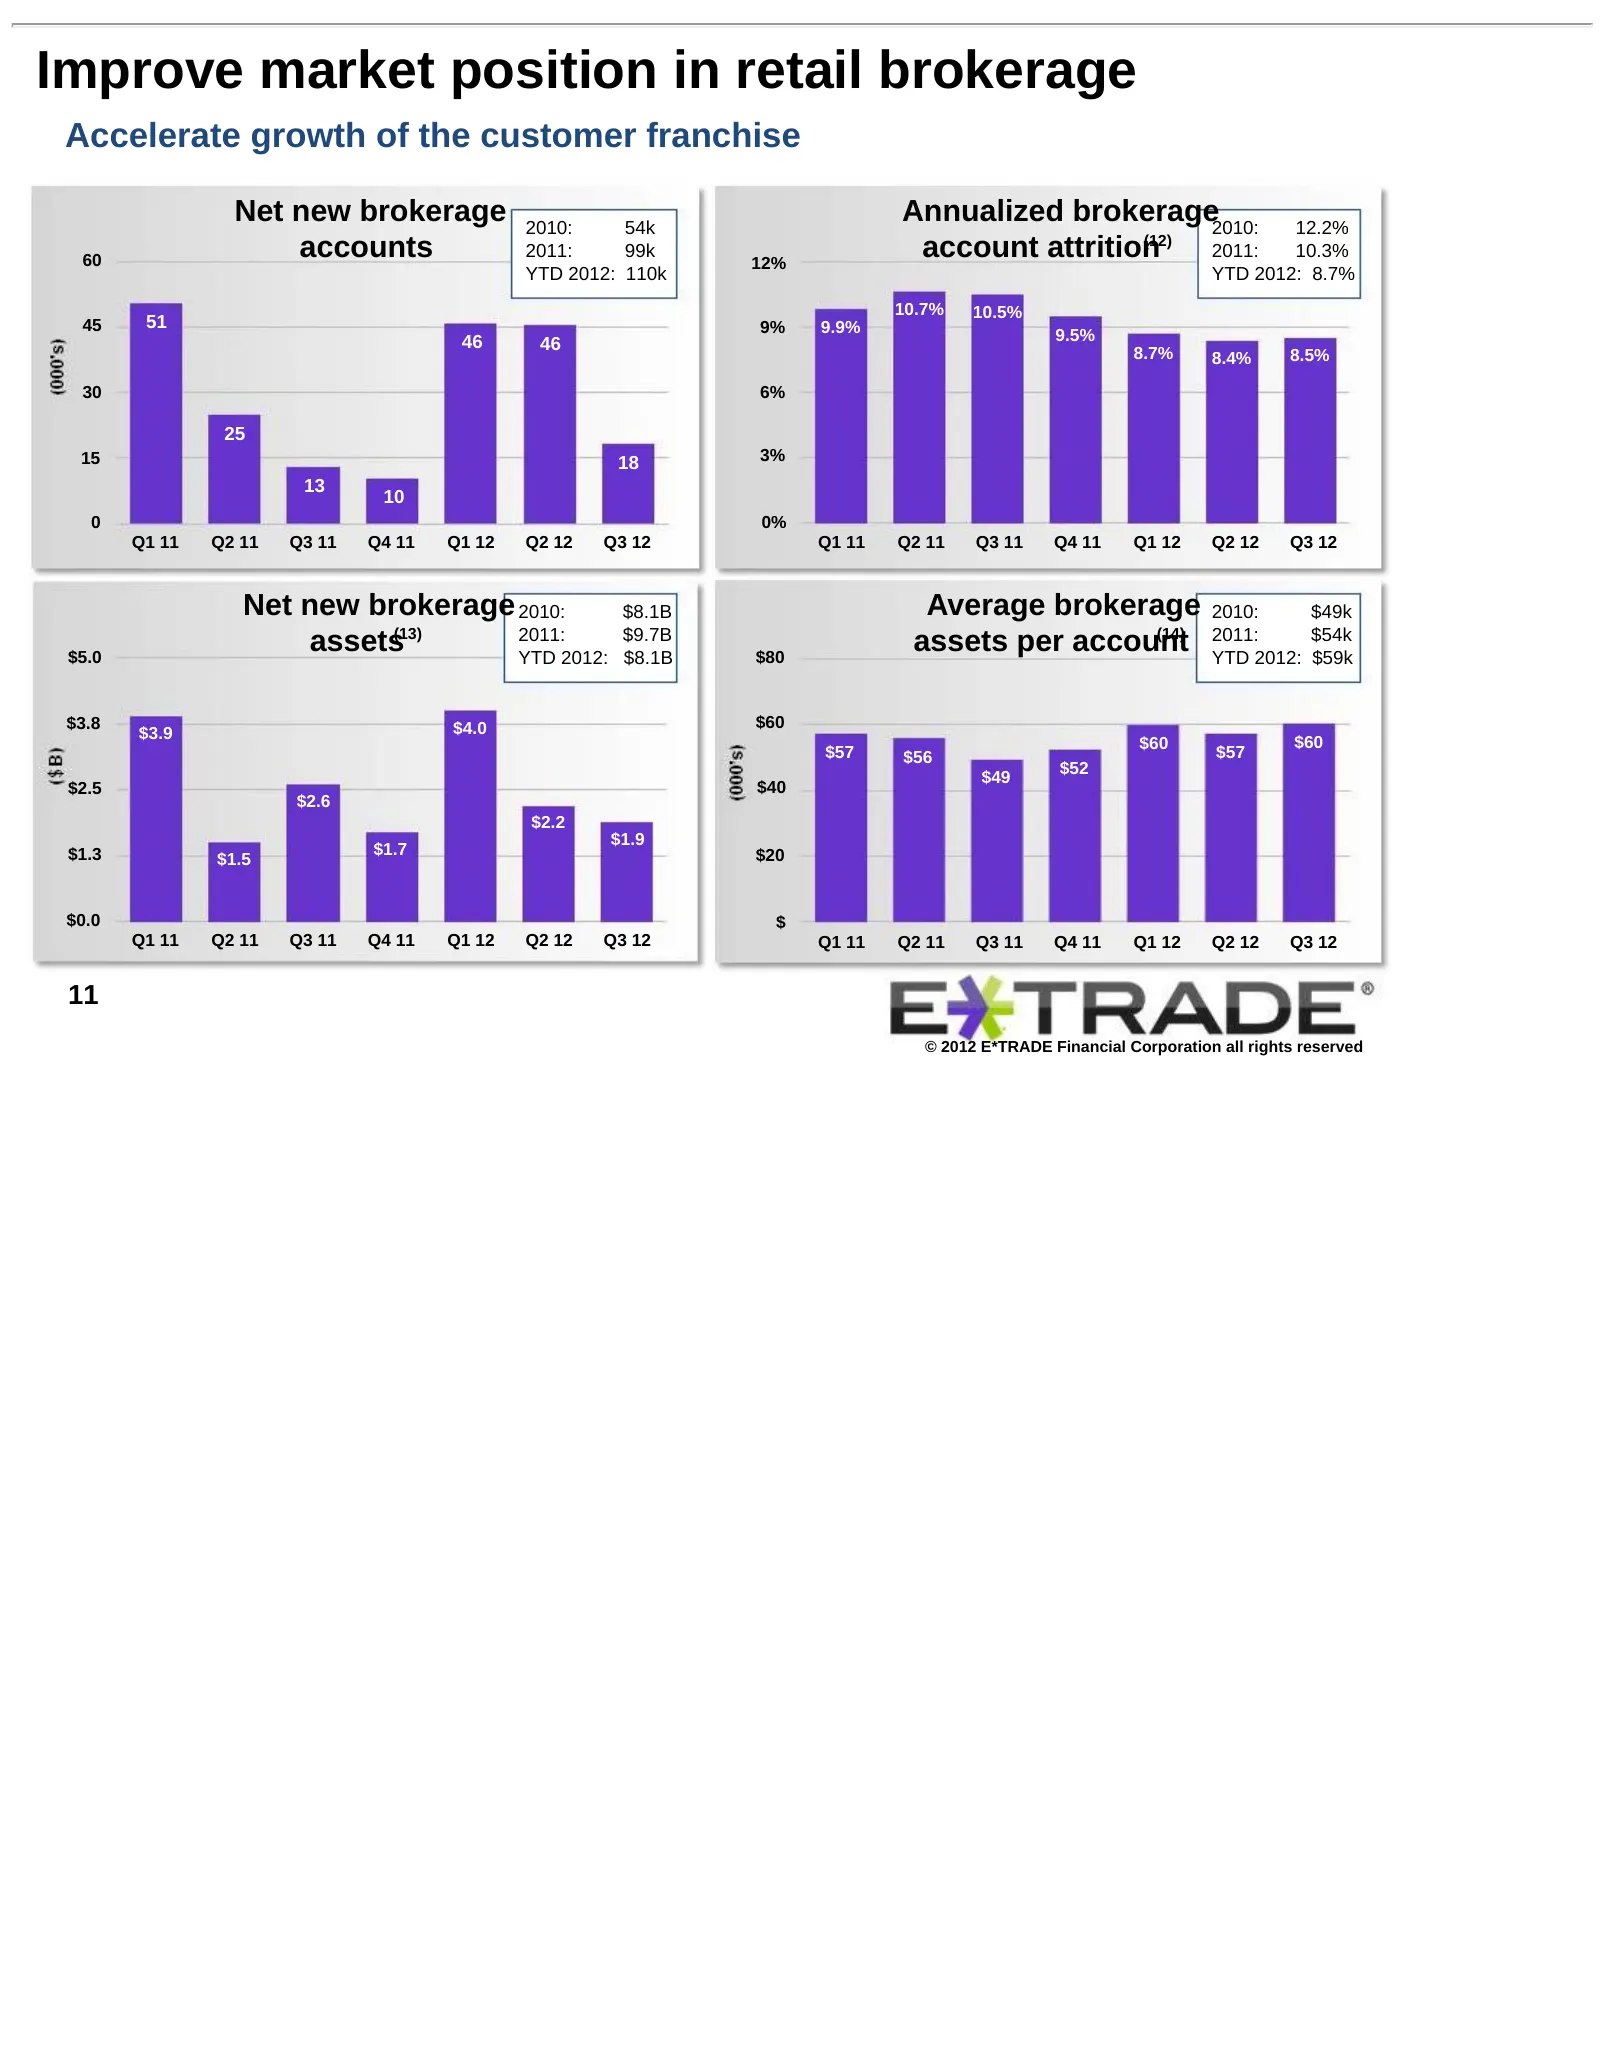
Improve market position in retail brokerage Accelerate growth of the customer franchise Net new brokerage 2010: 54k Annualized brokerage2010: 12.2% 60 accounts 2011: 99k 12% account attrition (12) 2011: 10.3% YTD 2012: 110k YTD 2012: 8.7% 10.7% 10.5% 45 51 9% 9.9% 46 9.5% 46 8.7% 8.4% 8.5% 30 6% 25
Slide 12: Accelerate growth of the customer franchise
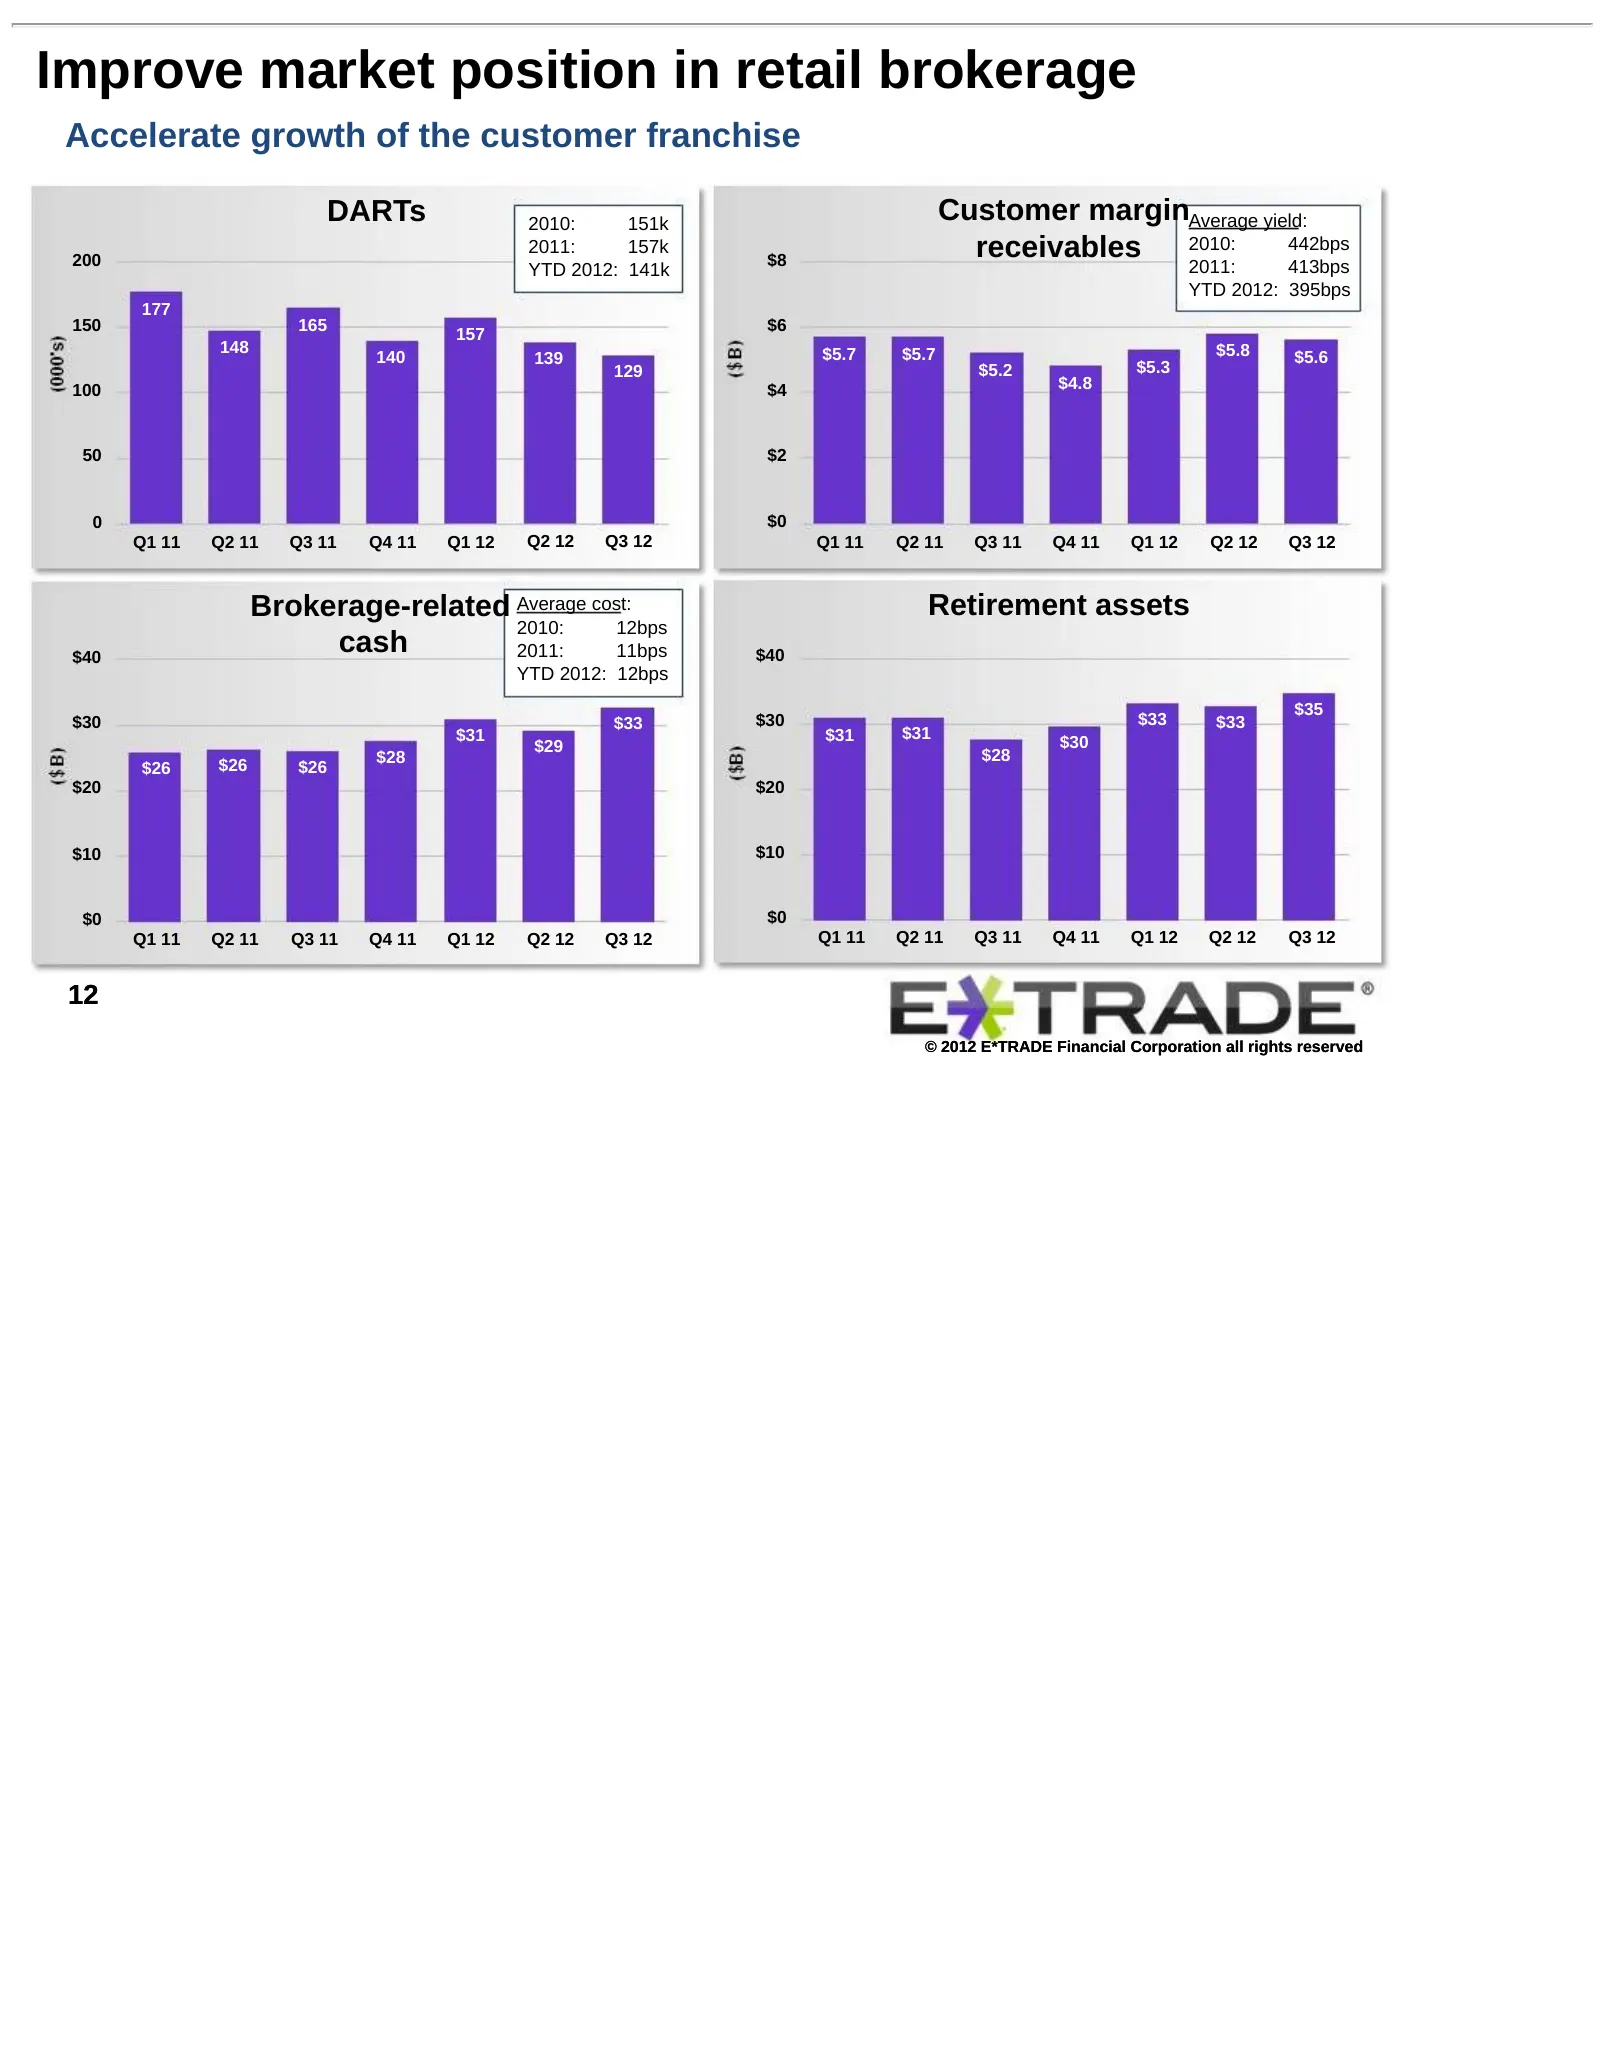
Improve market position in retail brokerage Accelerate growth of the customer franchise DARTs 2010: 151k Customer marginAverage yield: 200 2011: 157k $8 receivables 2010: 442bps YTD 2012: 141k 2011: 413bps YTD 2012: 395bps 177 150 165 $6 157 148 $5.7 $5.7 $5.8 140 139 $5.6 129 $5.2 $5.3 100 $4 $4.8
Slide 13: Enhance position in retirement & investing
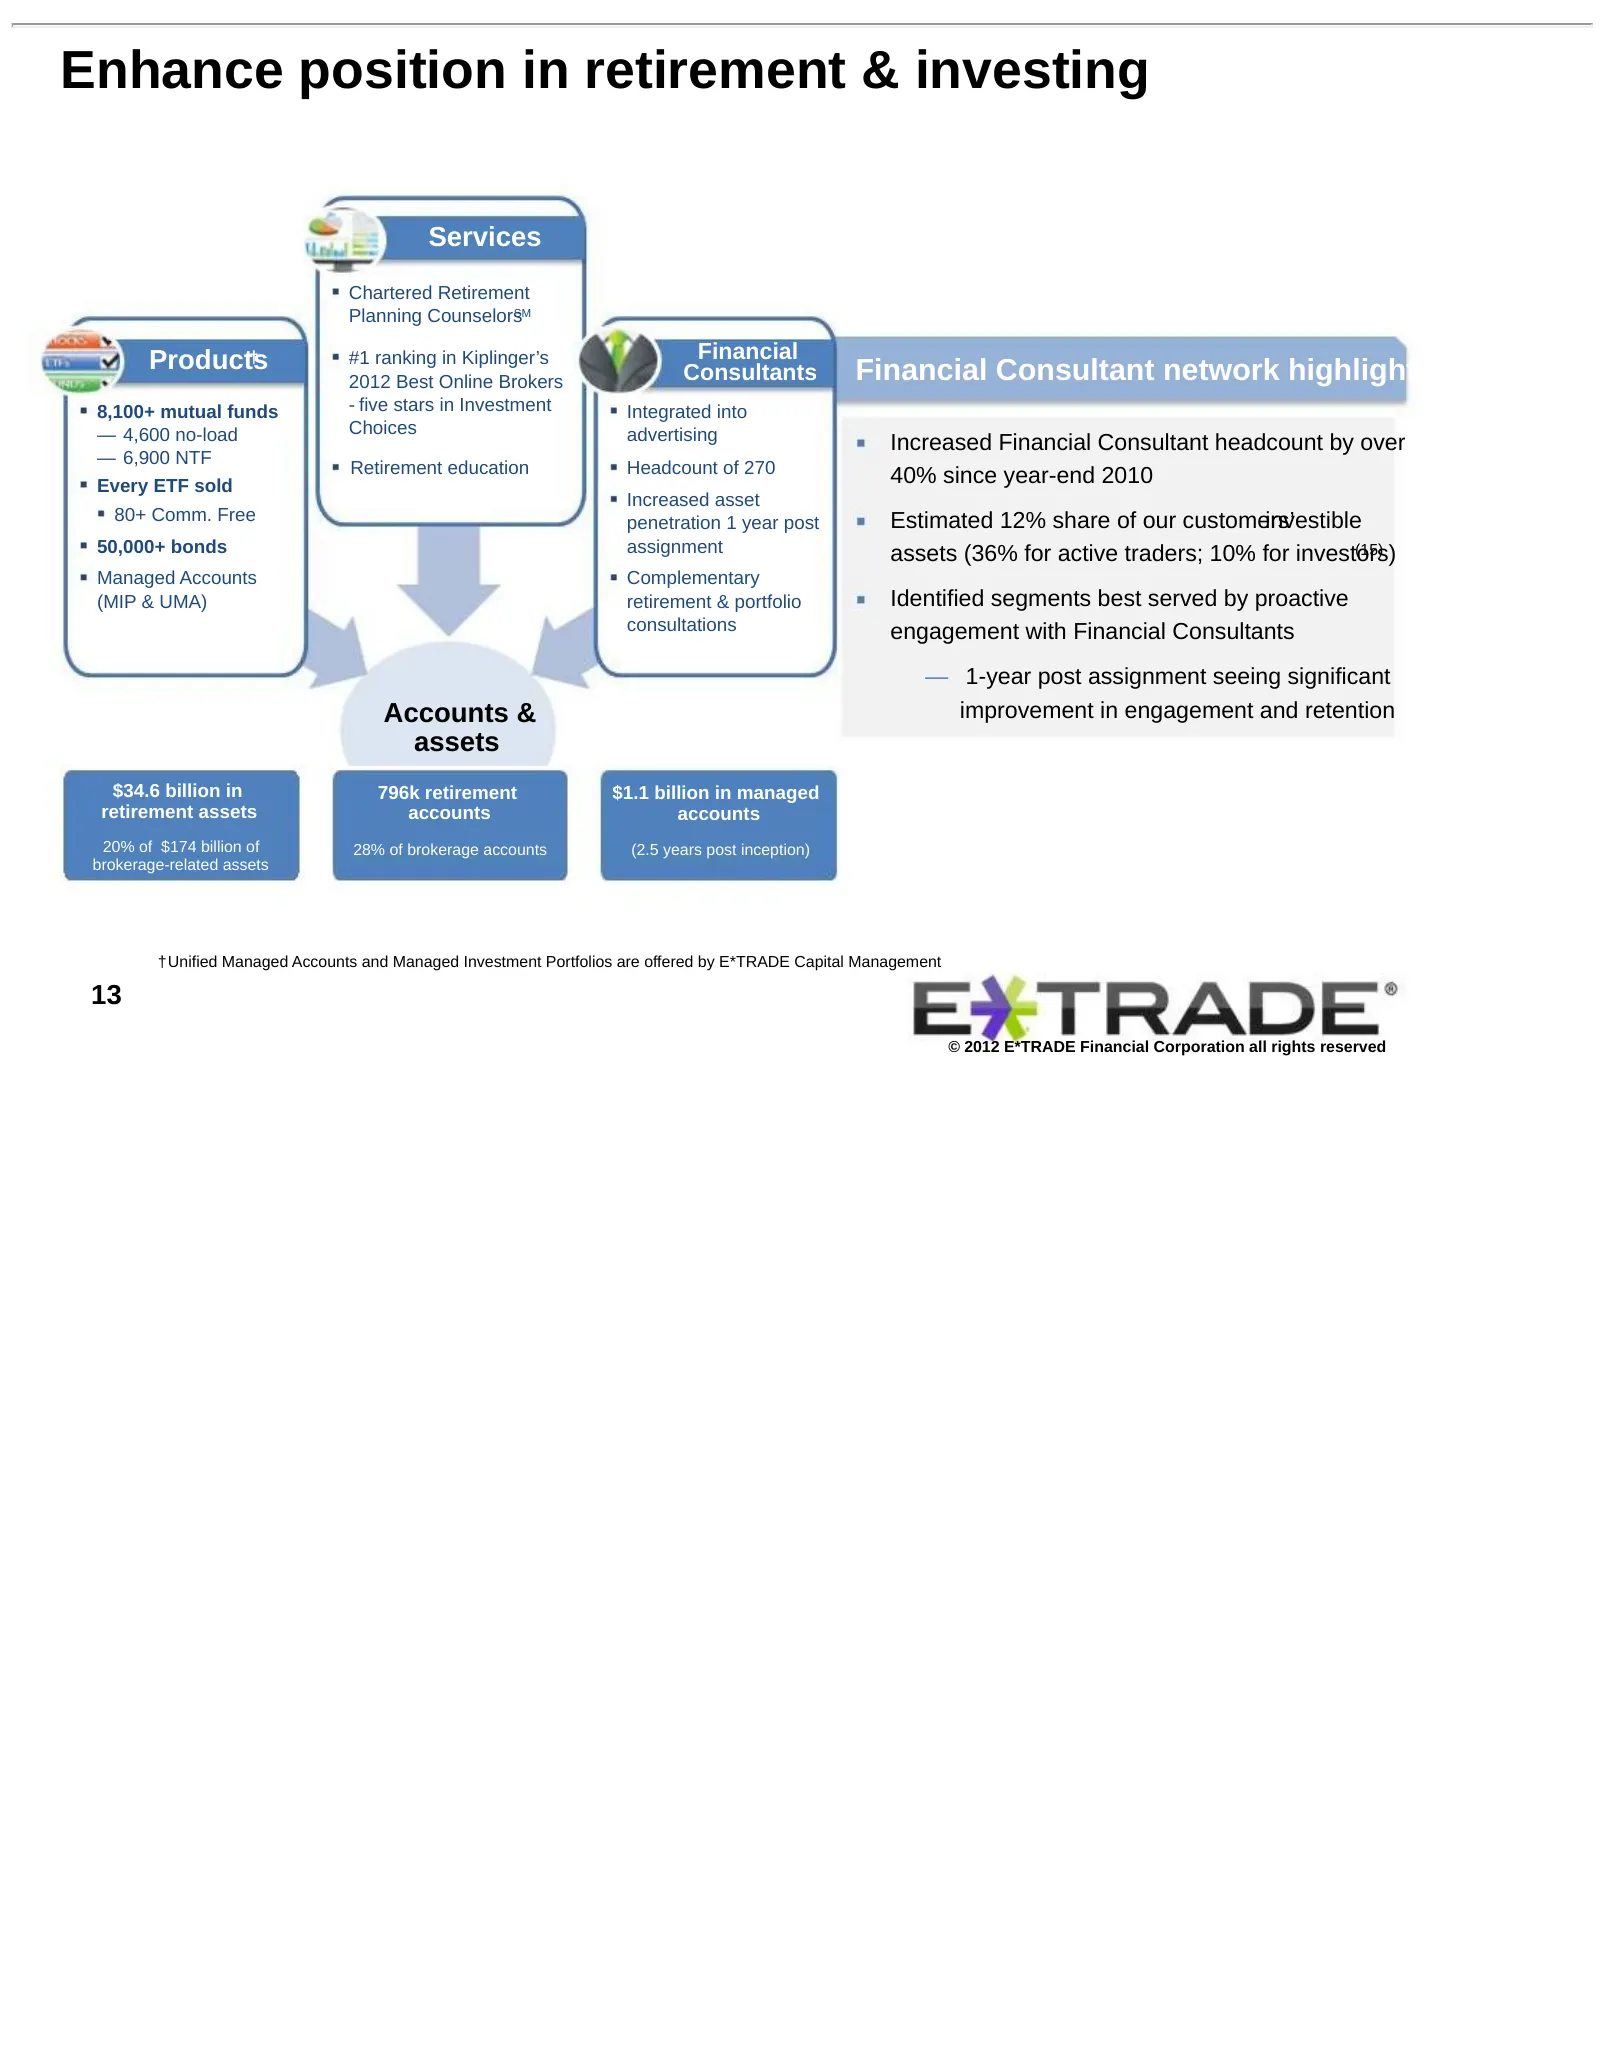
Enhance position in retirement & investing Services Chartered Retirement Planning CounselorsSM Products † #1 ranking in Kiplinger’s Financial 2012 Best Online Brokers Consultants Financial Consultant network highlights 8,100+ mutual funds - five stars in Investment Integrated into — 4,600 no-load Ch
Slide 14: Capitalize on value of complementary brokerage businesses
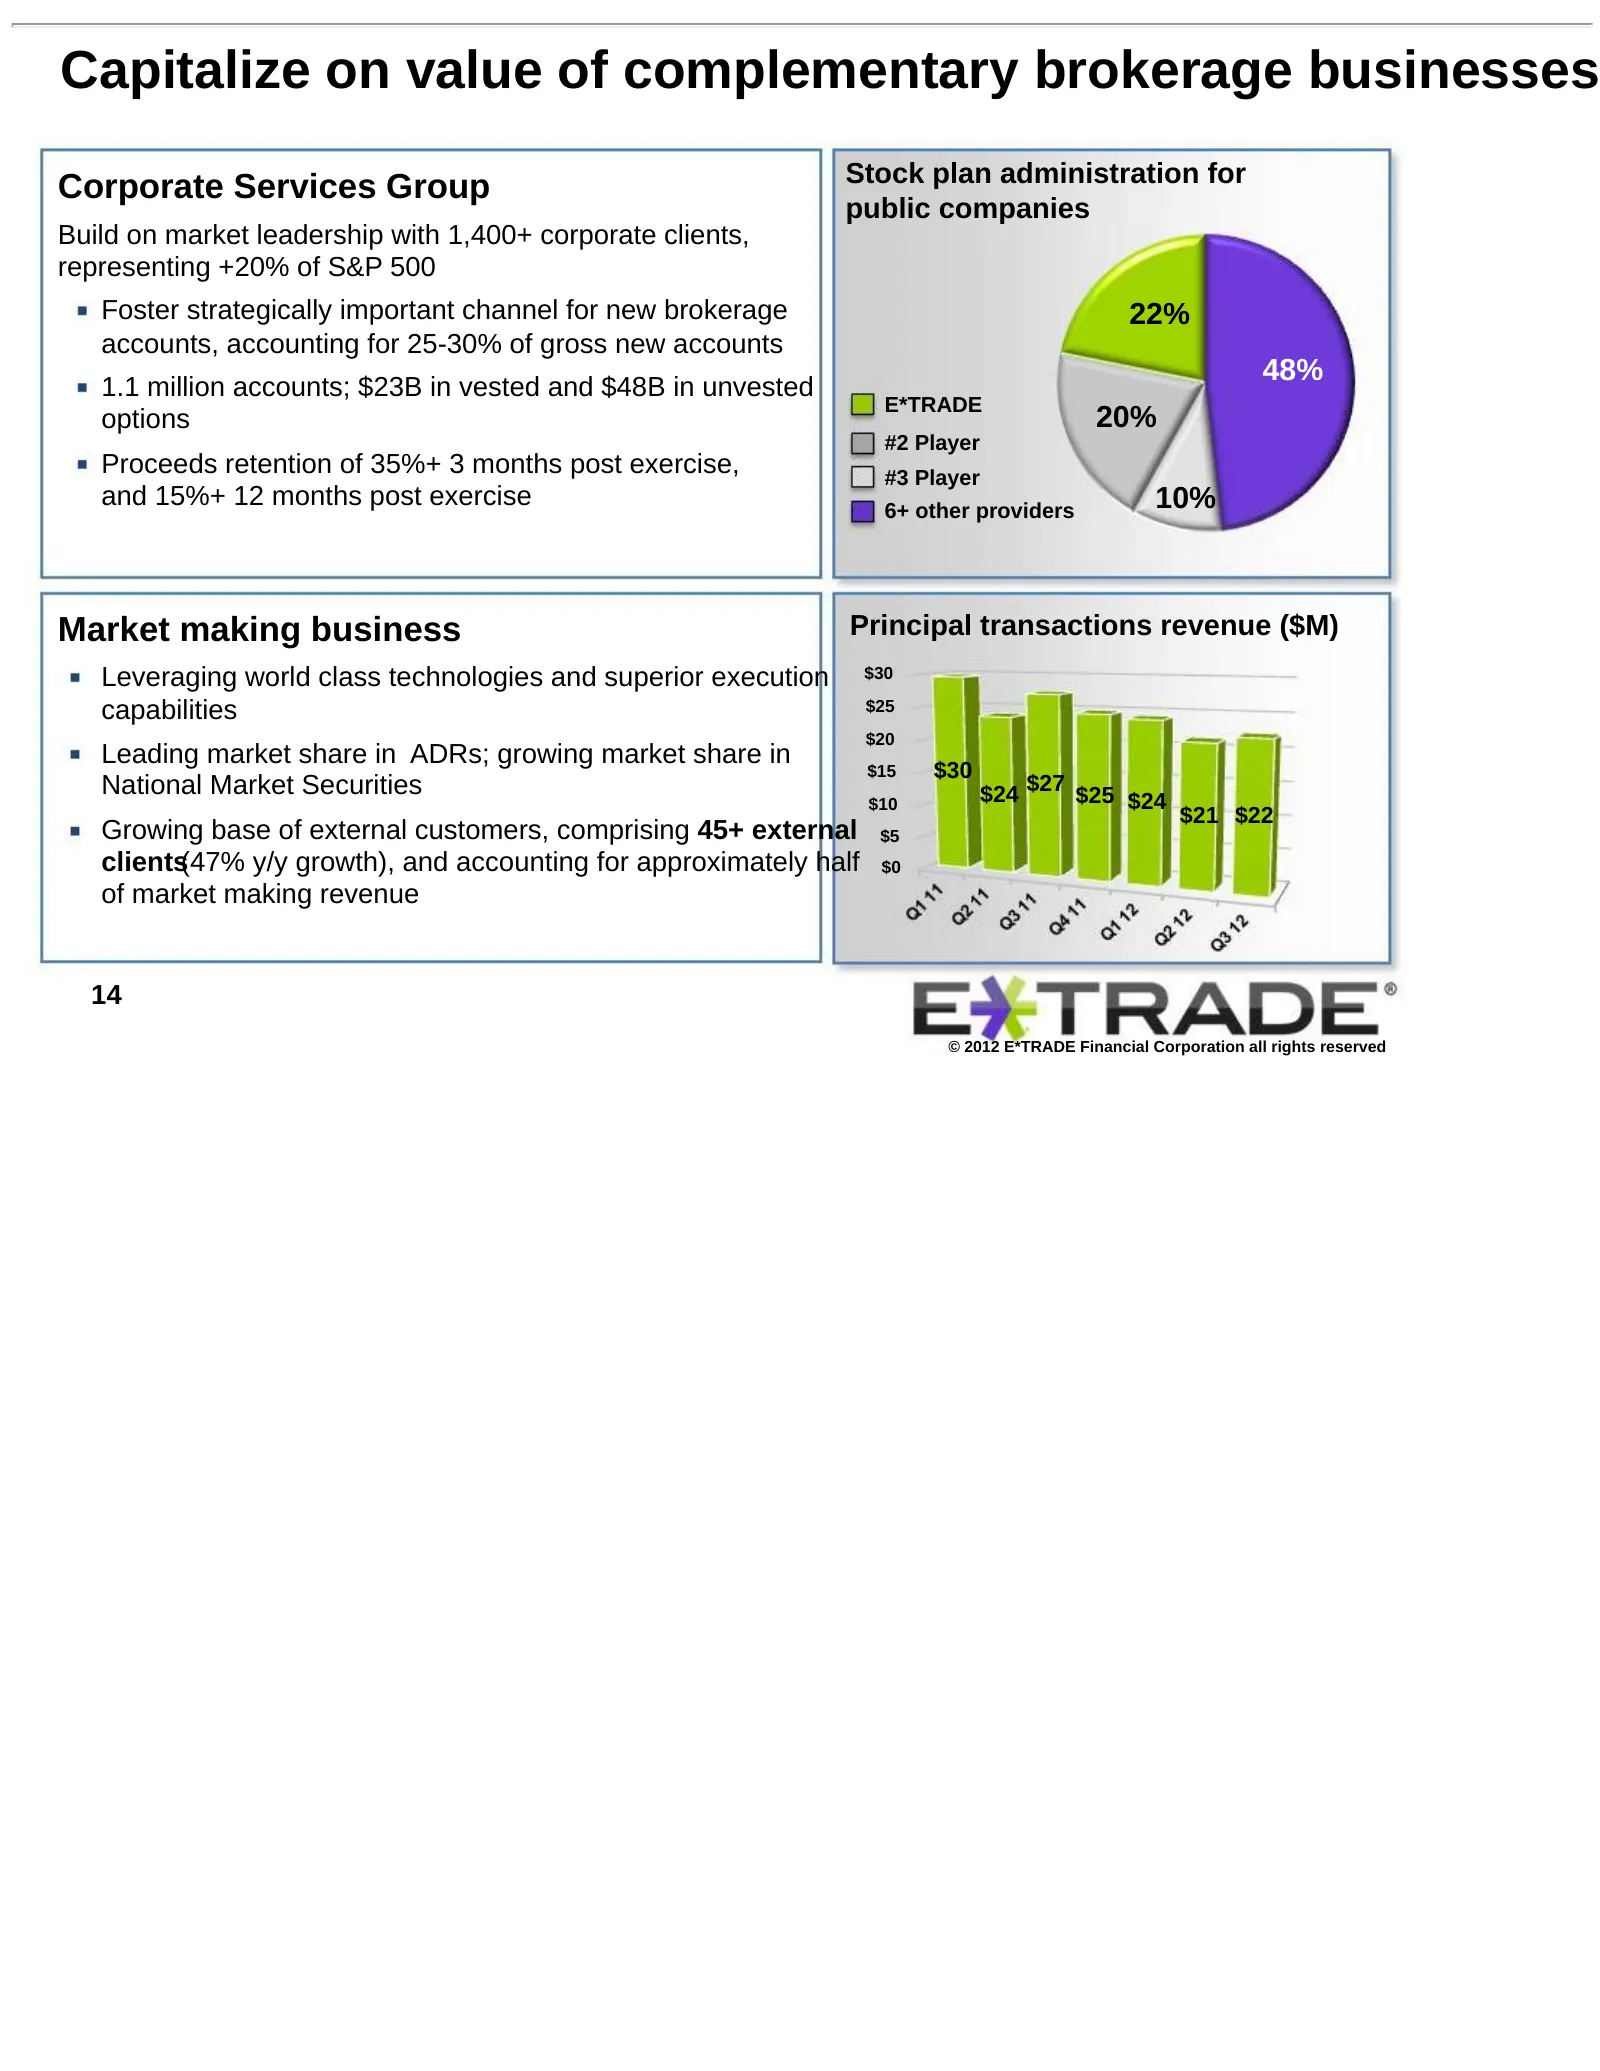
Capitalize on value of complementary brokerage businesses Stock plan administration for Corporate Services Group public companies Build on market leadership with 1,400+ corporate clients, representing +20% of S&P 500 Foster strategically important channel for new brokerage 22% accounts, accounting f
Slide 15: Favorable mix shift in assets and liabilities
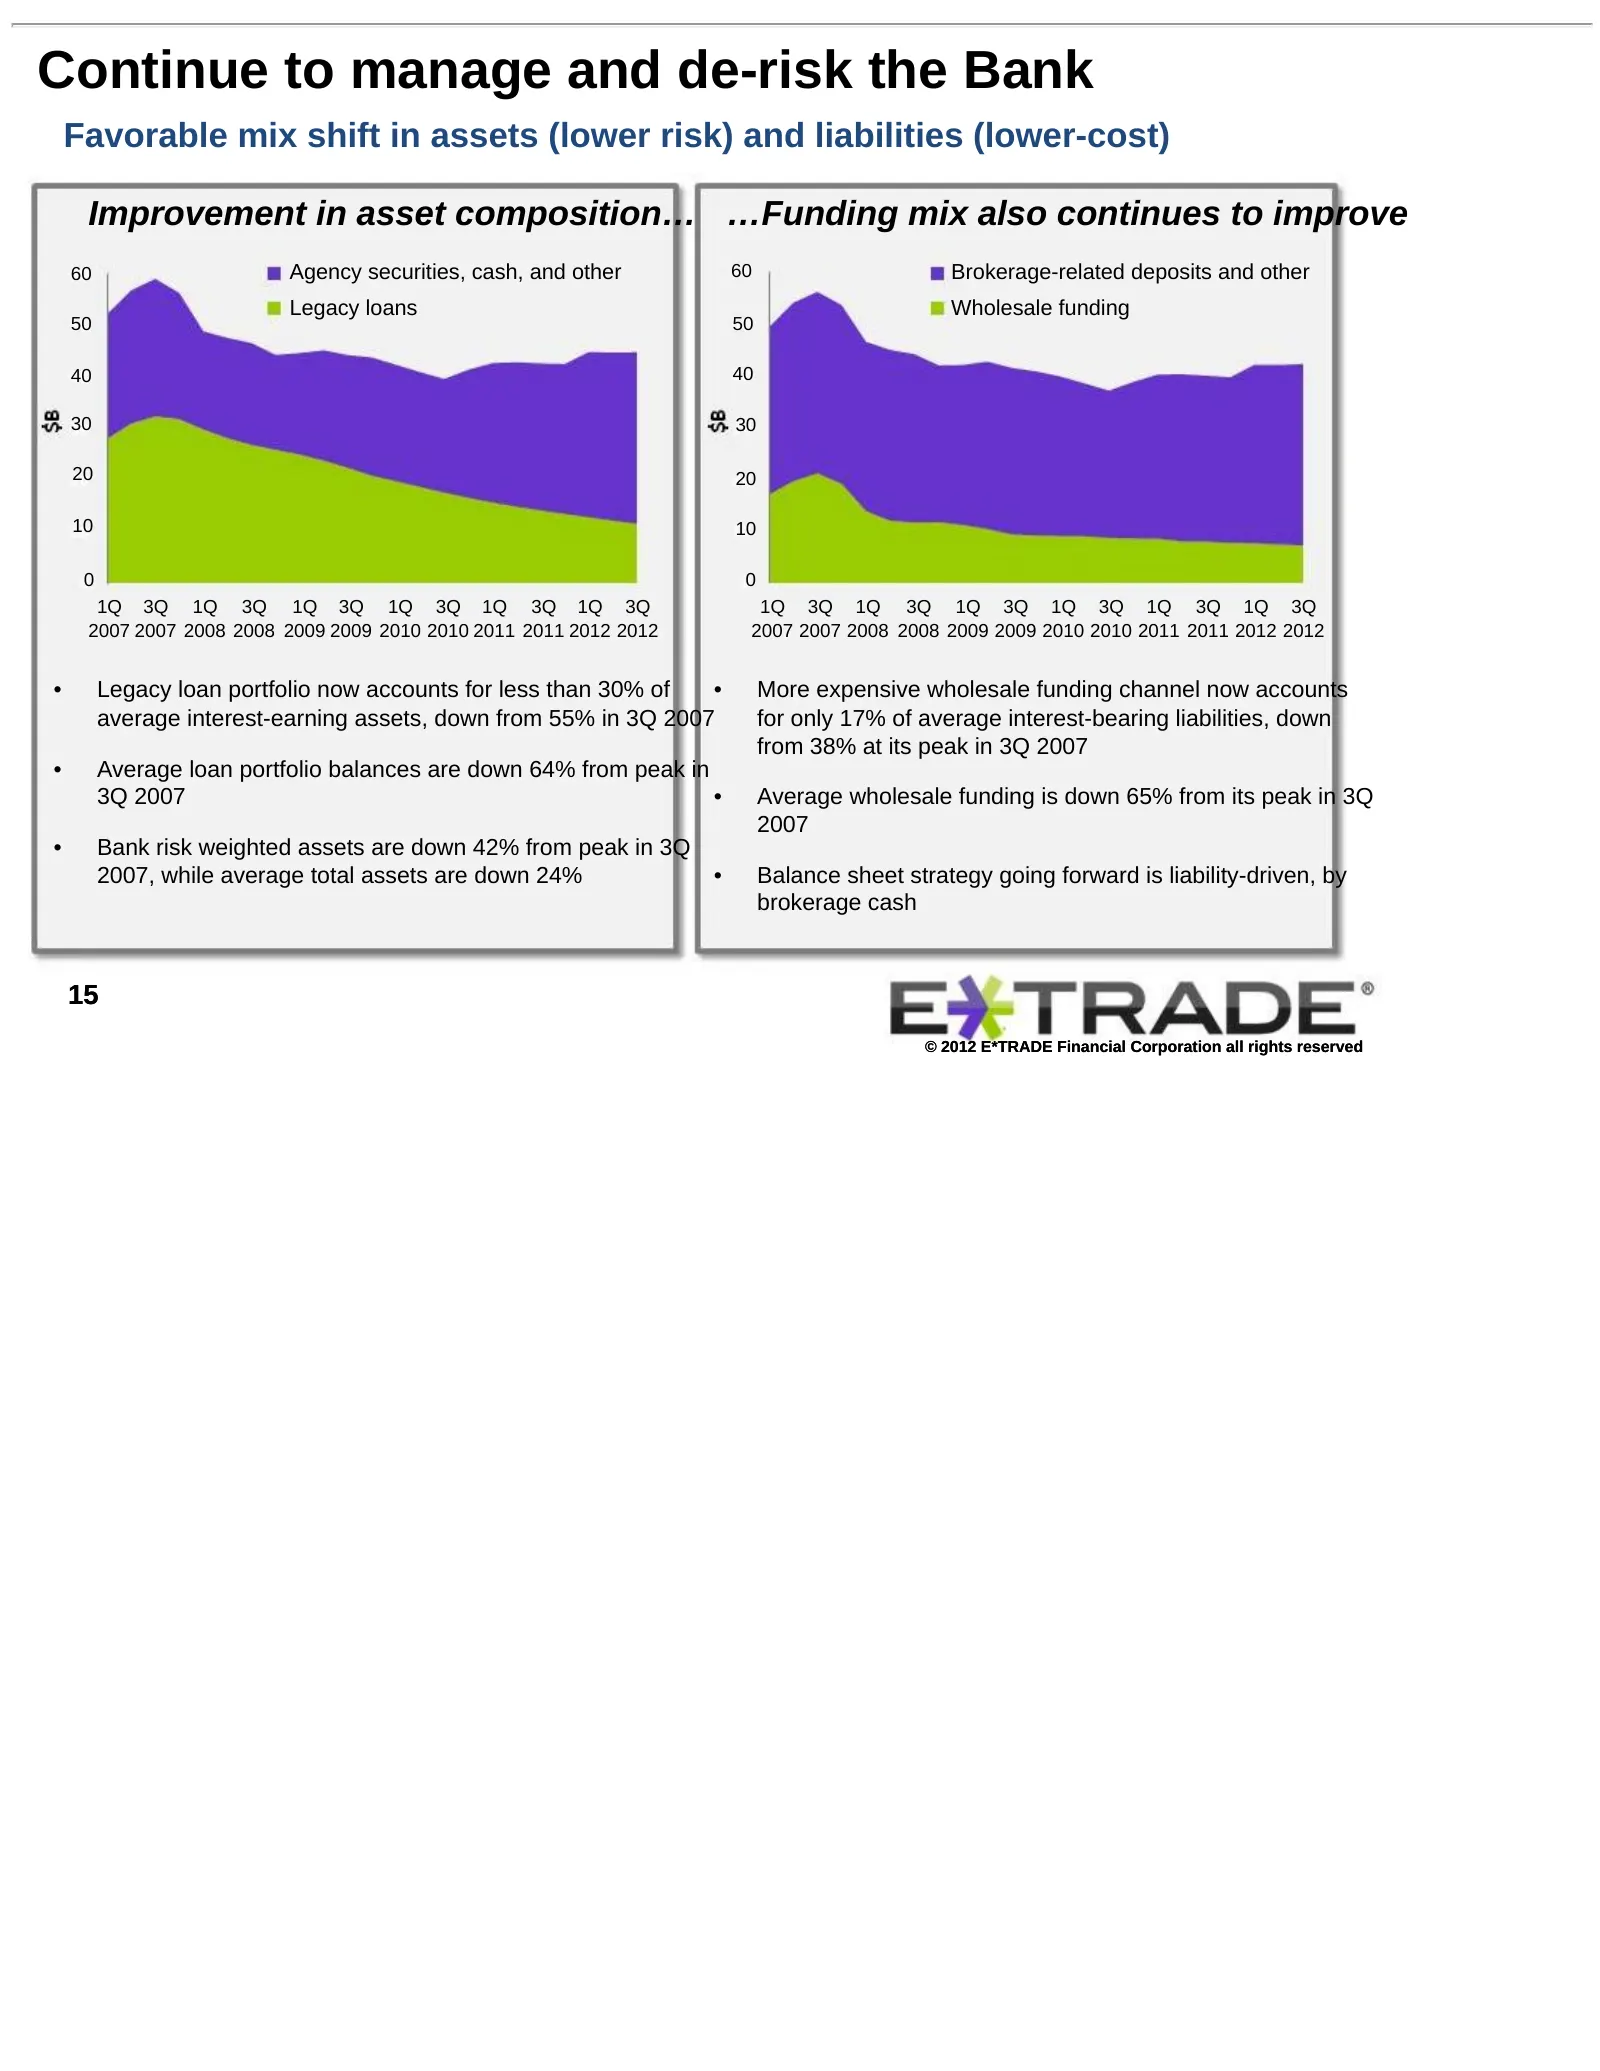
Continue to manage and de-risk the Bank Favorable mix shift in assets (lower risk) and liabilities (lower-cost) Improvement in asset composition… …Funding mix also continues to improve 60 Agency securities, cash, and other 60 Brokerage-related deposits and other Legacy loans Wholesale funding 50 50
Slide 16: Mitigate credit losses on legacy loan portfolio
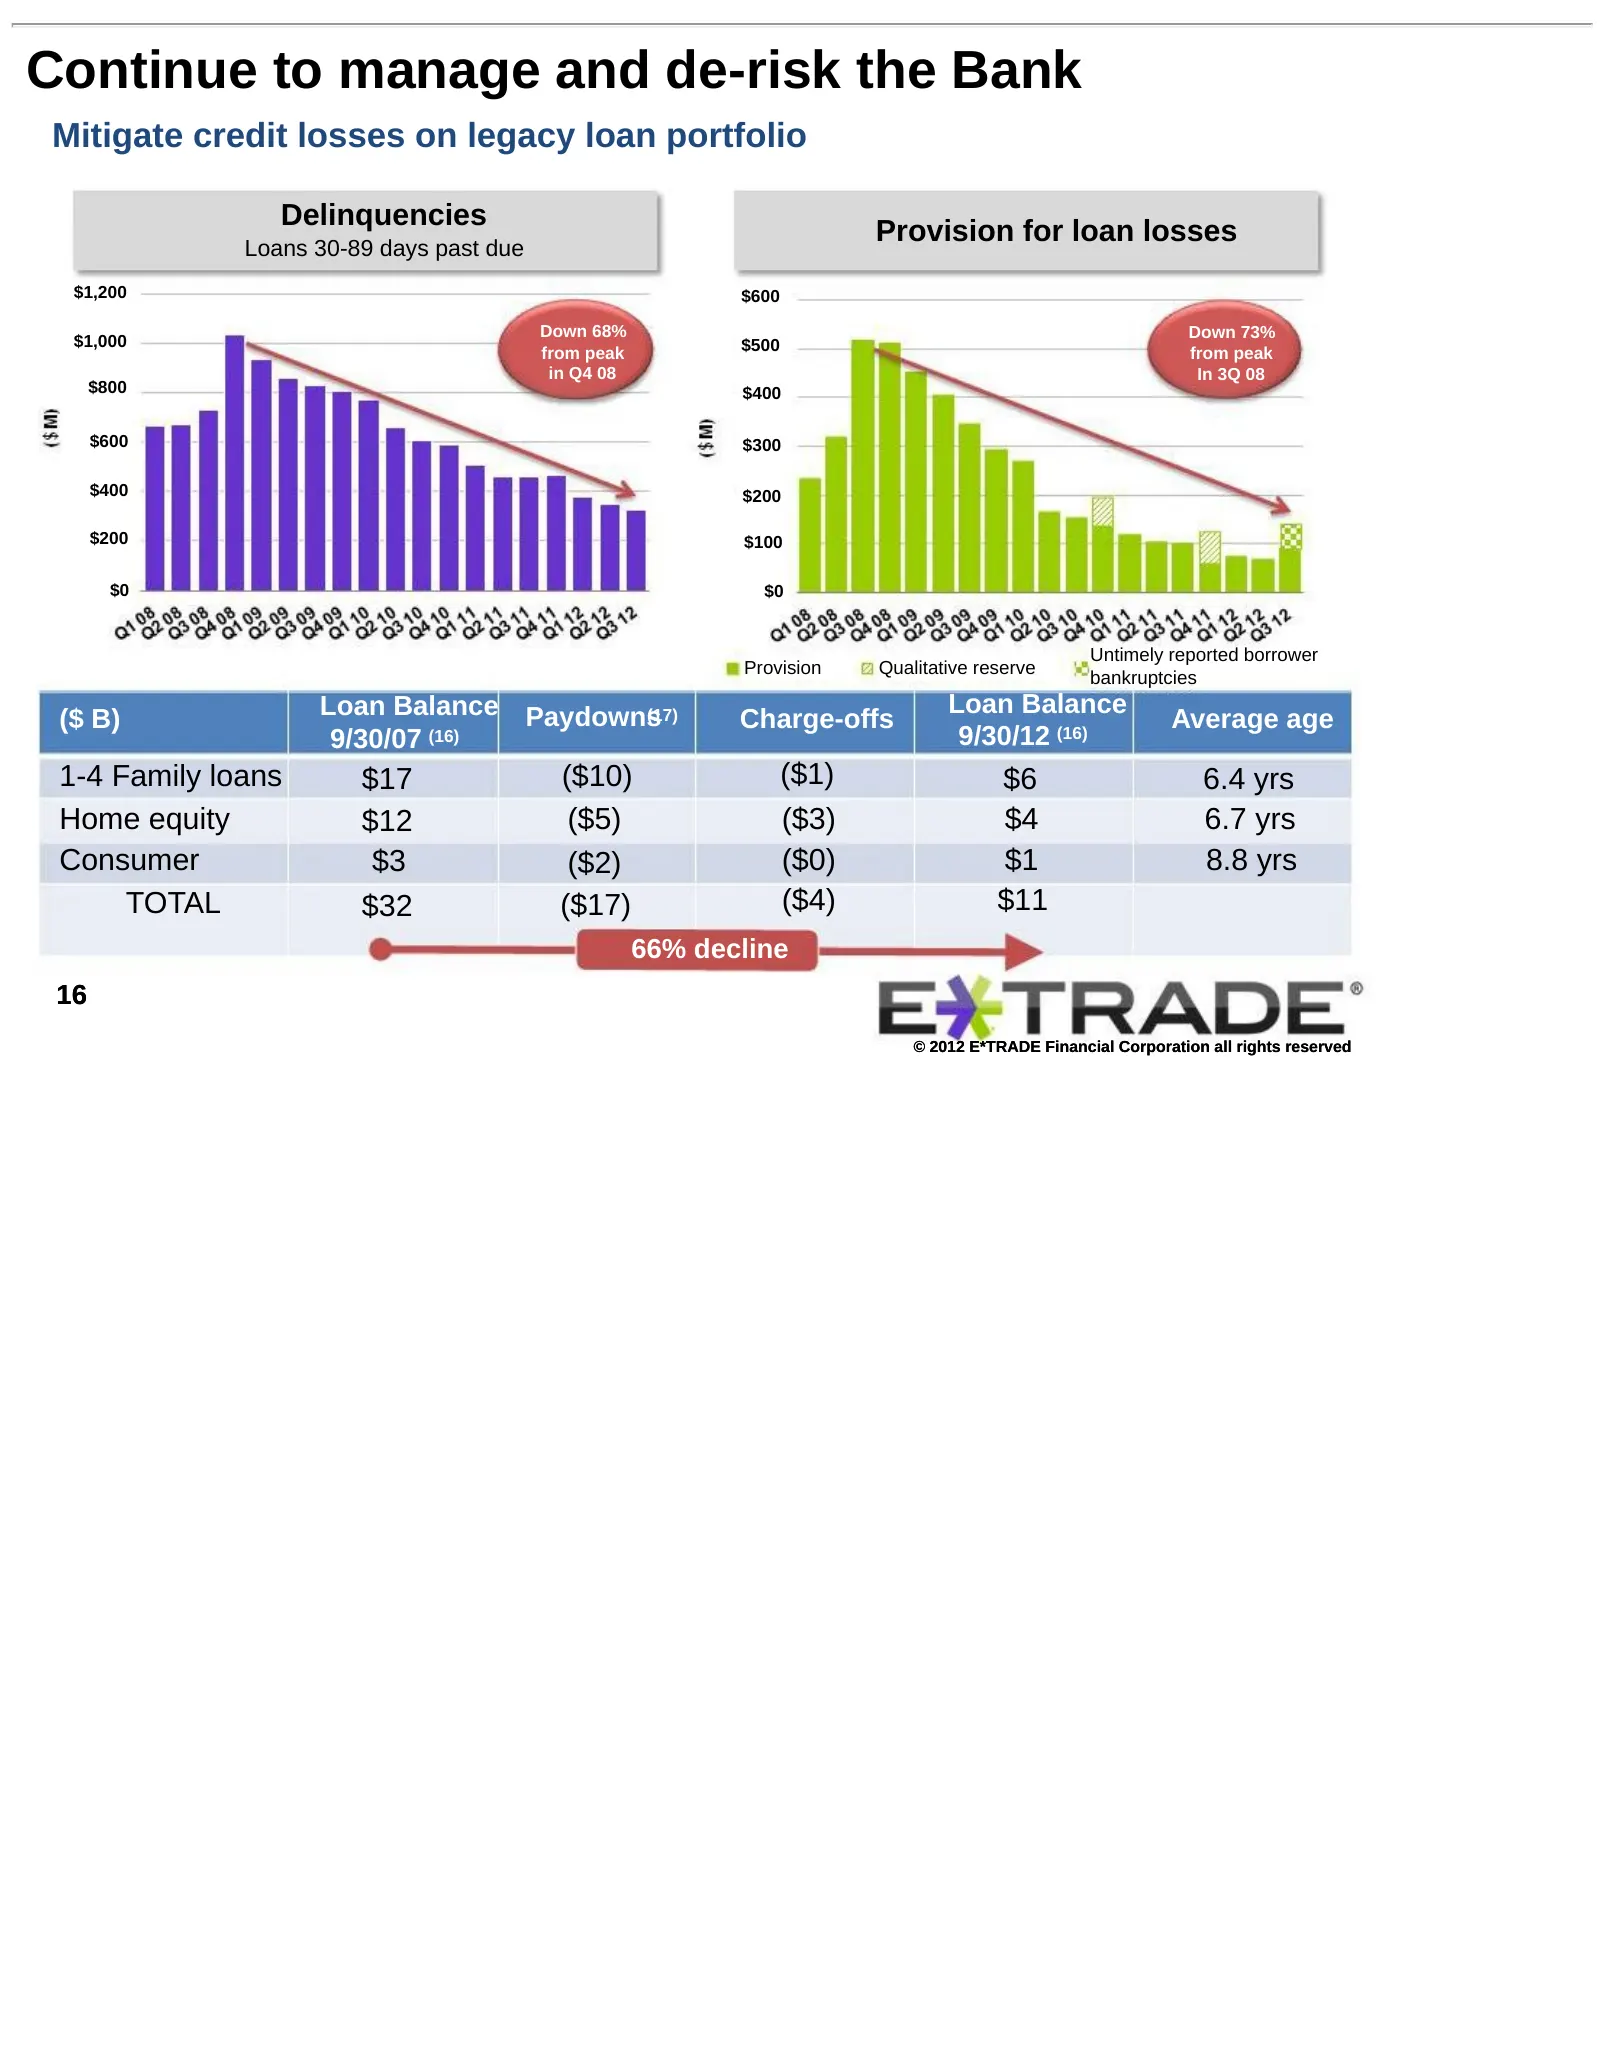
Continue to manage and de-risk the Bank Mitigate credit losses on legacy loan portfolio Delinquencies Loans 30-89 days past due Provision for loan losses $1,200 $600 Down 68% Down 73% $1,000 $500 from peak from peak in Q4 08 In 3Q 08 $800 $400 $600 $300 $400 $200 $200 $100 $0 $0 Untimely reported bo
Slide 17: Components of allowance for loan losses
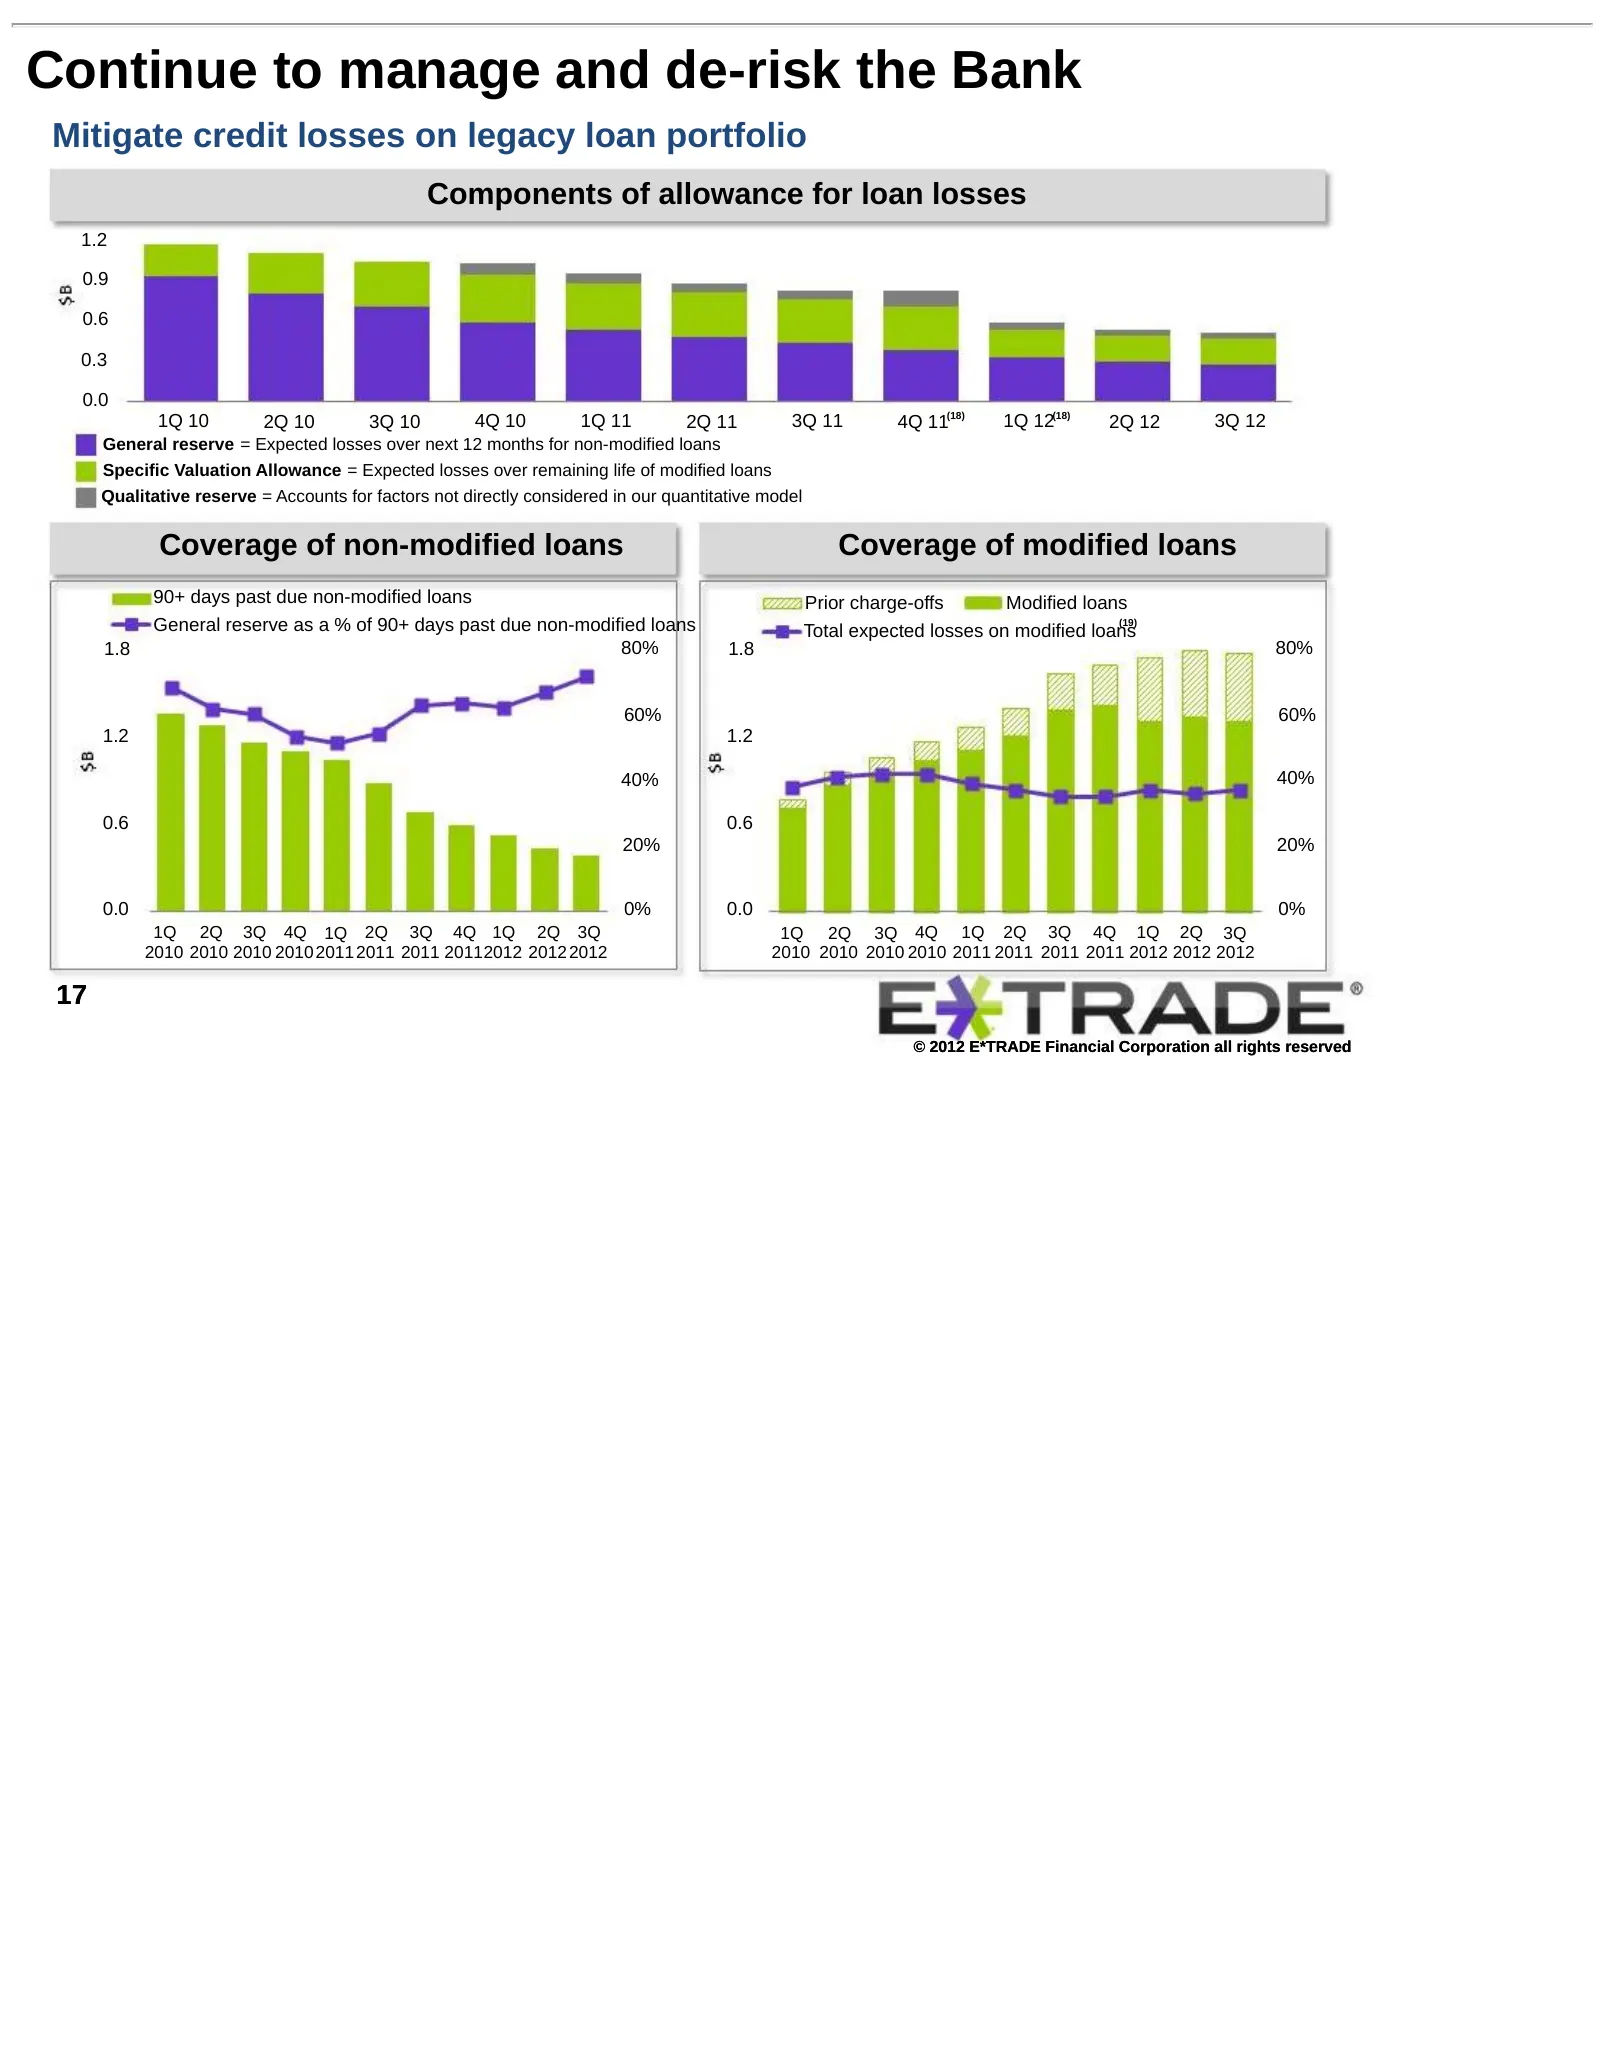
Continue to manage and de-risk the Bank Mitigate credit losses on legacy loan portfolio Components of allowance for loan losses 1.2 0.9 0.6 0.3 0.0 1Q 10 2Q 10 3Q 10 4Q 10 1Q 11 2Q 11 3Q 11 4Q 11(18) 1Q 12(18) 2Q 12 3Q 12 General reserve = Expected losses over next 12 months for non-modified loans S
Slide 18: Optimize value of customer deposits
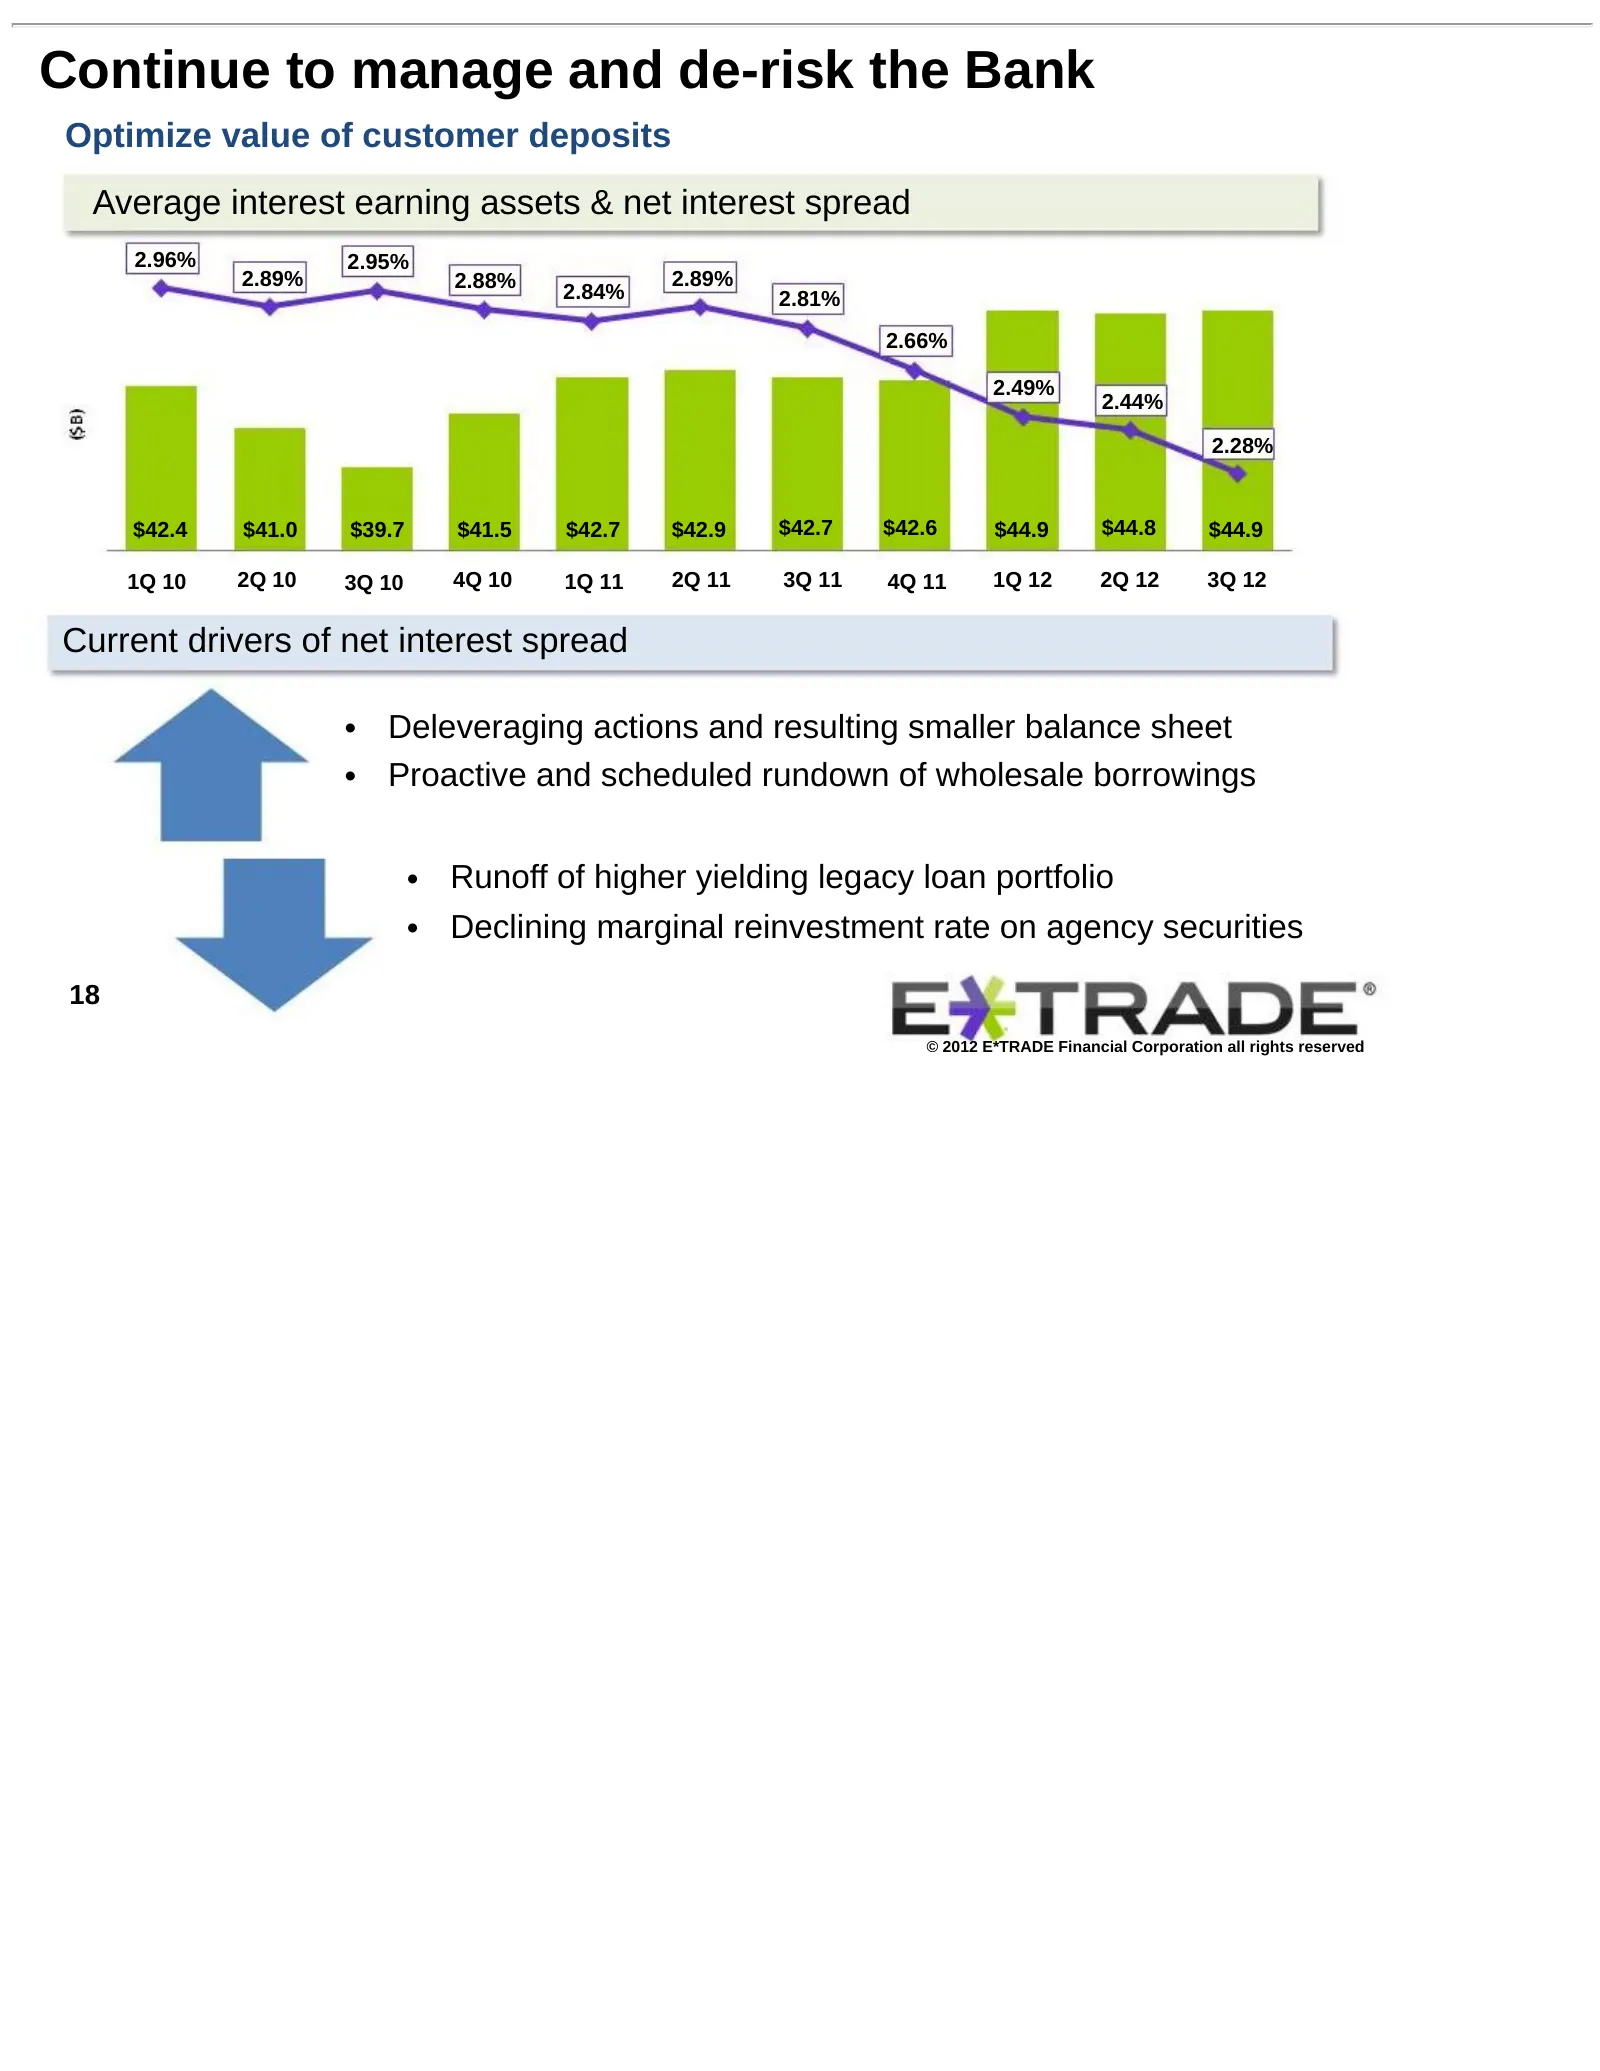
Continue to manage and de-risk the Bank Optimize value of customer deposits Average interest earning assets & net interest spread 2.96% 2.95% 2.89% 2.88% 2.89% 2.84% 2.81% 2.66% 2.49% 2.44% 2.28% $42.4 $41.0 $39.7 $41.5 $42.7 $42.9 $42.7 $42.6 $44.9 $44.8 $44.9 1Q 10 2Q 10 3Q 10 4Q 10 1Q 11 2Q 11 3Q
Slide 19: Visibility into future drivers of net interest spread
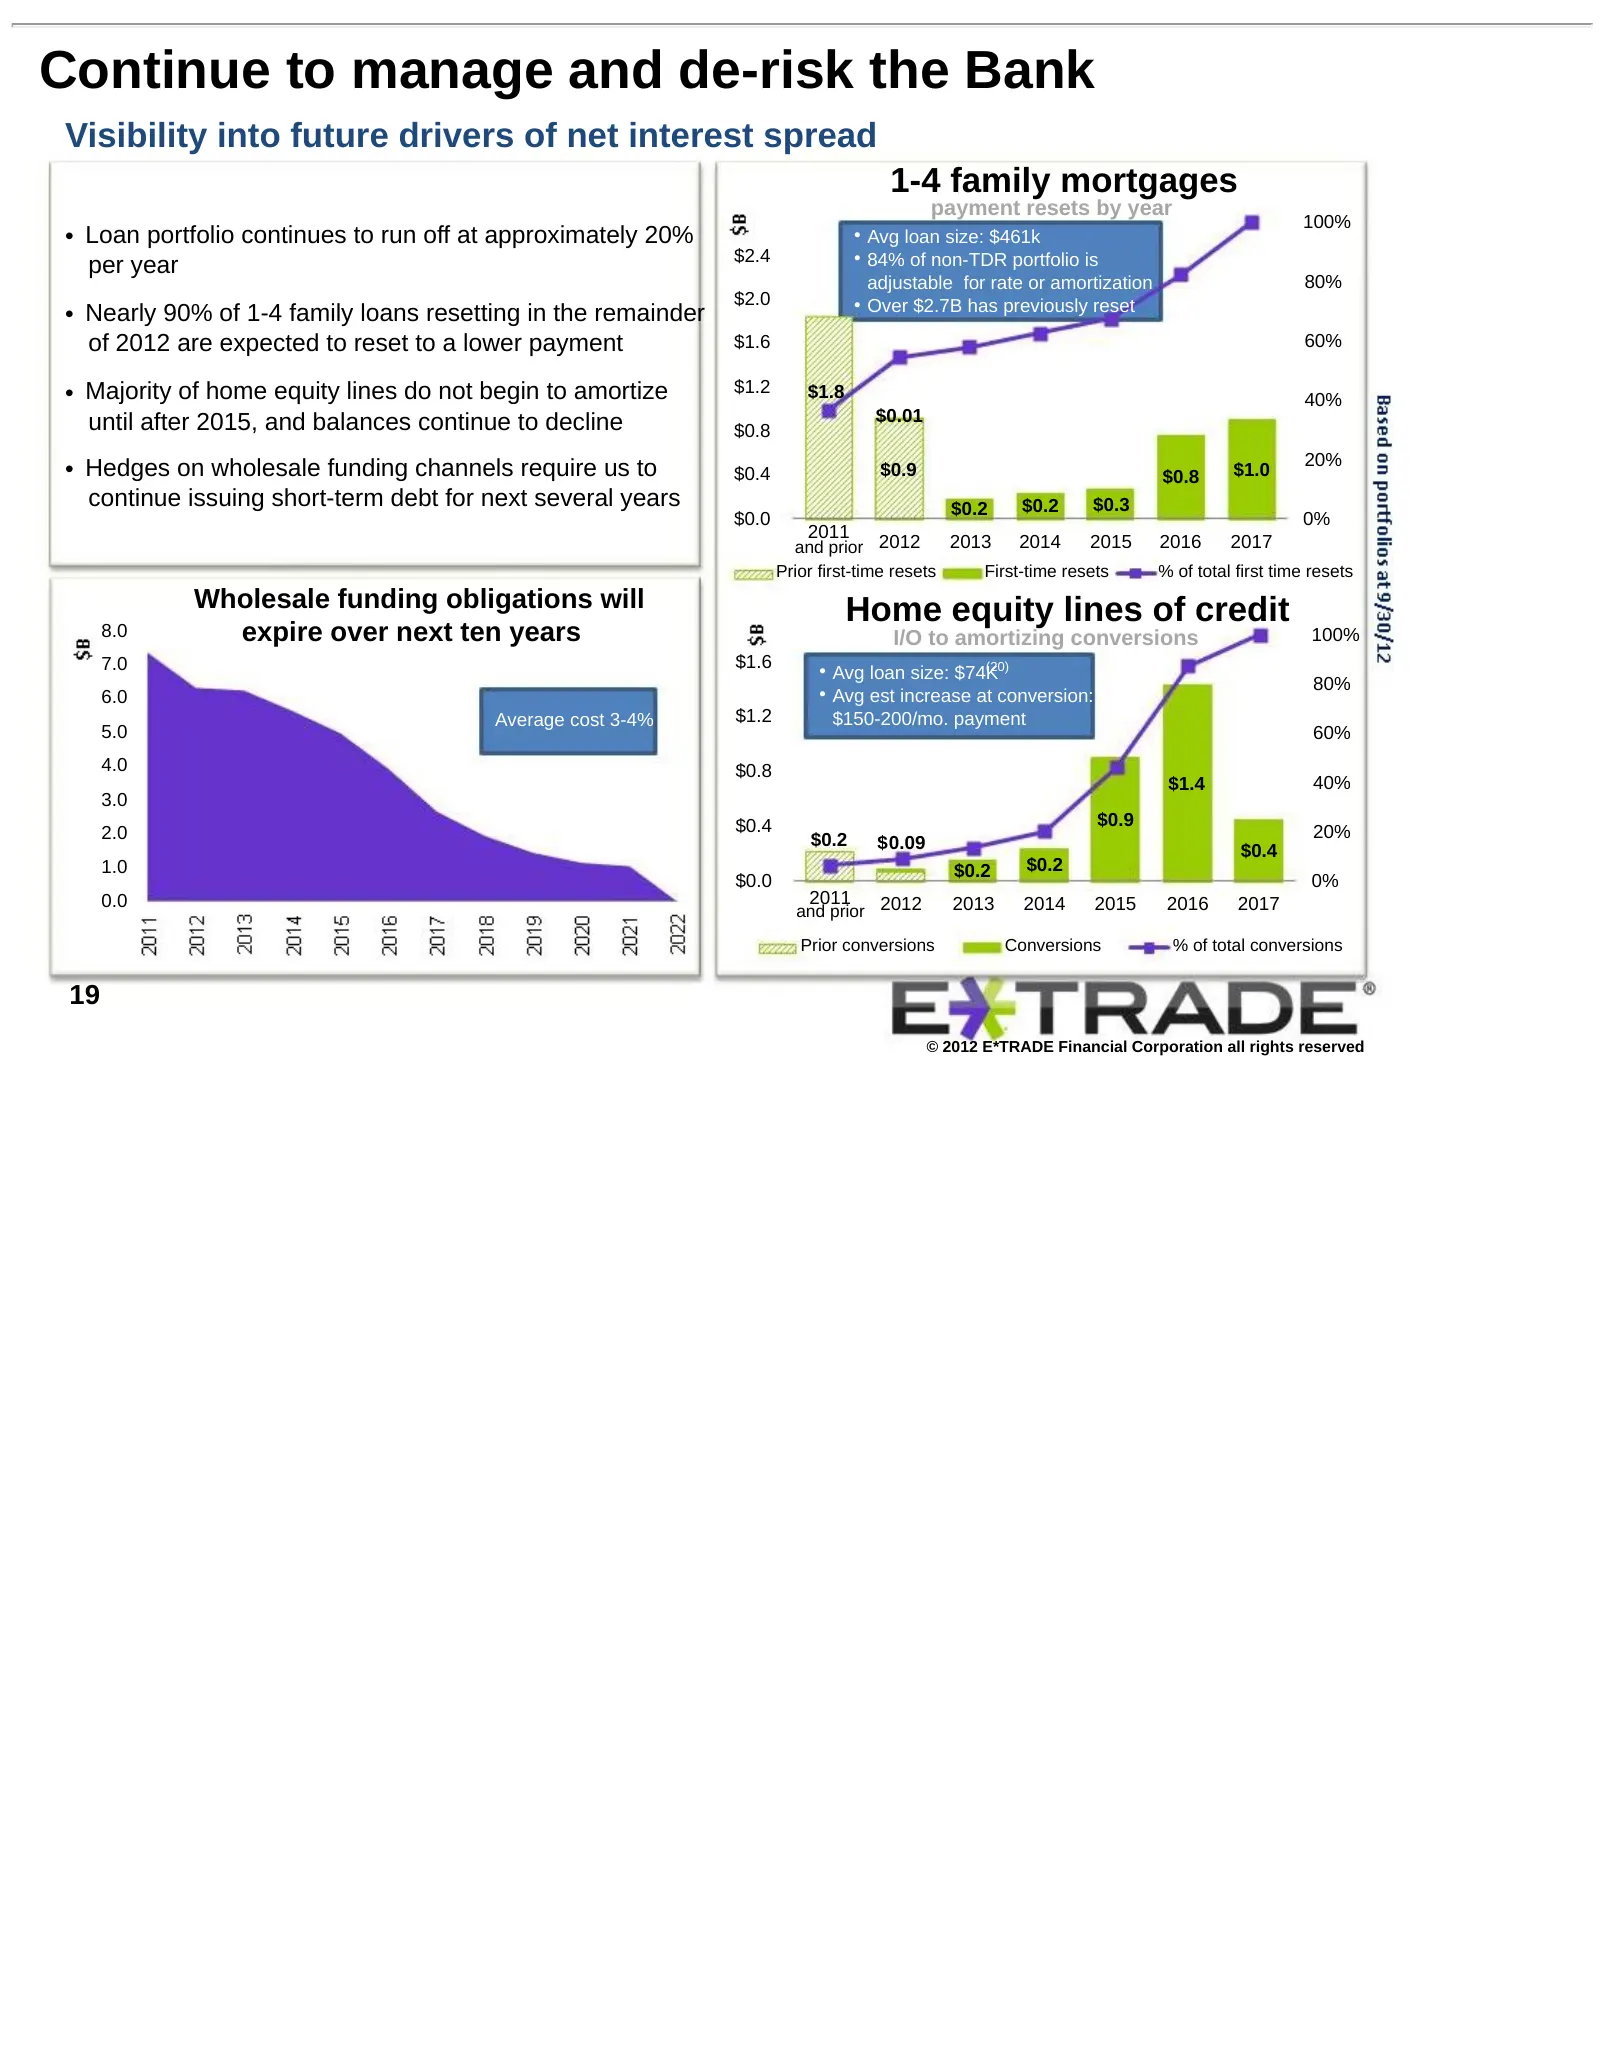
Continue to manage and de-risk the Bank Visibility into future drivers of net interest spread 1-4 family mortgages payment resets by year 100% • Loan portfolio continues to run off at approximately 20% • Avg loan size: $461k $2.4 • 84% of non-TDR portfolio is per year adjustable for rate or amortiza
Slide 20: Challenges and opportunities
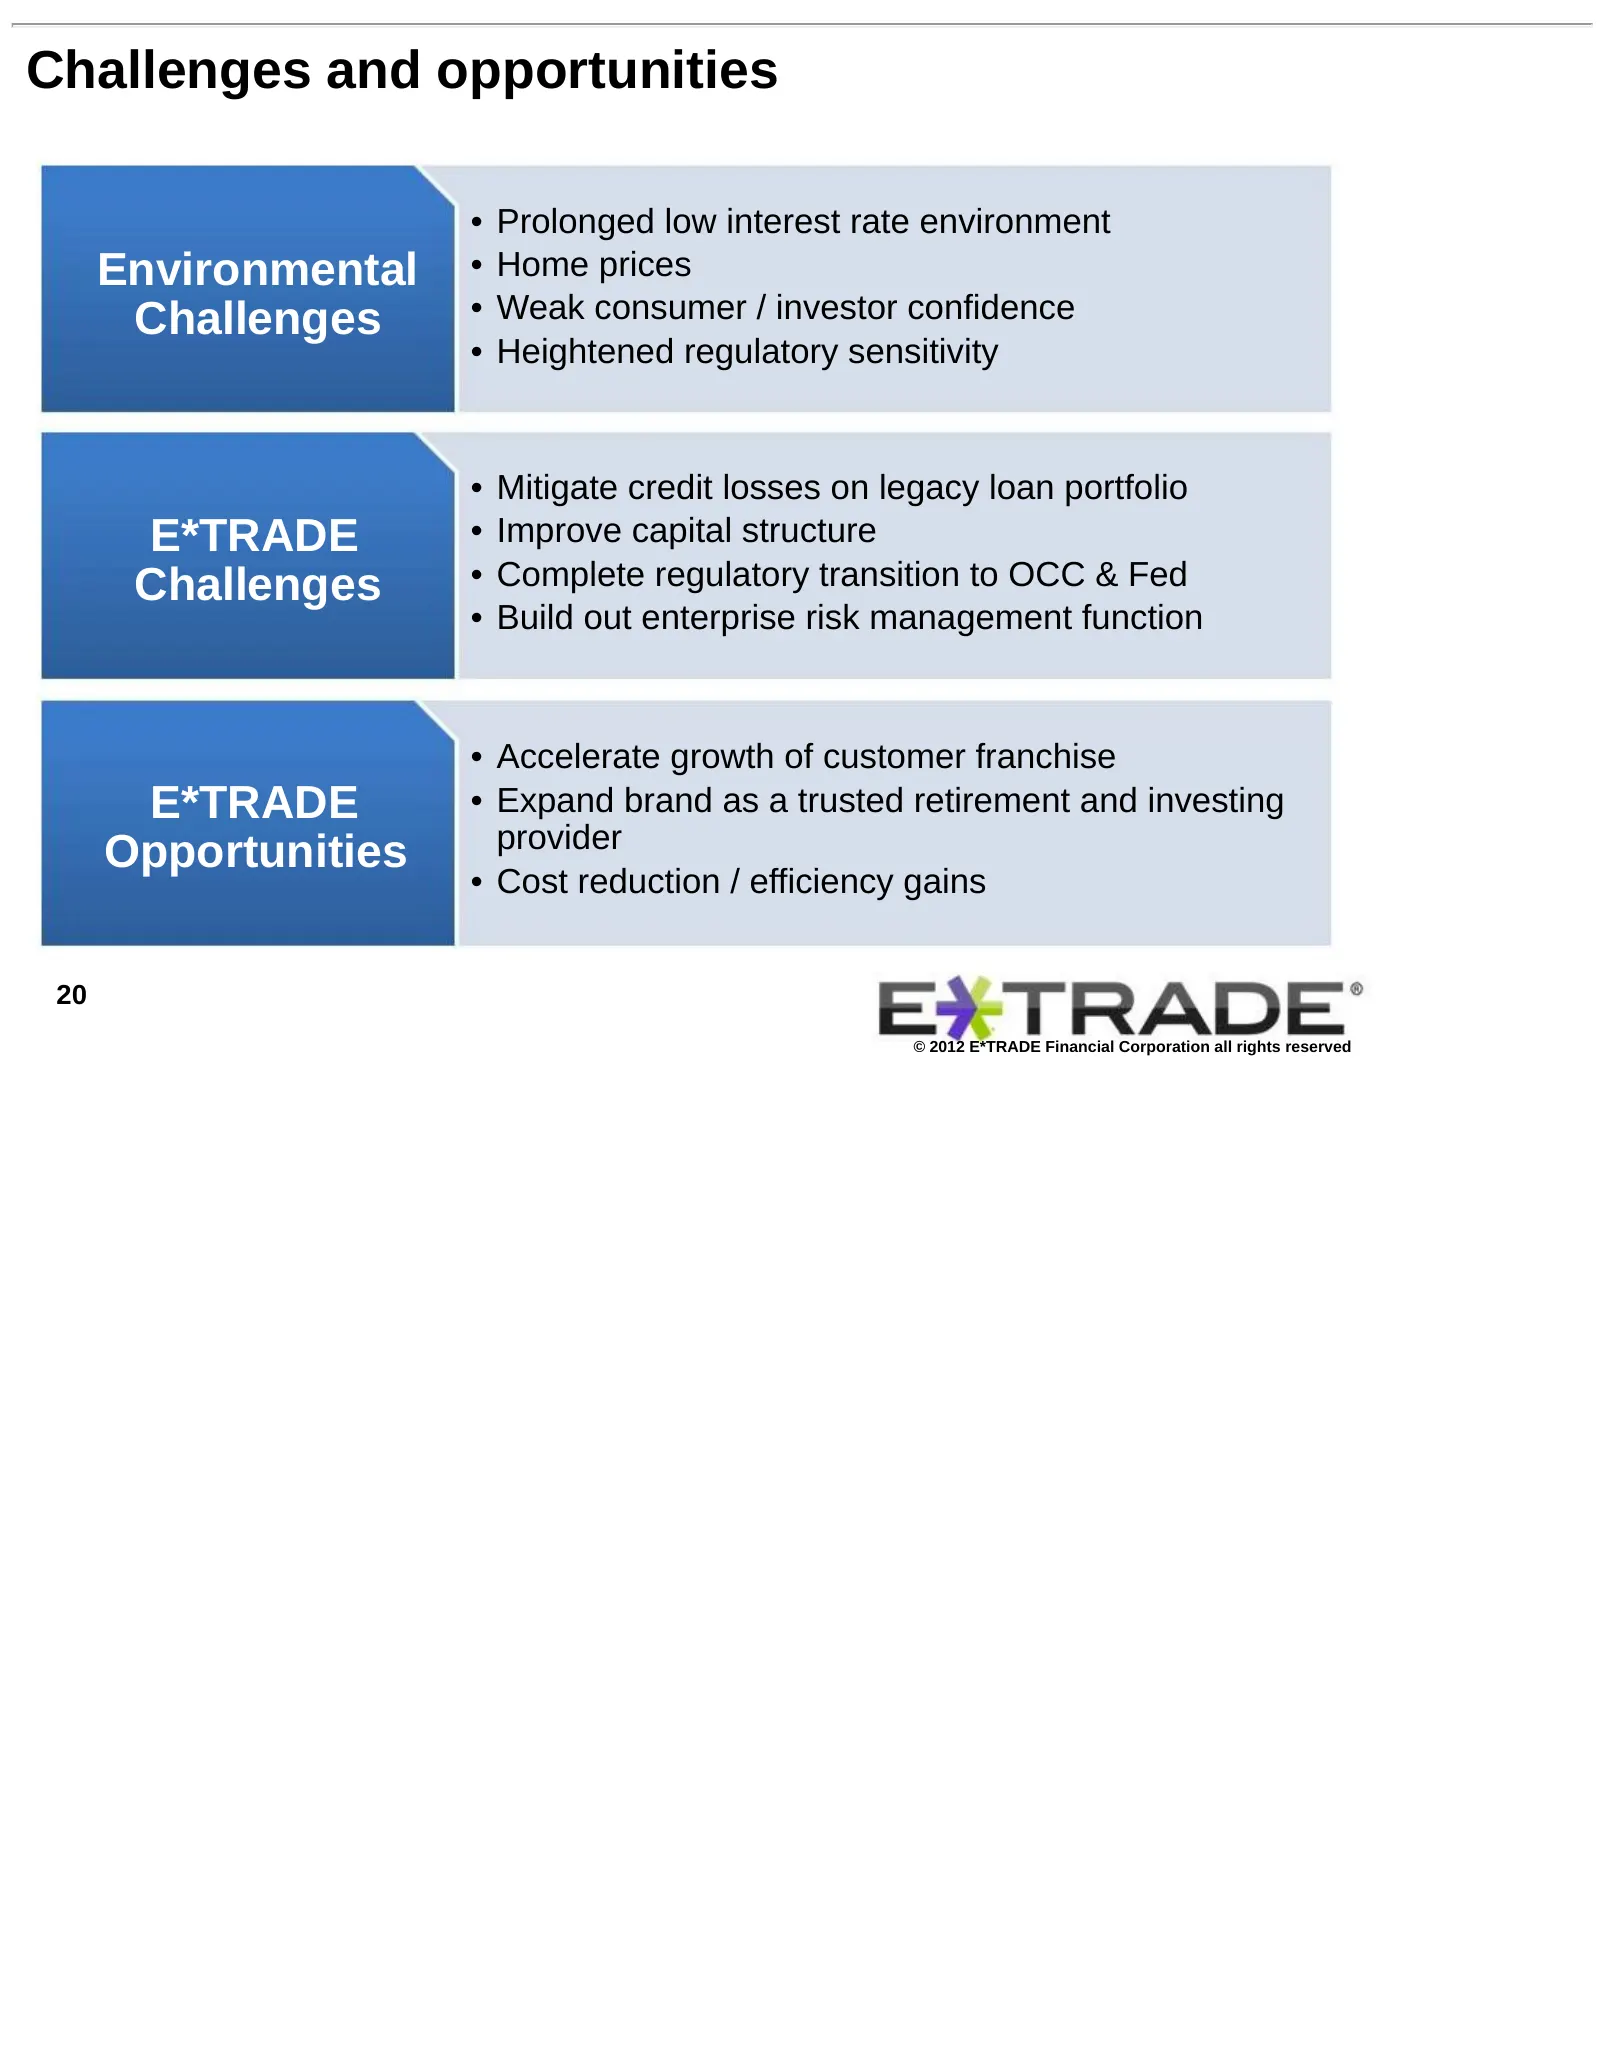
Challenges and opportunities • Prolonged low interest rate environment Environmental • Home prices Challenges • Weak consumer / investor confidence • Heightened regulatory sensitivity • Mitigate credit losses on legacy loan portfolio E*TRADE • Improve capital structure Challenges • Complete regulato

Slide 21: E-fTRADE’
E-fTRADE’
Slide 22: Appendix
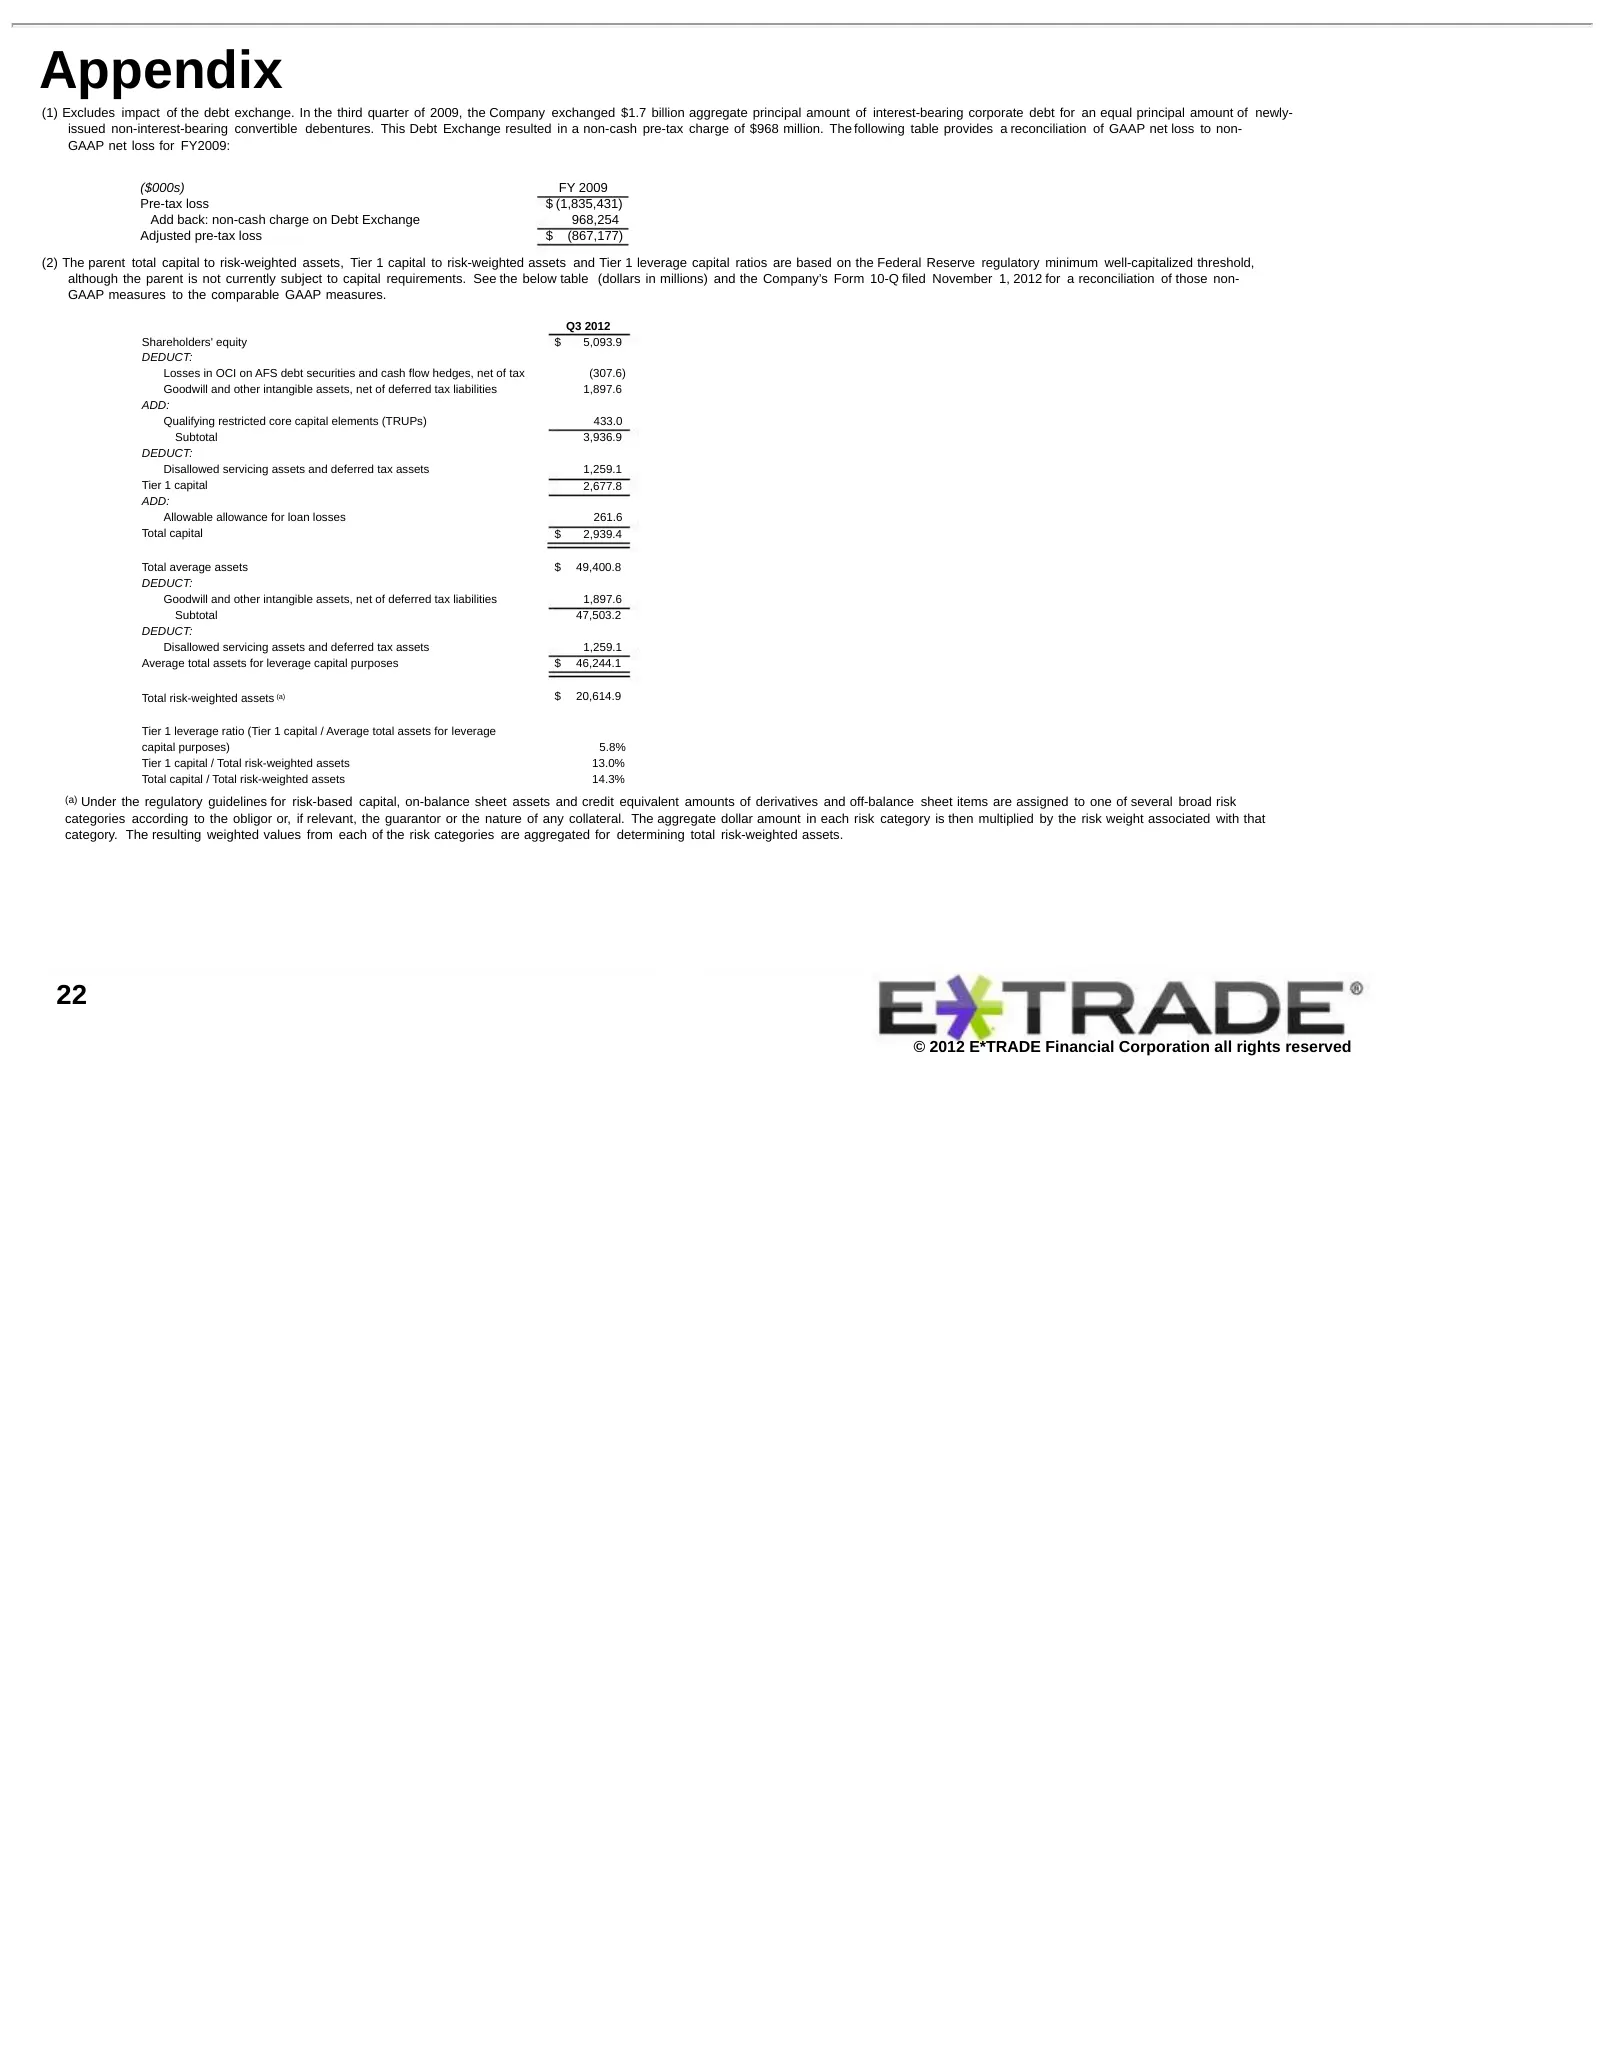
Appendix (1) Excludes impact of the debt exchange. In the third quarter of 2009, the Company exchanged $1.7 billion aggregate principal amount of interest-bearing corporate debt for an equal principal amount of newly- issued non-interest-bearing convertible debentures. This Debt Exchange resulted in
Slide 23: Appendix
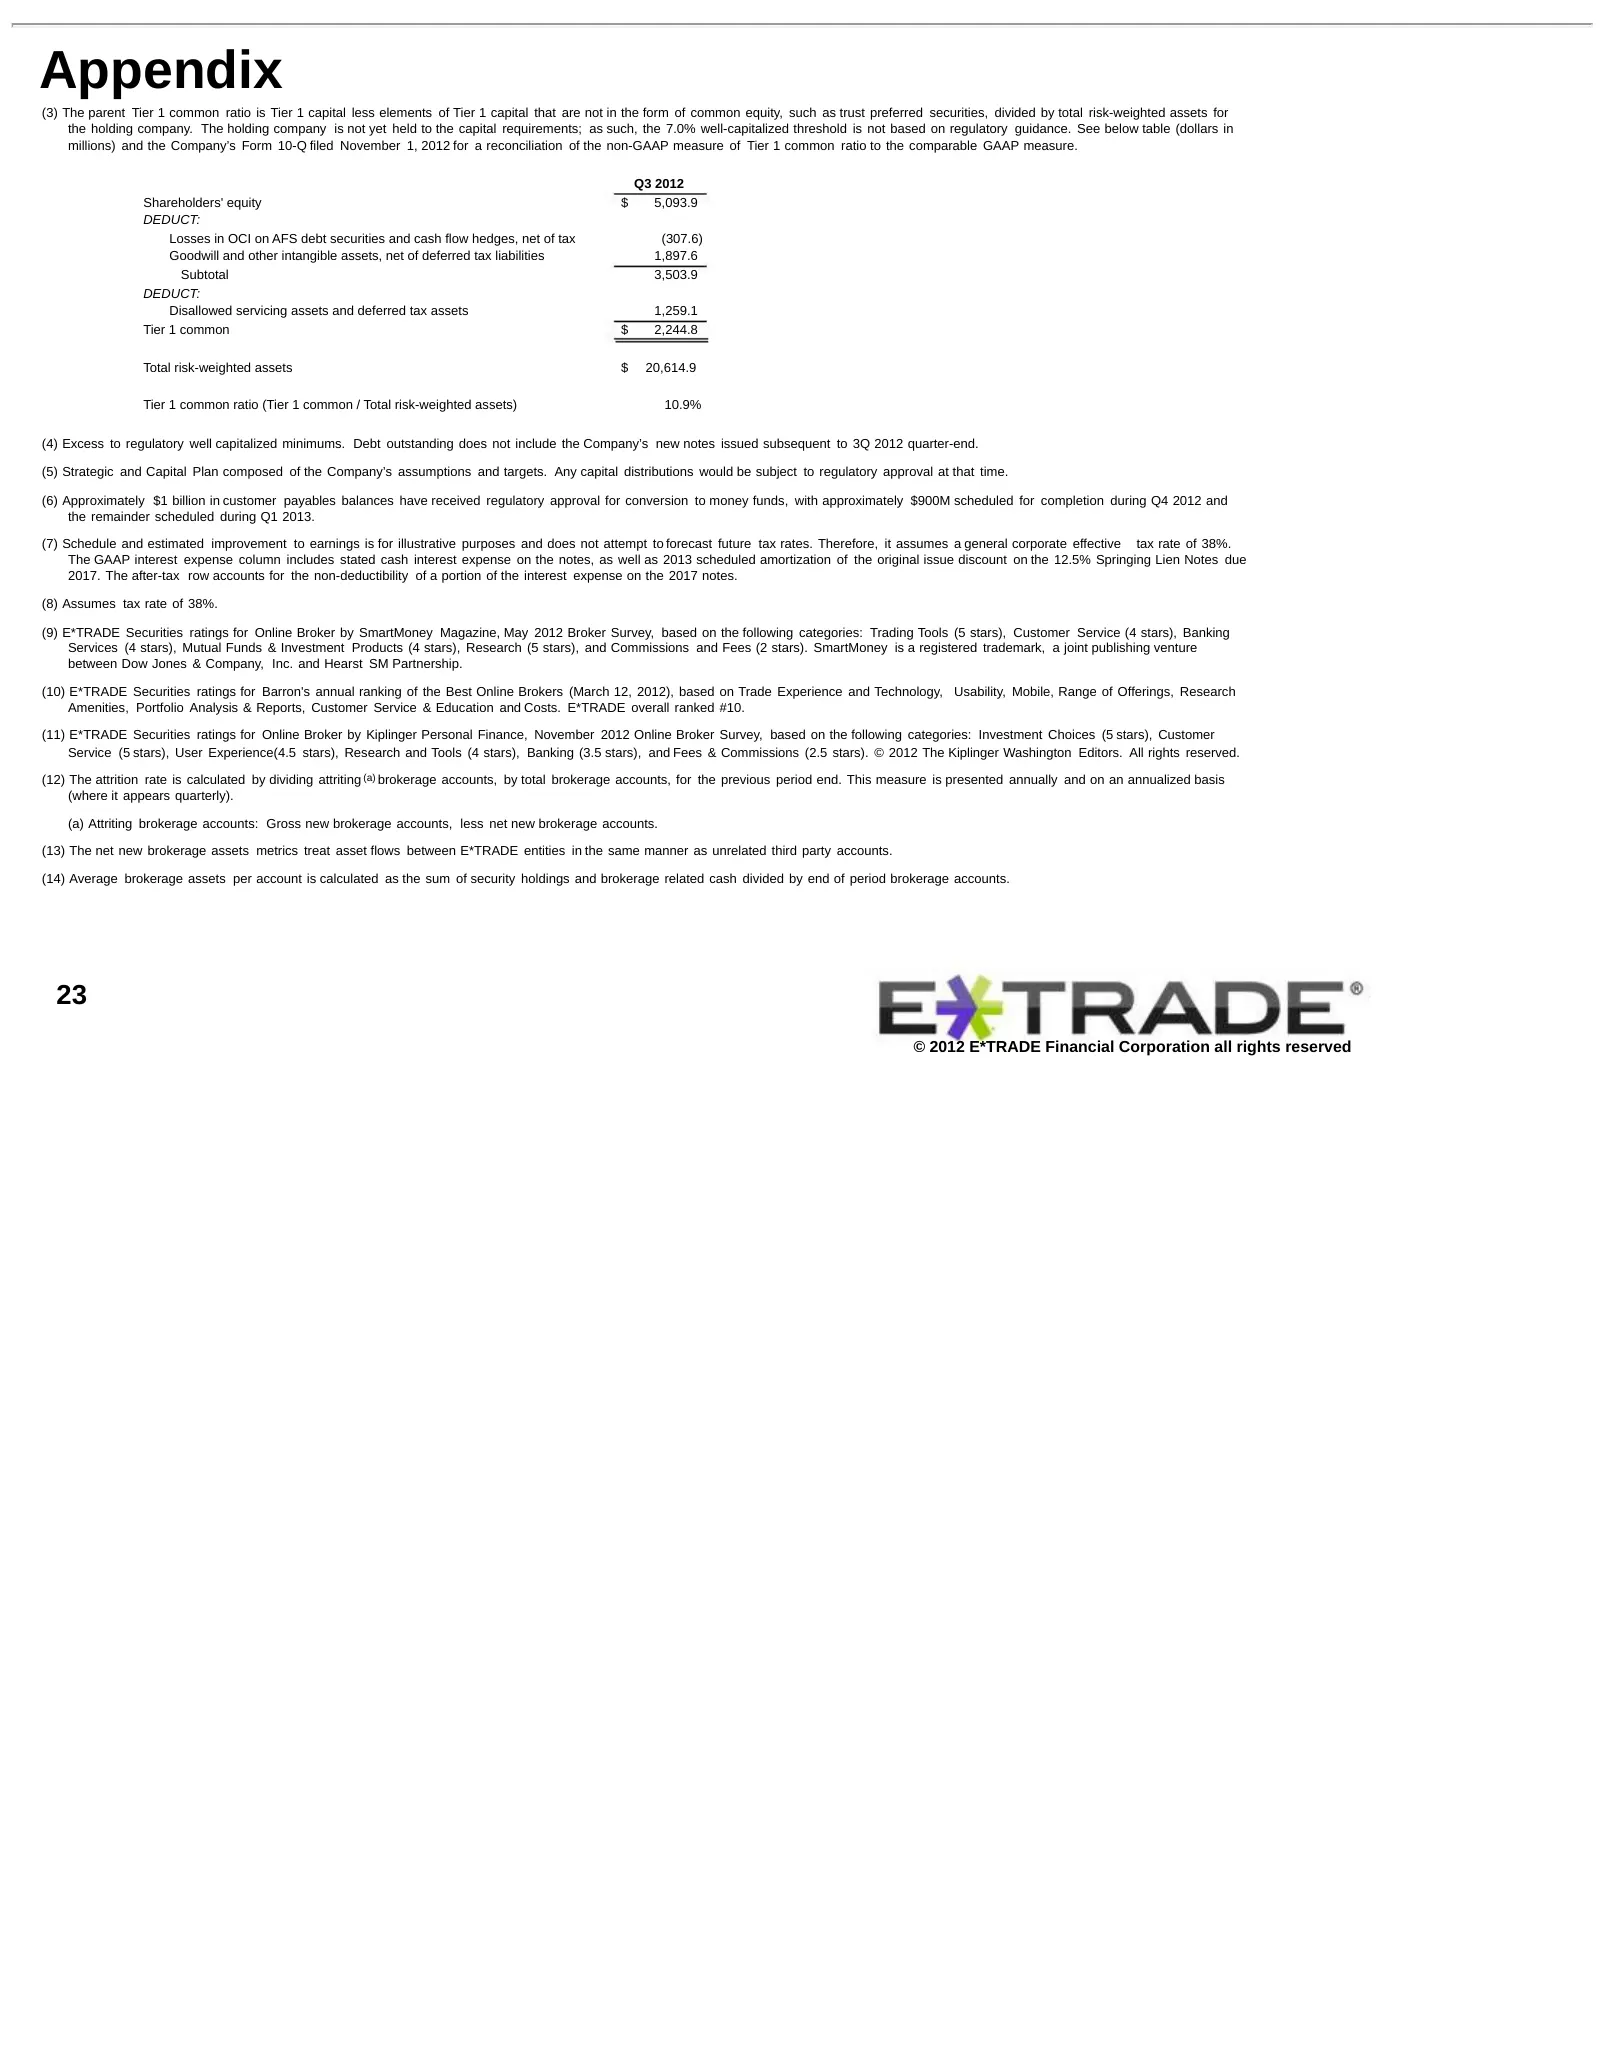
Appendix (3) The parent Tier 1 common ratio is Tier 1 capital less elements of Tier 1 capital that are not in the form of common equity, such as trust preferred securities, divided by total risk-weighted assets for the holding company. The holding company is not yet held to the capital requirements;
Slide 24: Appendix
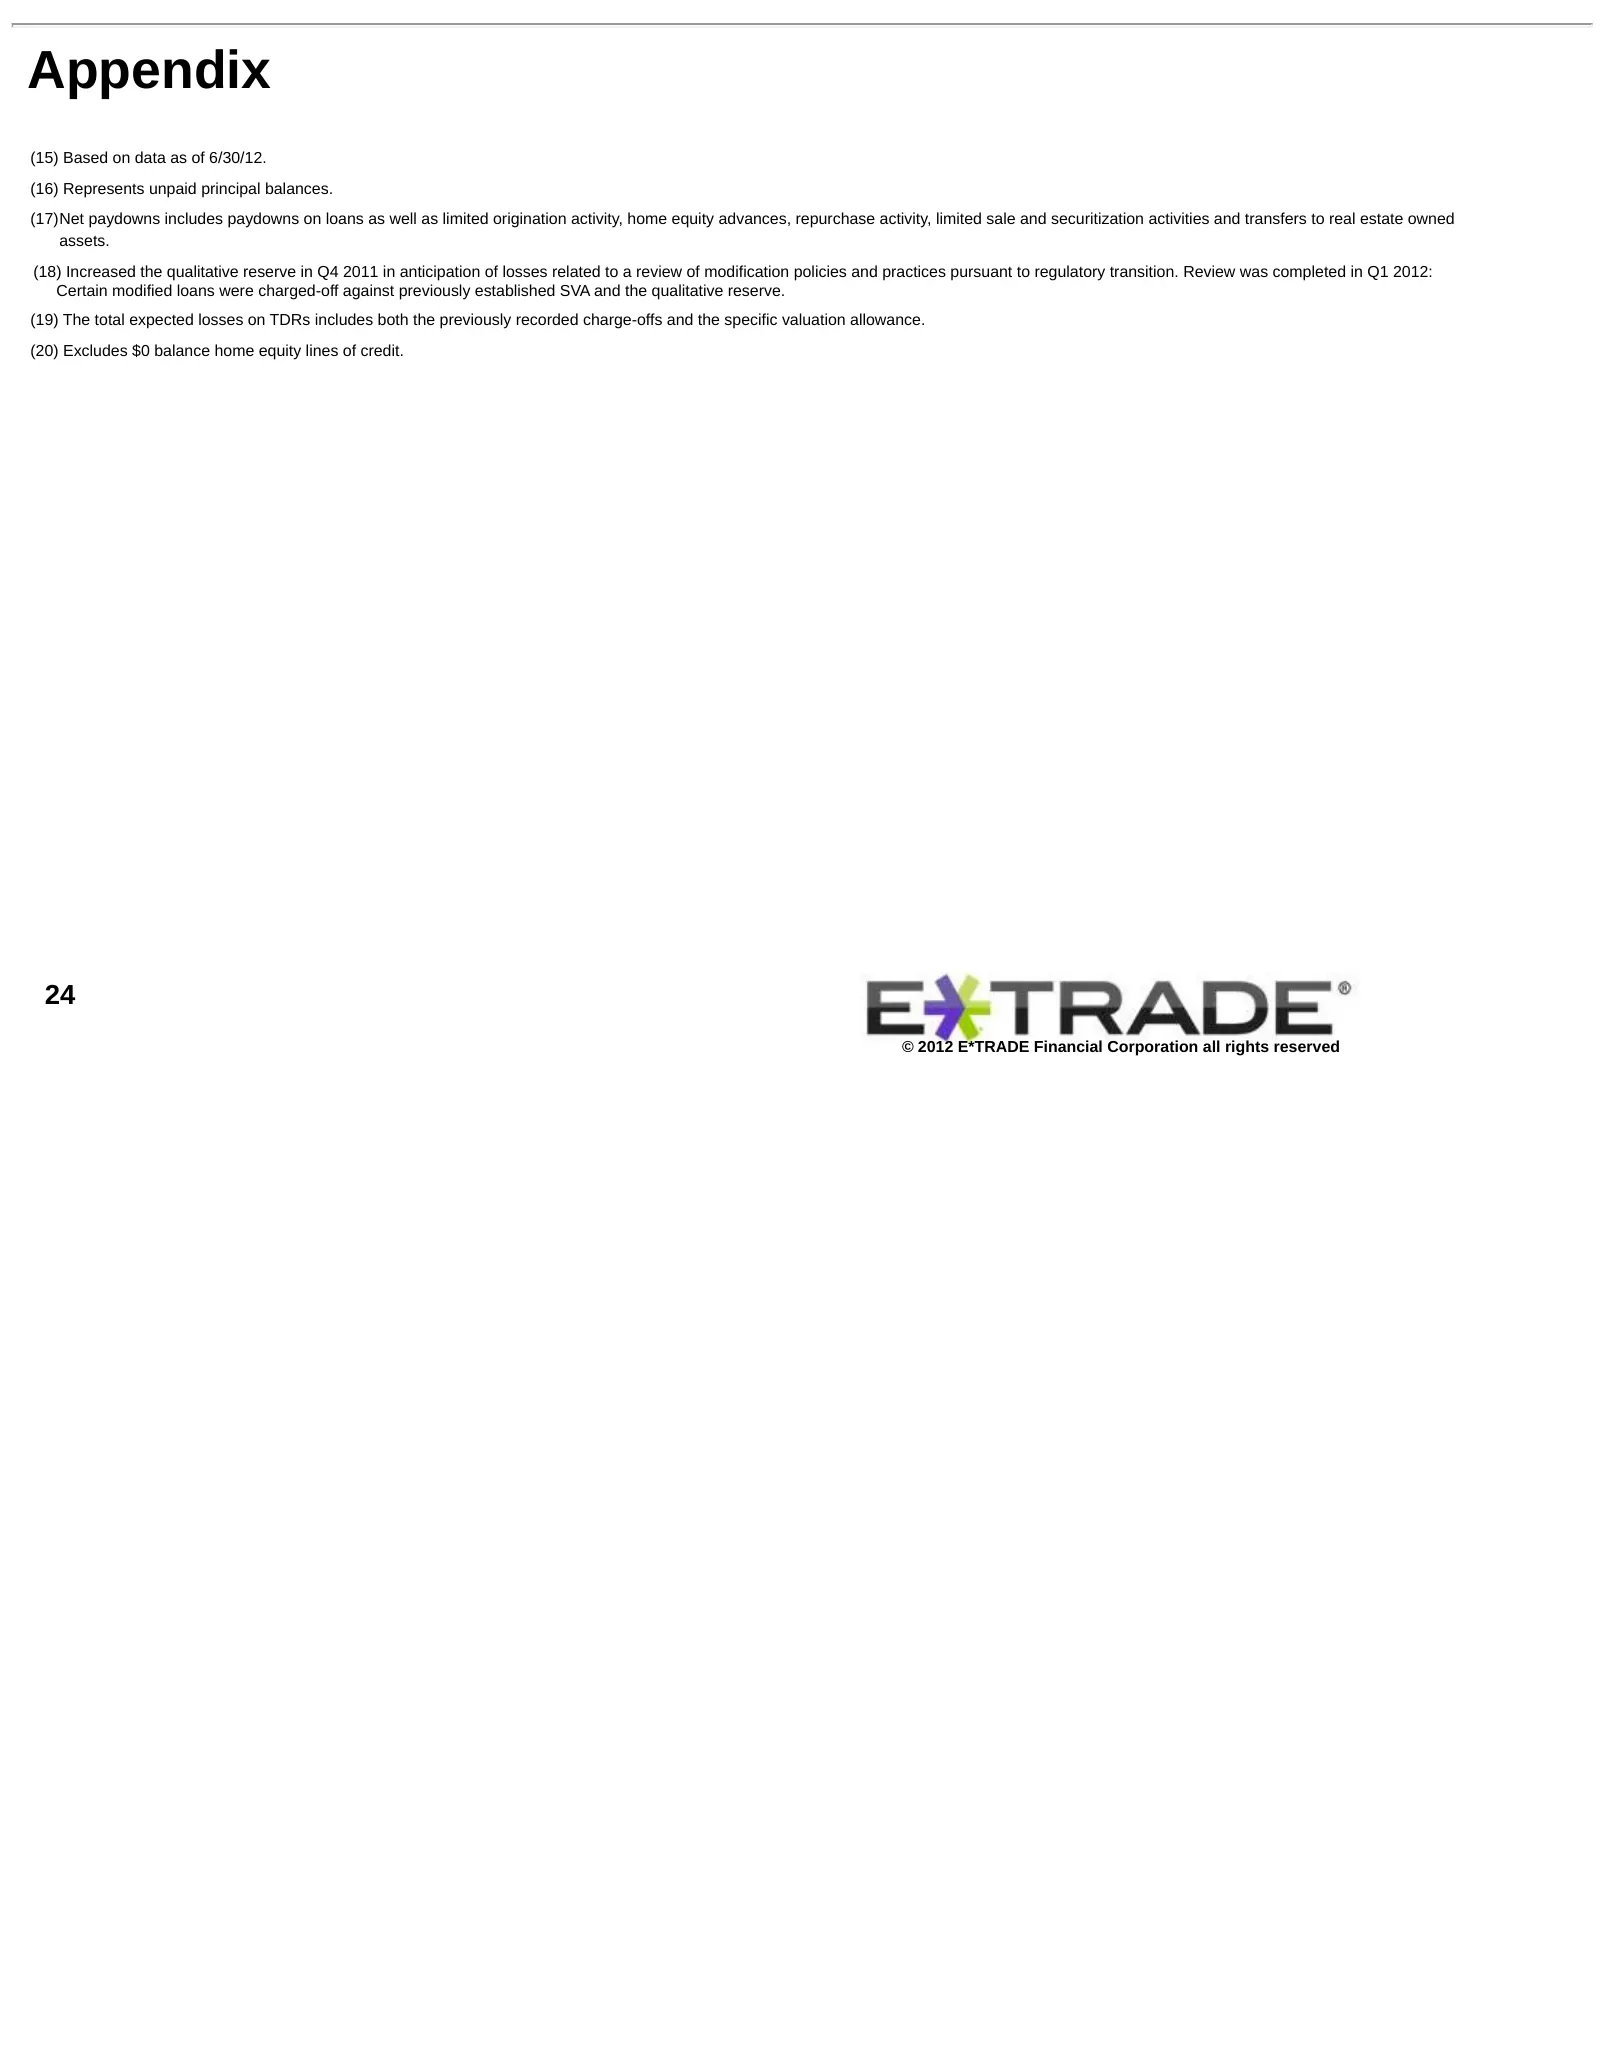
Appendix (15) Based on data as of 6/30/12. (16) Represents unpaid principal balances. (17) Net paydowns includes paydowns on loans as well as limited origination activity, home equity advances, repurchase activity, limited sale and securitization activities and transfers to real estate owned assets.
Source: SEC EDGAR · 8-K filed Nov 28, 2012
More decks from E*TRADE Financial LLC
 Merger or Acquisition (February 2020)23 slides · Feb 20, 2020
 Corporate Update (April 2019)13 slides · Apr 16, 2019
 Raymond James 34th Annual Institutional Investors Conference (March 2013)29 slides · Mar 5, 2013
 Barclays Global Financial Services Conference 201222 slides · Sep 11, 2012
 Sandler O'Neill Global Exchange & Brokerage Conference (June 2012)21 slides · Jun 7, 2012
 Raymond James 33rd Annual Institutional Investors Conference (March 2012)21 slides · Mar 6, 2012