Comerica — Comerica Inc /New/ — Goldman Sachs 2020 US Financial Services Conference
19 slides from Comerica's conference presentation, Dec 7, 2020
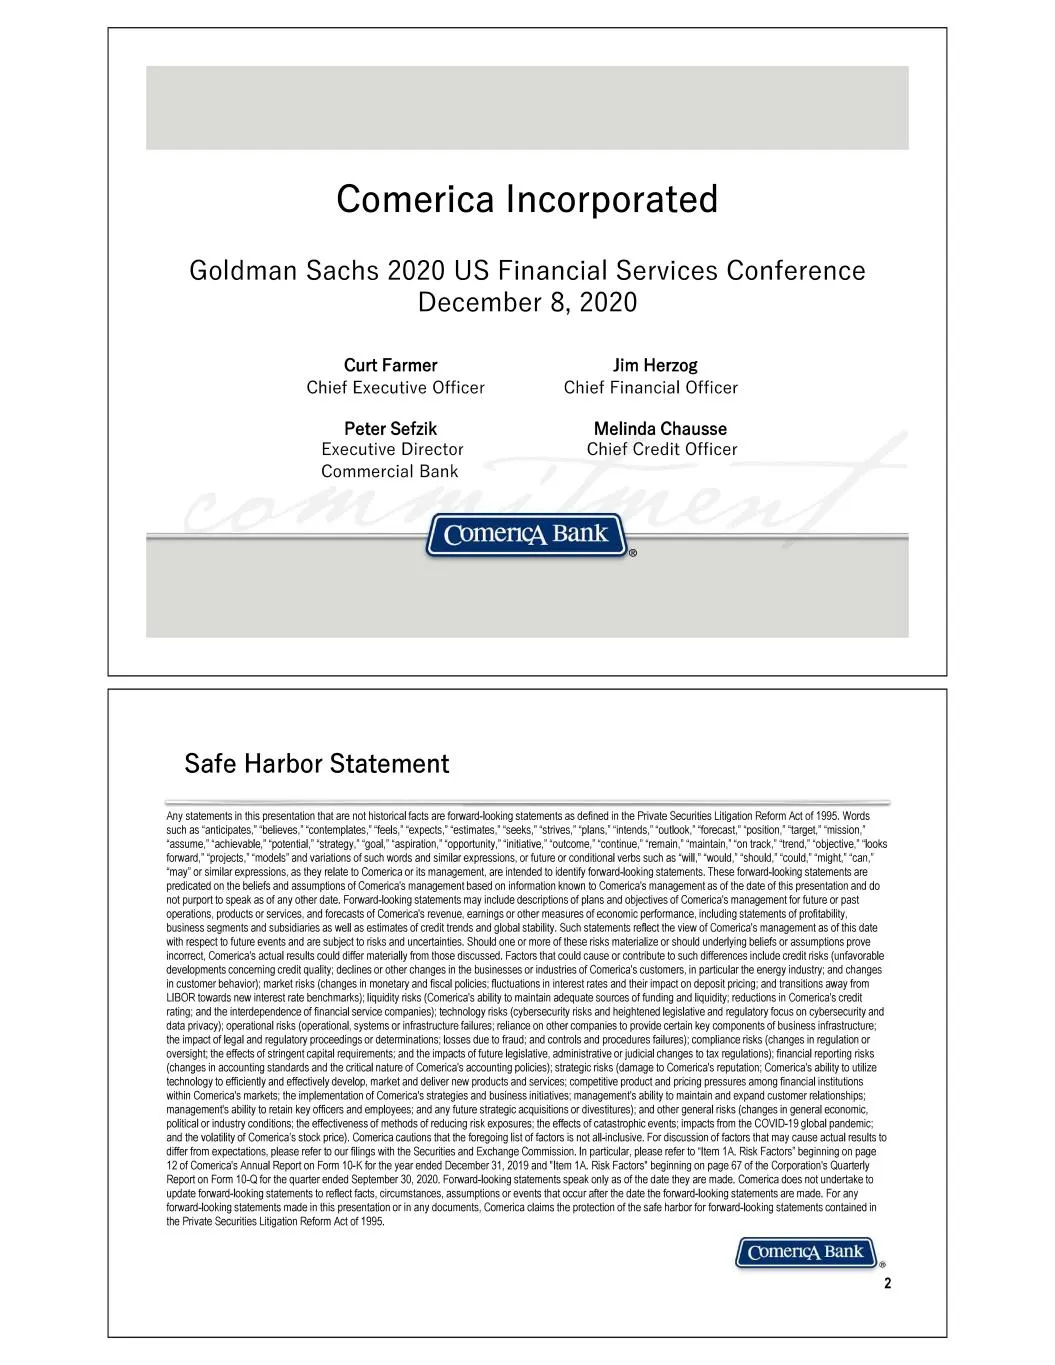
Slide 1: Comerica Incorporated
Comerica Incorporated Goldman Sachs 2020 US Financial Services Conference December 8, 2020 Curt Farmer Jim Herzog Chief Executive Officer Chief Financial Officer Peter Sefzik Melinda Chausse Executive Director Chief Credit Officer Commercial Bank Safe Harbor Statement ‘Any statements in ths presenta
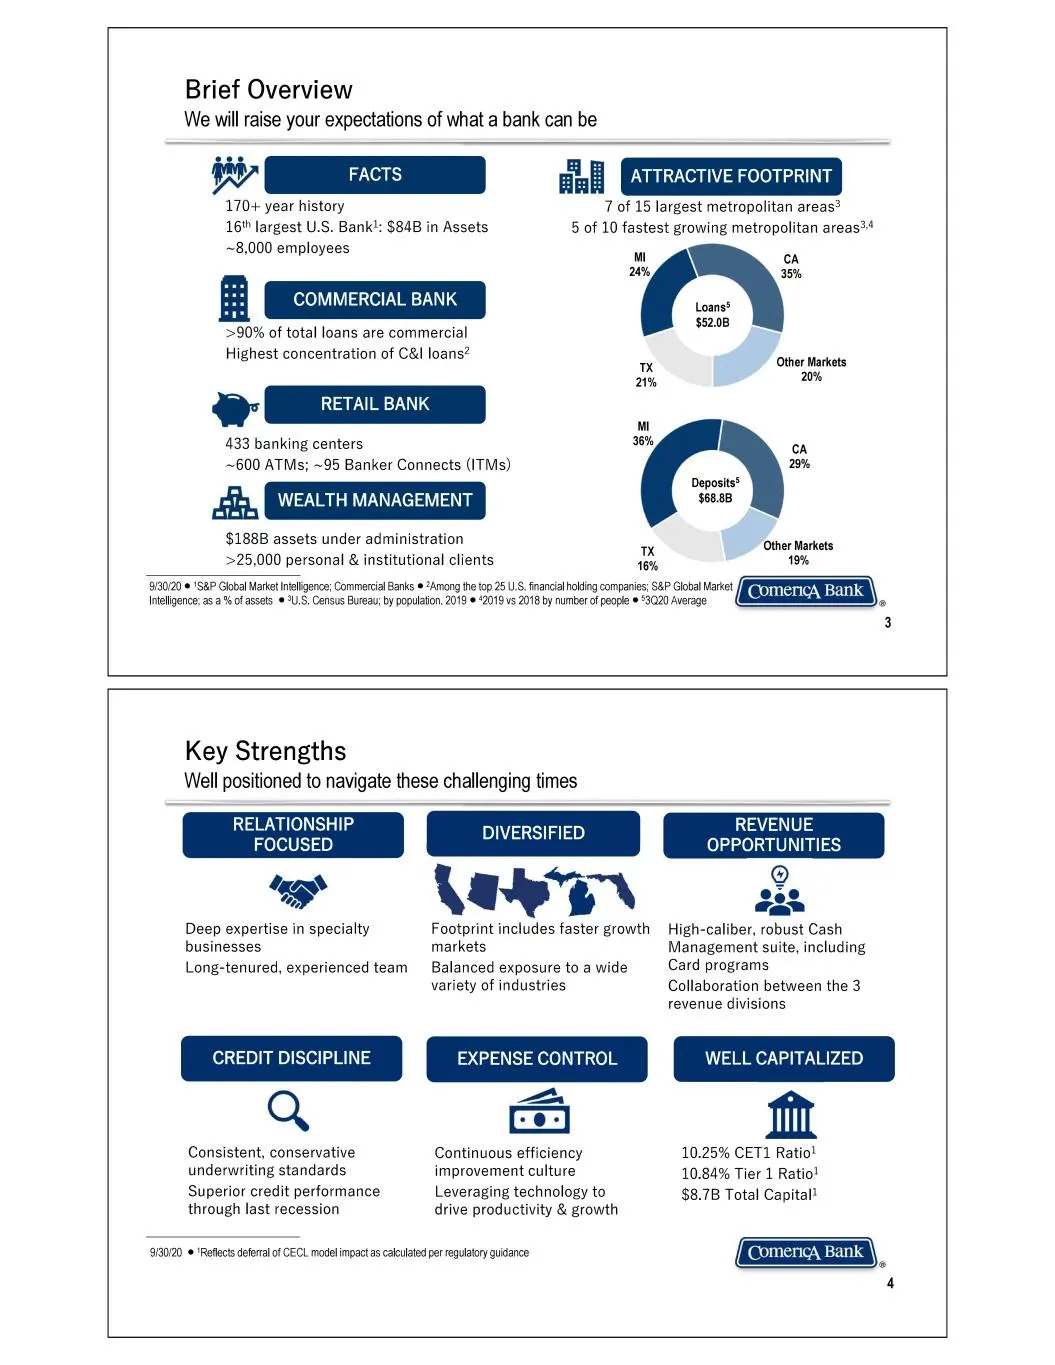
Slide 2: Brief Overview
Brief Overview We will raise your expectations of what a bank can be yg cs 170+ year history 7 of 15 largest metropolitan areas® 16" largest U.S. Bank!: $84B in Assets 5 of 10 fastest growing metropolitan areas** ~8,000 employees mM cA Wy 35% fi COMMERCIAL BANK Loans® $5208 >90% of total loans are c
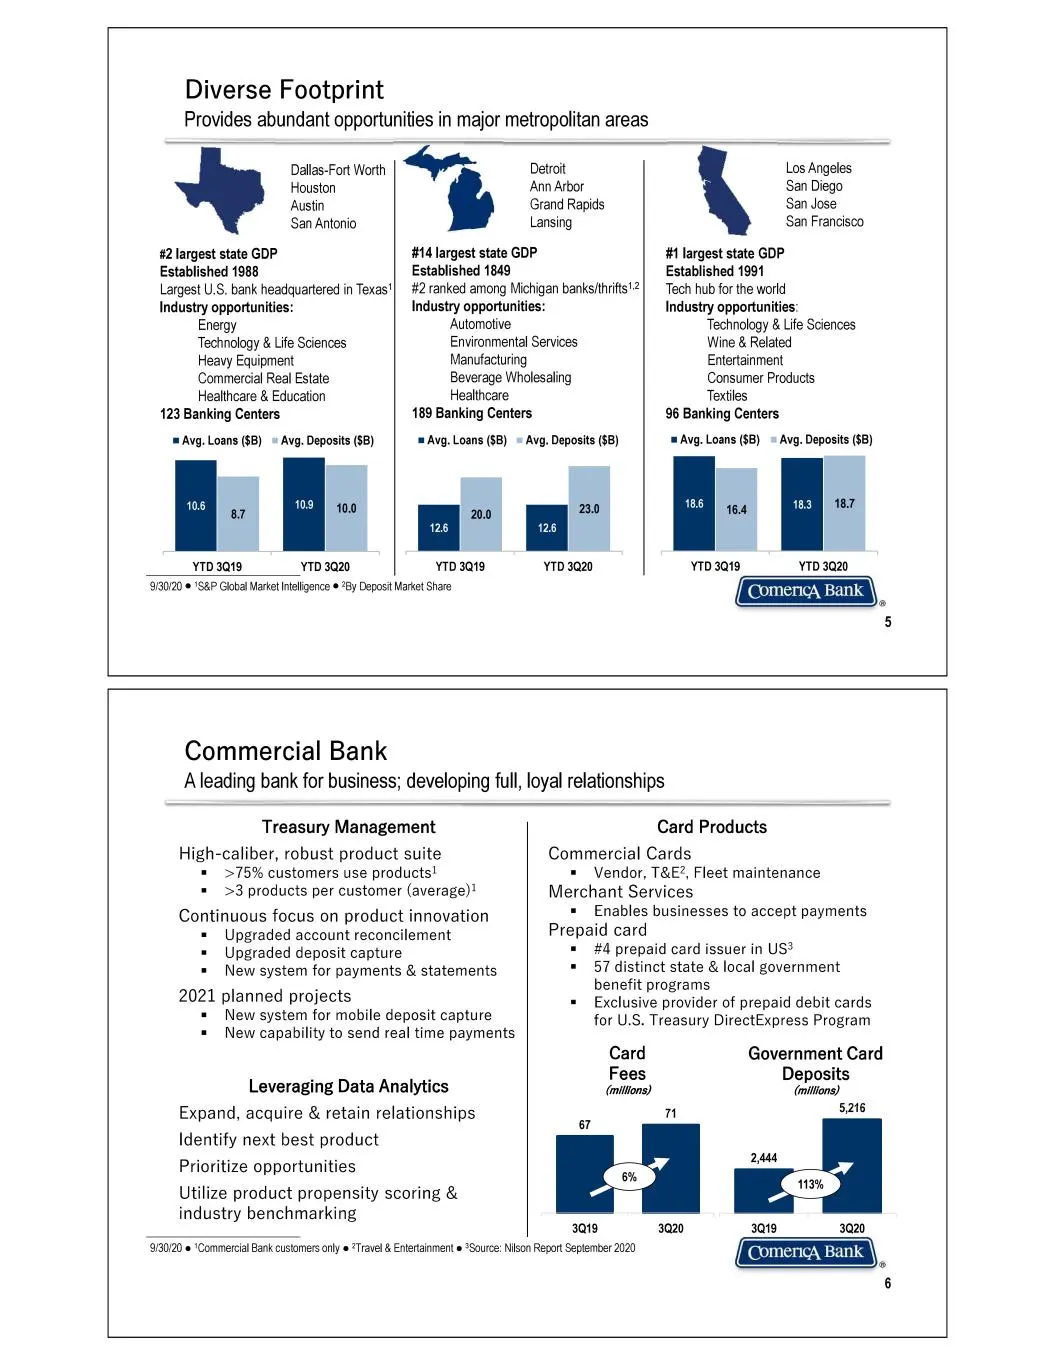
Slide 3: Diverse Footprint
Diverse Footprint Provides abundant opportuni ities in major metropolitan areas Dallas-Fort Worth Houston Austin San Antonio #2 largest state GDP Established 1988 Largest U.S. bank headquartered in Texas Industry opportunities: Energy Technology & Life Sciences Heavy Equipment Commercial Real Estate
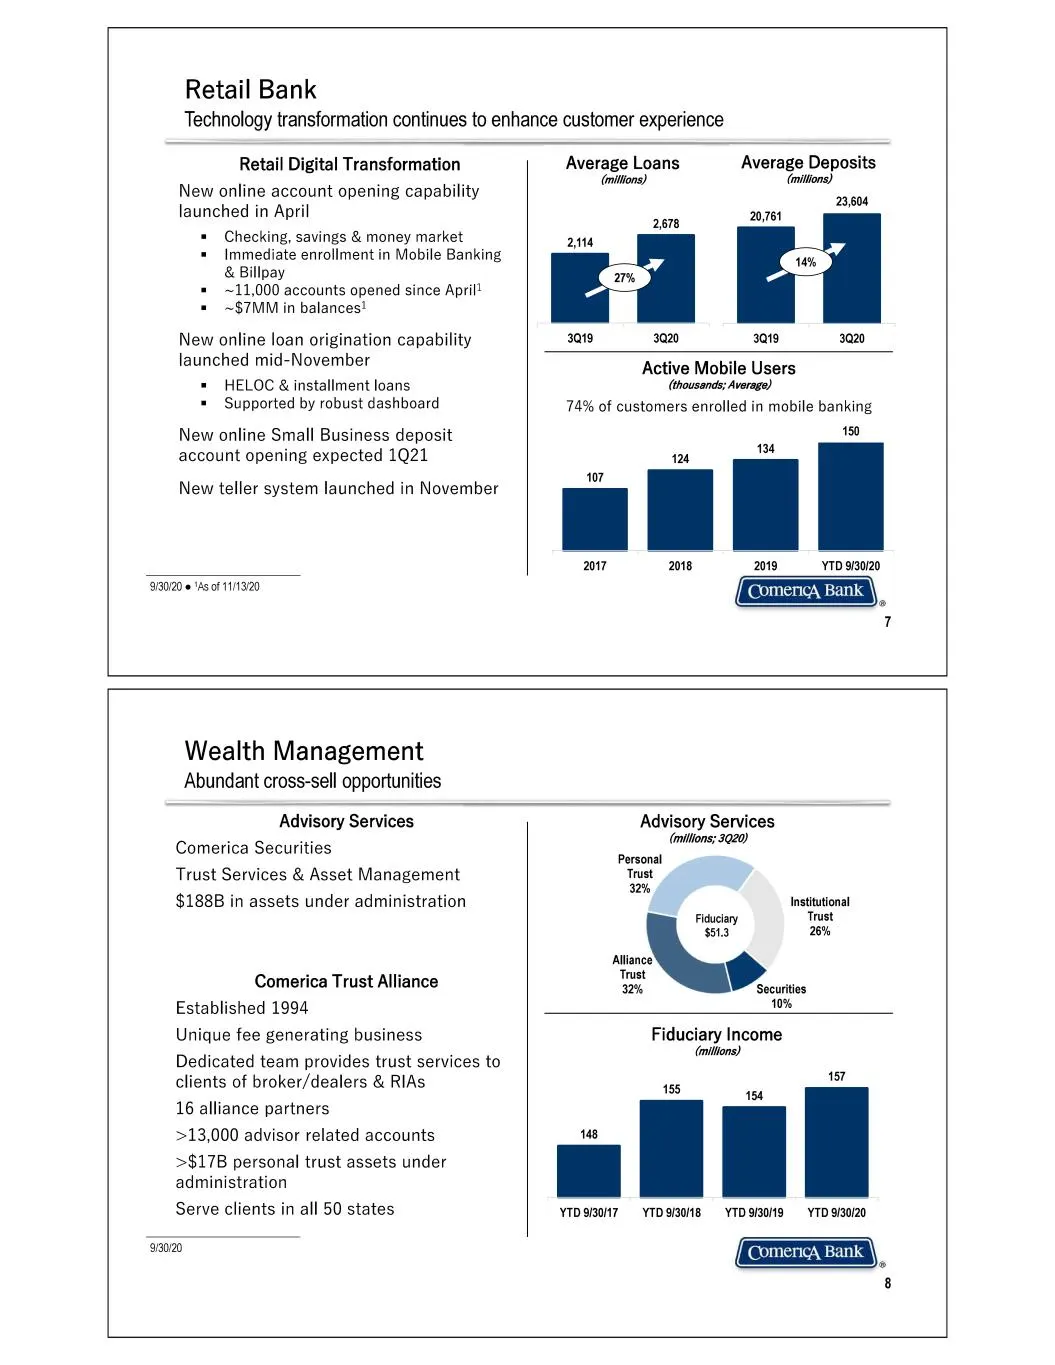
Slide 4: Retail Bank
Retail Bank New online account opening capability launched in April = Checking, savings & money market = Immediate enrollment in Mobile Banking & Billpay = ~11,000 accounts opened since April! = ~$7MM in balances! New online loan origination capability launched mid-November = HELOC & installment loa
Slide 5: 4Q20 Loan & Deposit Update
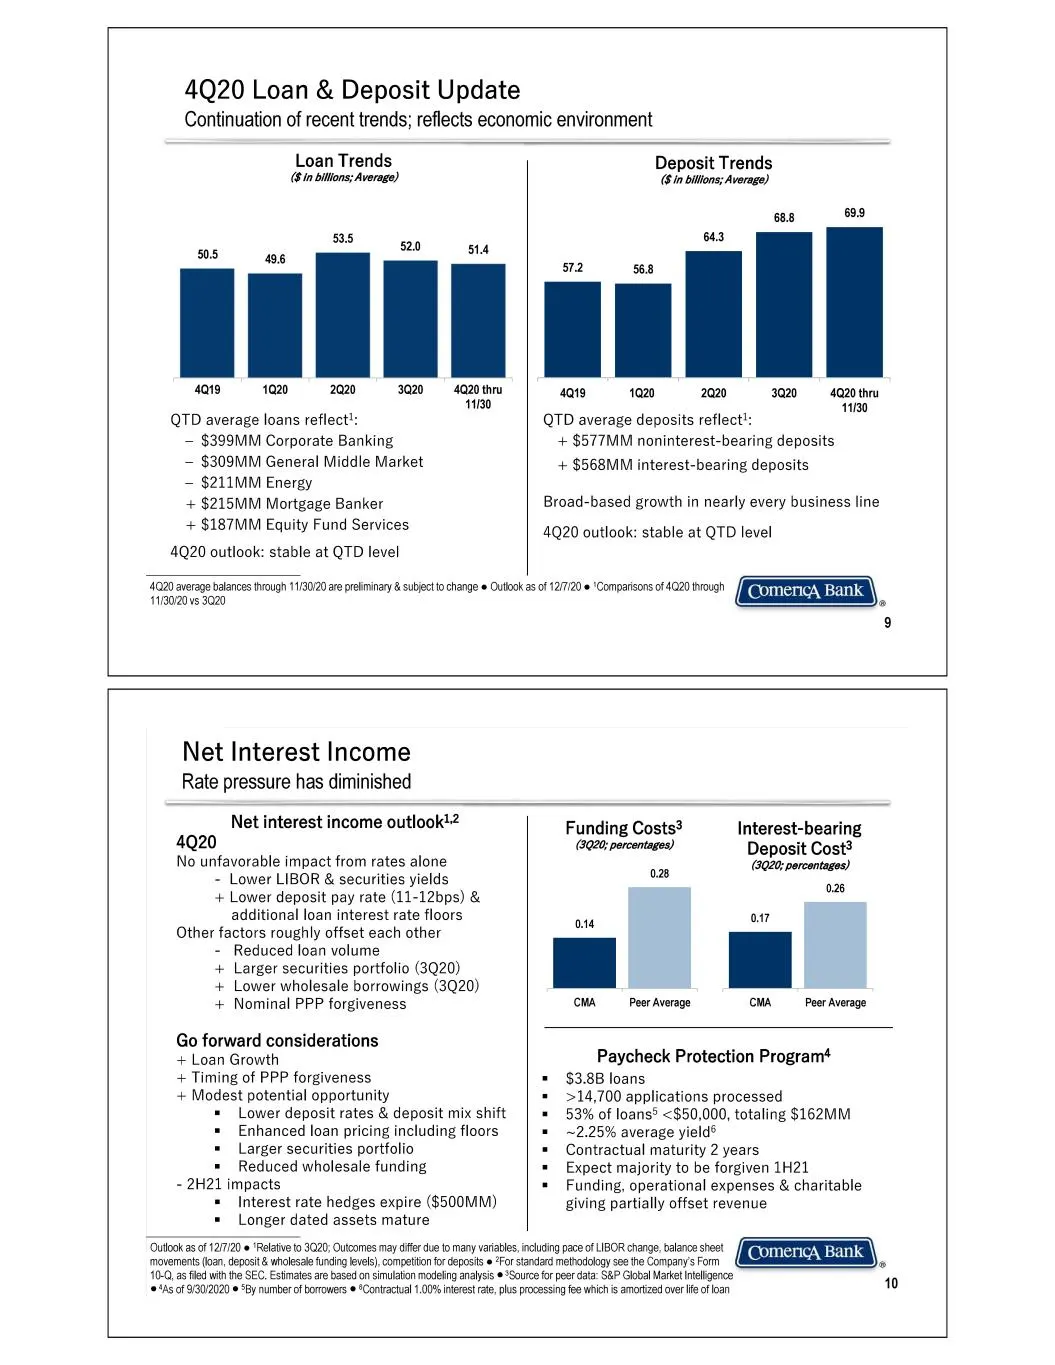
4Q20 Loan & Deposit Update Continuation of recent trends; reflects economic environment Loan Trends (Sin bilions; Average) 53.5 52.0 | i J 4019 1020 2020 3020 QTD average loans reflect!: — $399MM Corporate Banking — $309MM General Middle Market ~ $211MM Energy + $215MM Mortgage Banker + $187MM Equit
Slide 6: Credit Quality
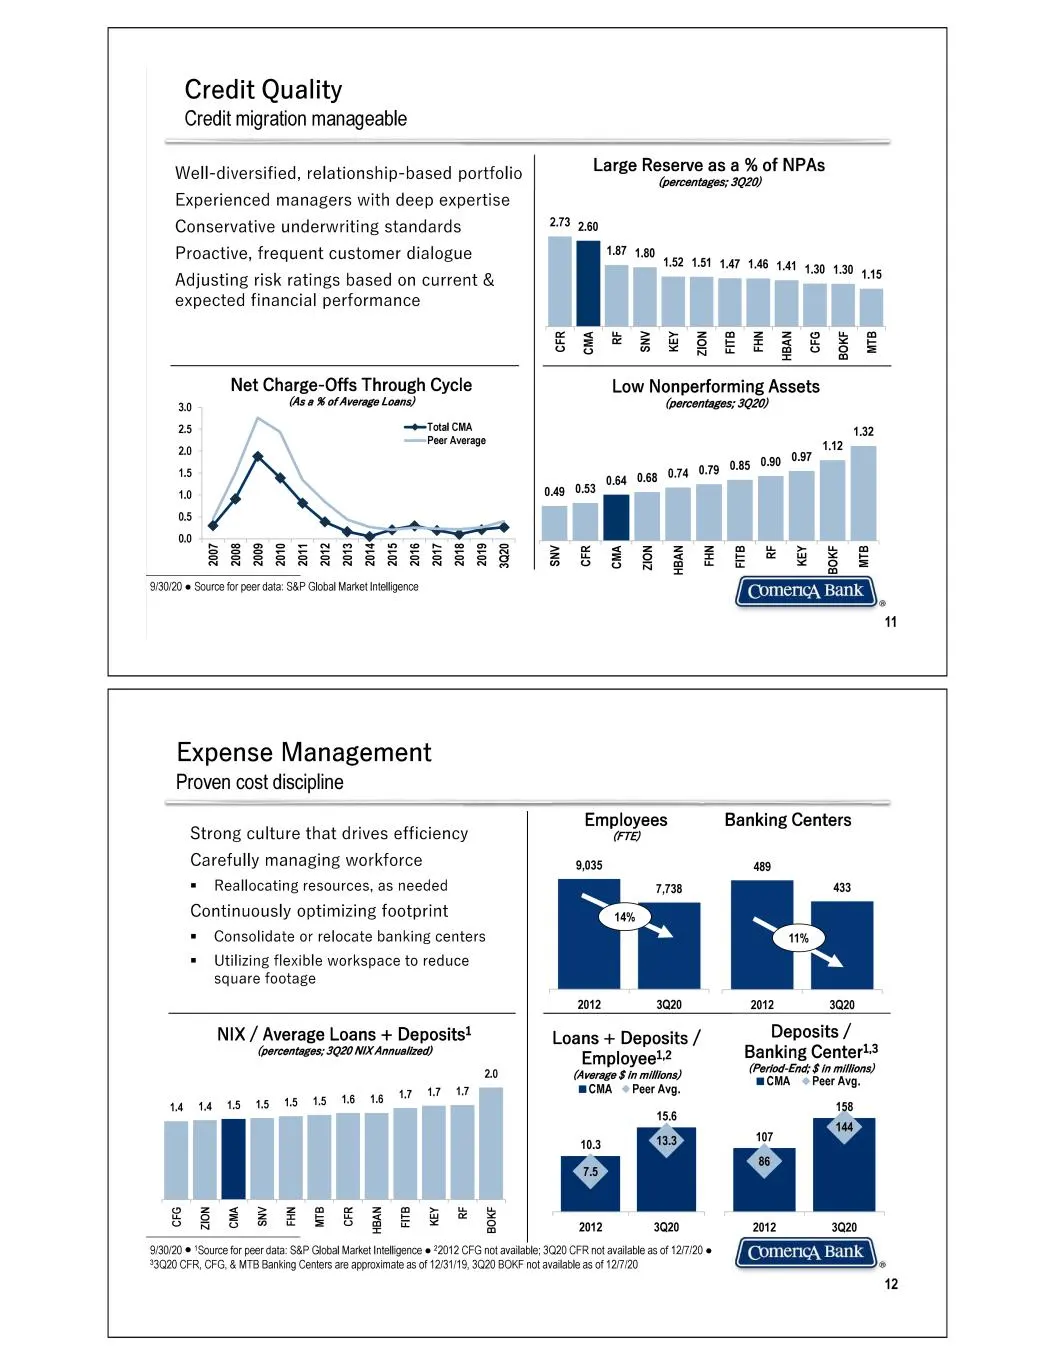
Credit Quality Credit migration manageable Well-diversified, relationship-based portfolio Experienced managers with deep expertise Large Reserve as a % of NPAs (percentages; 3020) Conservative underwriting standards 273 260 i i 187 Proactive, frequent customer dialogue 180 a5 ast 447 148 441 430 130
Slide 7: Capital Management
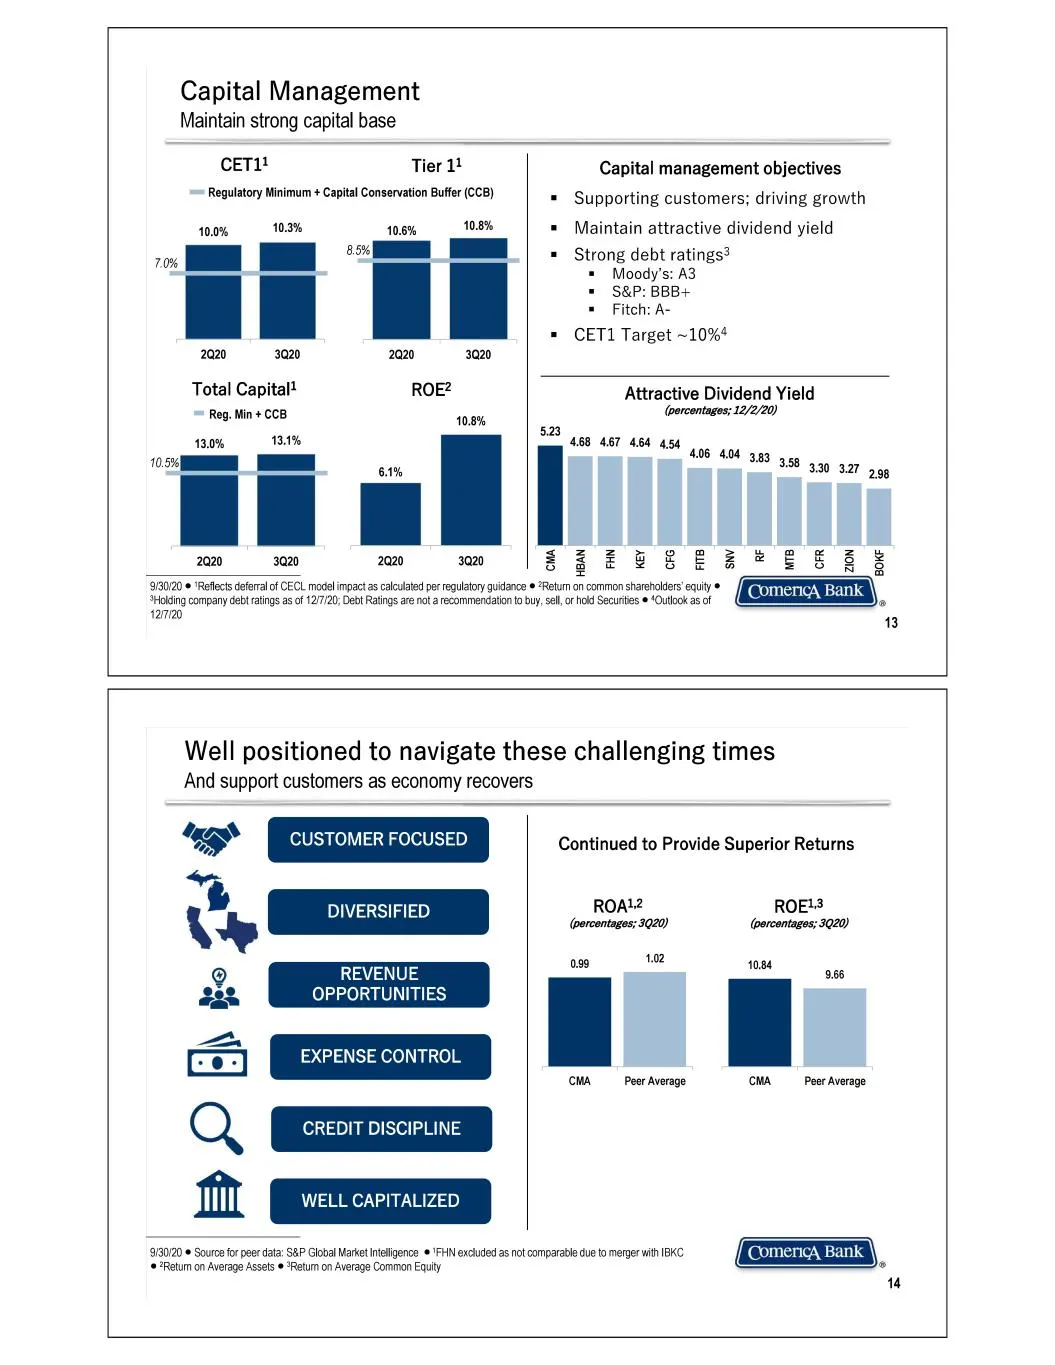
Capital Management Maintain strong capital base CETL Tier 14 Regulatory Minimum + Capital Conservation Buffer (CCB) 10.0% 10.3% 10.6% 10.8% 8.5% a 8 oe 2020 3020 2020 3020 Total Capital? ROE? Reg. Min + CCB 108% 13.0% 13.1% _ ‘9130/20 « "Reflects deferral of CECL model impact as calculated per regul
Slide 8: Appendix: Commitment to Community, Diversity & Sustainability
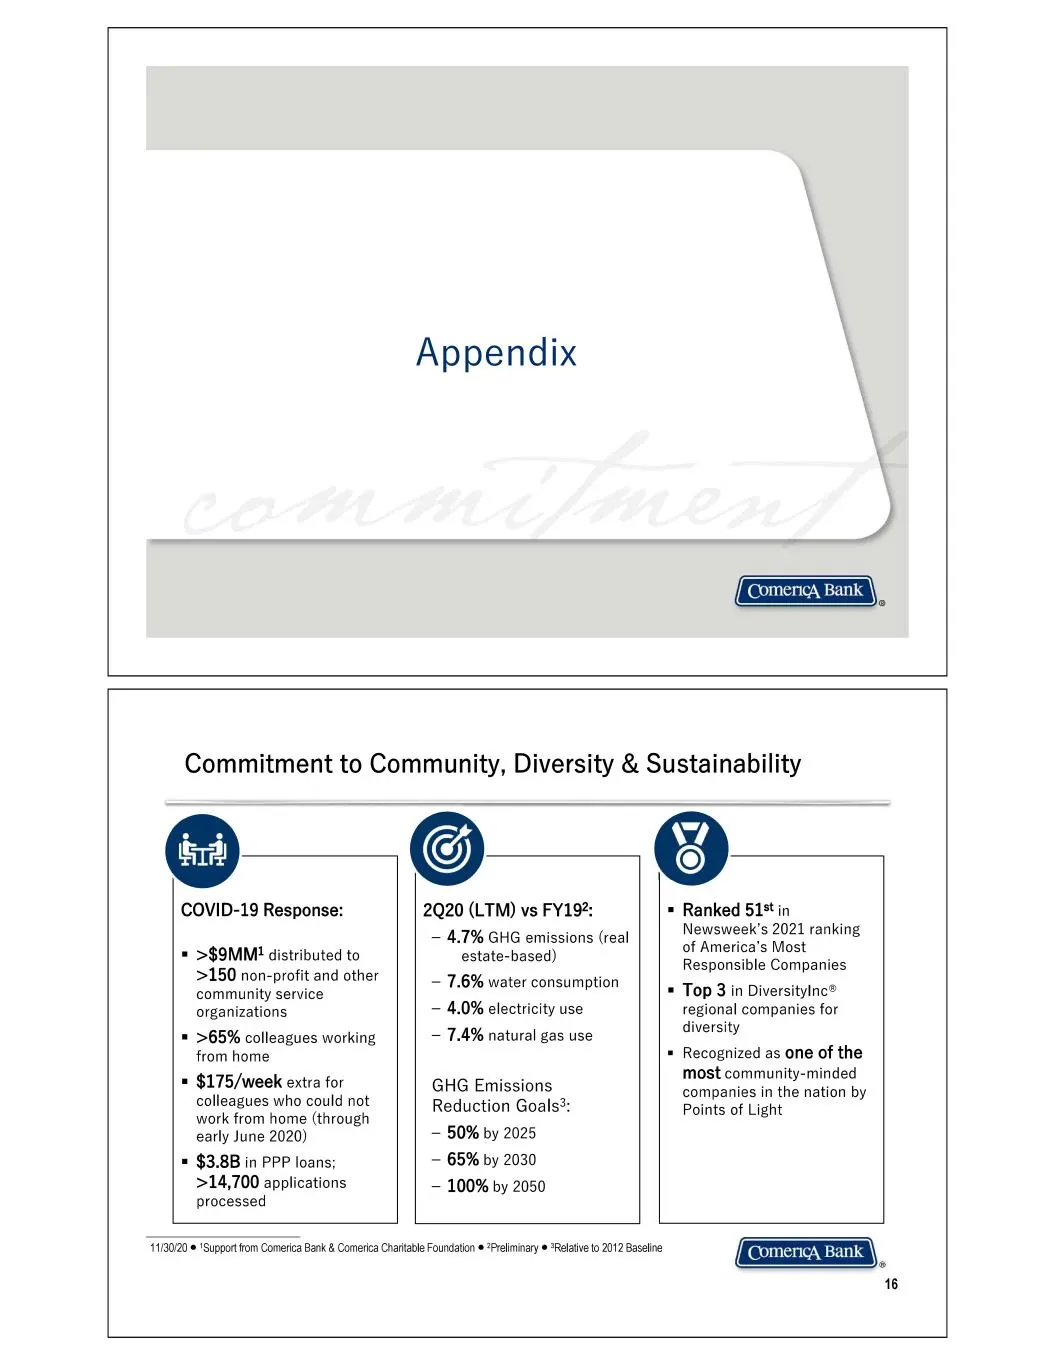
Appendix \ Commitment to Community, Diversity & Sustainability LW] COVID-19 Response: >$9MM! distributed to >150 non-profit and other community service organizations >65% colleagues working from home $175/week extra for colleagues who could not work from home (through early June 2020) $3.8B in PPP l
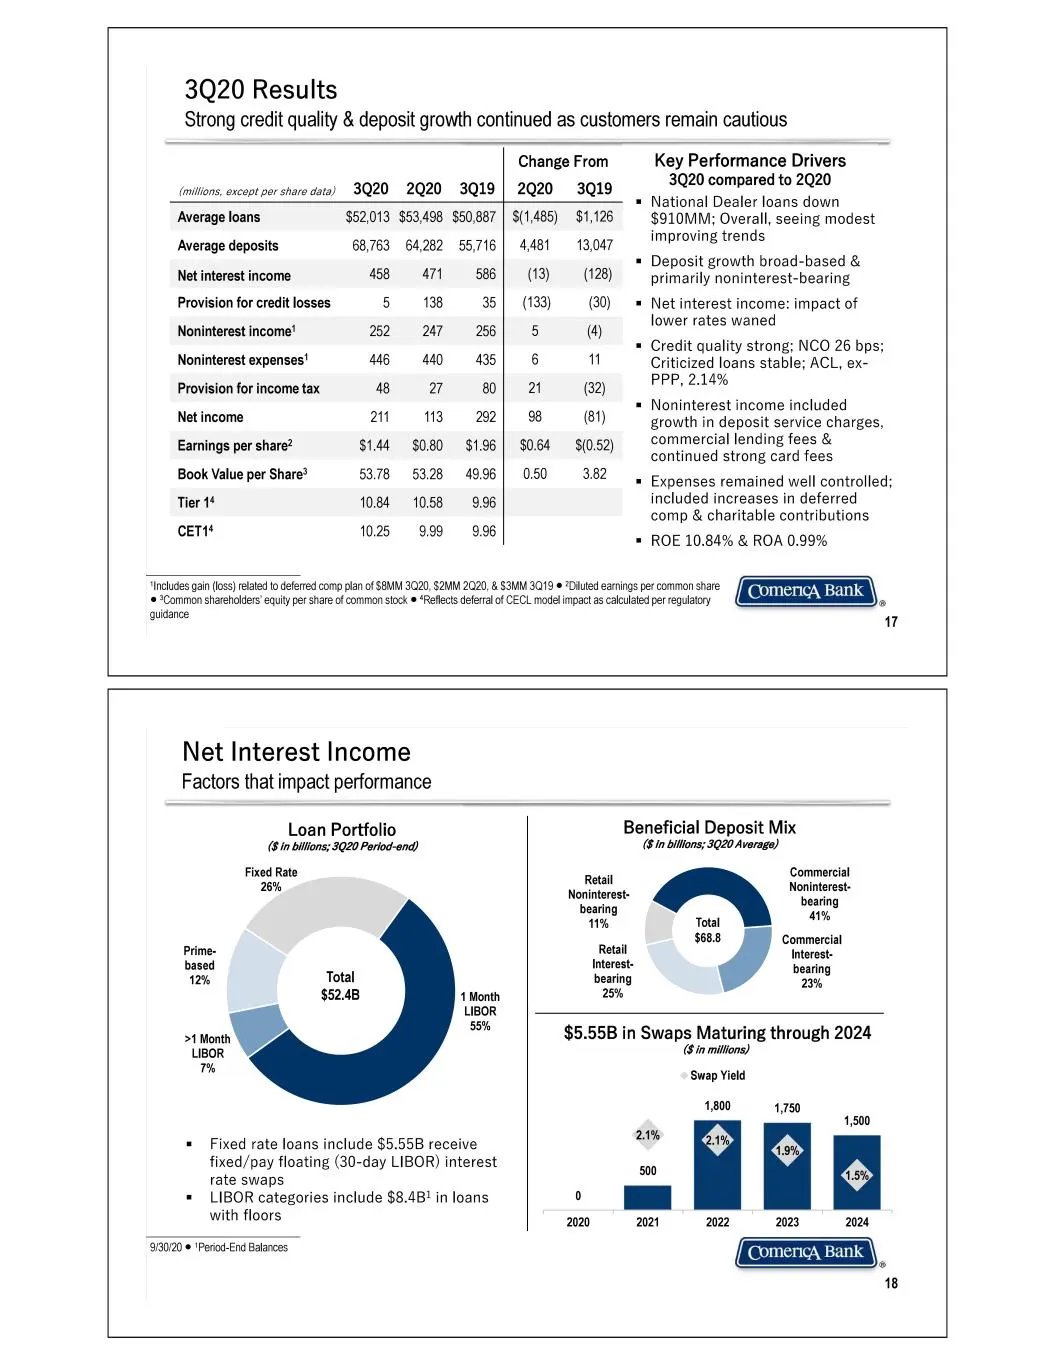
Slide 9: 3Q20 Results
3Q20 Results Strong credit quality & deposit growth continued as customers remain cautious Change From Key Performance Drivers 3Q20 compared to 2020 ‘onions, excoot per stare dota) 3Q20 2920 3919] 2920 3Q19 é = National Dealer loans down Average loans $52,013 $53,498 $50,887 | $(1,485) $1,126 §910MM
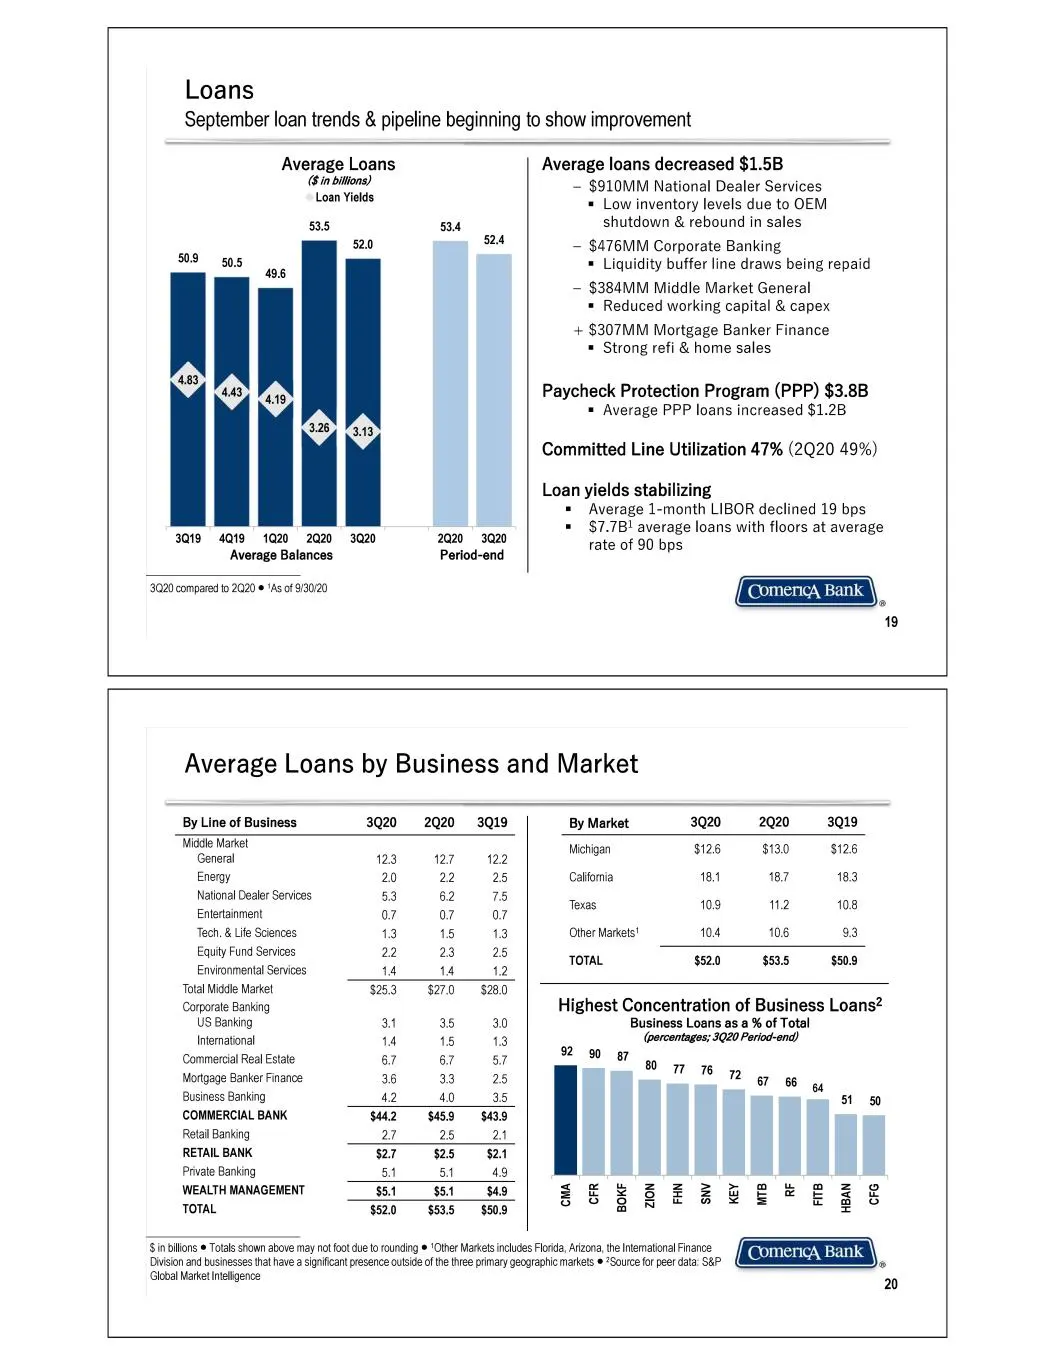
Slide 10: Loans
Loans September loan trends & pipeline beginning to show improvement Average Loans Gin bilions) Loan Yields 534 535 il 520 od l I i | : 3019 4019 1020 2020 3020 2020 3020 ‘Average Balances Period-end 3020 compared o:2020 @ As of 913020 Average loans decreased $1.5B — $910MM National Dealer Services
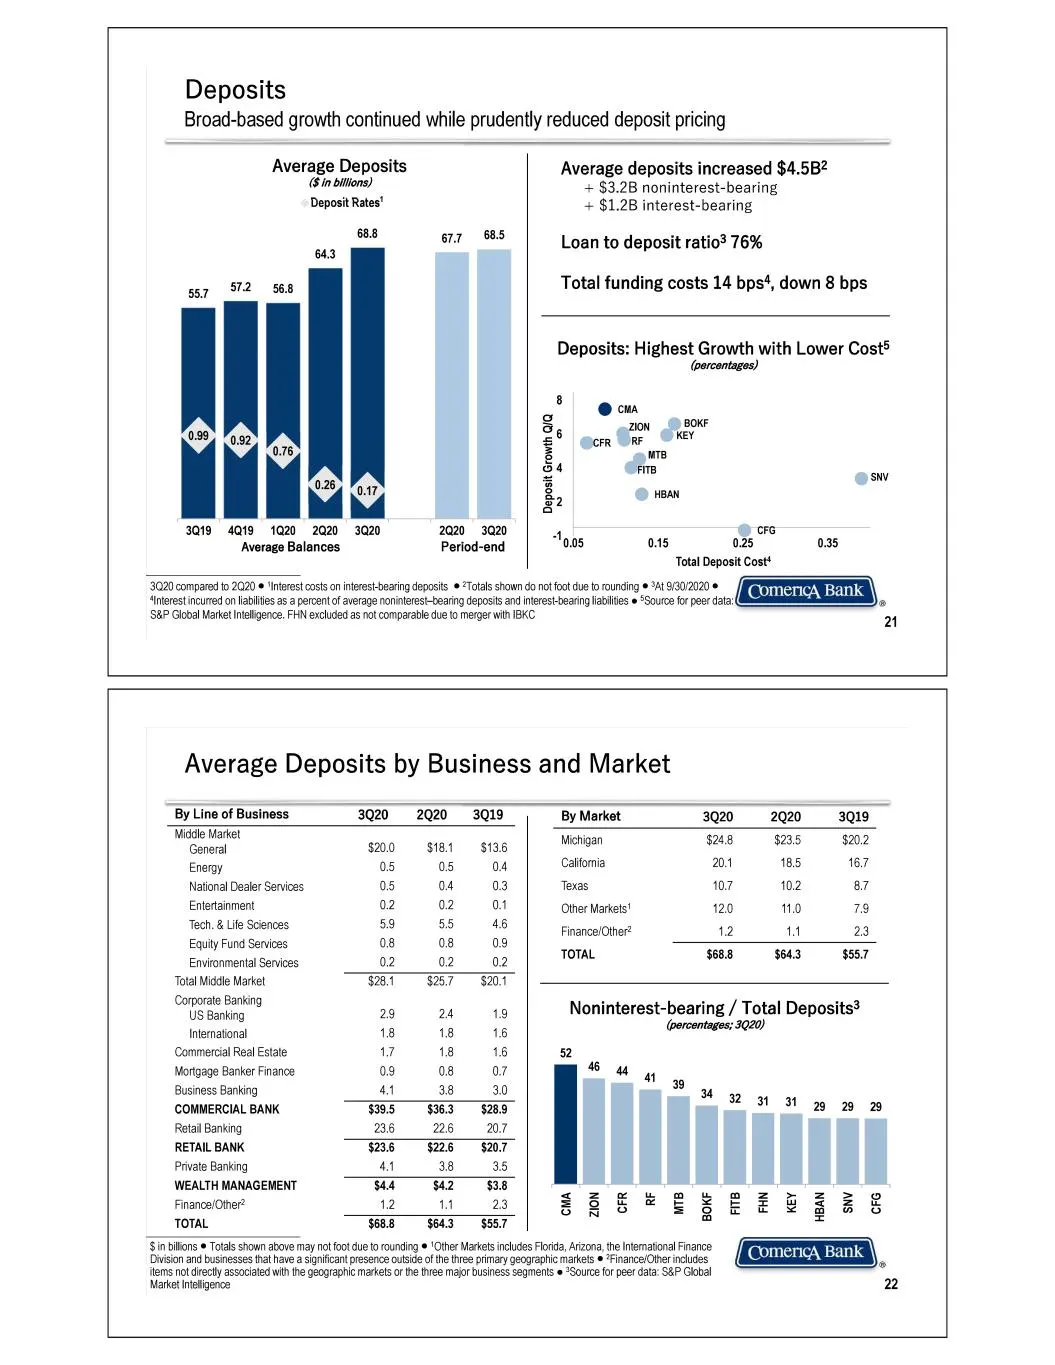
Slide 11: Deposits
Deposits Average Deposits Gin ditions) Deposit Rates" 688 ory 885 3019 4019 1020 2020 3020 2020 3020 ‘Average Balances Period-end ‘3020 compared to 2020 ‘Interest costs on interest-bearing deposis. # “Totals shown do no foot due to rounding ‘Interest incured on fables asa percent of average noninter
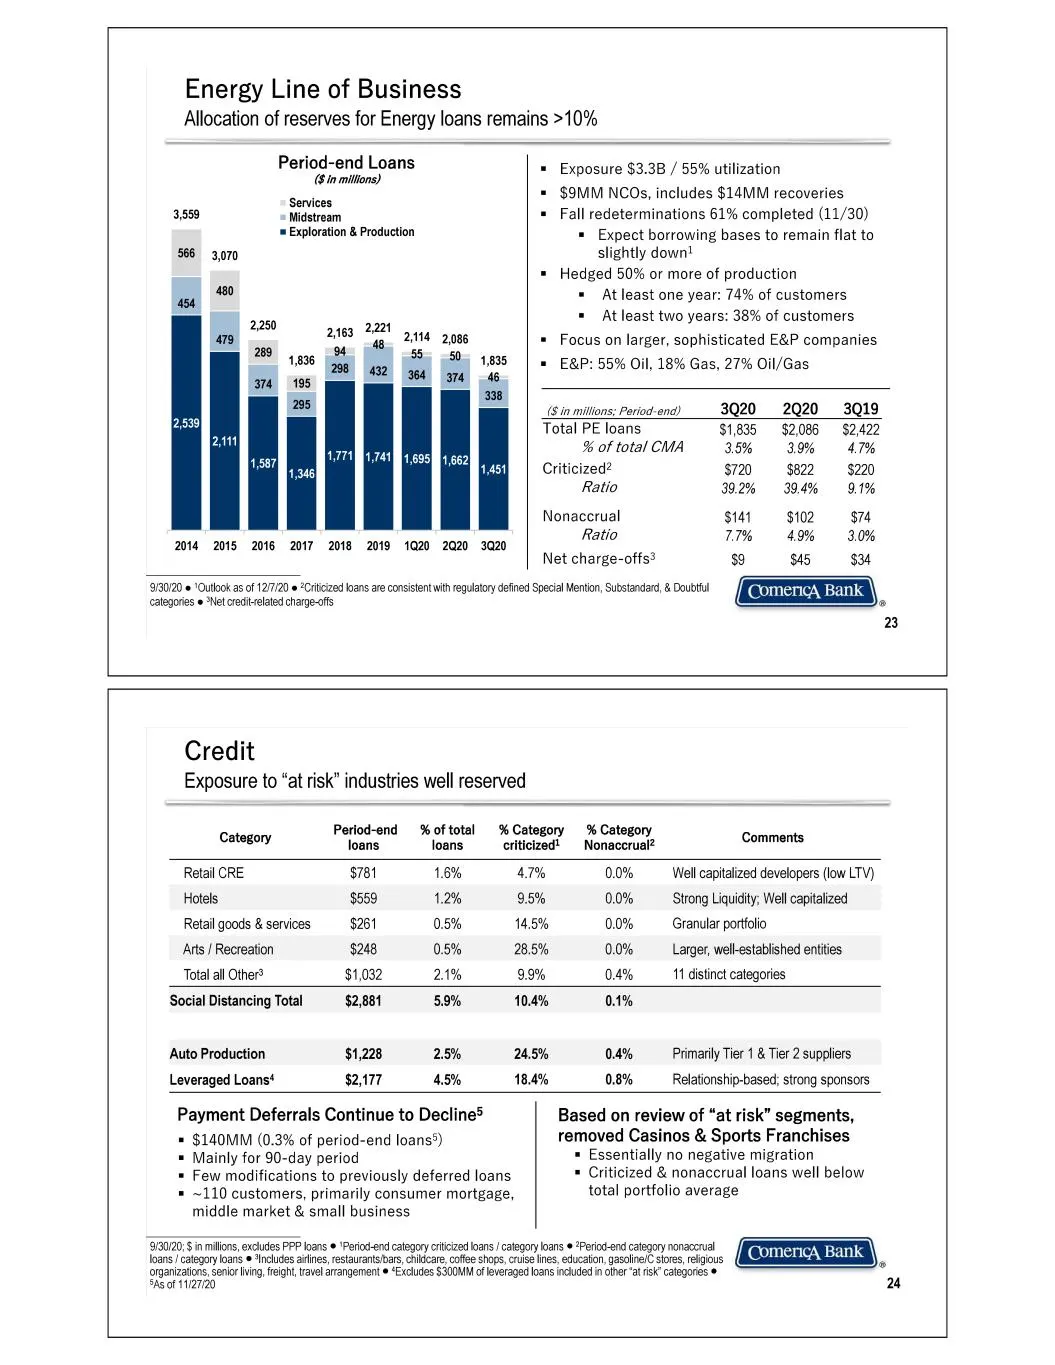
Slide 12: Energy Line of Business
Energy Line of Business Allocation of reserves for Energy loans remains >10% Perlod-end Loans + Exposure $3.38 / 55% utilization Services + $9MM NCOs, includes $14MM recoveries 3,558 Midstream = Fall redeterminations 61% completed (11/30) *= Exploration & Production = Expect borrowing bases to remai
Slide 13: Mortgage Banker Finance
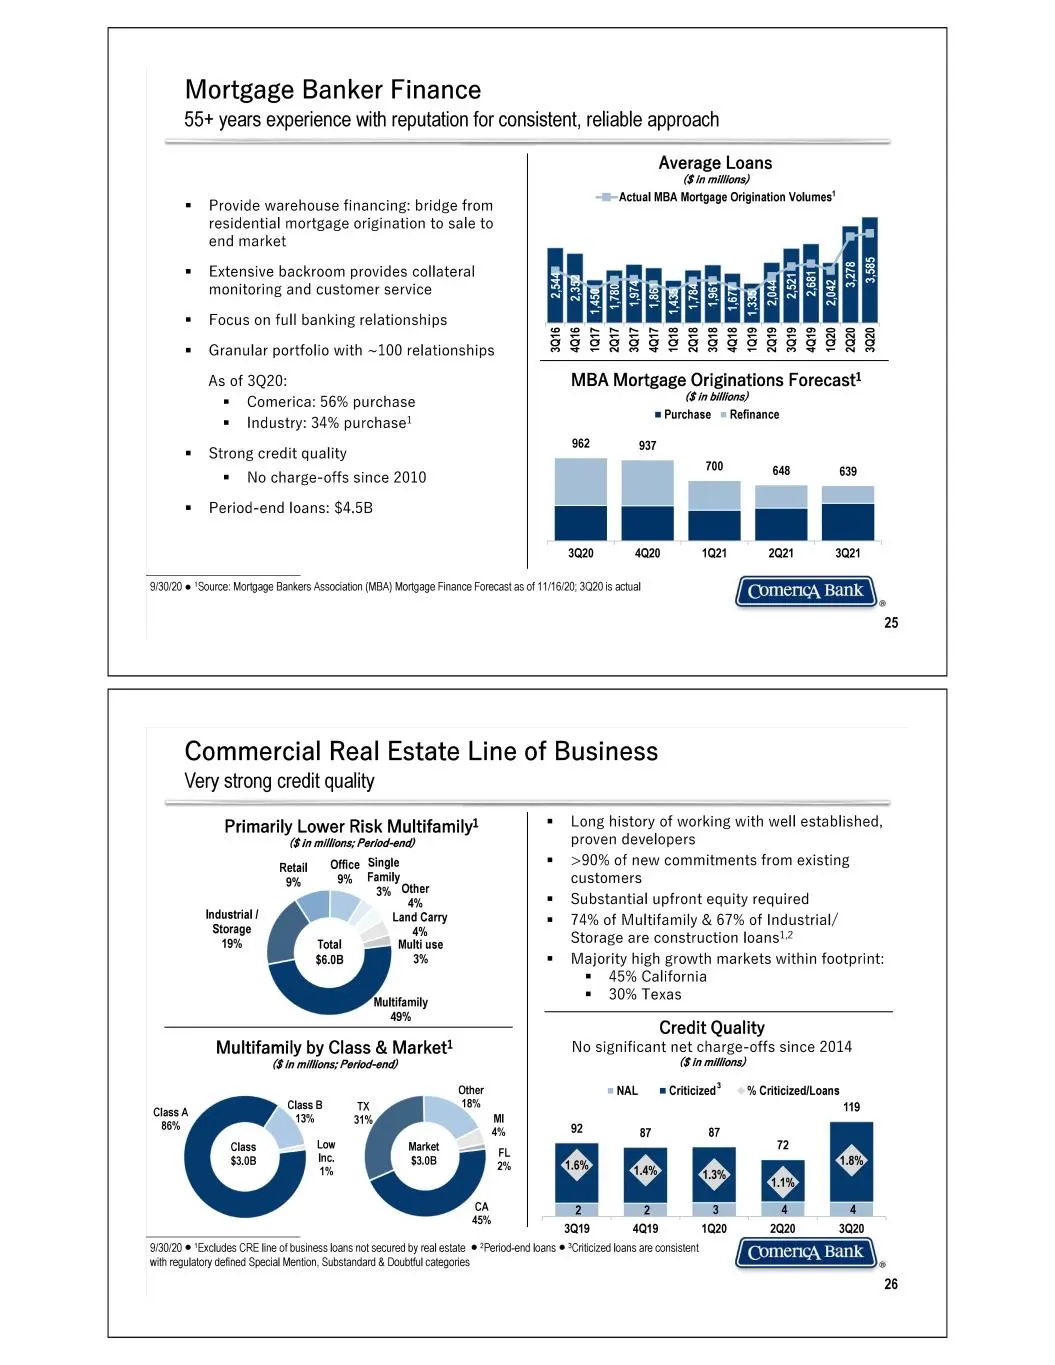
Mortgage Banker Finance * Provide warehouse financing: bridge from residential mortgage origination to sale to end market = Extensive backroom provides collateral monitoring and customer service * Focus on full banking relationships + Granular portfolio with ~100 relationships As of 3Q20: * Comerica
Slide 14: National Dealer Services
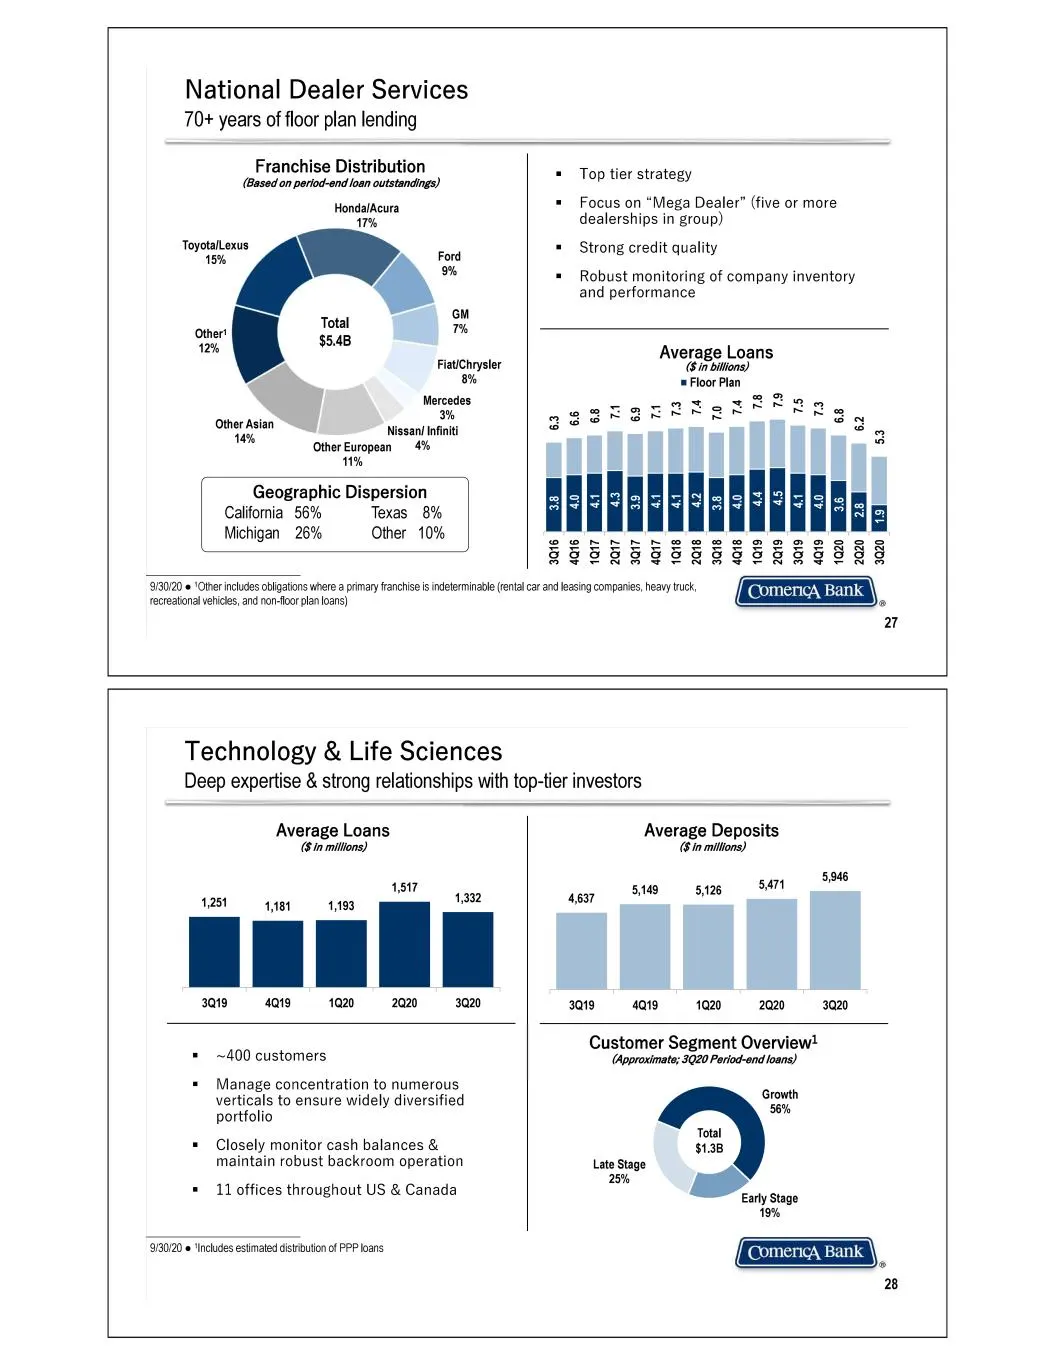
National Dealer Services 70+ years of floor plan lending Franchise Distribution (Based on period-end loan outstandings) Hondibcua ToyotalLexus a Foyt fas oma! Total 12% $5.43 FiatiChrysler 8% Mercedes M One Ase Nissan! Infiniti Other European 4% 11% Geographic Dispersion California 56% Texas 8% Mich
Slide 15: Equity Fund Services
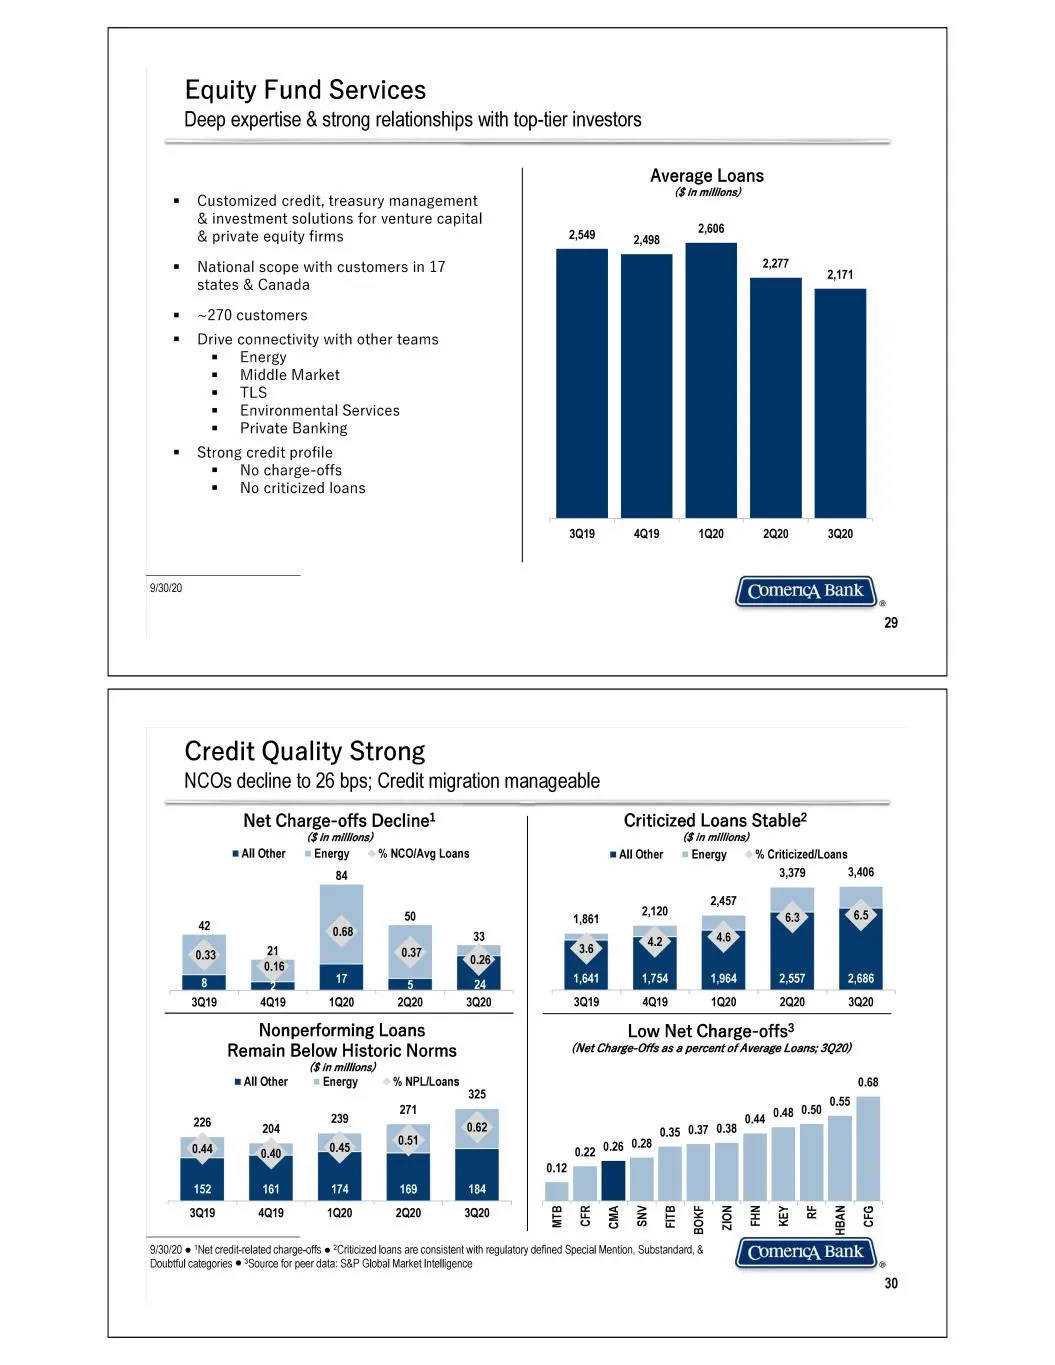
Equity Fund Services Deep expertise & strong relationships with top-tier investors Average Loans = Customized credit, treasury management het! & investment solutions for venture capital saa & private equity firms Py = National scope with customers in 17 2277 ain states & Canada = ~270 customers * Dr
Slide 16: Credit Quality Strong
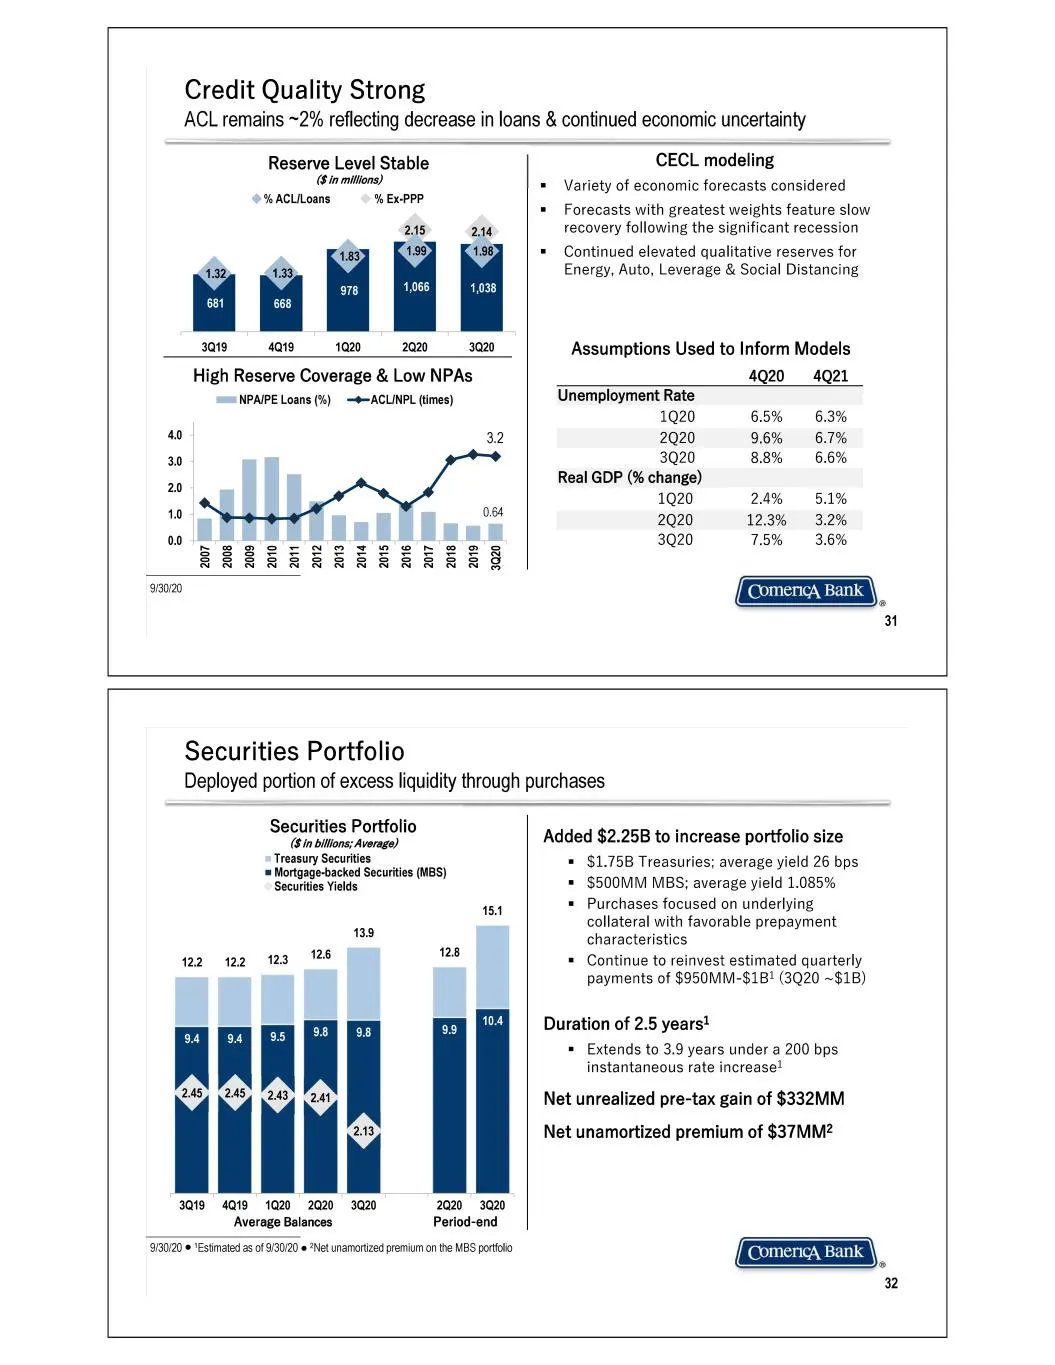
Credit Quality Strong ACL remains ~2% reflecting decrease in loans & continued economic uncertainty Reserve Level Stable (in milions) % ACLILoans G ExPPP 245 a 1.99) = | ai 7 * 3019 4019 1020 High Reserve Coverage & Low NPAs NPAIPE Loans (k) —®-ACLINPL (times) 40 3.2 3.0 1.0 0.64 CECL modeling * Var
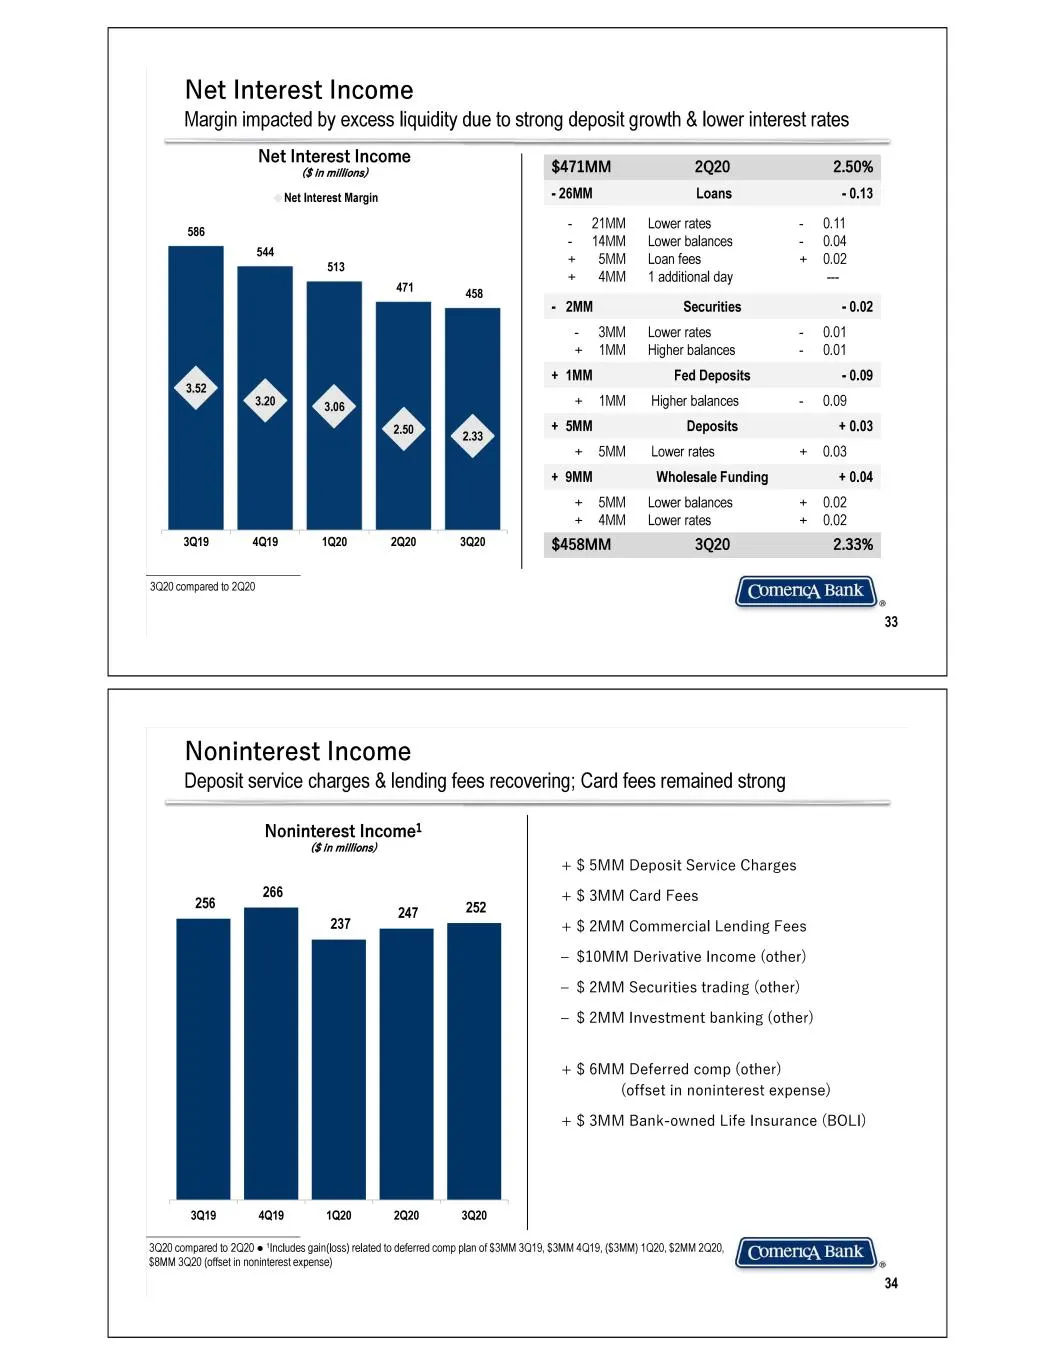
Slide 17: Net Interest Income
Net Interest Income Margin impacted by excess liquidity due to strong deposit growth & lower interest rates Net Interest Income (Sin millions) Net Interest Margin 586 544 513 . . , 3019 4019 1020 2020 3020 3020 compared to 2020, $471MM 2Q20 2.50% 26MM Loans 70.13 - 21MM Lower rates - 04 - 14MM Lower
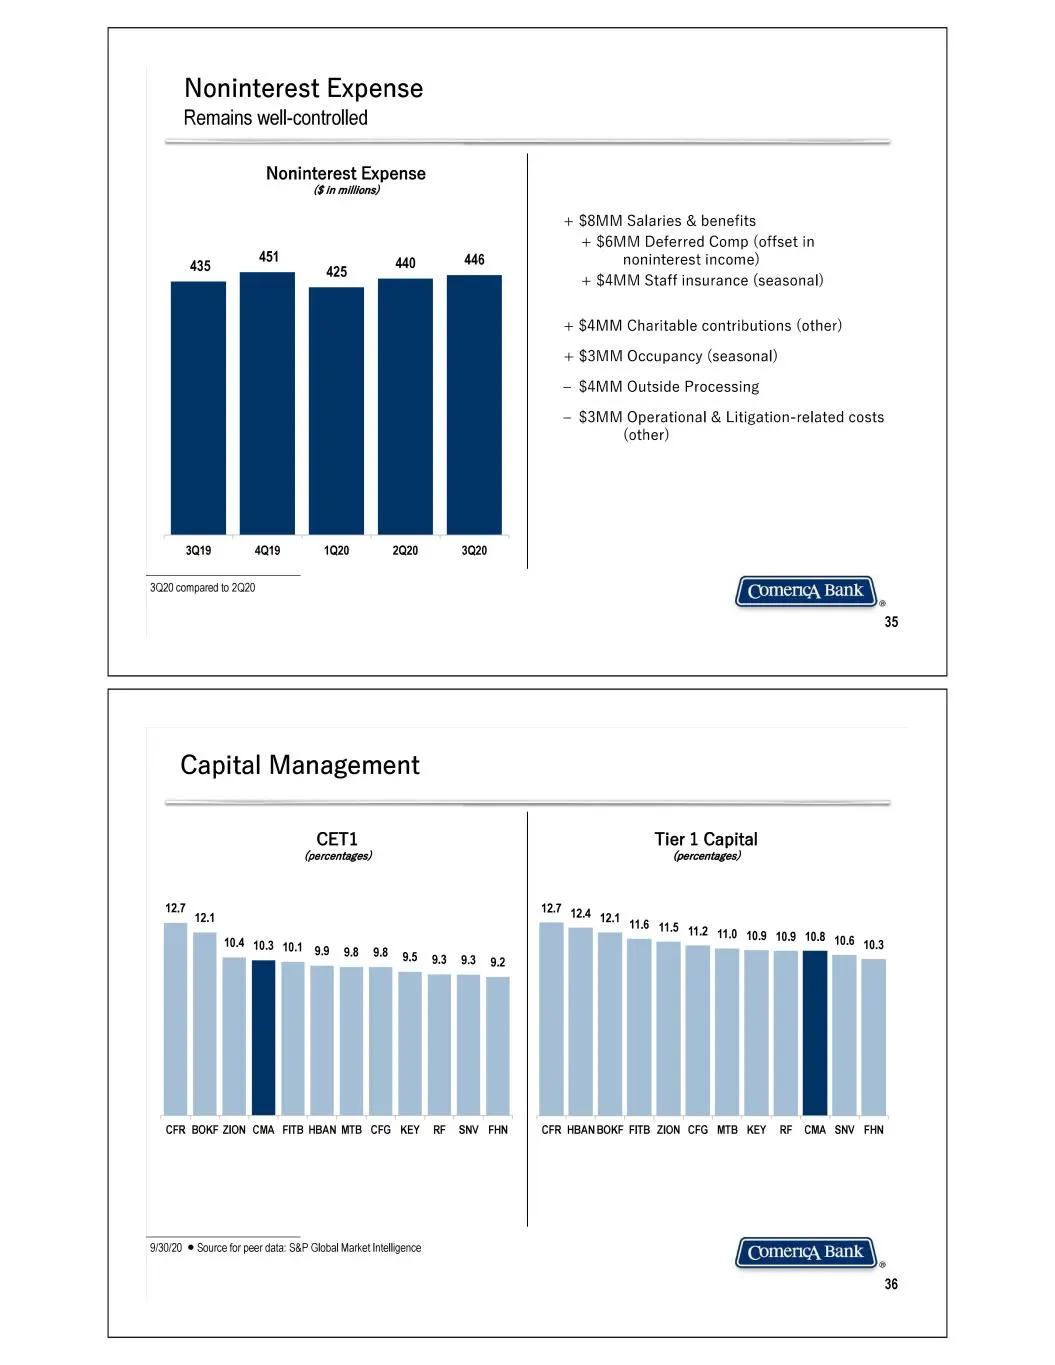
Slide 18: Noninterest Expense
Noninterest Expense Remains well-controlled Noninterest Expense (in millions) + S8MM Salaries & benefits + $6MM Deferred Comp (offset in 435 451 “8 440 446 noninterest income) + $4MM Staff insurance (seasonal) + S4MM Charitable contributions (other) + $3MM Occupancy (seasonal) — $4MM Outside Process
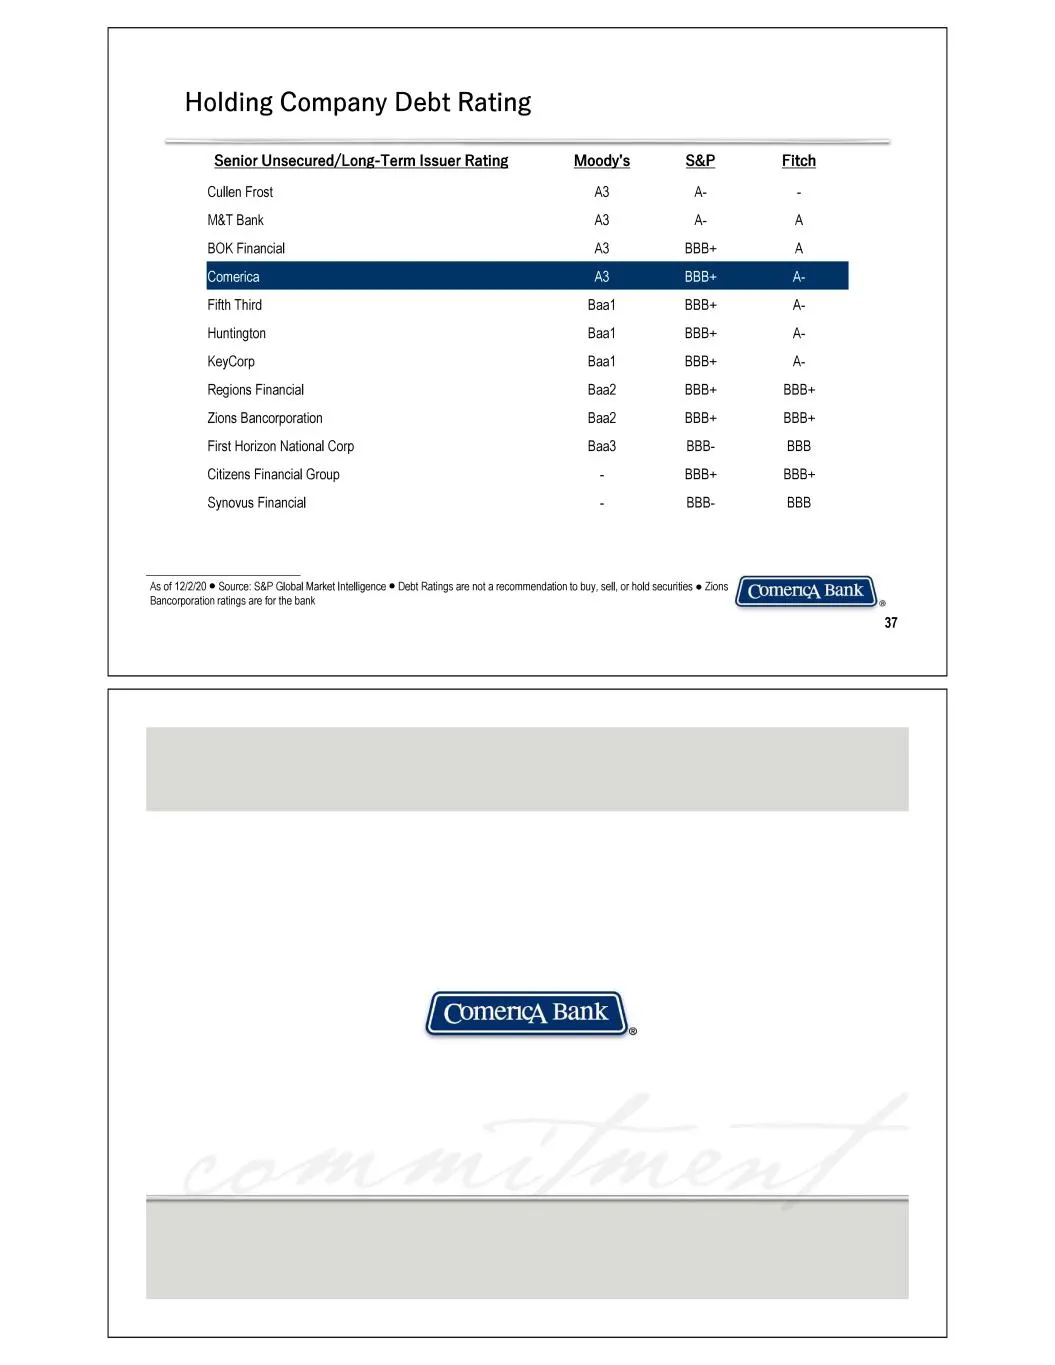
Slide 19: Holding Company Debt Rating
Holding Company Debt Rating ‘Senior Unsecured/Long-Term Issuer Rating Moody's S&P Eiteh Cullen Frost AZ A - M&qT Bank A3 A A 80K Financial 3 BBB+ Fifth Third Baat BBB+ A Huntington Baat BBB+ A KeyCorp Baat BBB+ Ae Regions Financial Baa2 BBB+ BBB+ Zions Bancorporation Baa2 BBB+ BBB+ First Horizon Nat
Source: SEC EDGAR · 8-K filed Dec 7, 2020
More decks from Comerica Incorporated
 Goldman Sachs Financial Services Conference 202520 slides · Dec 11, 2025
 Merger or Acquisition (October 2025)18 slides · Oct 6, 2025
 Barclays Global Financial Services Conference 202524 slides · Sep 8, 2025
 Q2 2025 Earnings Presentation24 slides · Jul 18, 2025
 Q1 2025 Earnings Presentation21 slides · Apr 21, 2025
 Q4 2024 Earnings Presentation24 slides · Jan 22, 2025