Veritex — Debt Investor Presentation (November 2019)
38 slides from Veritex's debt investor presentation, Nov 8, 2019
Slide 1: Private Placement of Subordinated Notes
Exhibit 99.2 V E R I T E X Private Placement of Subordinated Notes Nasdaq: VBTX October 23, 2019

Slide 2: Confidentiality Notice and Safe Harbor Statement
* Confidentiality Notice and Safe Harbor Statement Veritex Holdings, Inc. (“Veritex” or the “Company”) has engaged Sandler O'Neill + Partners, L.P. and Keefe, Bruyette & Woods, Inc. (collectively, the “Agents” to exclusively assist the Company in exploring a potential private placement of subordinat
Slide 3: Forward-looking Statements
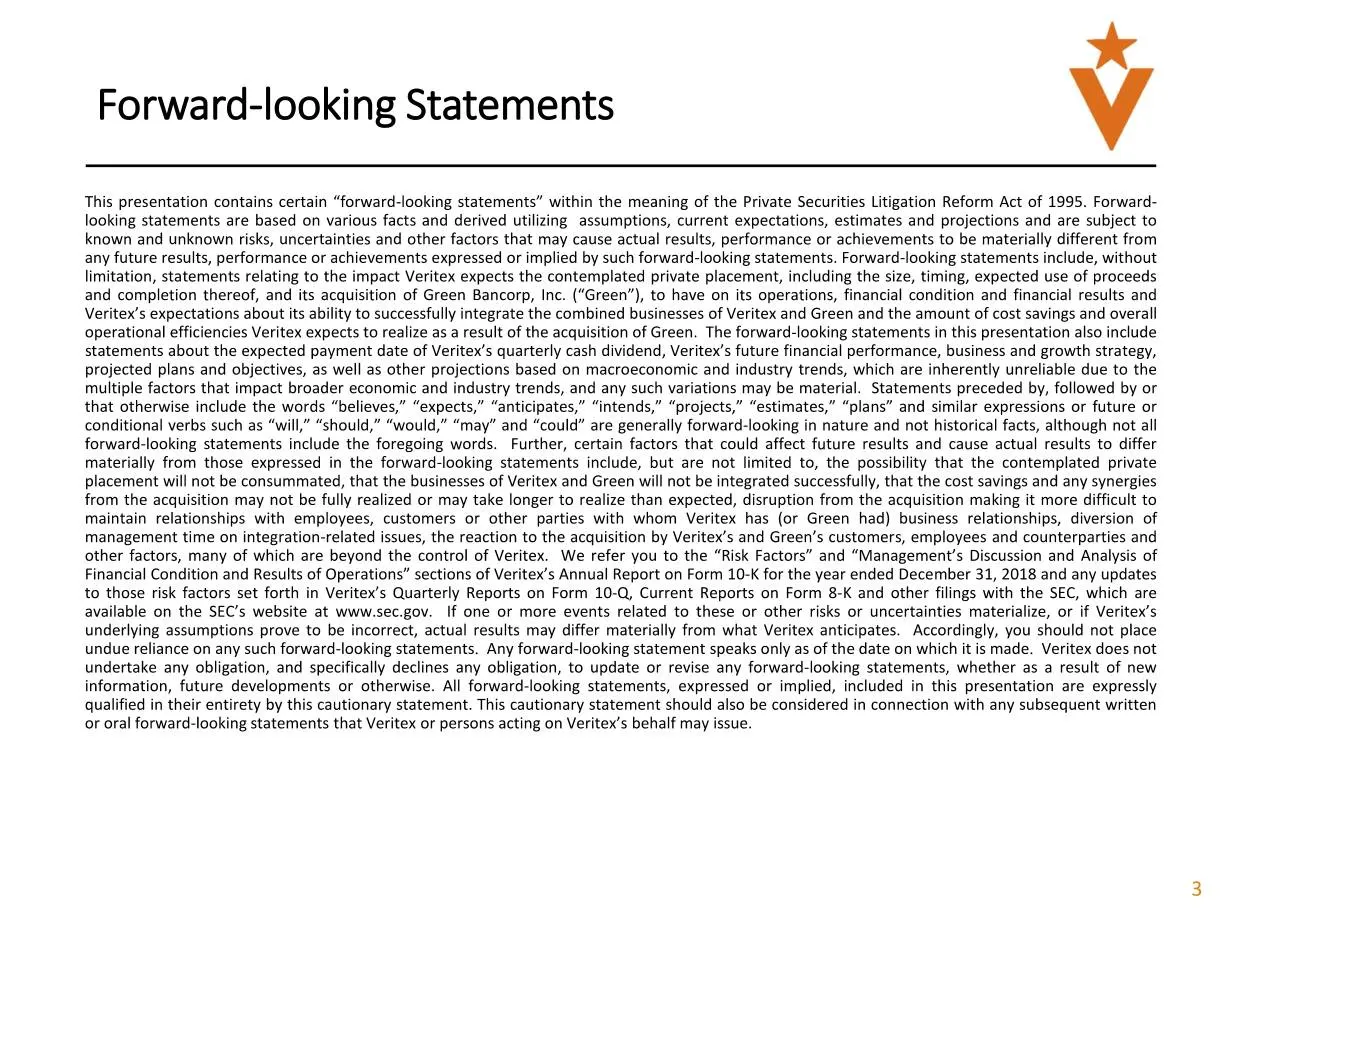
* Forward-looking Statements This presentation contains certain “forward-looking statements” within the meaning of the Private Securities Litigation Reform Act of 1995. Forward- looking statements are based on various facts and derived utilizing assumptions, current expectations, estimates and proje
Slide 4: Non-GAAP Financial Measures
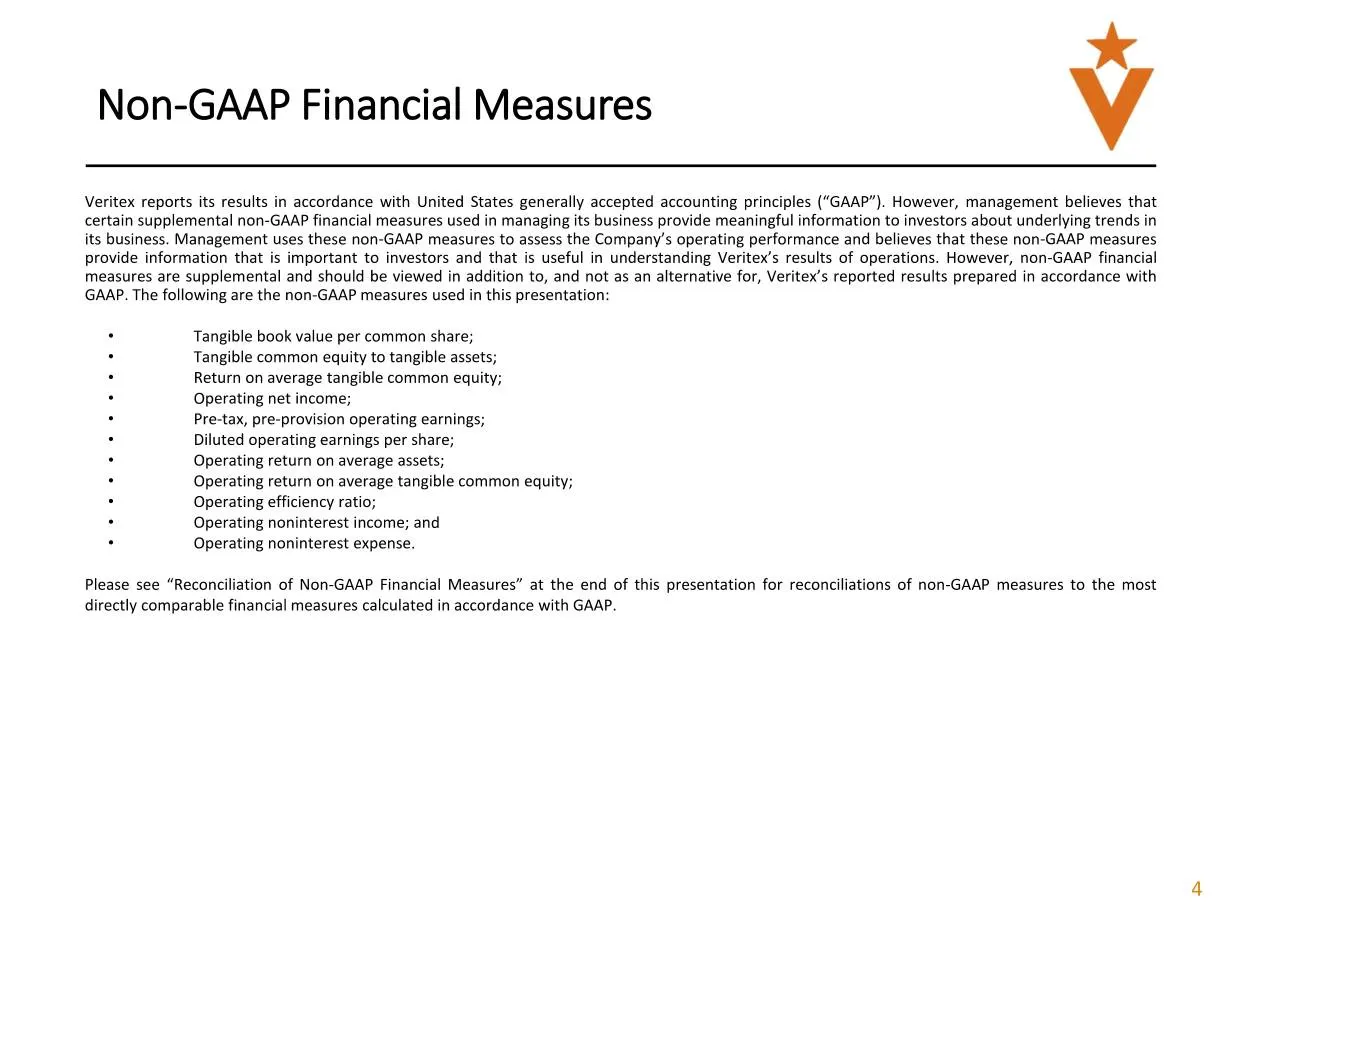
* Non-GAAP Financial Measures Veritex reports its results in accordance with United States generally accepted accounting principles (“GAAP”). However, management believes that certain supplemental non-GAAP financial measures used in managing its business provide meaningful information to investors a
Slide 5: Expected Terms of the Proposed Offering
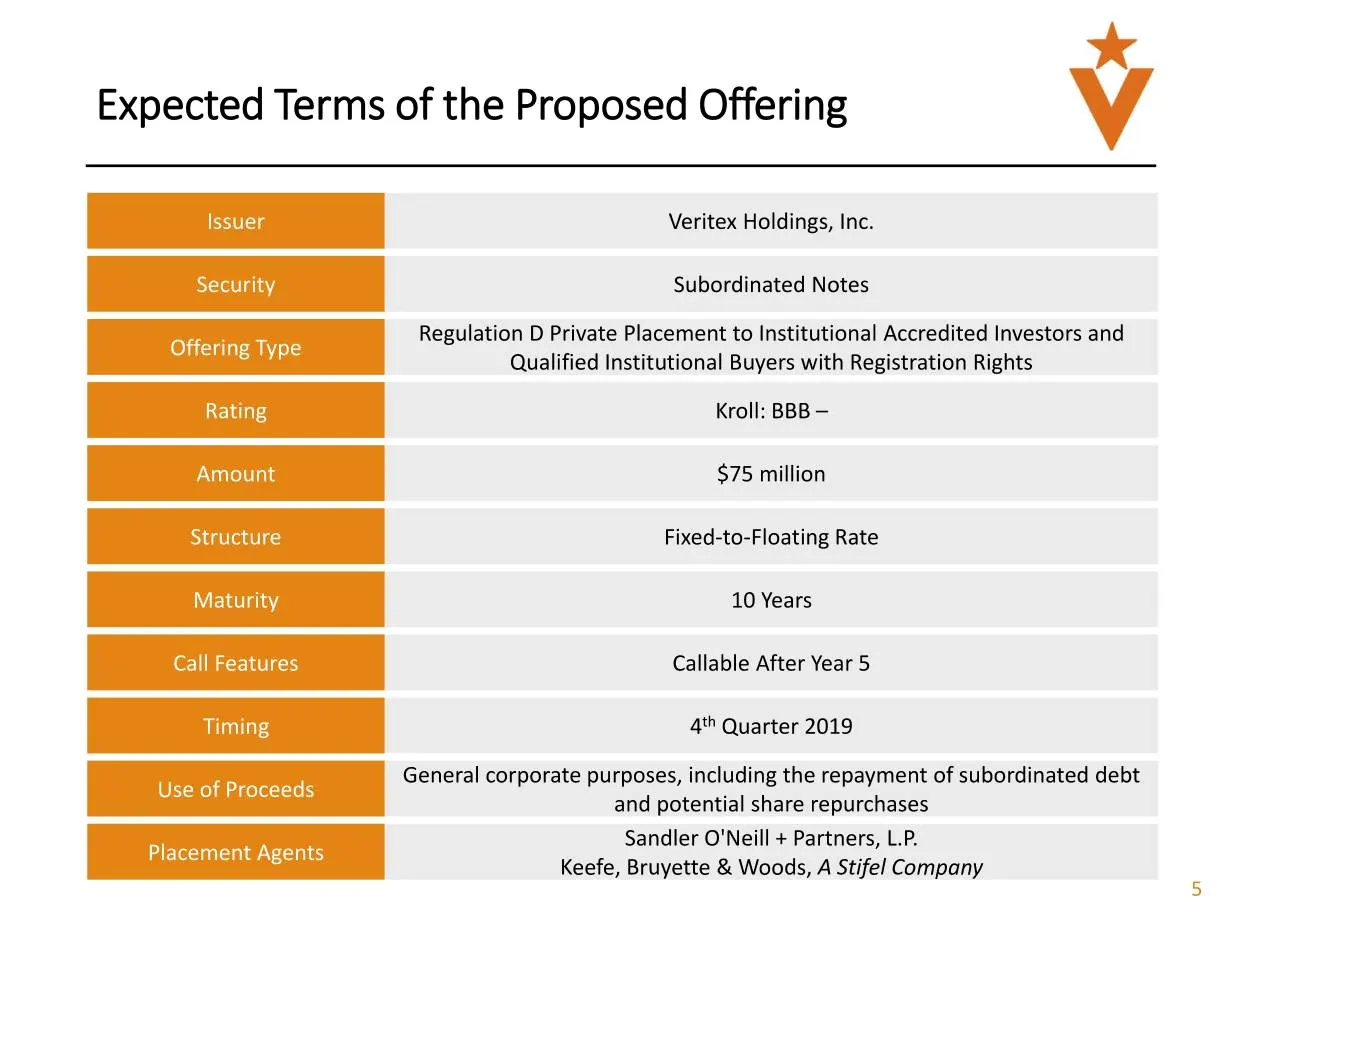
* Expected Terms of the Proposed Offering Vv Offering Type Regulation D Private Placement to Institutional Accredited Investors and ue Qualified Institutional Buyers with Registration Rights Call Fe: Use of Proceeds General corporate purposes, including the repayment of subordinated debt and potenti
Slide 6: Overview of Franchise
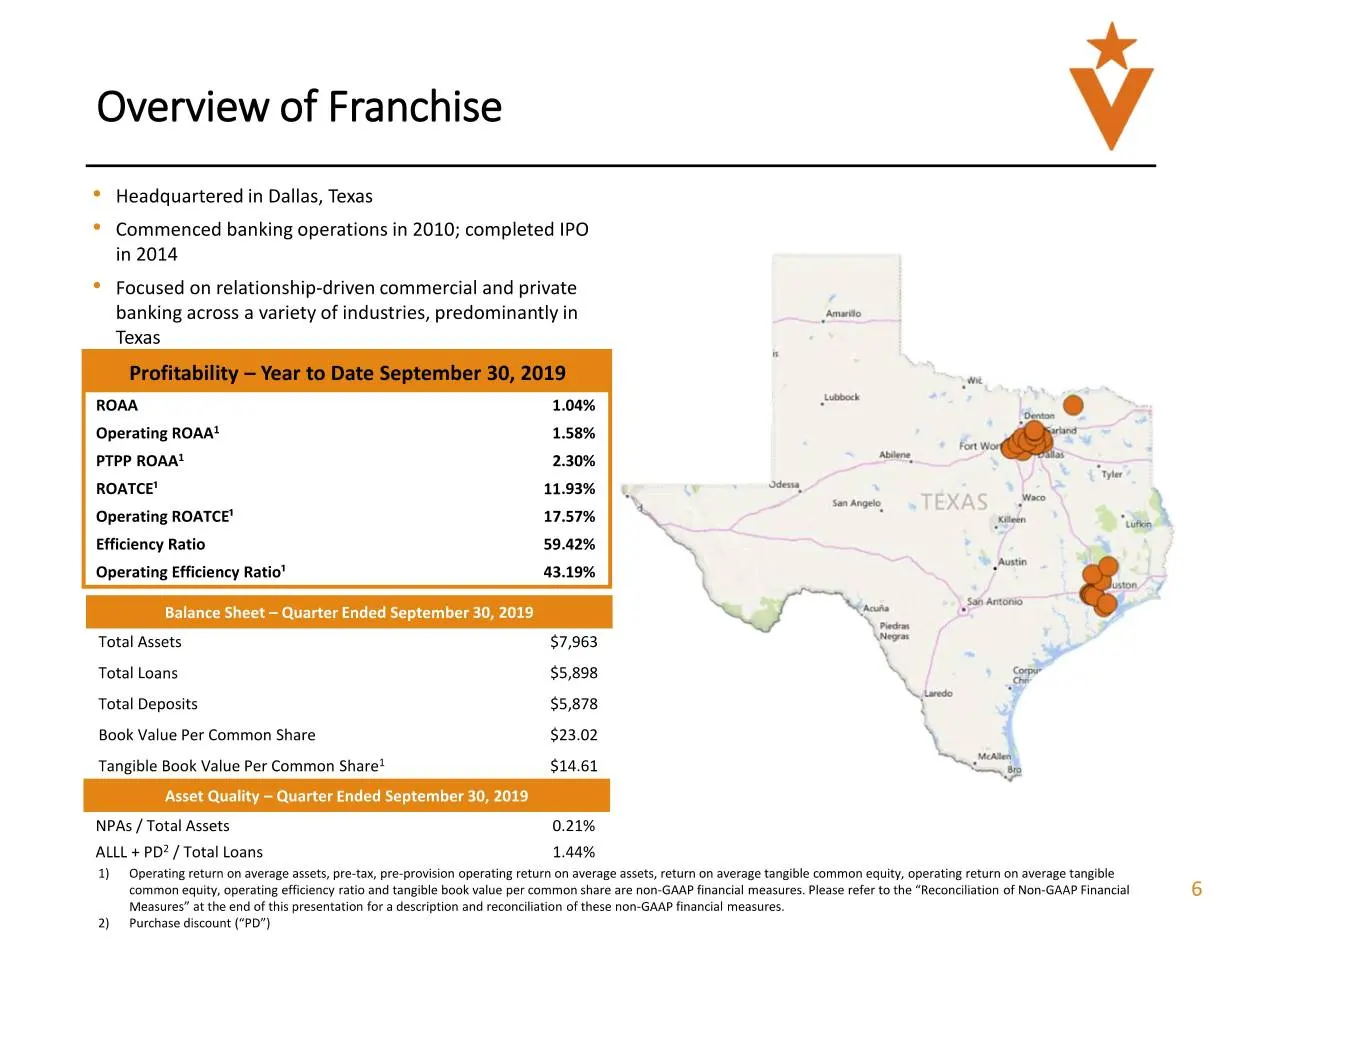
Overview of Franchise * Headquartered in Dallas, Texas * Commenced banking operations in 2010; completed IPO in 2014 * Focused on relationship-driven commercial and private banking across a variety of industries, predominantly in Amatito Texas Lubbook ROAA Operating ROAA? PTPP ROAA* ane ROATCE’ & os
Slide 7: Franchise Highlights
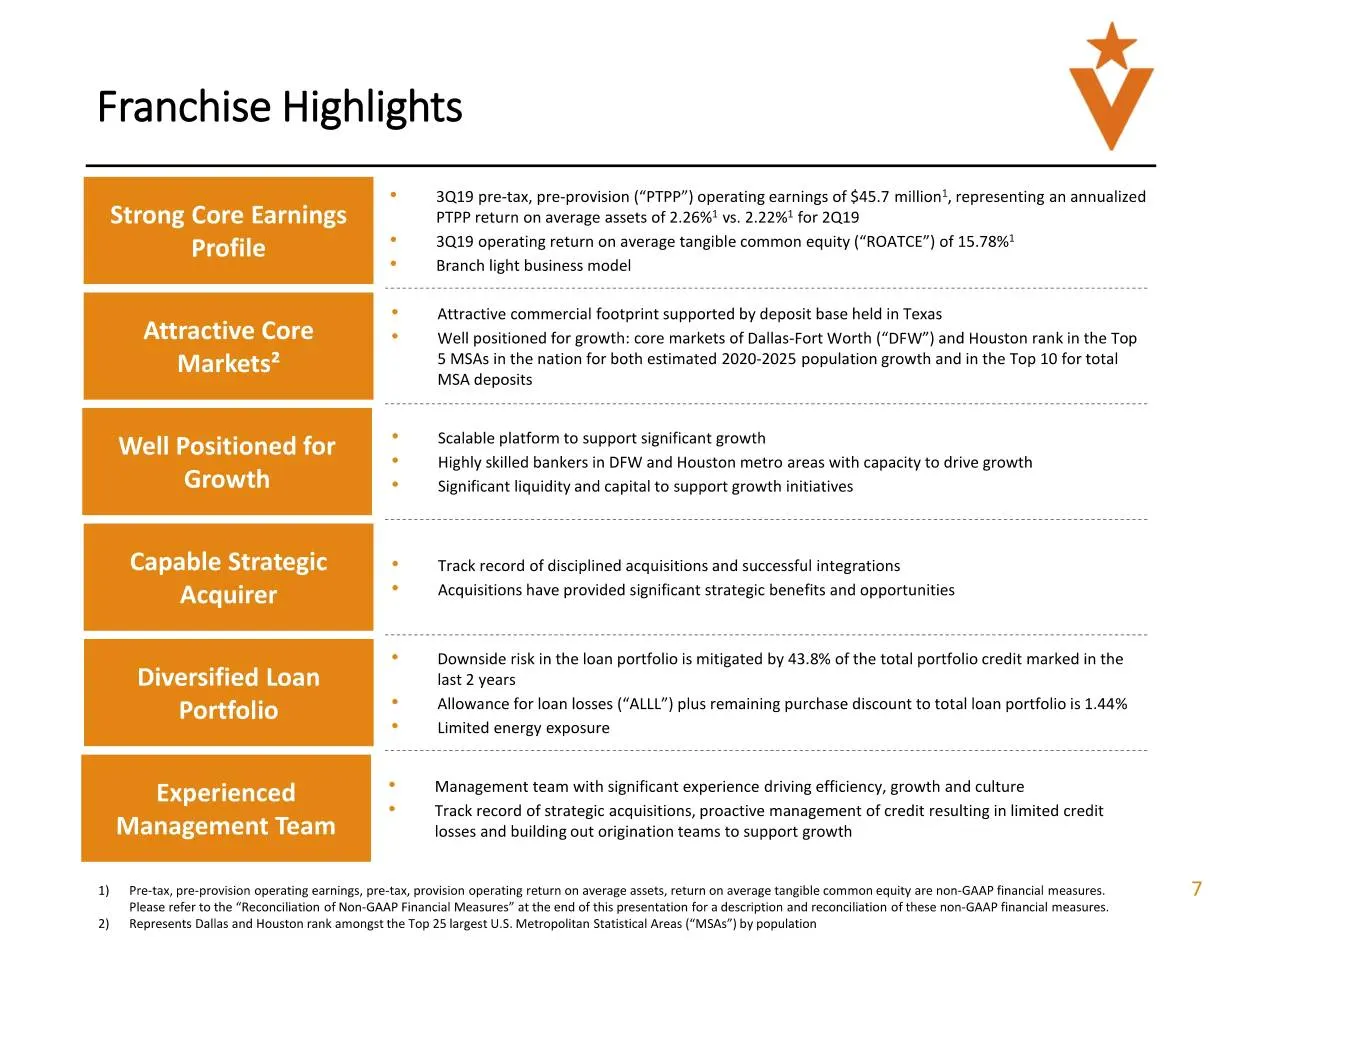
Me! Franchise Highlights Strong Core Earnings Profile Attractive Core Markets? Well Positioned for Growth Capable Strategic Acquirer Diversified Loan Portfolio Experienced Management Team 3Q19 pre-tax, pre-provision (“PTPP”) operating earnings of $45.7 million?, representing an annualized PTPP retur
Slide 8: Texas Deposit Market Share & Branch Presence
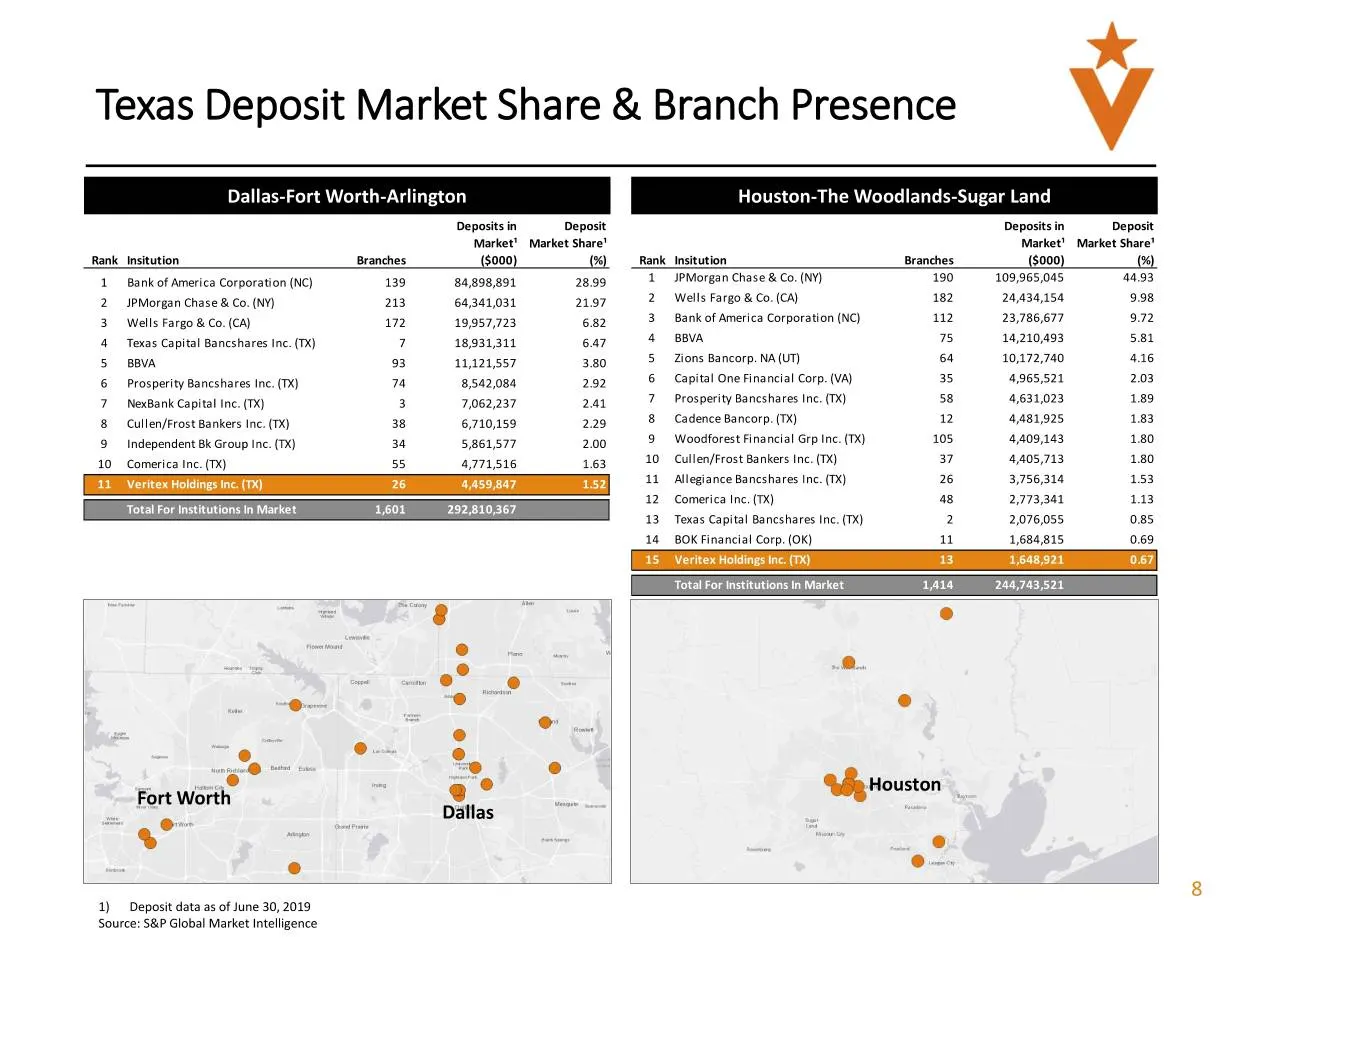
* Texas Deposit Market Share & Branch Presence Dallas-Fort Worth-Arlington Houston-The Woodlands-Sugar Land Deposits in Depositsin Deposit Market’ Market Share! Market Market Share? Rank_Insitution Branches ($000) (%). Rank_Insitution Branches ($000) (%) 1 Bankof America Corporation (NC) 139 ——84,89
Slide 9: Well-Positioned in Attractive Texas Markets
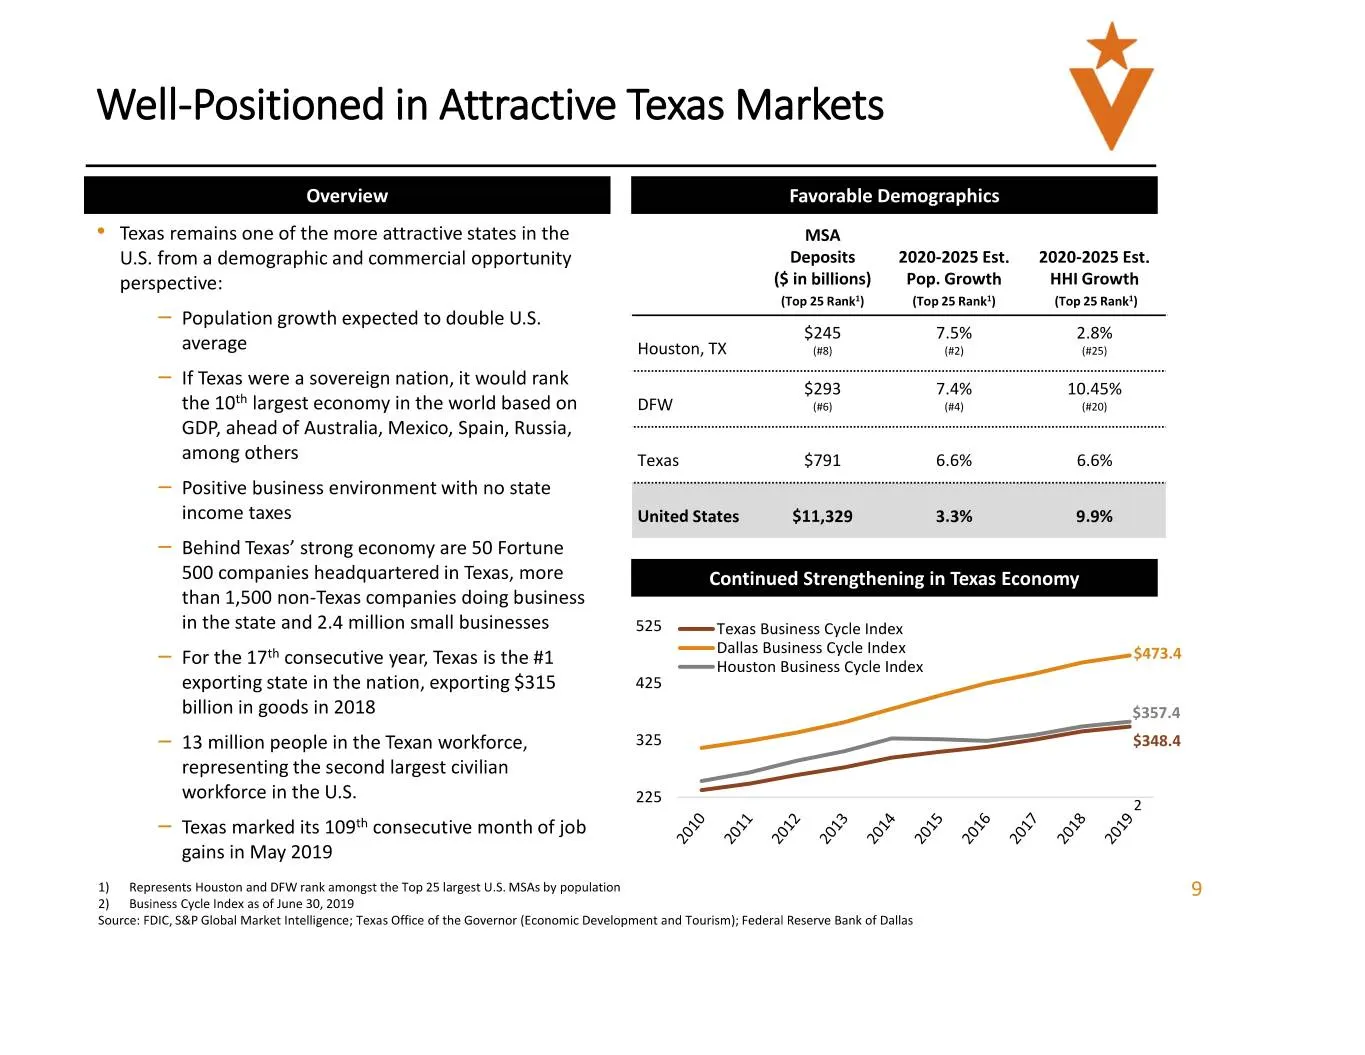
* Well-Positioned in Attractive Texas Markets * Texas remains one of the more attractive states in the MSA U.S. from a demographic and commercial opportunity Deposits 2020-2025Est. 2020-2025 Est. perspective: (Sinbillions) Pop. Growth HHI Growth (Top 25 Rank’) (Top 25 Rank’) (Top 25 Rank’) — Populat
Slide 10: Proven Track Record as a Strategic Acquirer
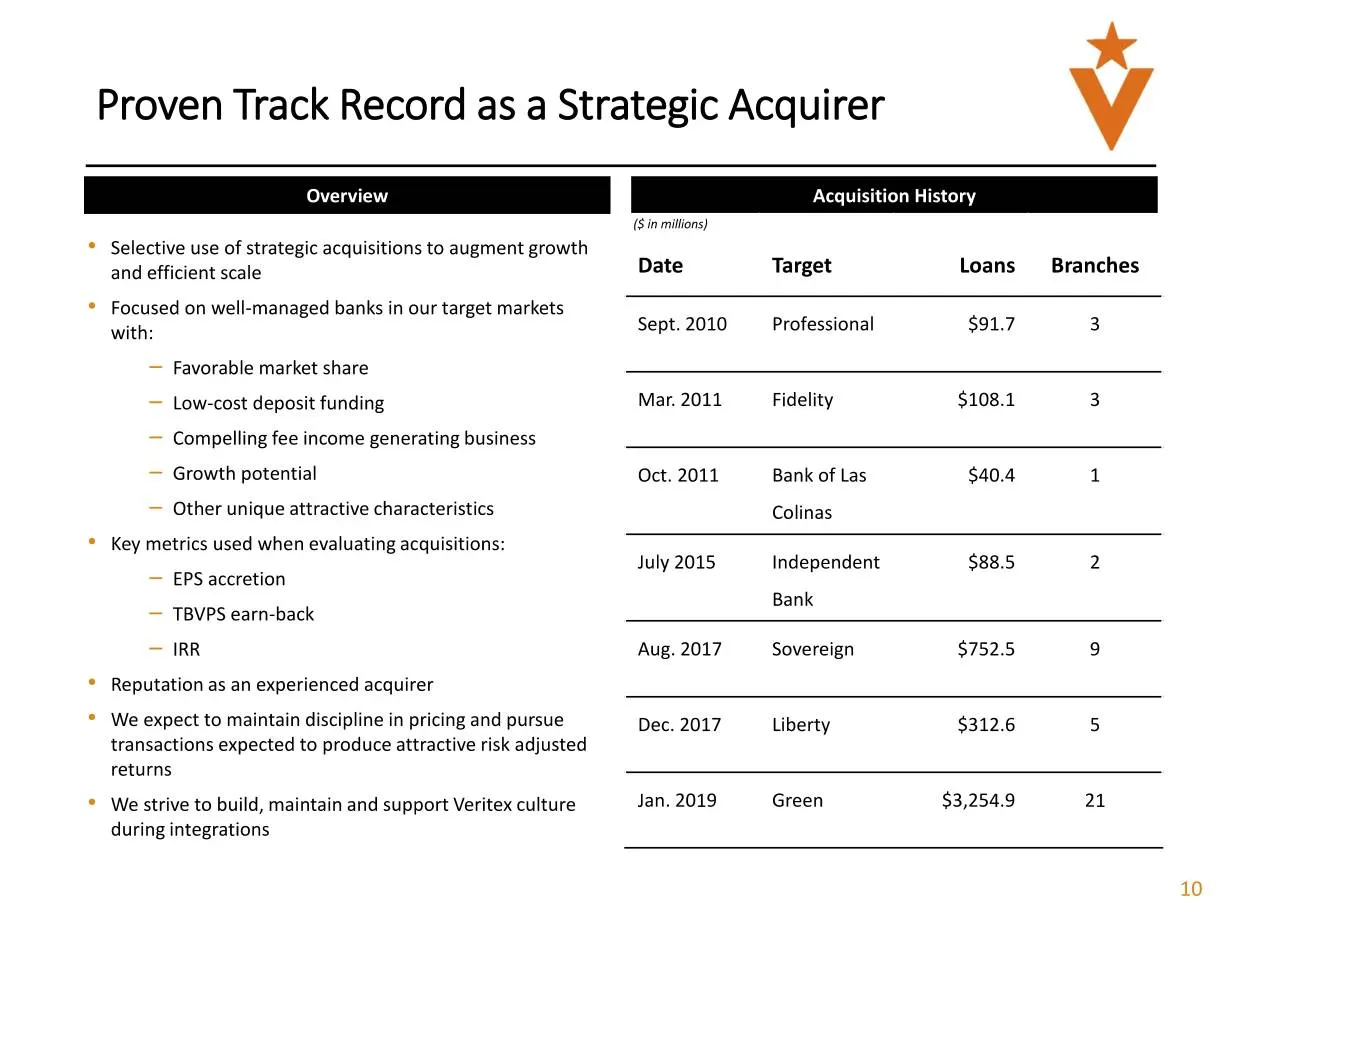
Proven Track Record as a Strategic Acquirer * Selective use of strategic acquisitions to augment growth and efficient scale * Focused on well-managed banks in our target markets with: — Favorable market share — Low-cost deposit funding — Compelling fee income generating business — Growth potential —
Slide 11: Third Quarter 2019 Highlights
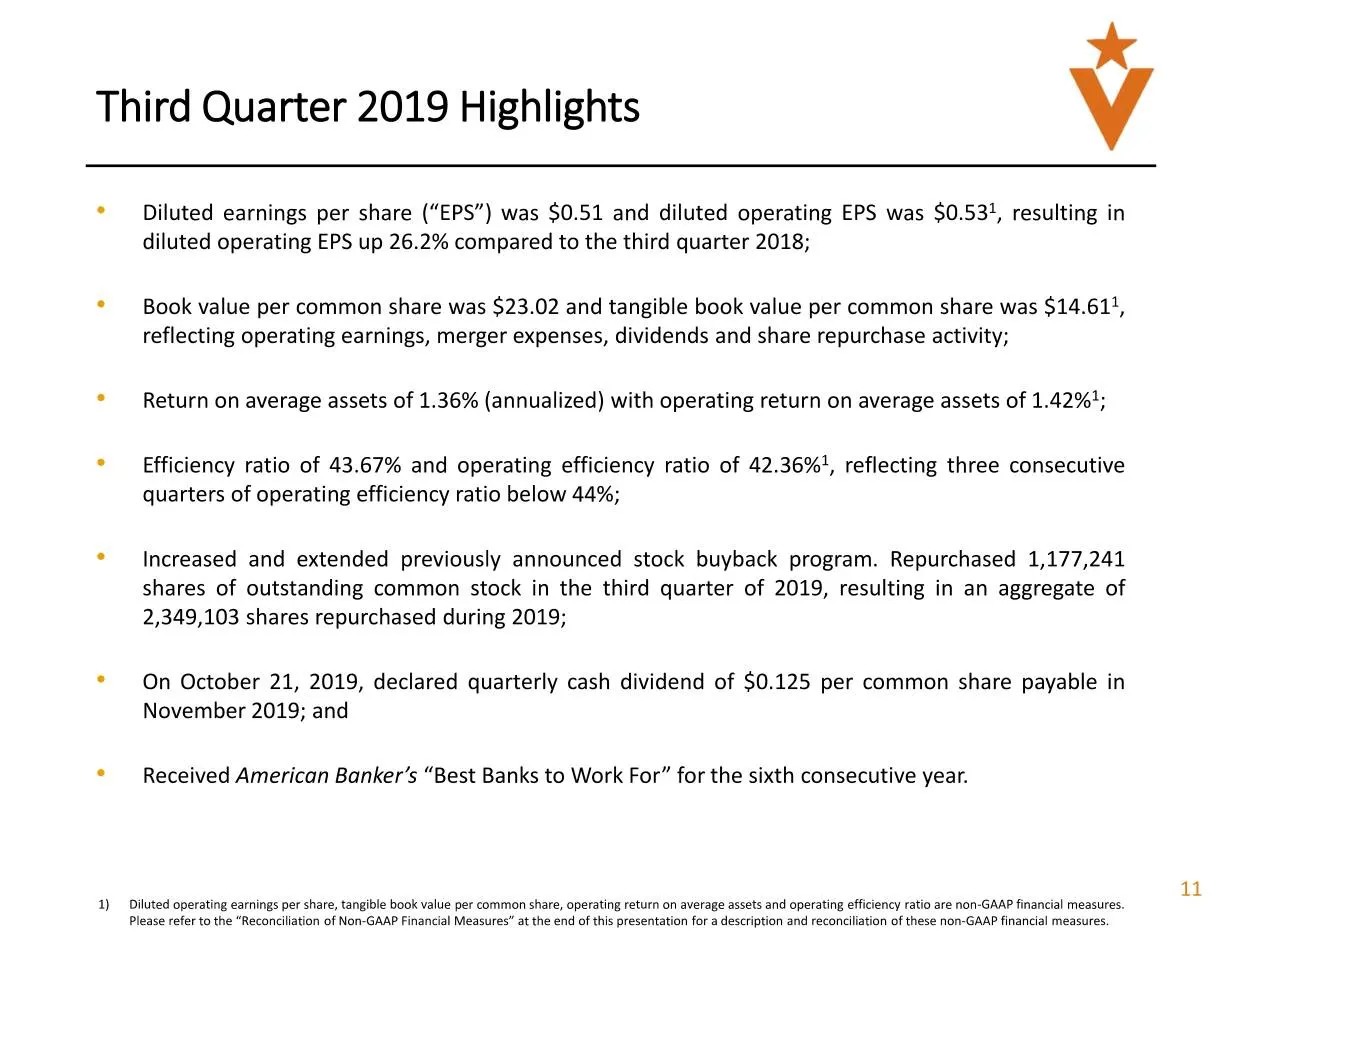
* Third Quarter 2019 Highlights * Diluted earnings per share (“EPS”) was $0.51 and diluted operating EPS was $0.53, resulting in diluted operating EPS up 26.2% compared to the third quarter 2018; * Book value per common share was $23.02 and tangible book value per common share was $14.61!, reflectin
Slide 12: Outlook and Focus Through 2020
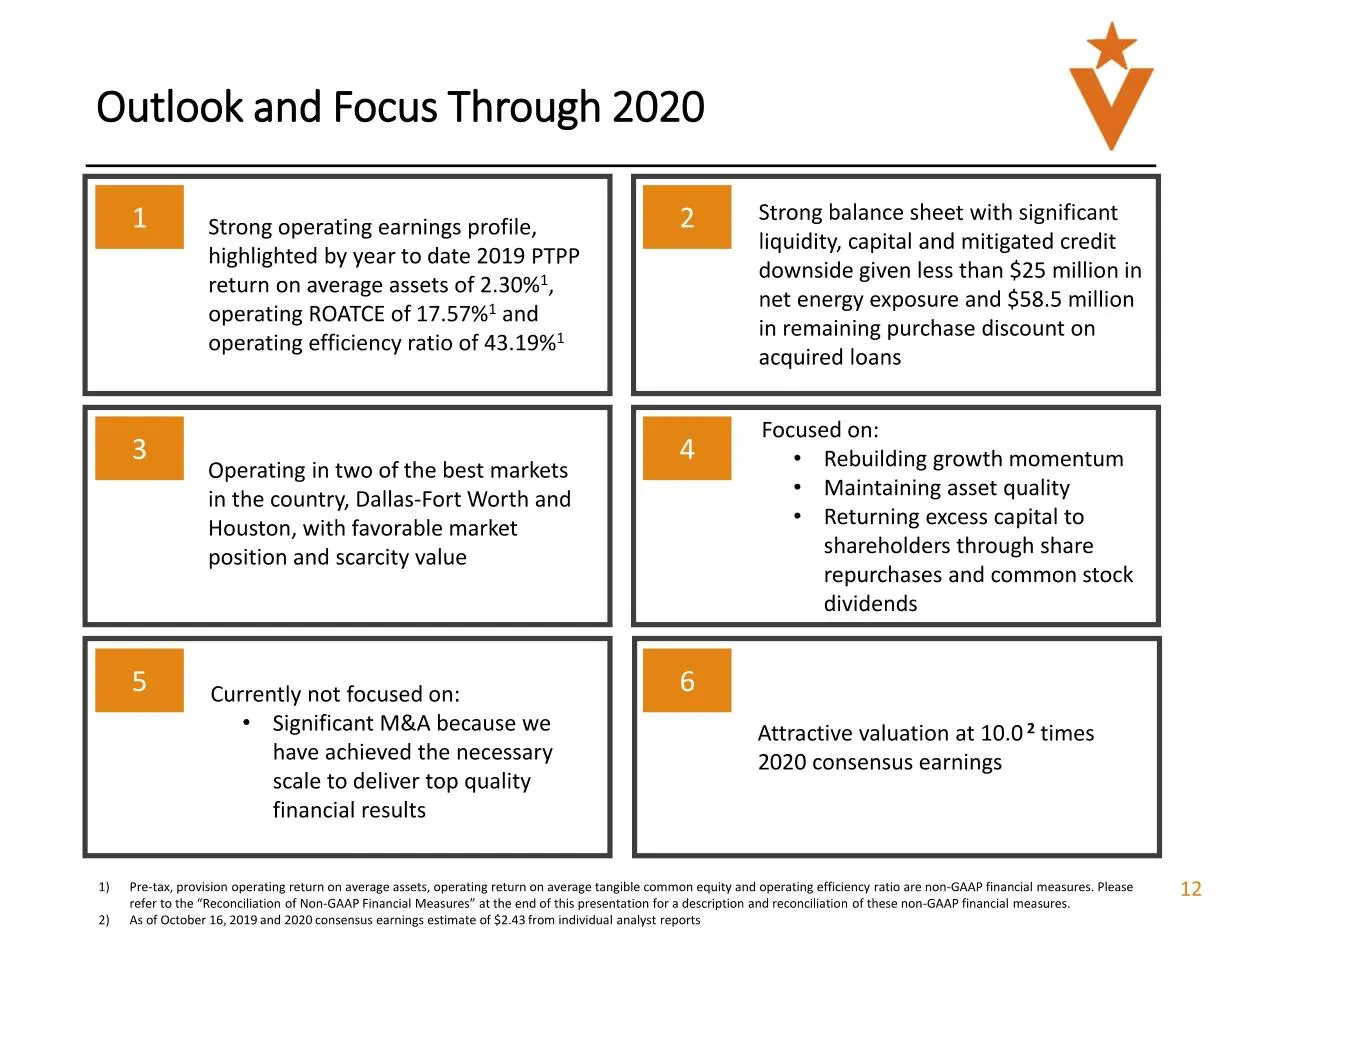
Outlook and Focus Through 2020 Strong operating earnings profile, highlighted by year to date 2019 PTPP return on average assets of 2.30%!, operating ROATCE of 17.57%! and operating efficiency ratio of 43.19%! Operating in two of the best markets in the country, Dallas-Fort Worth and Houston, with f
Slide 13: Balance Sheet Trends
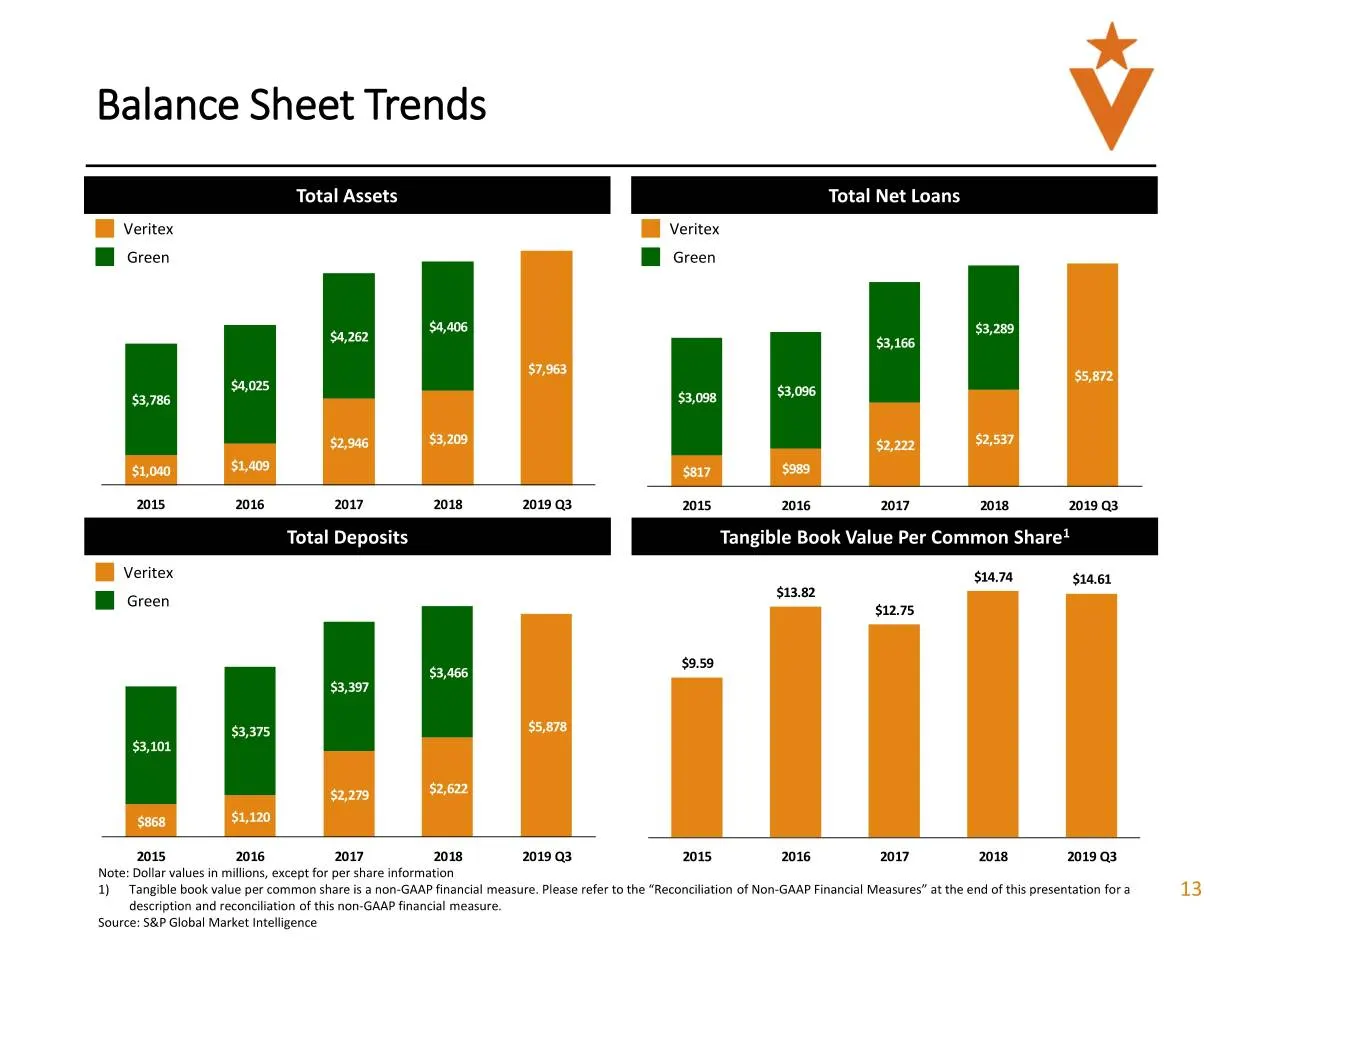
Balance Sheet Trends Total Assets Total Net Loans BB veritex BD veritex I Green I Green $4,262 estes Pc) $7,963 7 $4,025 $3,096 $5,872 $3,786 $3,098 $3,209 $2,537 $1,040 $3,408 2016 2019 03, 2016 2019 Q3 Total Deposits Tangible Book Value Per Common Shar BD Veritex $14.74 $14.61 I Green $13.82 $12.7
Slide 14: Profitability Performance
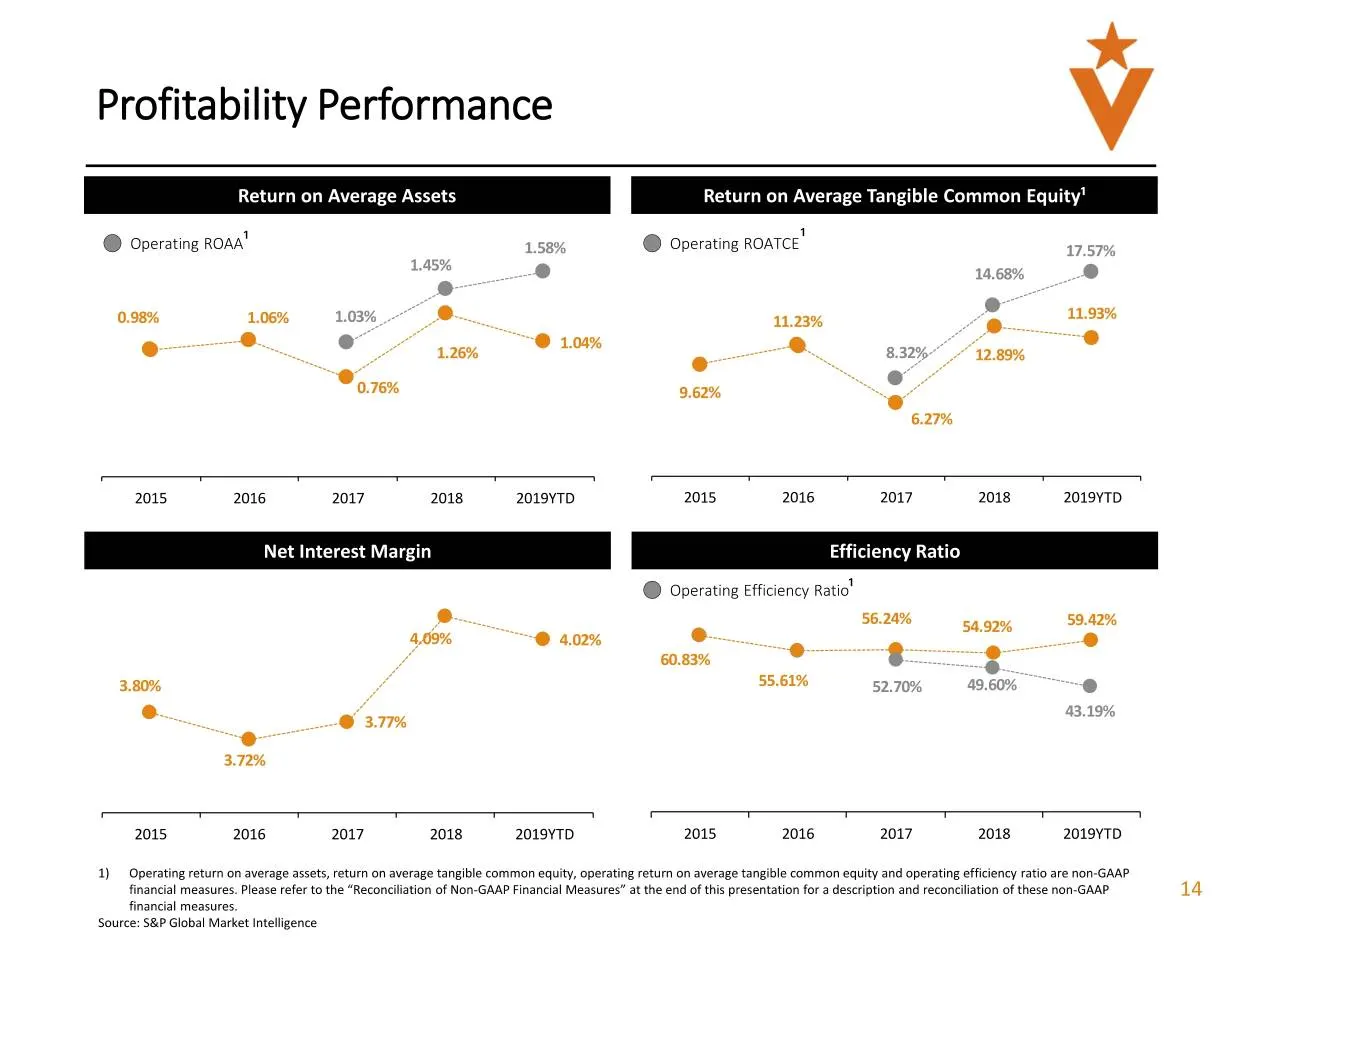
Profitability Performance Return on Average Assets Return on Average Tan; 1 @ Operating ROA’ 1.58% @ Operating ROATCE ® 0.98% 1.06% 1.039 ® 11.23% ii 2 e e 1.26% © 204% @. 2 12.89% e e 0.76% 9.62% 6.27% 2015 2016 2017 2018 2019YTD 2015 2016 2017 2018 2019YTD Net Interest Margin Efficiency Ratio @ Op
Slide 15: Net Interest Income
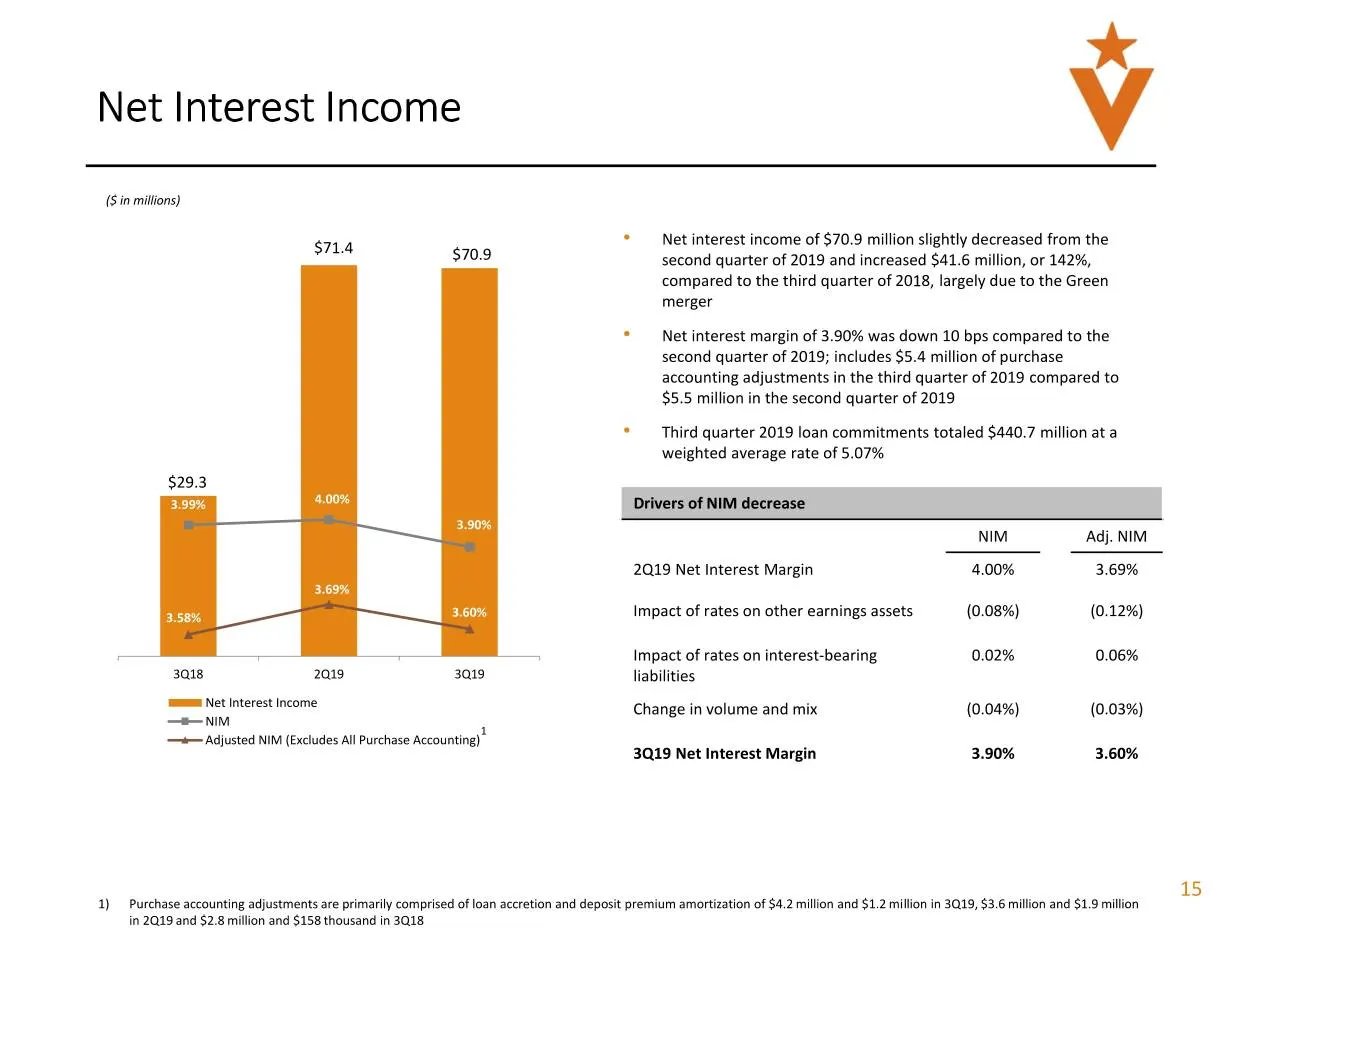
Net Interest Income (Sin millions) Me! $71.4 . Net interest income of $70.9 million slightly decreased from the “ $70.9 second quarter of 2019 and increased $41.6 million, or 142%, merger weighted average rate of 5.07% Drivers of NIM decrease compared to the third quarter of 2018, largely due to the
Slide 16: Operating Noninterest Income
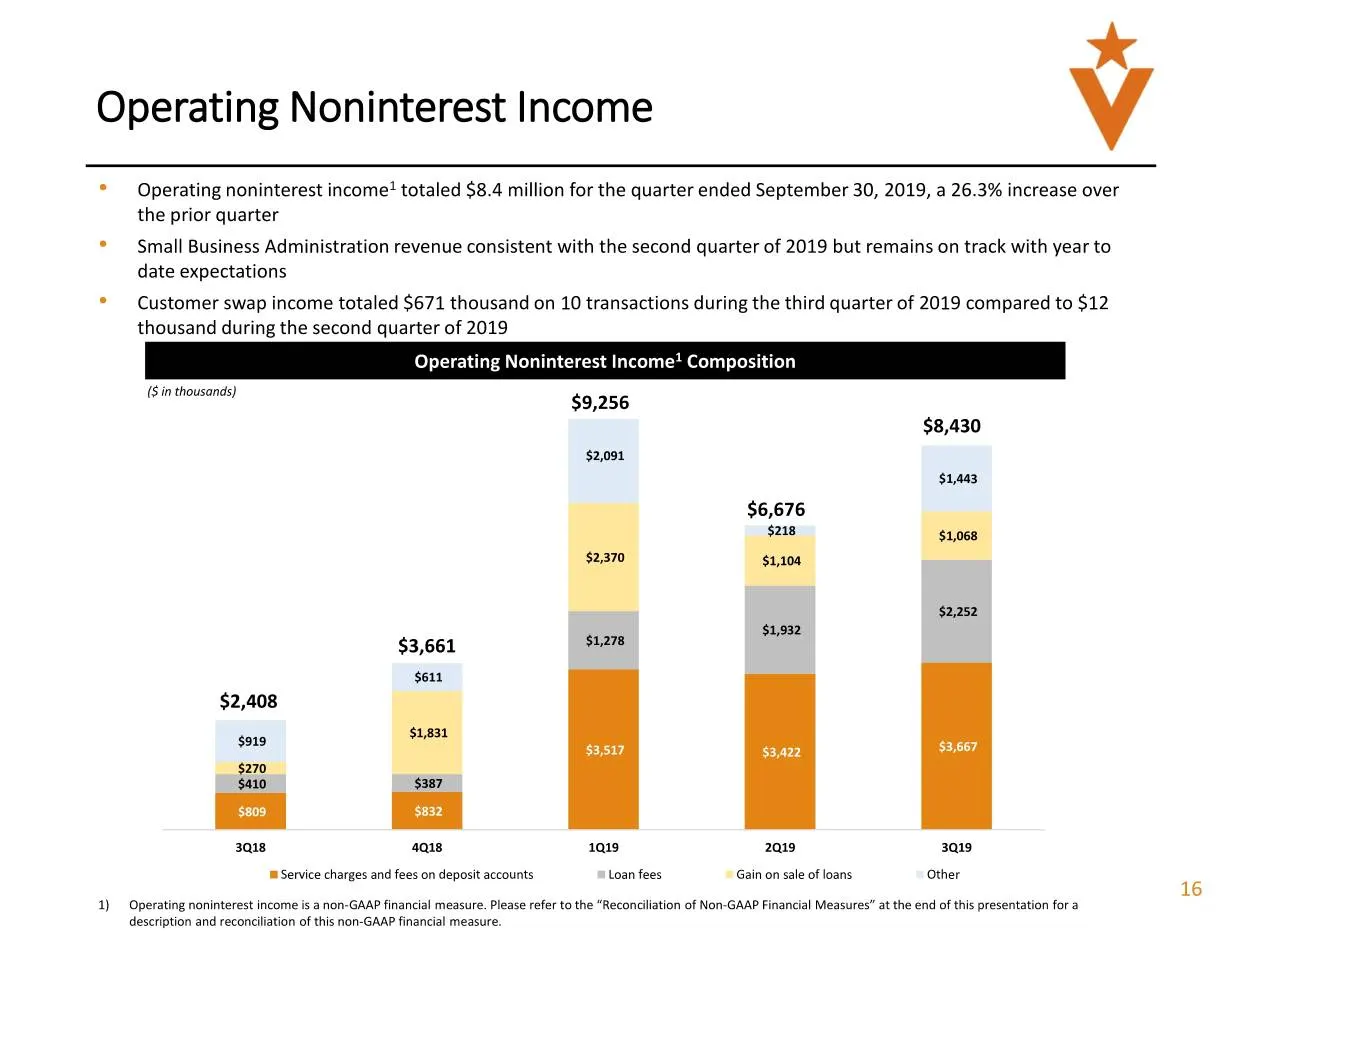
* Operating Noninterest Income Operating noninterest income? totaled $8.4 million for the quarter ended September 30, 2019, a 26.3% increase over the prior quarter Small Business Administration revenue consistent with the second quarter of 2019 but remains on track with year to date expectations Cus
Slide 17: Operating Noninterest Expense
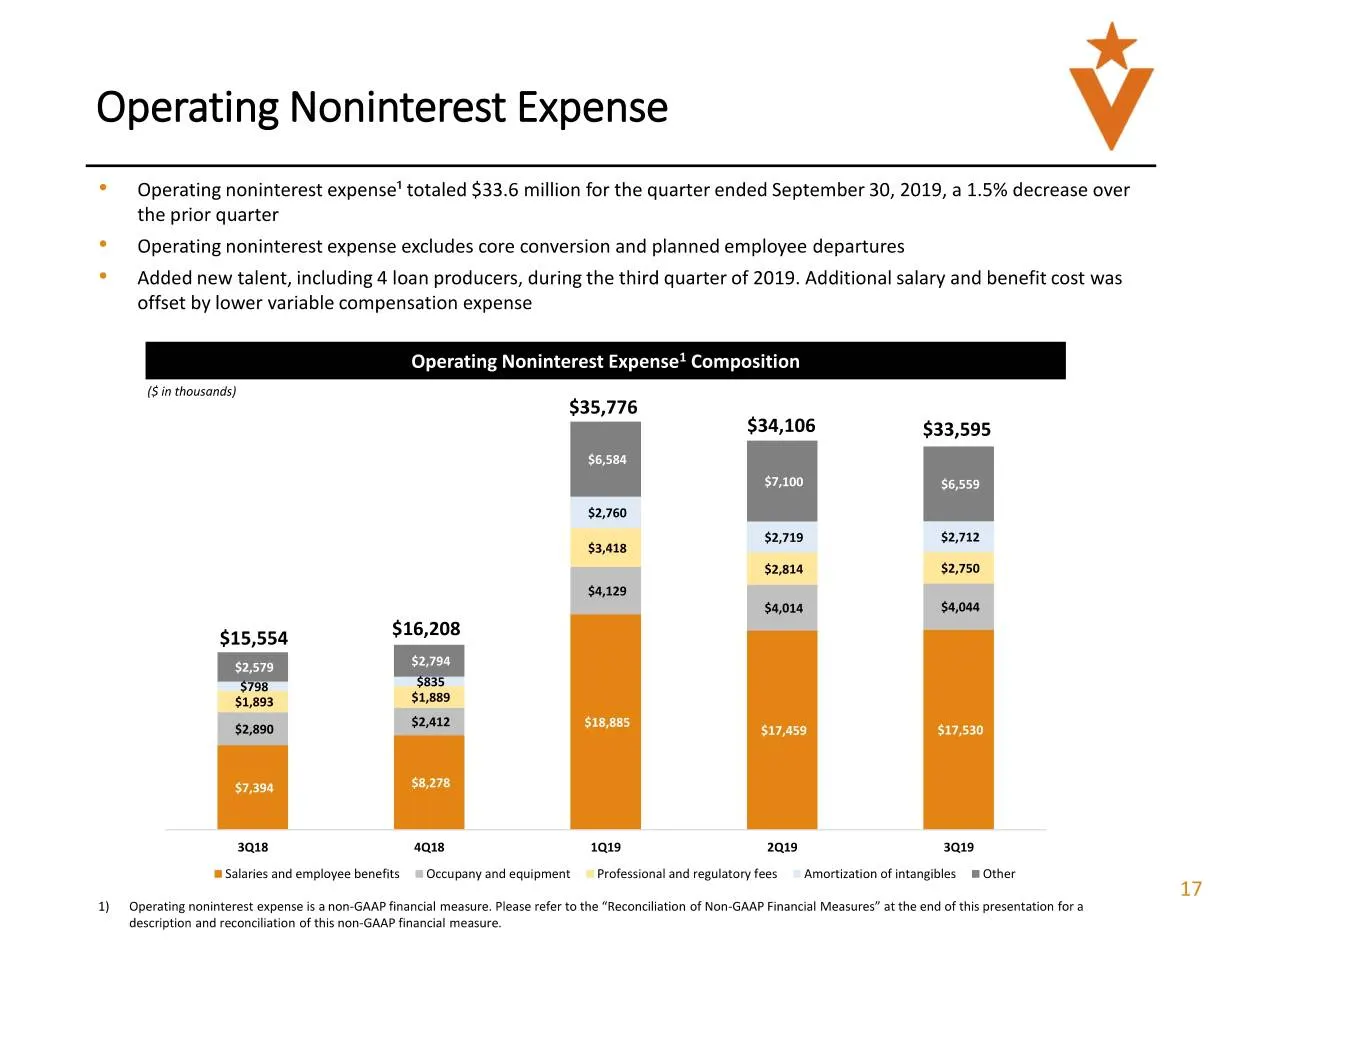
* Operating Noninterest Expense Operating noninterest expense’ totaled $33.6 million for the quarter ended September 30, 2019, a 1.5% decrease over the prior quarter Operating noninterest expense excludes core conversion and planned employee departures * Added new talent, including 4 loan producers,
Slide 18: Loans Held For Investment
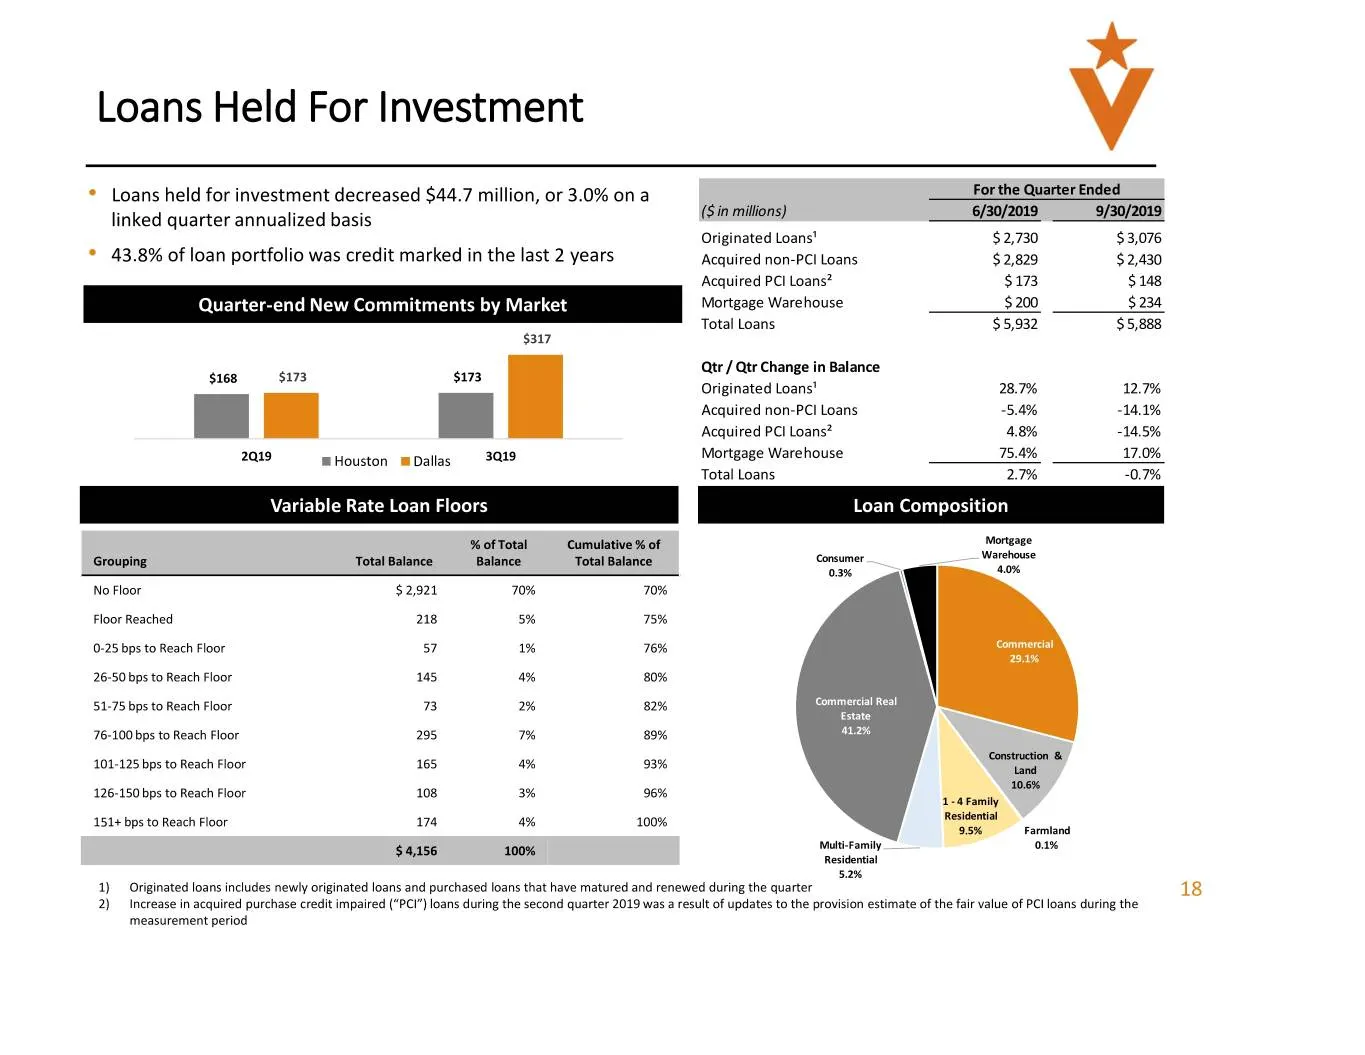
* Loans Held For Investment * Loans held for investment decreased $44.7 million, or 3.0% ona —— ___Forthe Quarter Ended _ linked quarter annualized basis laos) a / 50/019 eS 20/2019 Originated Loans" $2,730 $3,076 * 43.8% of loan portfolio was credit marked in the last 2 years Acquired non-PCl Loans
Slide 19: Historical Loan Portfolio
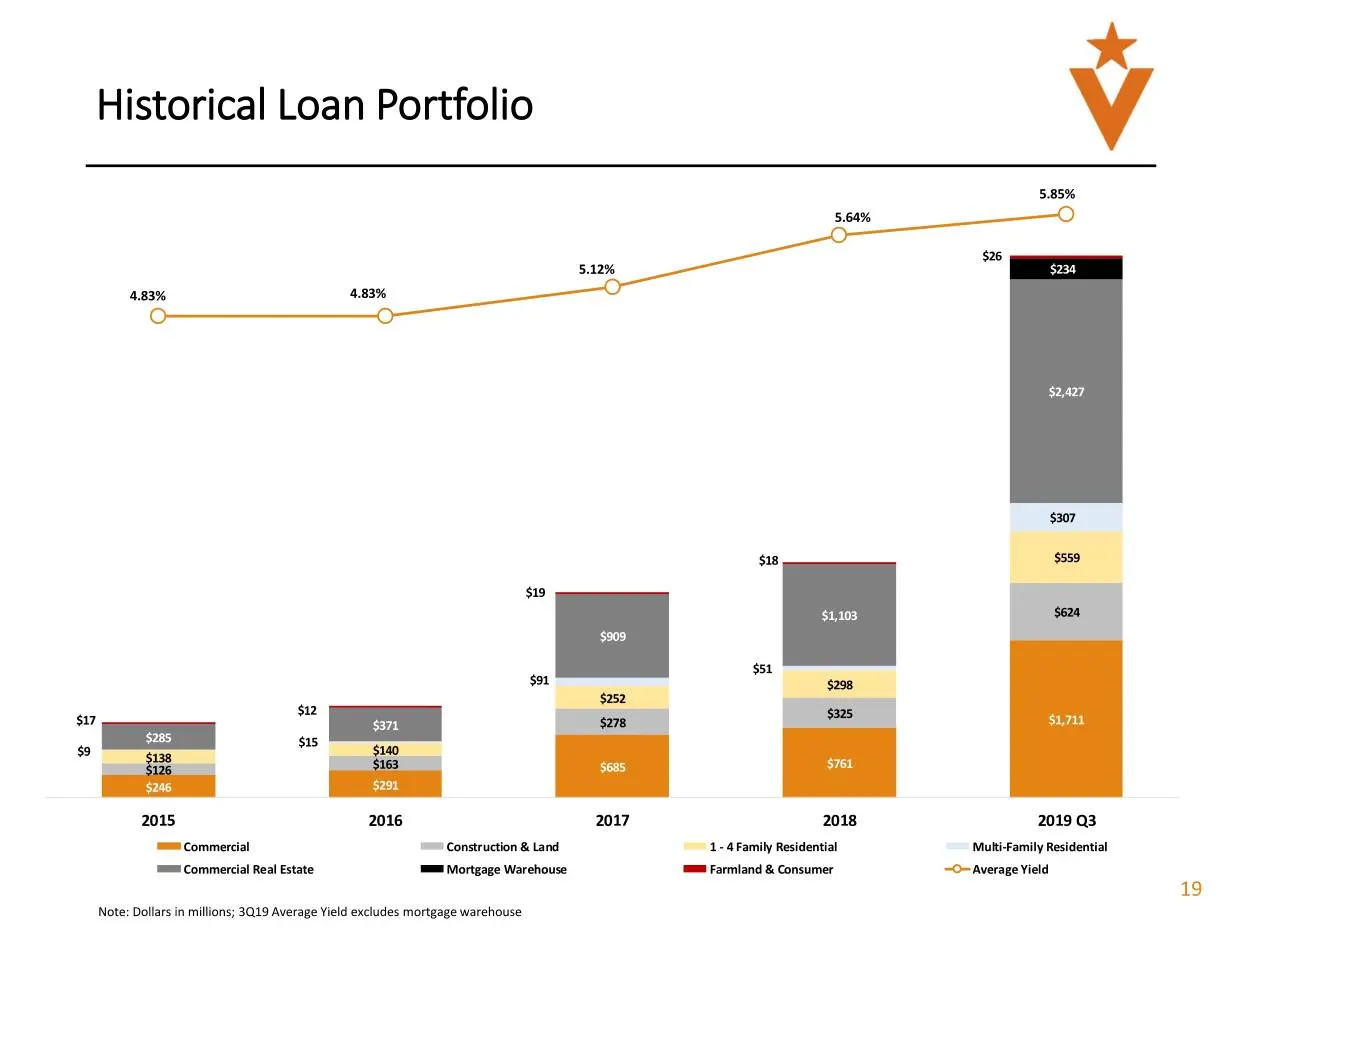
Historical Loan Portfolio Construction & Land Real Estate ‘mm Mortgage Warehouse 1s; 30.19 Average Yield excludes mortgage warehouse 2019 Q3 ‘Multi-Family Residential ~O- Average Yield 19
Slide 20: Strong Asset Quality
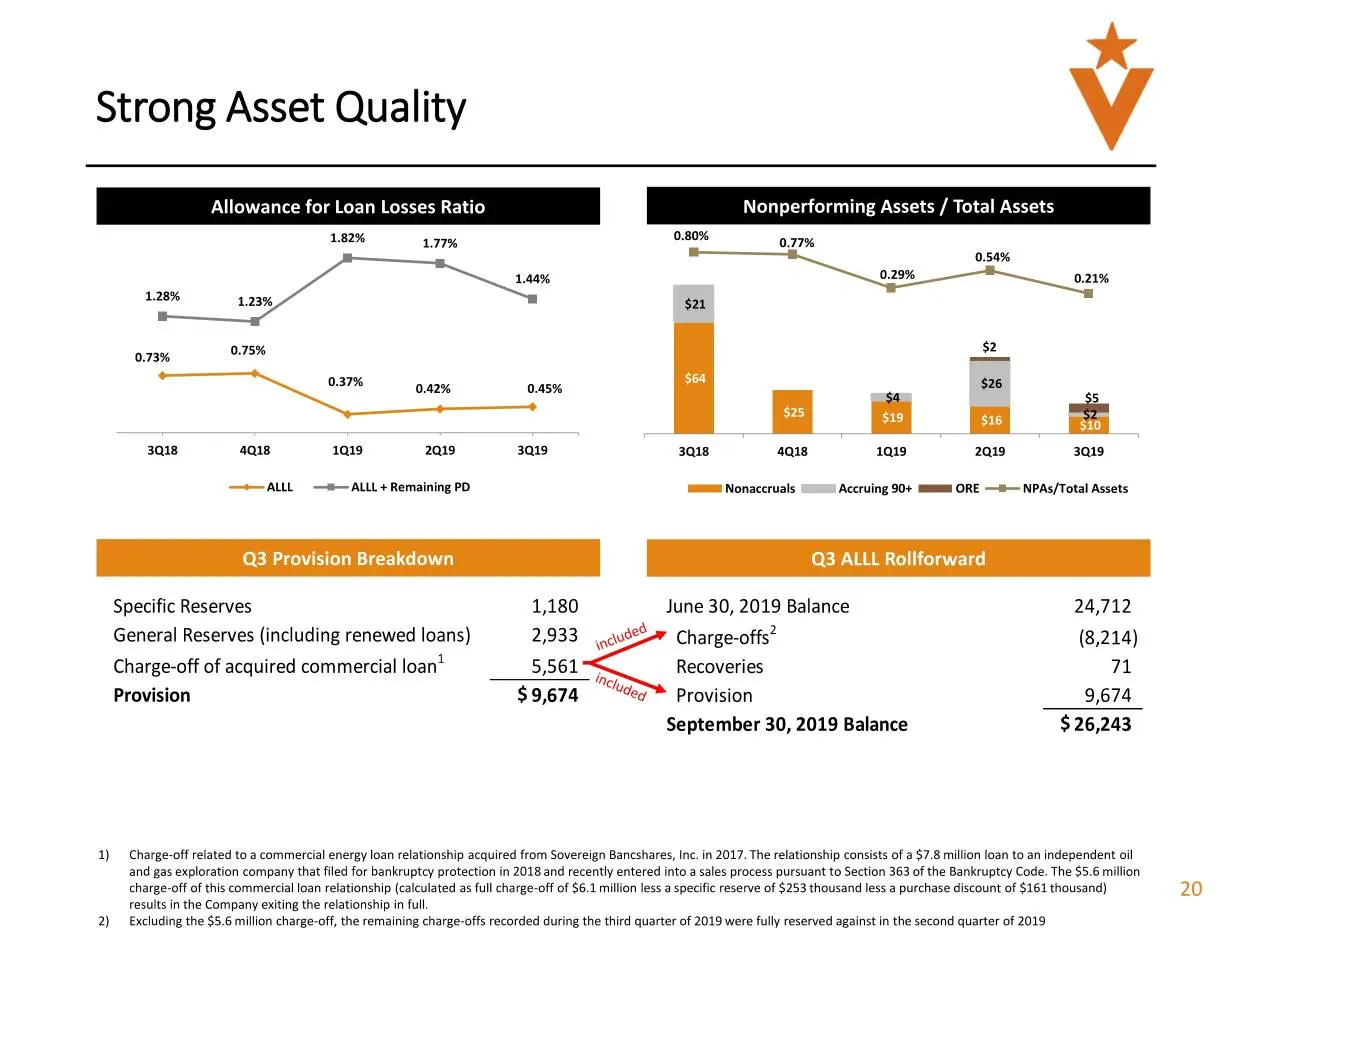
Strong Asset Quality Allowance for Loan Losses Ratio Nonperforming Assets / Total Assets 1.82% i97% 0.80% a 54% 1.44% 0.2956 128% 1.23% $21 0.73% 0.75% $2 A2% 0.45% $6a o $26 3018 cas 1019 2019 3019 3018 ais 1019 2019 319 mmm Nonaccruals Ss Accruing 90+ mmm ORE —#— NPAs/Total Assets Q3 Provision Bre
Slide 21: Historical Asset Quality
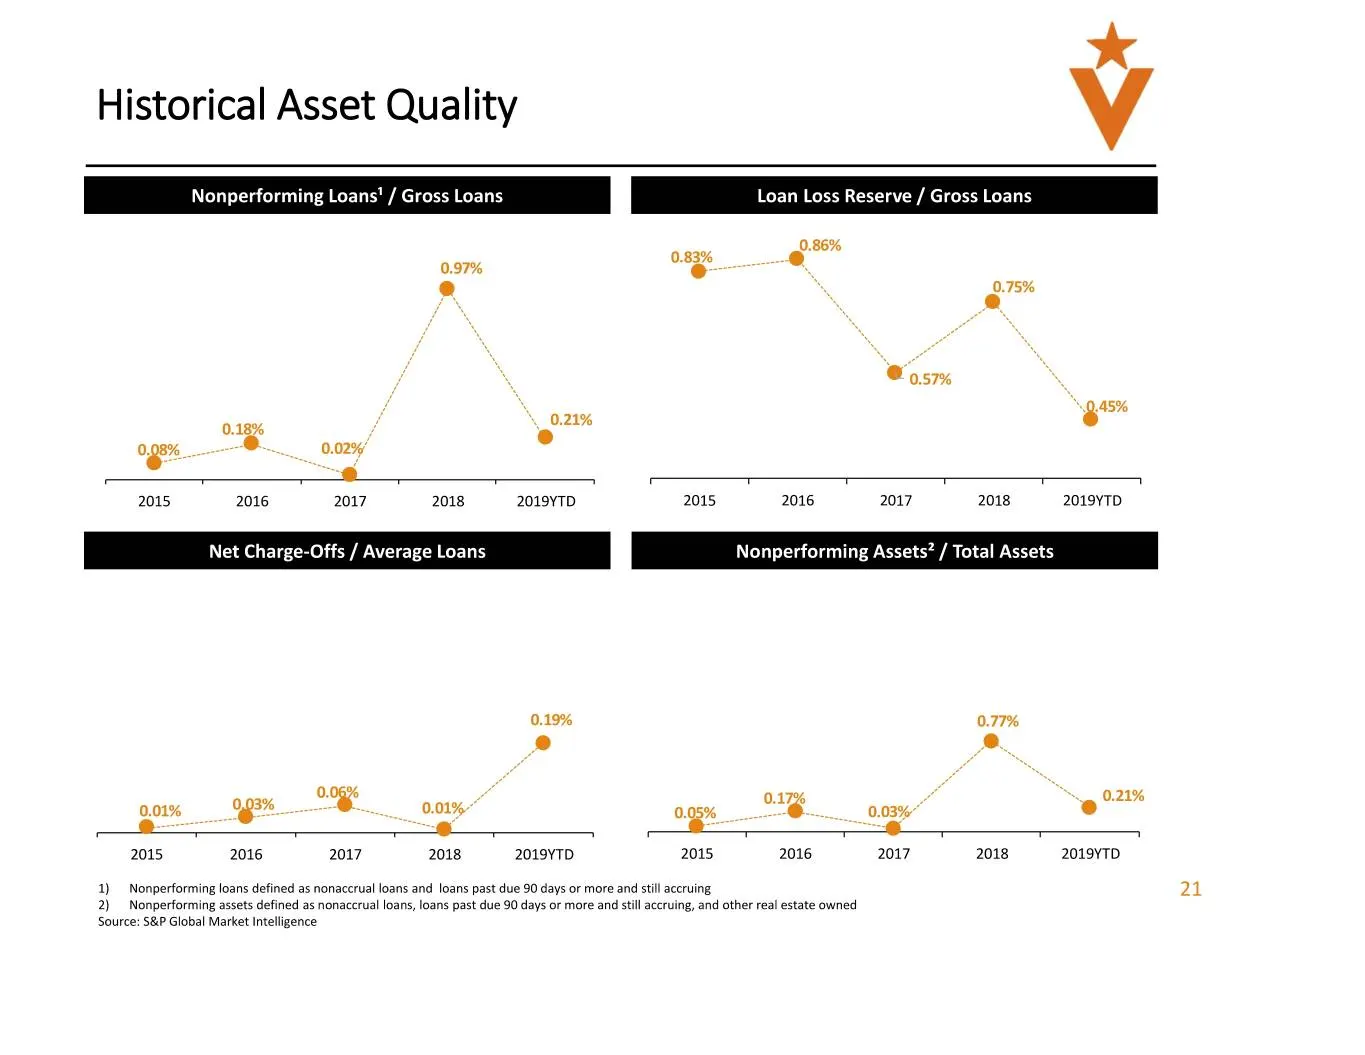
Historical Asset Quality Loan Loss Reserve / Gross Loans 0.97% = e 0.75% Lt] @os7% 0. 0.21% } “™ o 0.02%" » “ * 2015 2016 2017 2018 2019YTD 2015 2016 2017 2018 2019YTD Net Charge-Offs / Average Loans Nonperforming Assets? / Total Assets 0.19% 0.77% 2 o. 0. : 0.21% 0.1 .21% Lea 0,03% -"s 0.01% e 0.03
Slide 22: Deposits and Borrowings
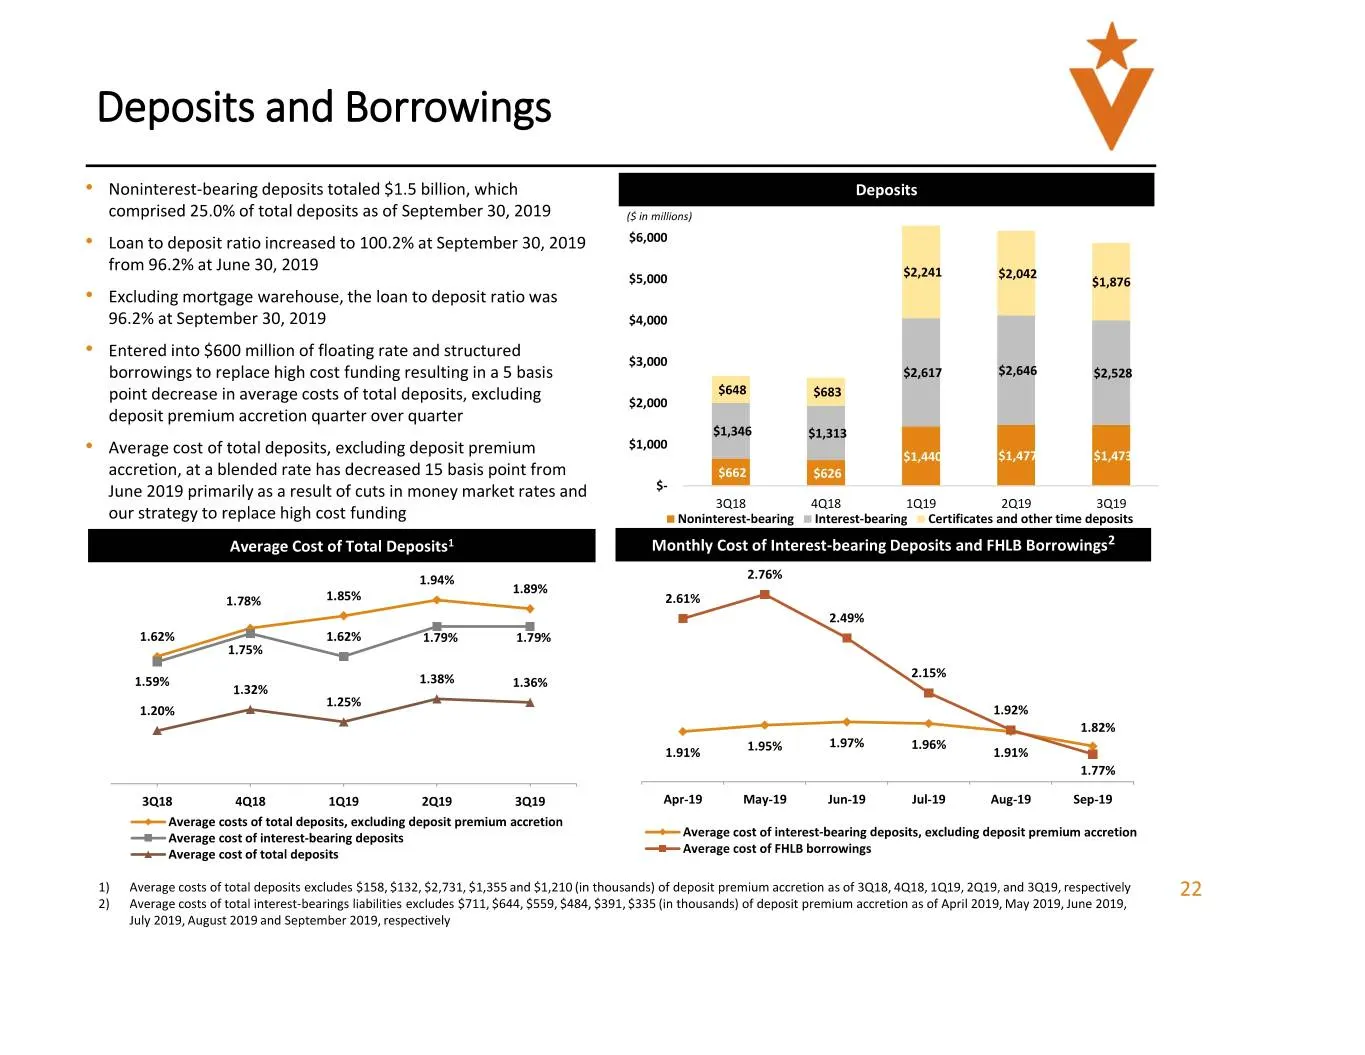
Deposits and Borrowings * Noninterest-bearing deposits totaled $1.5 billion, which comprised 25.0% of total deposits as of September 30, 2019 (ghininens) * Loan to deposit ratio increased to 100.2% at September 30, 2019 $6,000 from 96.2% at June 30, 2019 4,000 saan 2002 La * Excluding mortgage wareh
Slide 23: Historical Deposit Composition
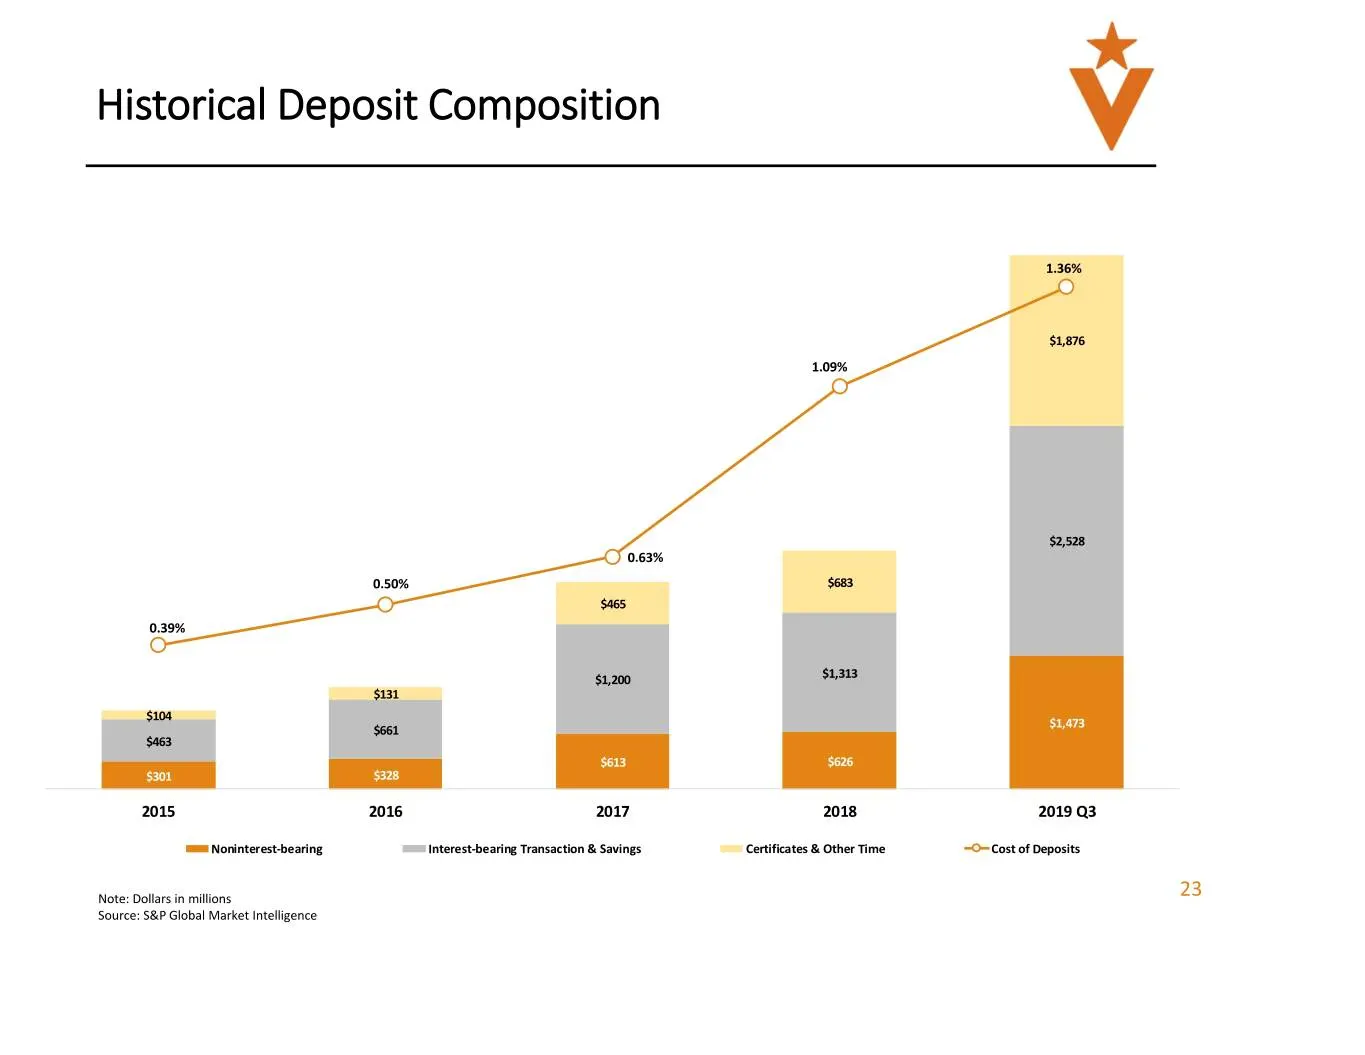
Historical Deposit Composition 2015 2016 2017 =m Noninterest-bearing om Interest-bearing Transaction & Savings Note: Dollars in millions Source: S&P Global Market Intelligence $626 2018 Certificates & Other Time 2019 Q3 ~O- Cost of Deposits 23
Slide 24: Securities Portfolio
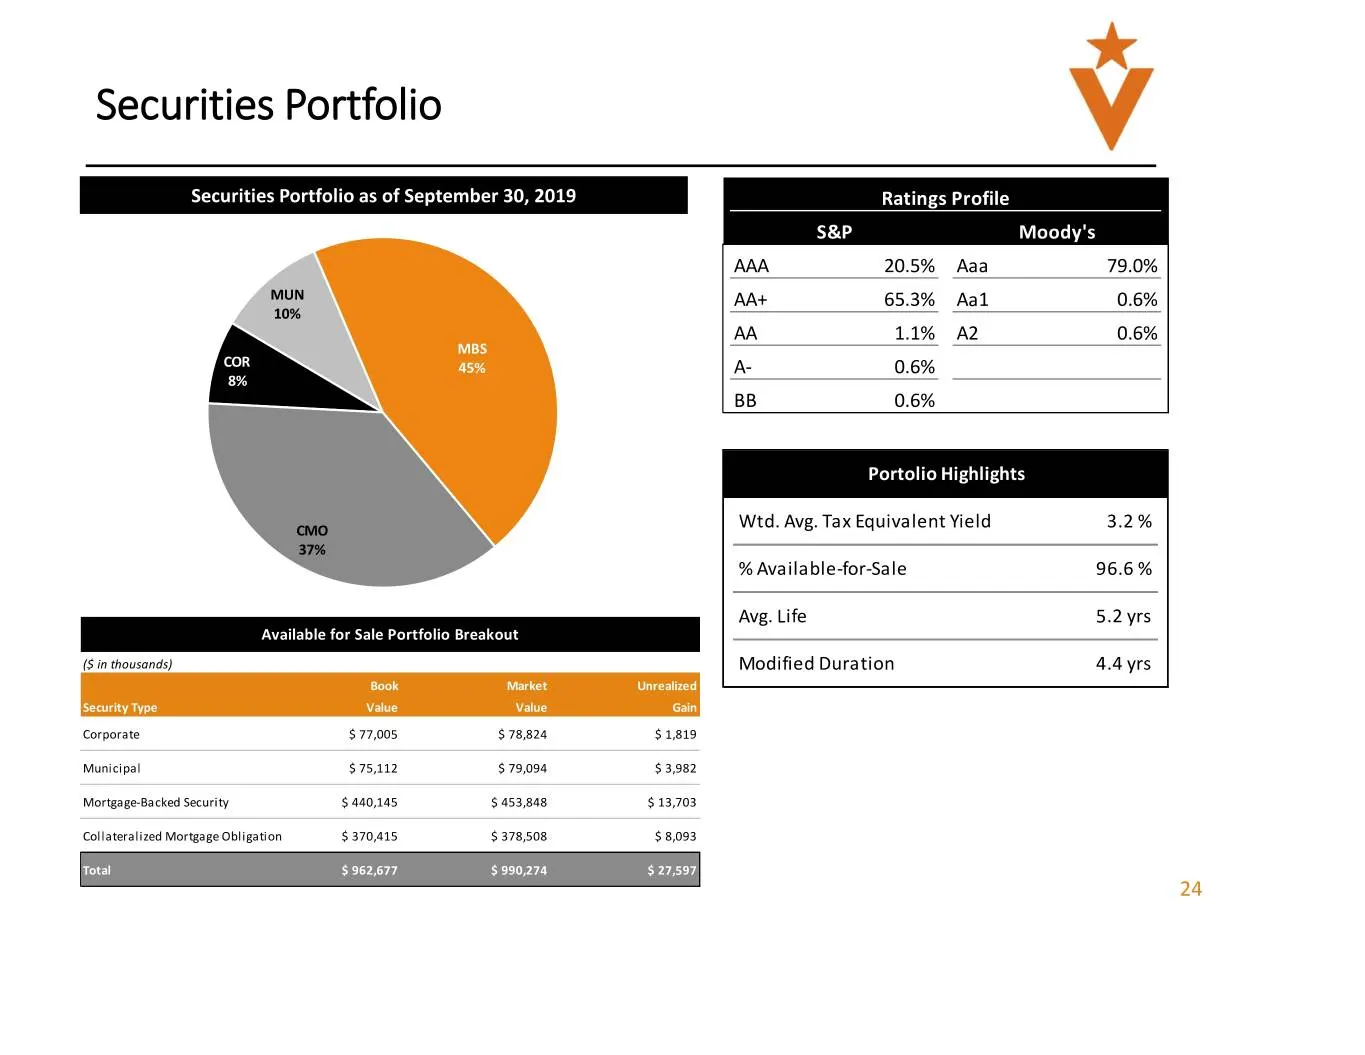
Securities Portfolio Available for Sale Portfolio Breakout (5 in thousands) Corporate $77,005 $78,824 $1,819 Municipal $75,112 $79,094 $3,982 Mortgage-Backed Security $440,145 $453,848 $13,703 Collateralized Mortgage Obligation $370,415 $378,508 $8,093 Total $962,677 $990,274 $27,597 Ratings Profile
Slide 25: Interest Rate Sensitivity
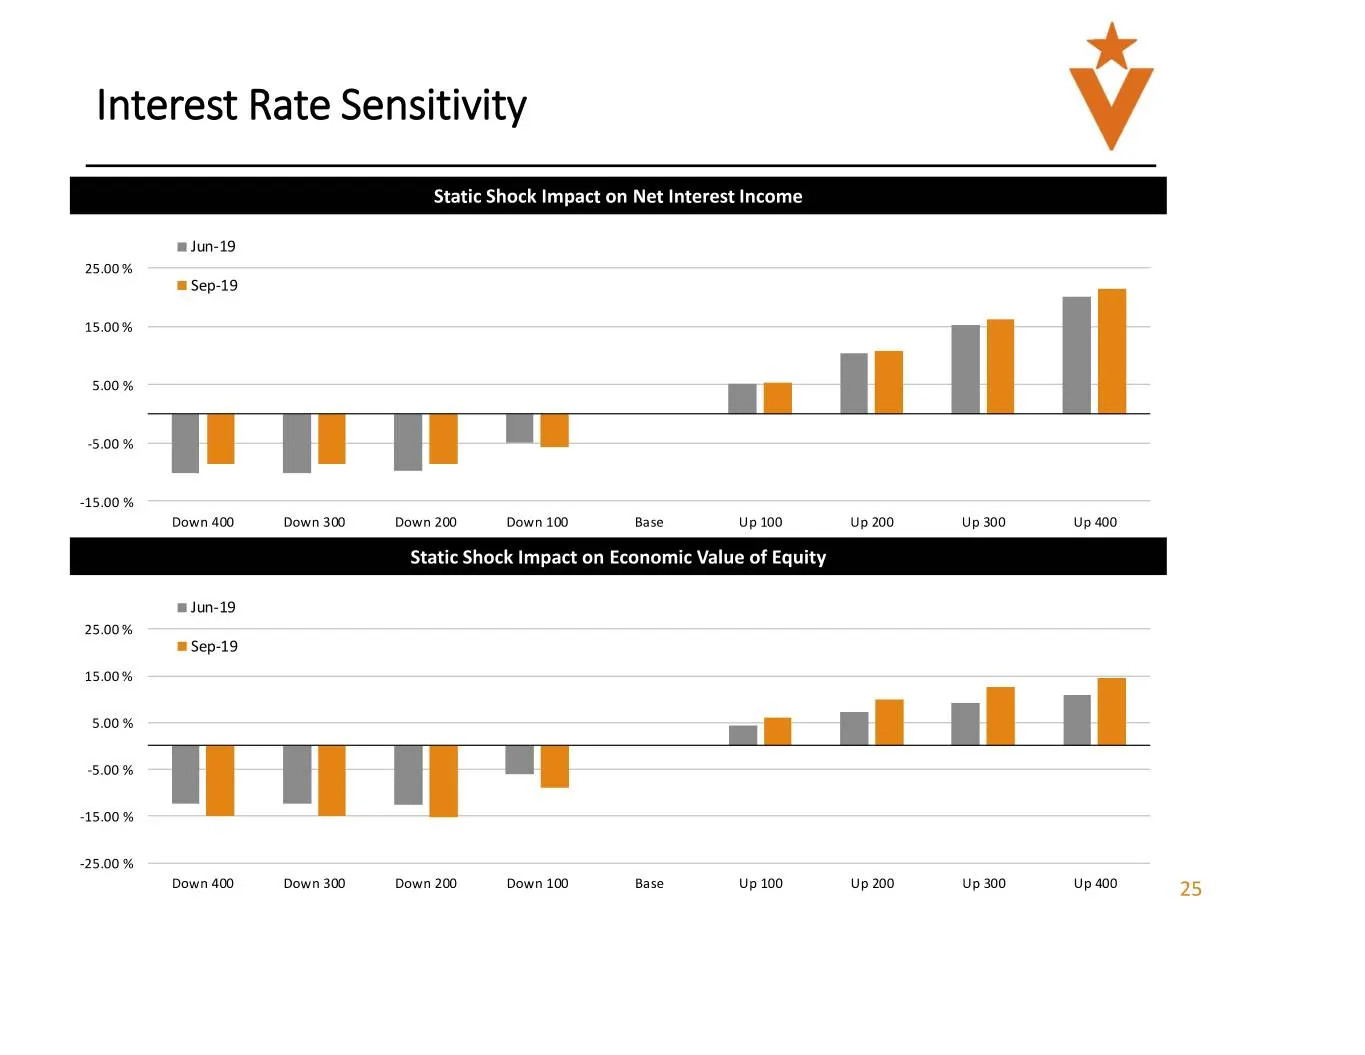
Interest Rate Sensitivity Static Shock Impact on Net Interest Income mJun-19 25.00% mSep-19 15.00% - {| -15.00 % Down 400 Down 300 Down 200 Down 100 Base Up 100 Up 200 Up 300 Up 400 Static Shock Impact on Economic Value of Equity wJun-19 25.00% mSep-19 15.00% — on ol oll all ~~ | | Ui UL “i -15.00.%
Slide 26: Capital Positioning of the Company
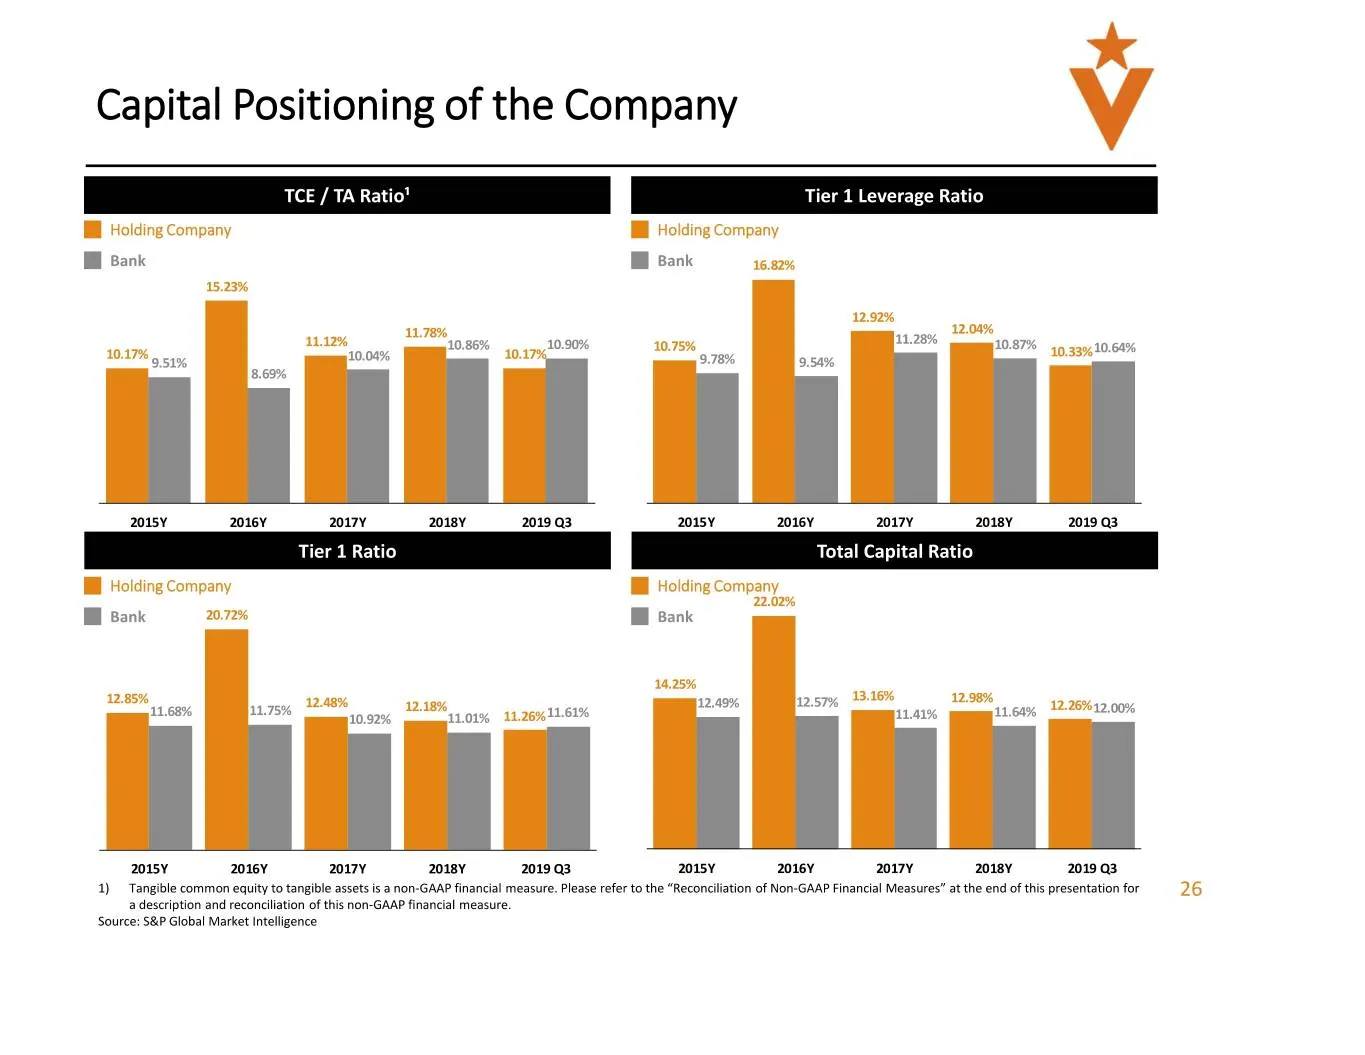
Capital Positioning of the Company Tier 1 Leverage Ratio Hl Holding Company I Holding Company i Bank BB Bank 16.82% 15.23% 2016Y 2017Y 2015Y 20171 2018Y 2019 Q3 Tier 1 Ratio Total Capital Ratio I Holding Company Bh Holding Company 22.02% I Bank 20.72% BB Bank 11.64% 12:26%12,00% 2015Y 2016Y 20171 20
Slide 27: Pro Forma Capitalization Table
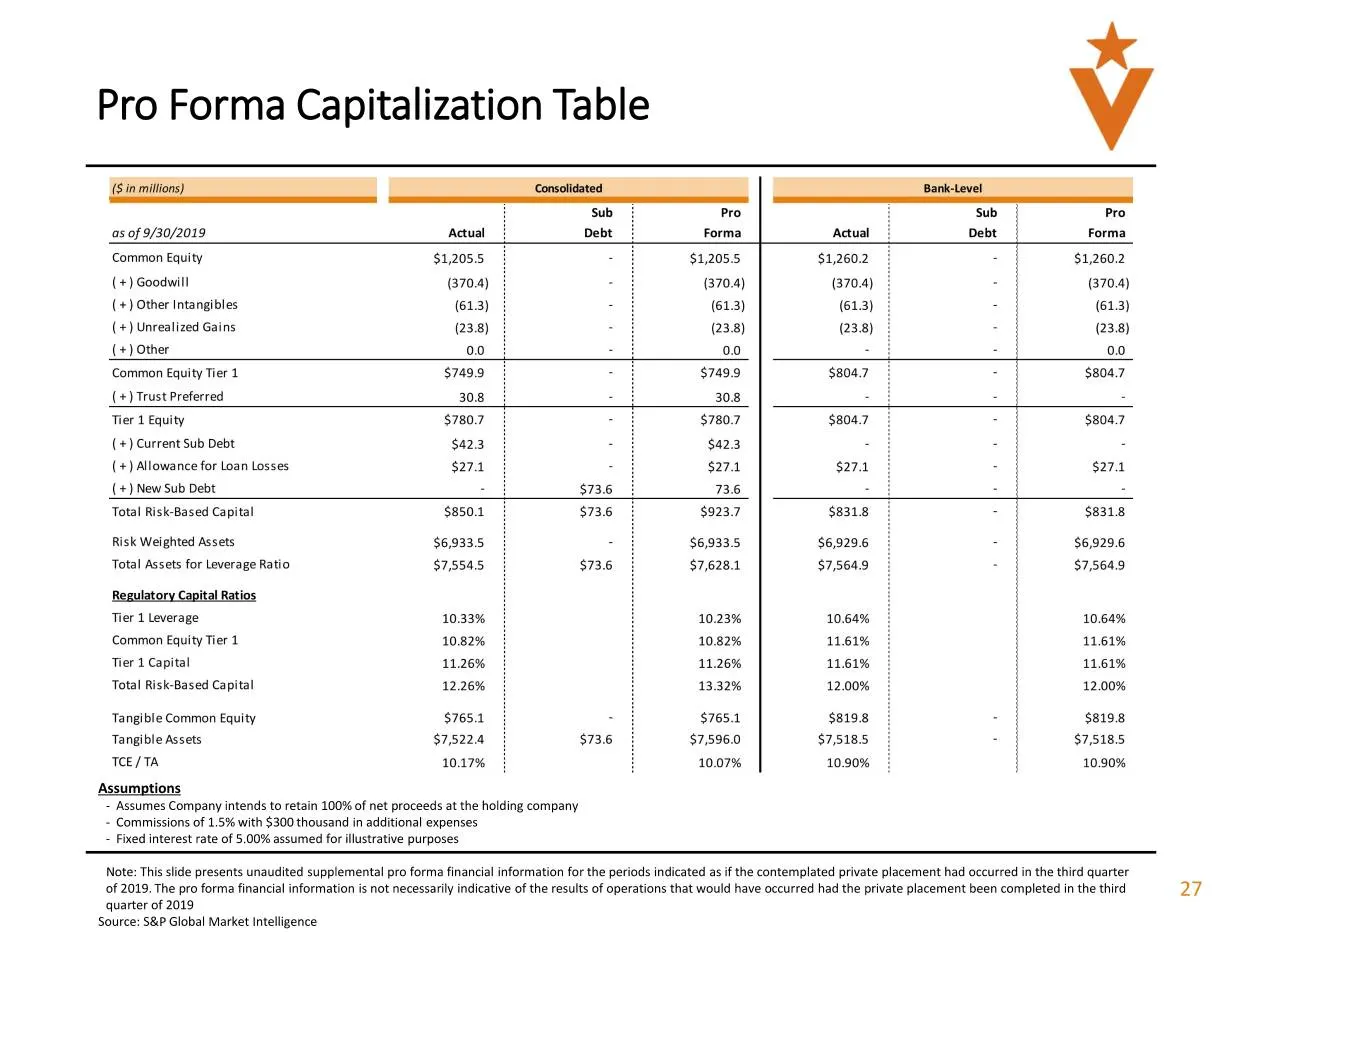
Pro Forma Capitalization Table i Sub f Pro Sub | Pro as of 9/30/2019 Actual Debt | Forma Actual: Debt | Forma Common Equity $1,2055 | - $1,205.5 $1,2602 | - | $1,2602 (+) Goodwill (370.4) (370.4) (370.4); = | (370.4) ( +) Other Intangibles (61.3) - (613) (613) | - (61.3) (+) Unrealized Gains (23.8)
Slide 28: Double Leverage & Interest Coverage
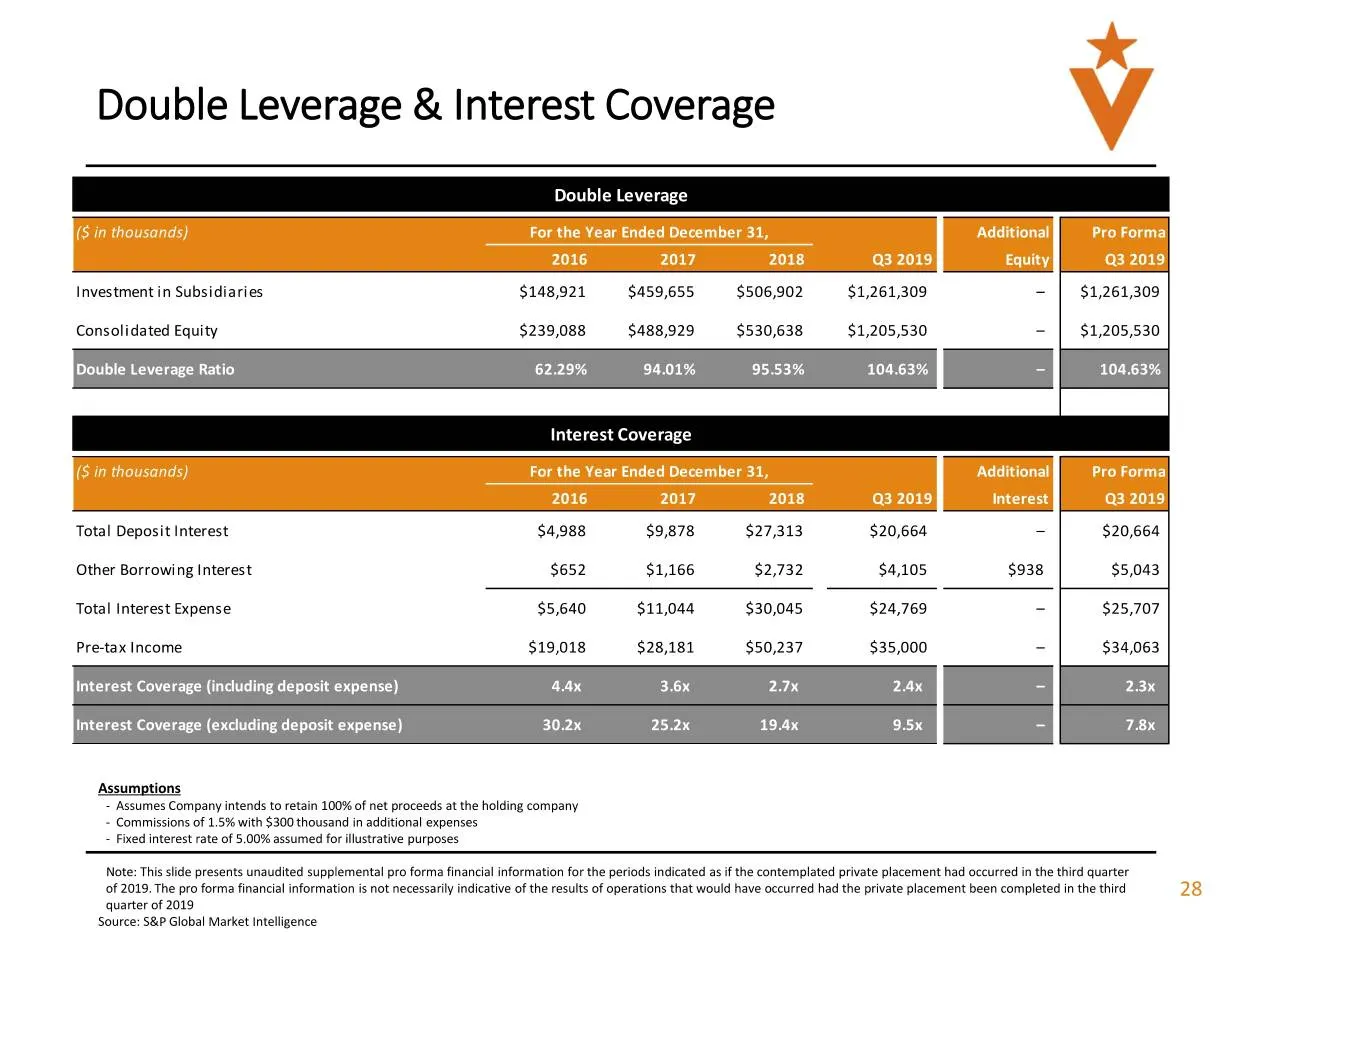
Me! Double Leverage & Interest Coverage Double Leverage For the Ye Addition: Q3 2019 Equity Pro Forma Q3 2019 Investment in Subsidiaries $148,921 $459,655 $506,902 $1,261,309 $1,261,309 Consolidated Equity $239,088 $488,929 $530,638 $1,205,530 - | $1,205,530 Double Leverage Ratio 62.29% 94.01% 95.53

Slide 29: Appendix
Vv | Appendix

Slide 30: Experienced Management Team
Me! Experienced Management Team Malcolm Holland — Chairman & Chief Executive Officer . Malcolm Holland, Il founded Veritex and has been Chairman of the Board, Chief Executive Officer and President of Vertex since 2009, and Chairman ofthe board of, directors, Chief Executive Officer and President of
Slide 31: Experienced Management Team (continued)
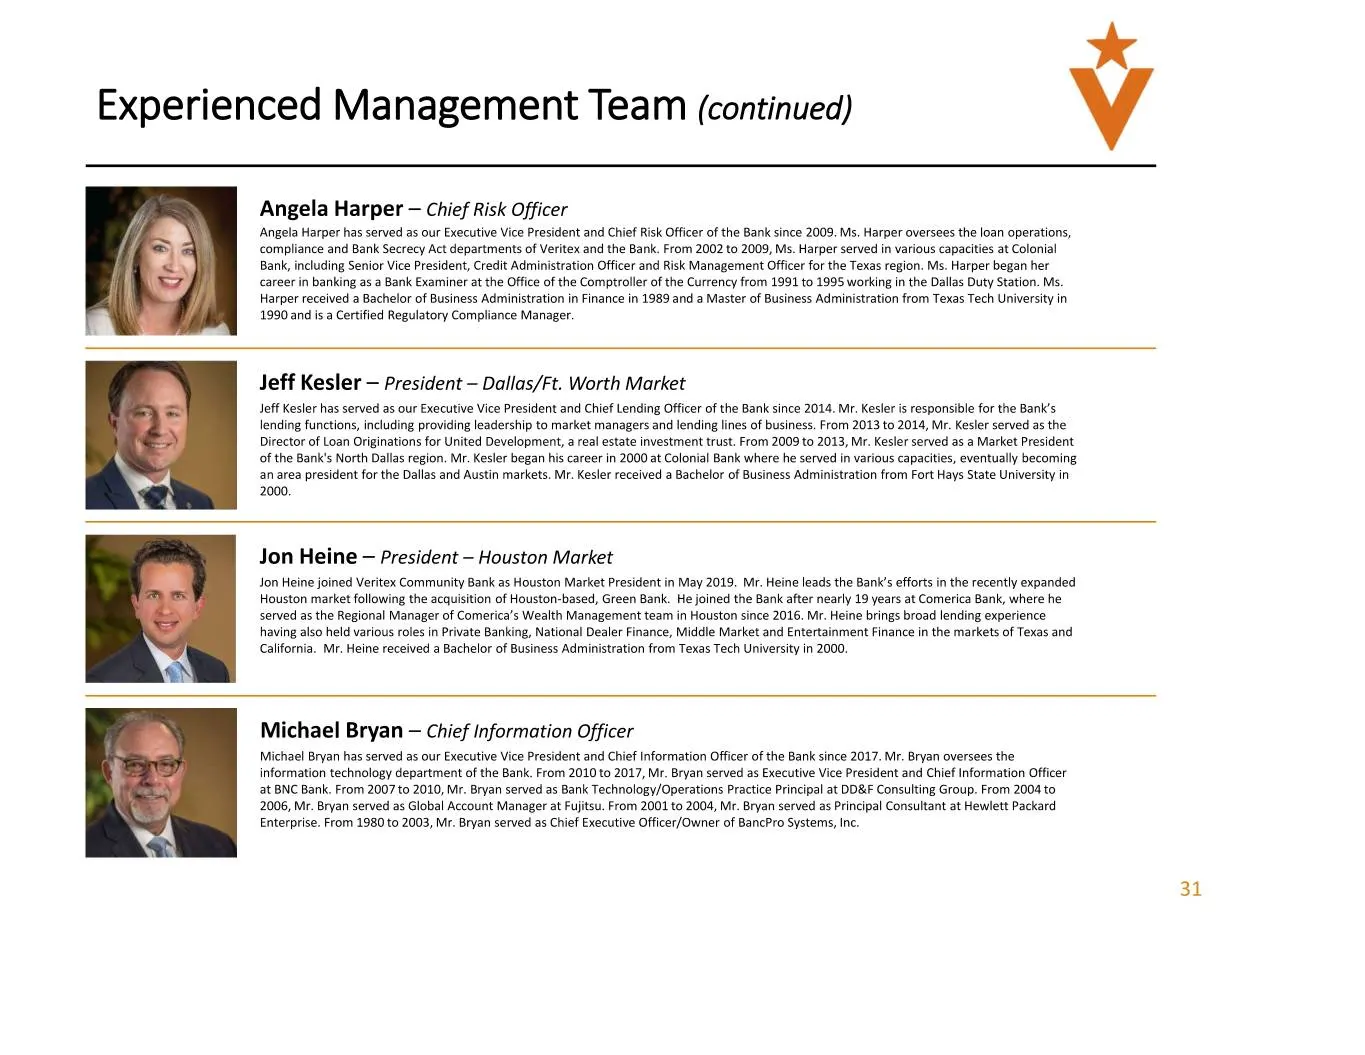
Experienced Management Team (continued) Angela Harper — Chief Risk Officer Angela Harper has served as our Executive Vice President and Chief Risk Officer of the Bank since 2009, Ms. Harper oversees the loan operations, compliance and Bank Secrecy Act departments of Veritex and the Bank. From 2002 t
Slide 32: Reconciliation Measures
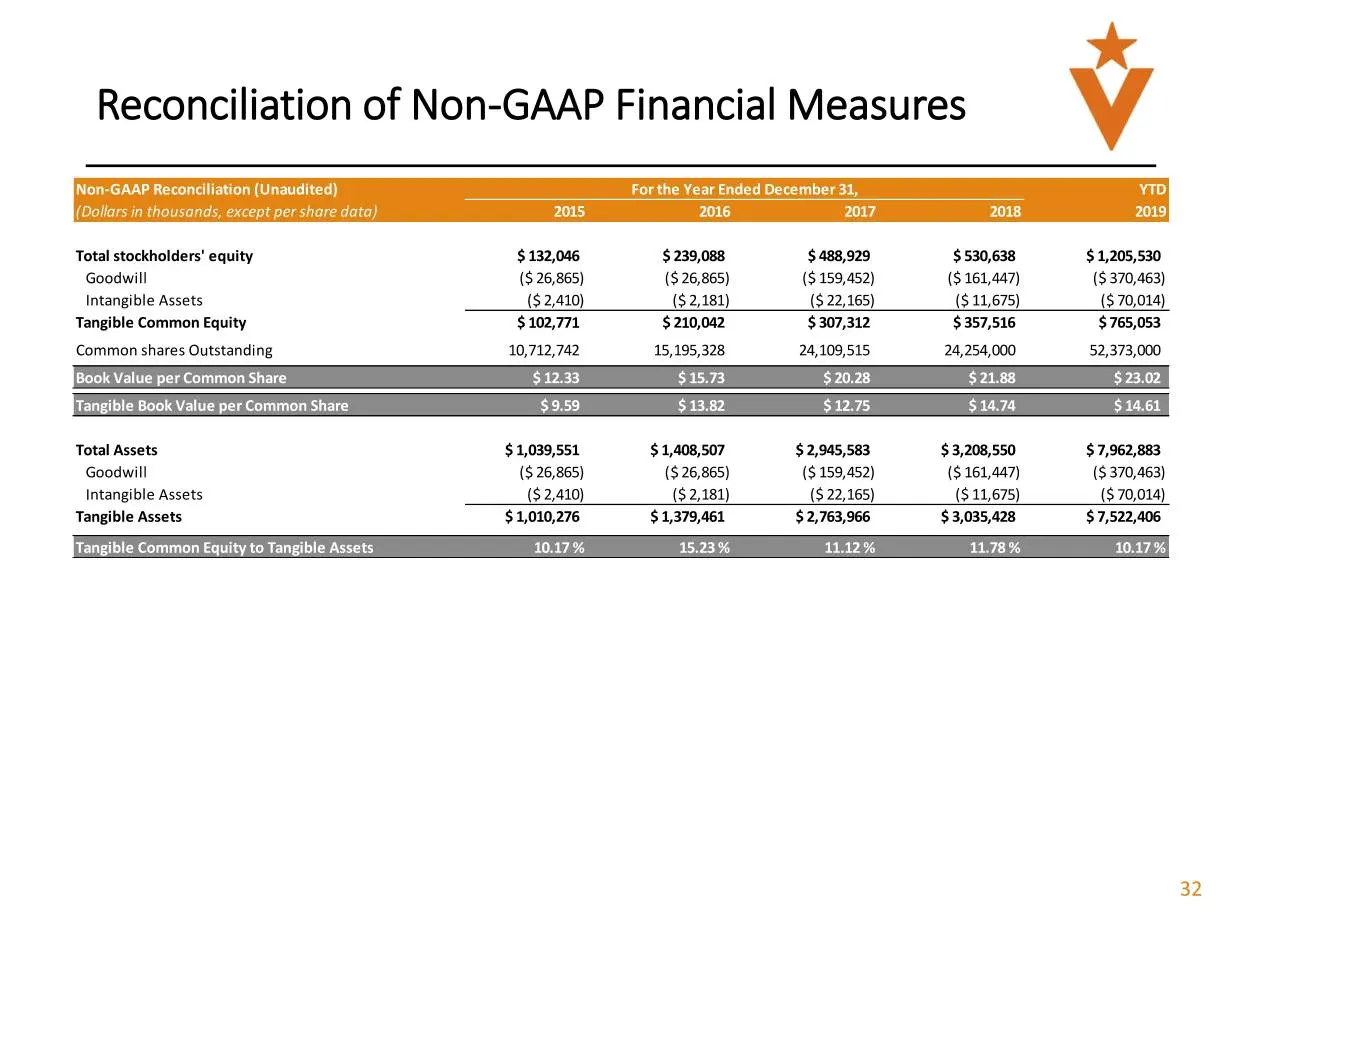
Reconciliation of Non-GAAP Financial Measures Non-GAAP Reconciliation (Unaud cember 31, Total stockholders’ equity $132,046 $239,088 $488,929 $530,638 $1,205,530 Goodwill ($ 26,865) ($26,865) ($ 159,452) ($161,447) ($370,463) Intangible Assets ($2,410) ($2,181) ($22,165) ($11,675) ($70,014) Tangible
Slide 33: Reconciliation Measures
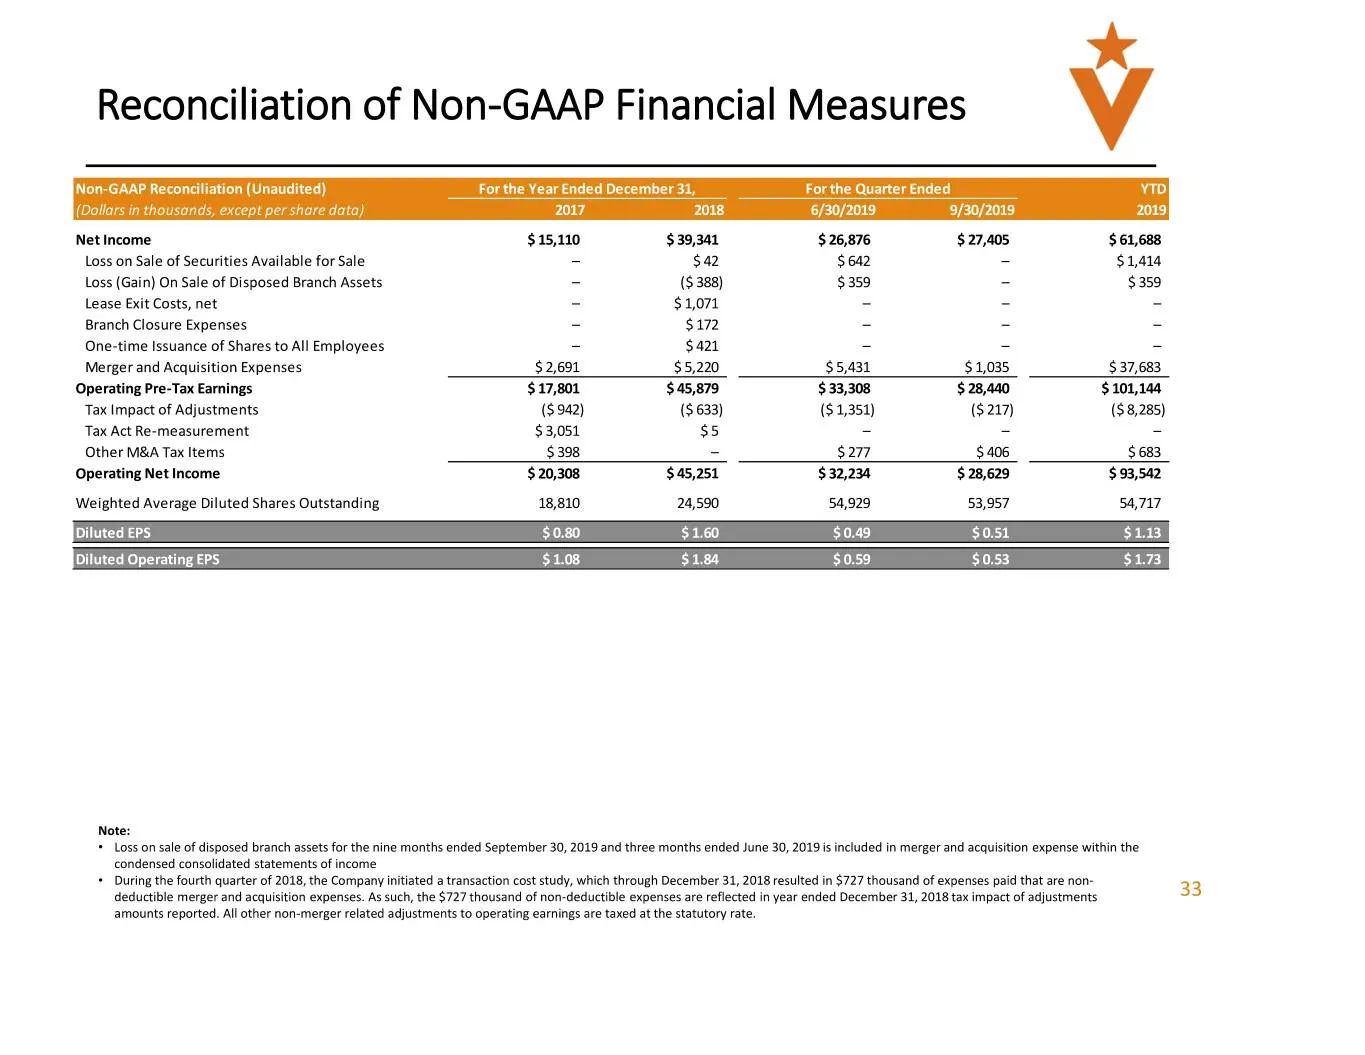
Reconciliation of Non-GAAP Financial Measures audited) Net Income $15,110 $39,341 $27,405 $61,688 Loss on Sale of Securities Available for Sale a $42 = $1414 Loss (Gain) On Sale of Disposed Branch Assets - ($388) - $359 Lease Exit Costs, net = $1,071 S = ES Branch Closure Expenses - $172 - - - One-t
Slide 34: Reconciliation Measures
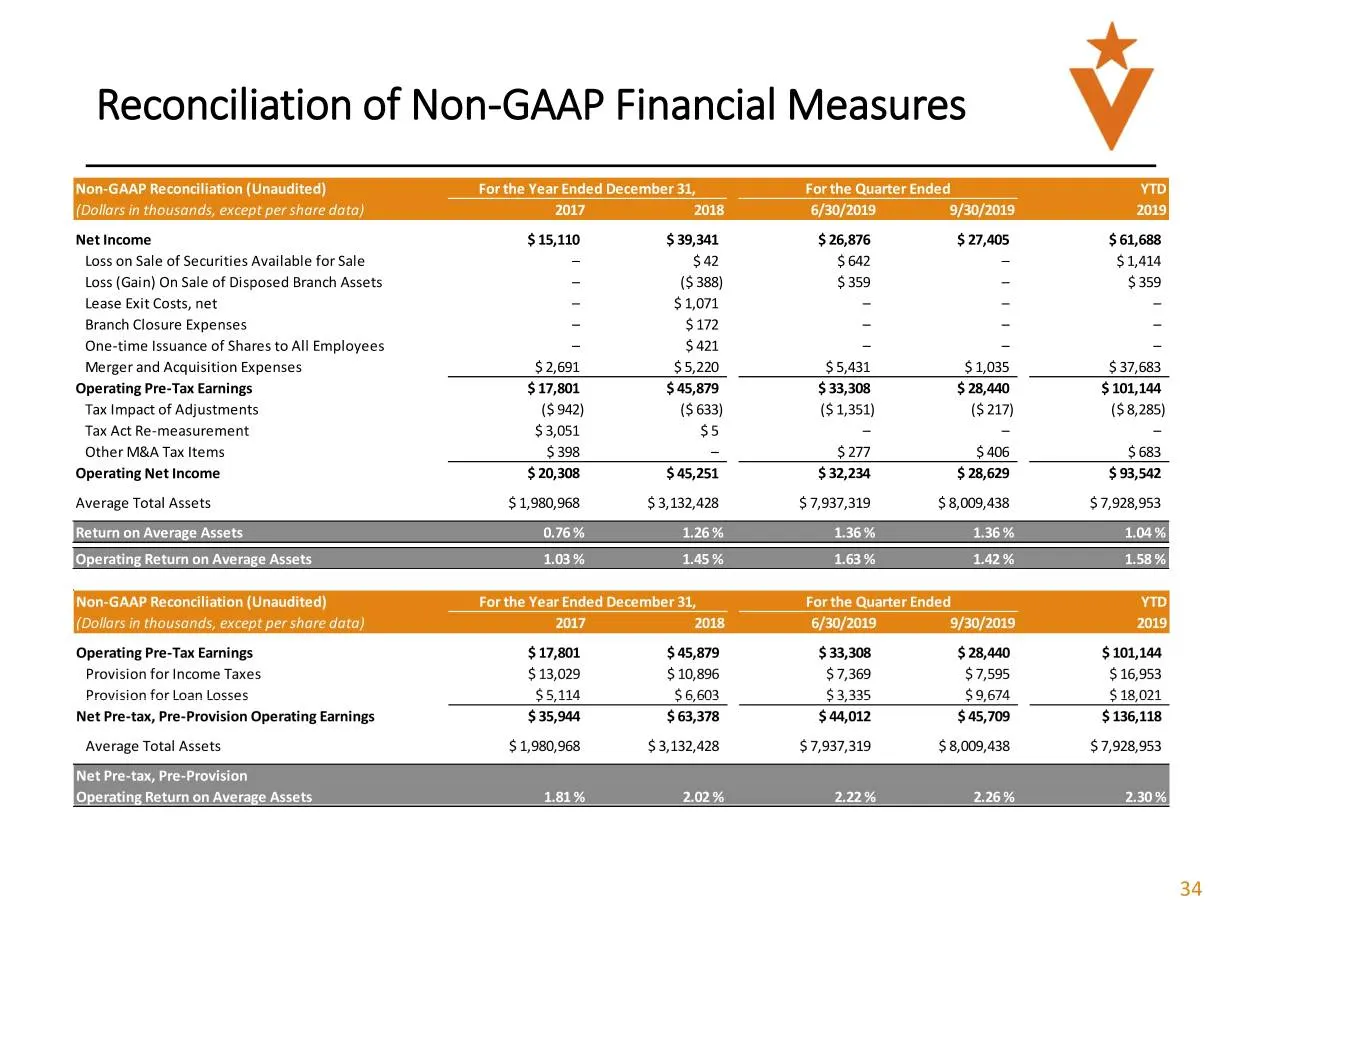
Reconciliation of Non-GAAP Financial Measures Non-GAAP Net Income Loss on Sale of Securities Available for Sale - Loss (Gain) On Sale of Disposed Branch Assets - Lease Exit Costs, net - Branch Closure Expenses - One-time Issuance of Shares to All Employees - Merger and Acquisition Expenses Operating
Slide 35: Reconciliation Measures
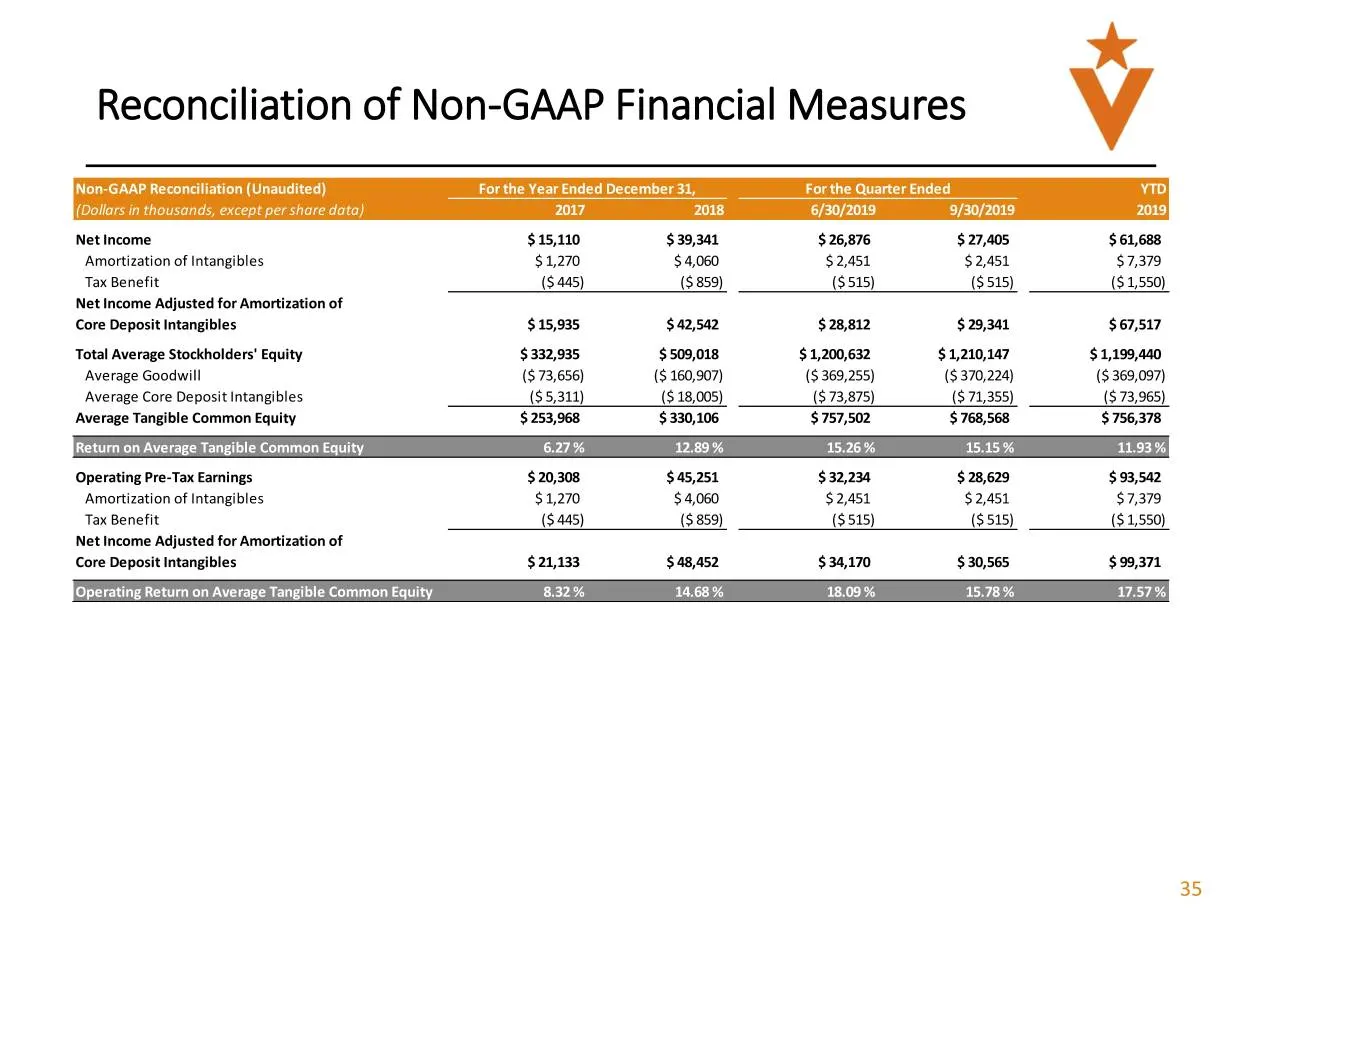
Reconciliation of Non-GAAP Financial Measures Non-GAAP Reconciliation (Unaudited) 9/30/2019 Net Income $15,110 $39,341 $27,405 $61,688 Amortization of Intangibles $1,270 $4,060 $2,451 $7,379 Tax Benefit ($445) ($859) ($515) ($1,550) Net Income Adjusted for Amortizati Core Deposit Intangibles $15,935
Slide 36: Reconciliation Measures
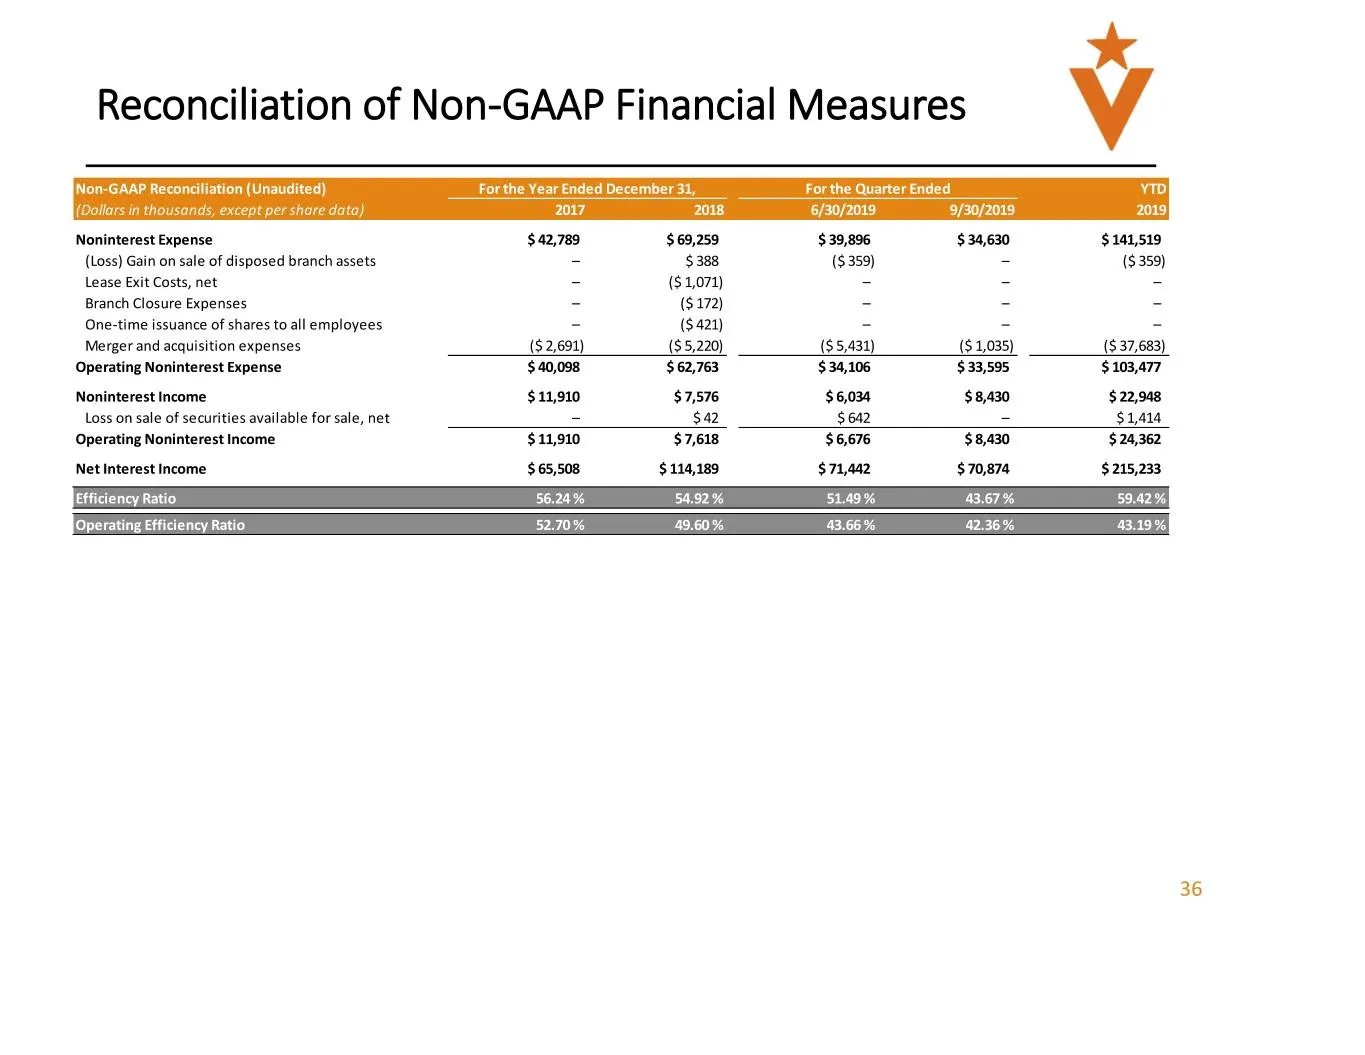
Reconciliation of Non-GAAP Financial Measures jecember 31, For the Quarter E 6/30/2019 9/30/2019 Noninterest Expense $42,789 $69,259 $39,896 $34,630 $141,519 (Loss) Gain on sale of disposed branch assets - $388 ($359) - ($359) Lease Exit Costs, net - ($1,071) - - - Branch Closure Expenses = ($172) =
Slide 37: Reconciliation Measures
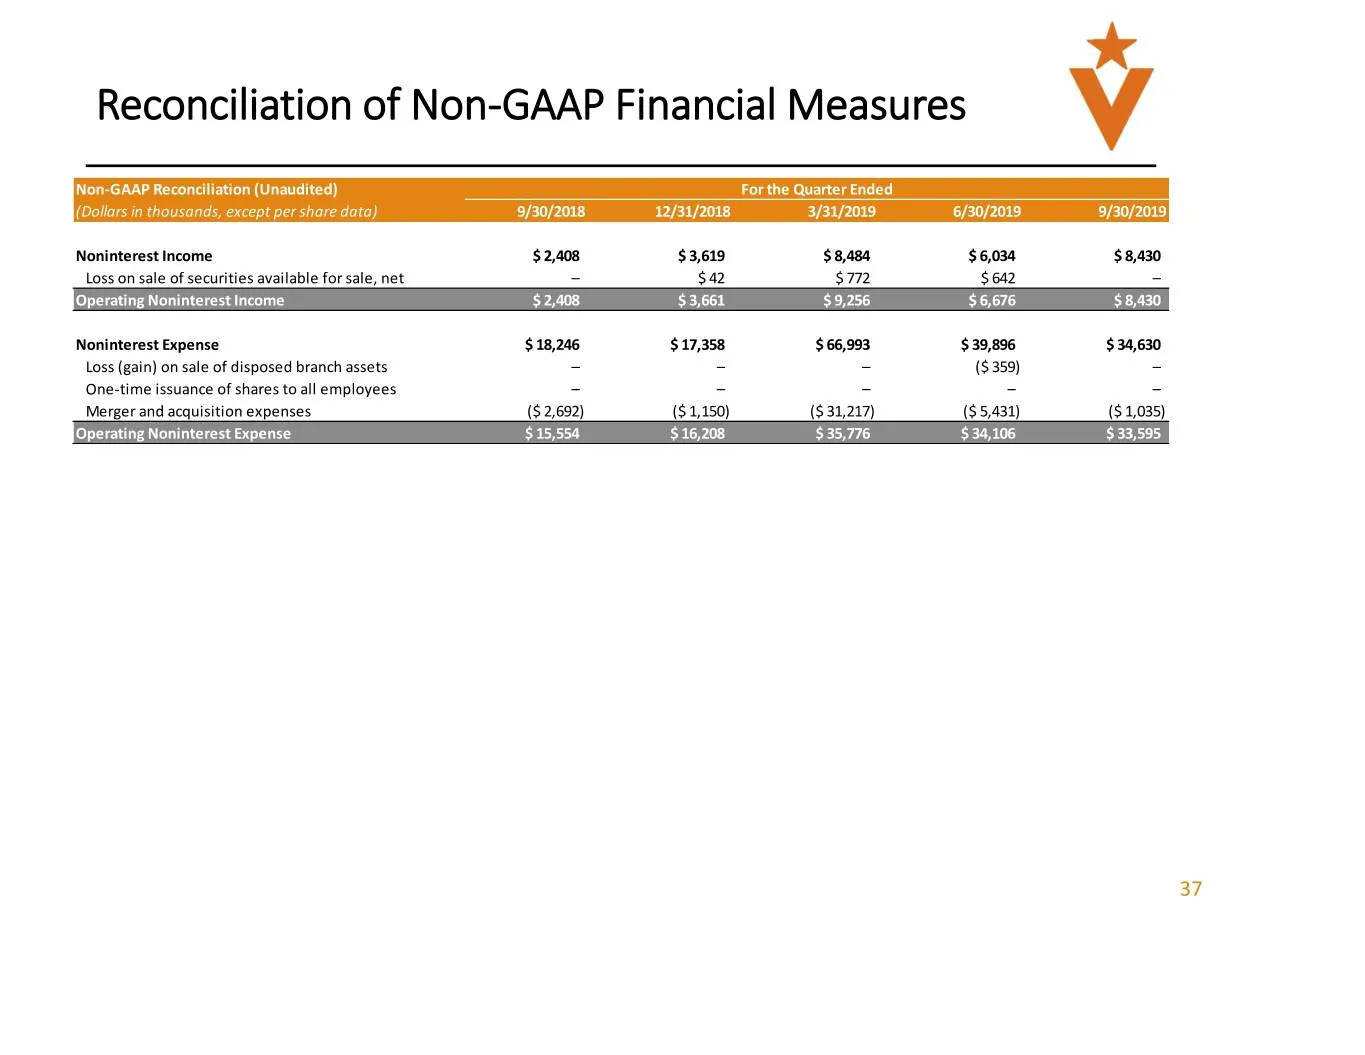
Reconciliation of Non-GAAP Financial Measures Non-GAAP Reconciliation (Unaudited) ____ For the Quarter Ended » (Dollars in thousands, except per share dat 9/30/2018 12/31/2018 3/31/2019 6/30/2019 Noninterest Income $2,408 $3,619 $8,484 $6,034 Loss on sale of securities available for sale, net = $42
Slide 38: Veritex
V E R I T E X
Source: SEC EDGAR · 8-K filed Nov 8, 2019
More decks from Veritex Holdings Inc
 Merger or Acquisition (July 2025)17 slides · Jul 14, 2025
 Q1 2025 Earnings Presentation22 slides · Apr 23, 2025
 Q4 2024 Earnings Presentation22 slides · Jan 28, 2025
 Q3 2024 Earnings Presentation24 slides · Oct 23, 2024
 Investor Presentation (August 2024)30 slides · Aug 27, 2024
 Q2 2024 Earnings Presentation22 slides · Jul 24, 2024