Atlantic Capital Bancshares Inc
Atlantic Capital Bancshares — Investor Presentation (November 2019)
29 slides from Atlantic Capital Bancshares's investor presentation, Nov 4, 2019
Slide 1: Investor Presentation | Q3 2019
Investor Presentation | Q3 2019 atlanticcapitalbank.com NASDAQ TICKER: ACBI
Slide 2: Forward-looking statements
2 This presentation contains forward-looking statements within the meaning of section 27A of the Securities Act of 1933, as amended, and section 21E of the Securities Exchange Act of 1934, as amended. These forward-looking statements reflect our current views with respect to, among other things, fut
Slide 3: Non-GAAP Financial Information
3 Statements included in this annual report include non-GAAP financial measures and should be read along with the accompanying tables, which provide a reconciliation of non-GAAP financial measures to GAAP financial measures. Atlantic Capital management uses non-GAAP financial measures, including:(i)
Slide 4: Our Company
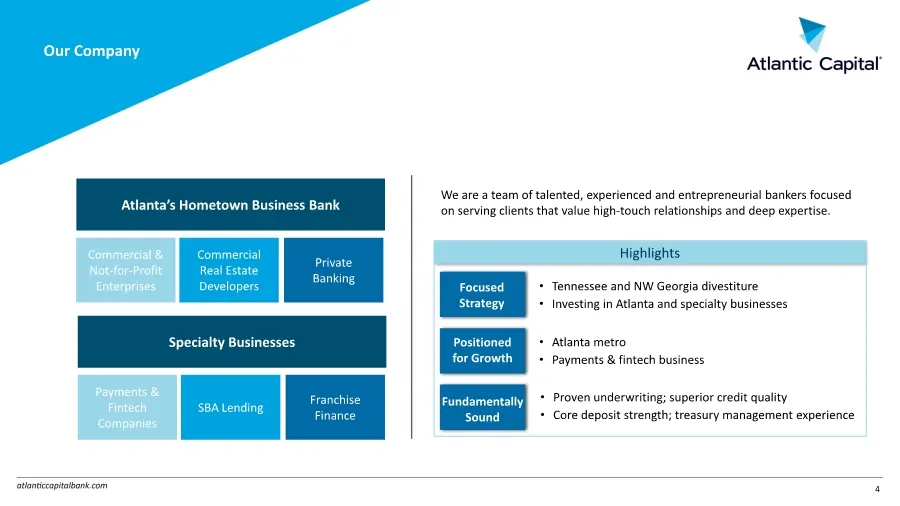
4 Our Company We are a team of talented, experienced and entrepreneurial bankers focused on serving clients that value high-touch relationships and deep expertise. Commercial & Not-for-Profit Enterprises Commercial Real Estate Developers Private Banking Atlanta’s Hometown Business Bank Payments & Fi
Slide 5: We Fuel Prosperity
We Fuel Prosperity WE ARE A team of talented, experienced and entrepreneurial bankers WE SERVE Clients who value high-touch relationships and deep expertise WE WIN With creativity, expertise, teamwork, humility, and confidence
Slide 6: Atlanta's Hometown Business Bank
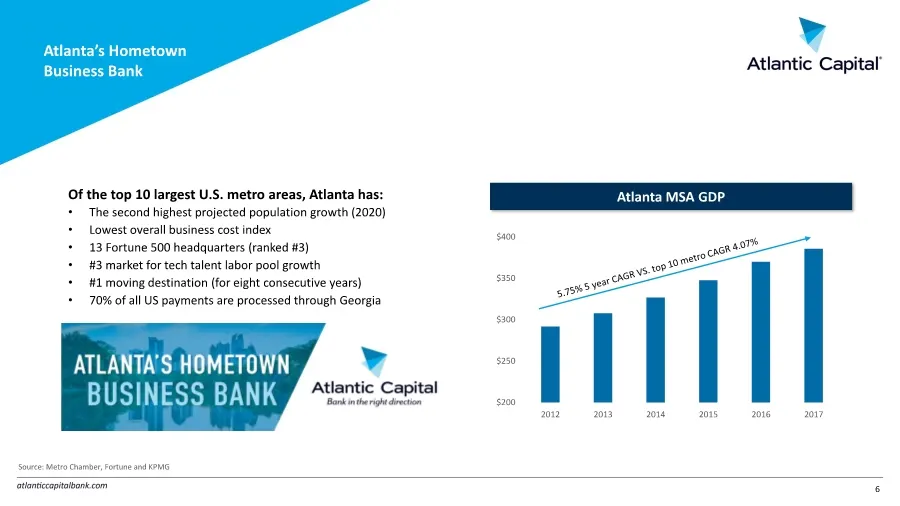
6 Atlanta’s Hometown Business Bank Of the top 10 largest U.S. metro areas, Atlanta has: • The second highest projected population growth (2020) • Lowest overall business cost index • 13 Fortune 500 headquarters (ranked #3) •#3 market for tech talent labor pool growth •#1 moving destination (for eigh
Slide 7: Q3 2019 Results
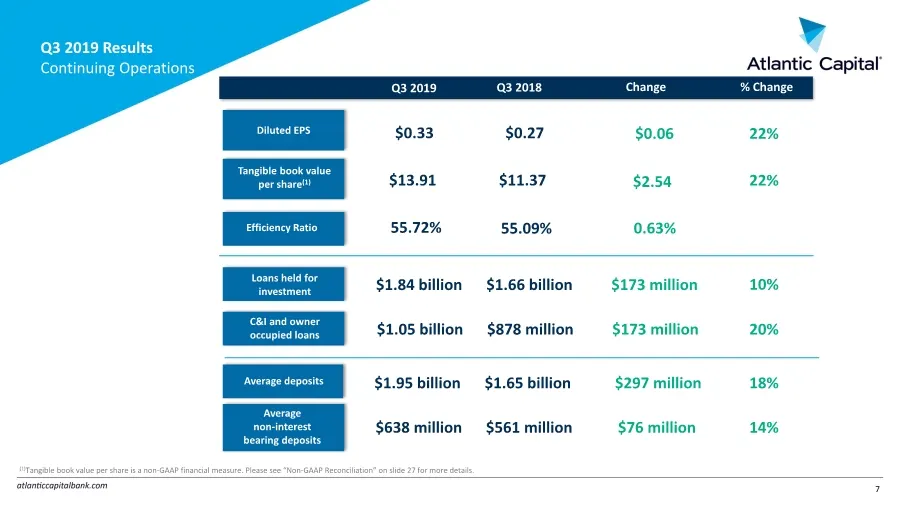
7 Q3 2019 Results Continuing Operations Diluted EPS Average non-interest bearing deposits Average deposits Q3 2018 Q3 2019 Change Tangible book value per share(1) $638 million $561 million $76 million $1.95 billion $1.65 billion $297 million $0.33 $0.27 $0.06 $13.91 $11.37 $2.54 Loans held for inves
Slide 8: 2019 Priorities
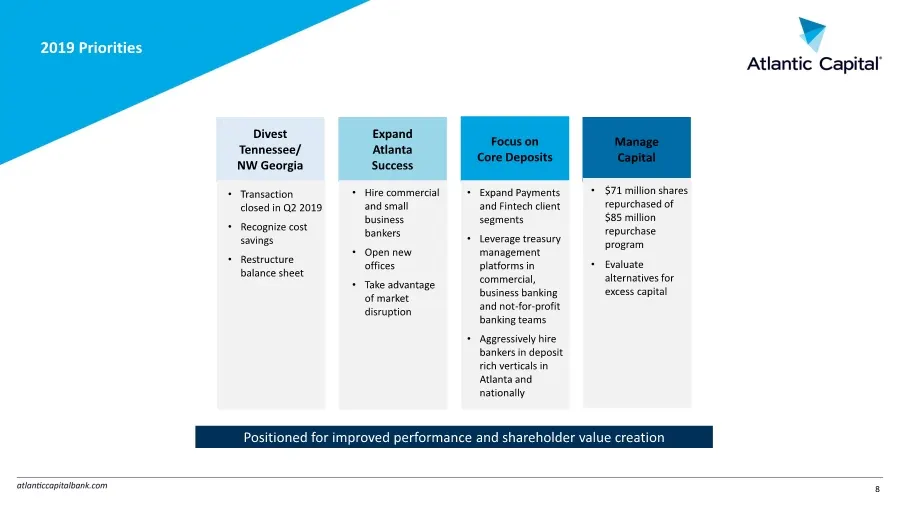
8 2019 Priorities Manage Capital Expand Atlanta Success Focus on Core Deposits • $71 million shares repurchased of $85 million repurchase program • Evaluate alternatives for excess capital Positioned for improved performance and shareholder value creation • Hire commercial and small business bankers
Slide 9: Commercial Lending Focus
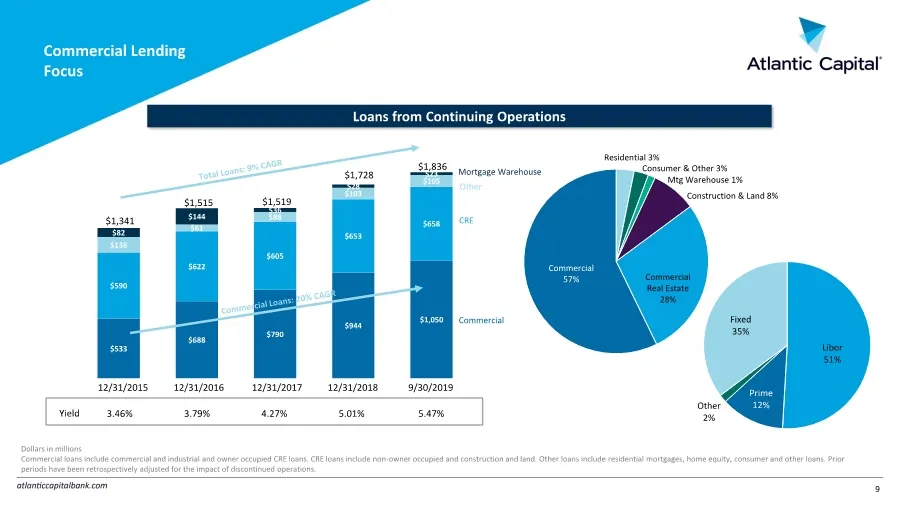
Commercial Lending Focus Loans from Continuing Operations Yield $533 $688 $790 $944 $1,050 $590 $622 $605 $653 $658 $136 $61 $88 $103 $105 $82 $144 $36 $28 $23 $1,341 $1,519 Commercial 57% Residential 3% Mtg Warehouse 1% Construction & Land 8% Commercial Real Estate 28% Consumer & Other 3% Commercia
Slide 10: Superior Credit Quality
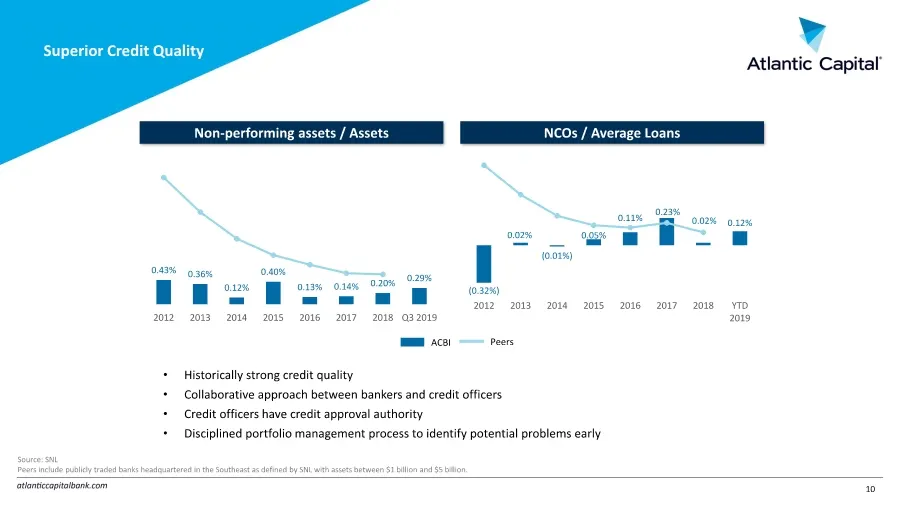
Superior Credit Quality Non-performing assets / Assets NCOs / Average Loans ACBI Peers • Historically strong credit quality • Collaborative approach between bankers and credit officers • Credit officers have credit approval authority • Disciplined portfolio management process to identify potential p
Slide 11: Strong Core Deposit Franchise
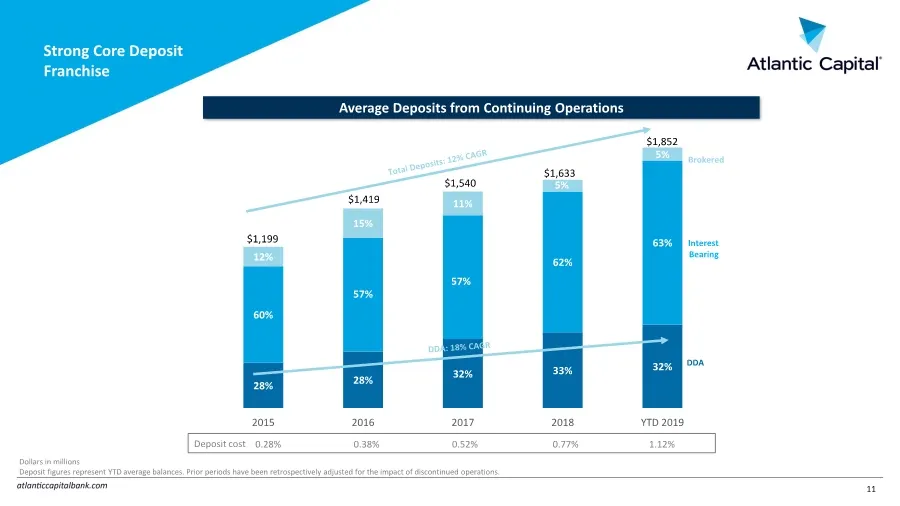
Strong Core Deposit Franchise 11 Average Deposits from Continuing Operations Dollars in millions Deposit figures represent YTD average balances. Prior periods have been retrospectively adjusted for the impact of discontinued operations. 28% 28% 32% 33% 32% 60% 57% 57% 62% 63% 12% 15% 11% 5% 5% 2015
Slide 12: Net Interest Margin
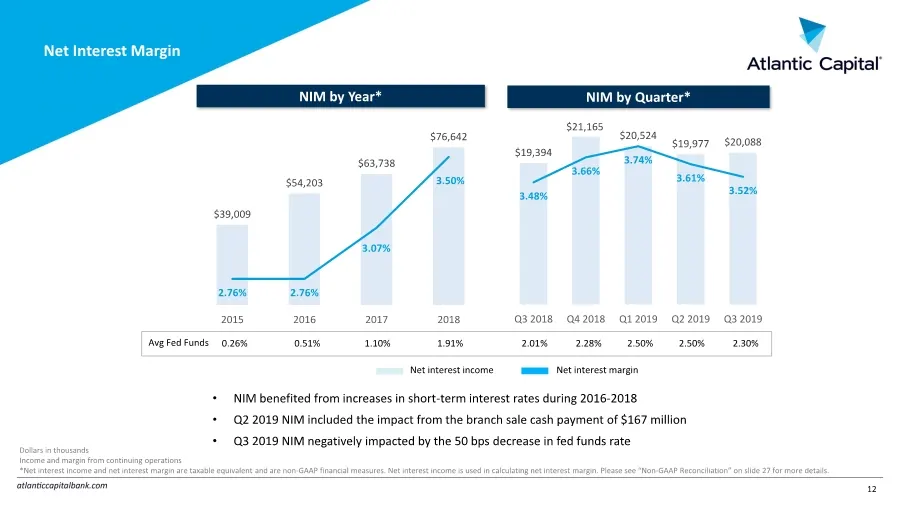
$19,394 $21,165 $20,524 $19,977 $20,088 3.48% 3.66% 3.74% 3.61% 3.52% Q3 2018 Q4 2018 Q1 2019 Q2 2019 Q3 2019 Net Interest Margin 12 Net interest income NIM by Year* NIM by Quarter* Net interest margin Dollars in thousands Income and margin from continuing operations *Net interest income and net int
Slide 13: Disciplined Expense Management
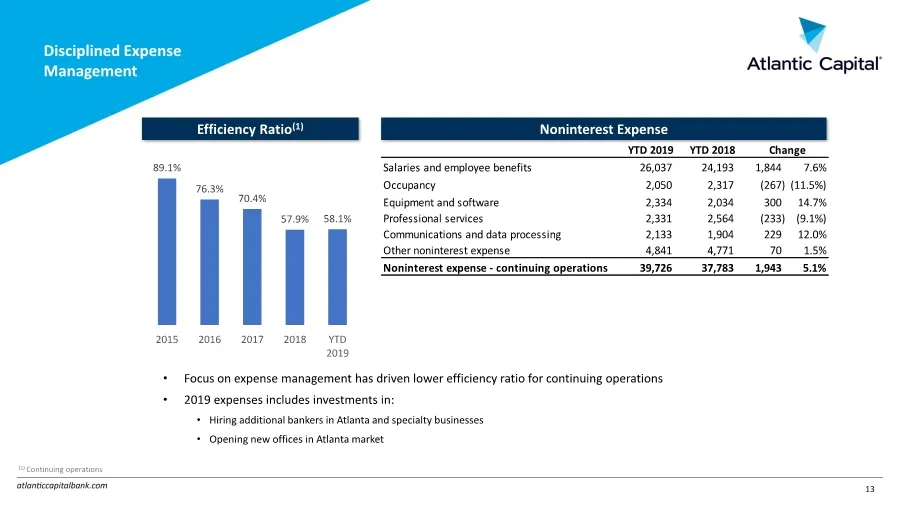
Disciplined Expense Management 13 Efficiency Ratio(1) Noninterest Expense 89.1% 76.3% 70.4% 57.9% 58.1% 2015 2016 2017 2018 YTD 2019 • Focus on expense management has driven lower efficiency ratio for continuing operations • 2019 expenses includes investments in: • Hiring additional bankers in Atlan
Slide 14: Atlanta's Hometown Business Bank
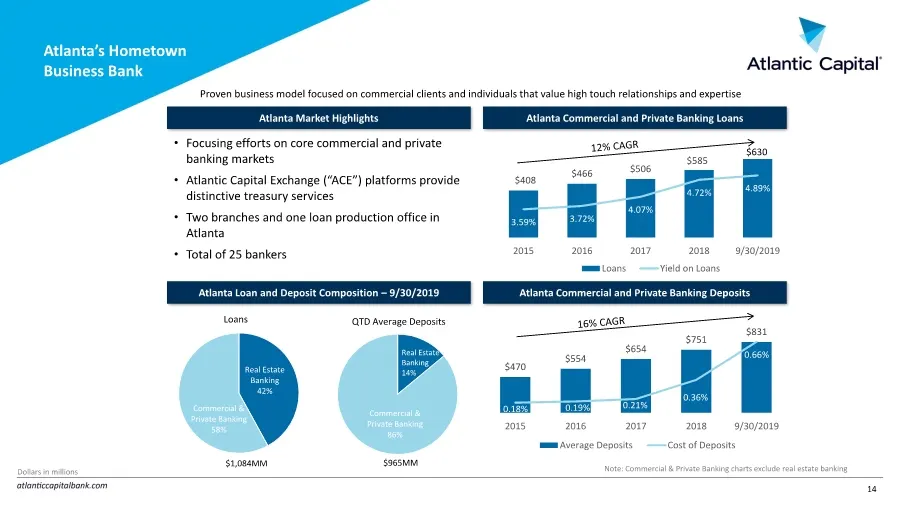
Atlanta’s Hometown Business Bank 14 • Focusing efforts on core commercial and private banking markets • Atlantic Capital Exchange (“ACE”) platforms provide distinctive treasury services • Two branches and one loan production office in Atlanta • Total of 25 bankers Atlanta Commercial and Private Bank
Slide 15: Growing Payments / Fintech Business
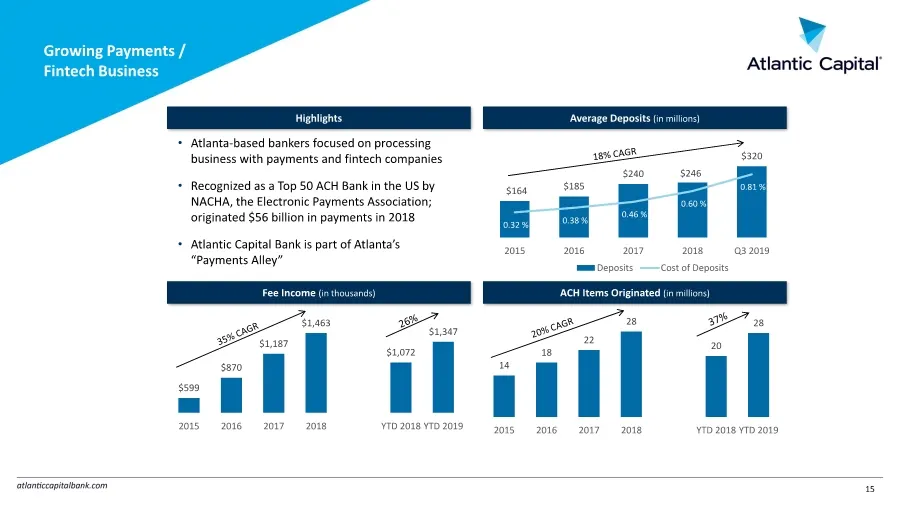
Growing Payments / Fintech Business 15 $599 $870 $1,187 $1,463 $1,072 $1,347 2015 2016 2017 2018 YTD 2018 YTD 2019 • Atlanta-based bankers focused on processing business with payments and fintech companies • Recognized as a Top 50 ACH Bank in the US by NACHA, the Electronic Payments Association; ori
Slide 16: Specialty Lending Businesses
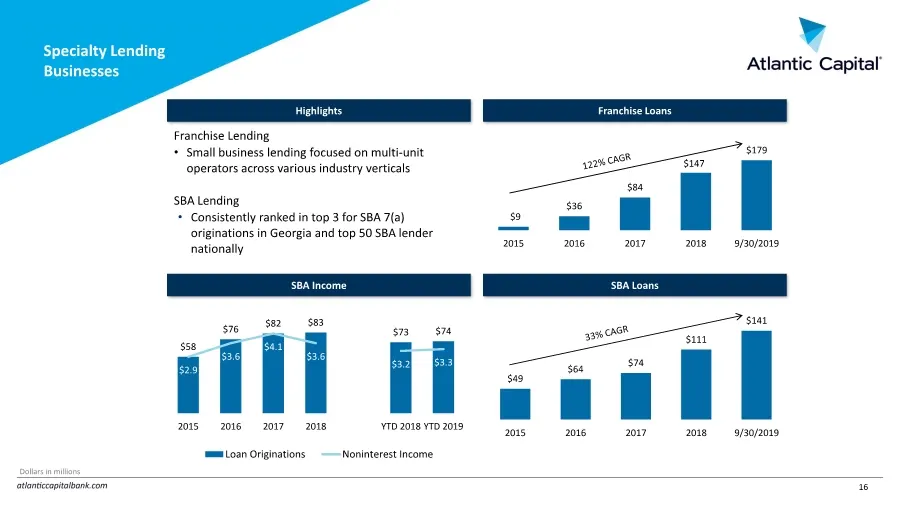
September 29, 2019 16 Specialty Lending Businesses Franchise Lending • Small business lending focused on multi-unit operators across various industry verticals SBA Lending • Consistently ranked in top 3 for SBA 7(a) originations in Georgia and top 50 SBA lender nationally $49 $64 $74 $111 $141 2015
Slide 17: Strong Capital Position
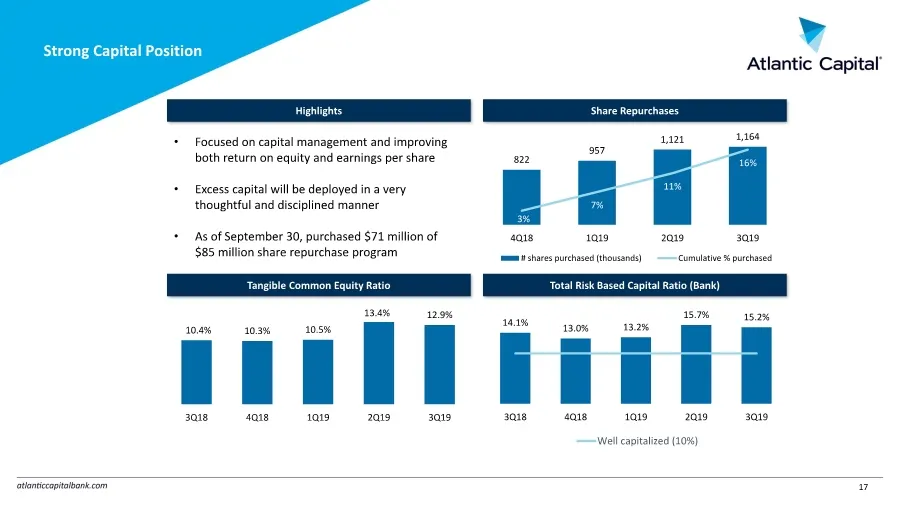
September 29, 2019 17 822 957 1,121 1,164 3% 7% 11% 16% 4Q18 1Q19 2Q19 3Q19 # shares purchased (thousands) Cumulative % purchased Strong Capital Position • Focused on capital management and improving both return on equity and earnings per share • Excess capital will be deployed in a very thoughtful
Slide 18: Achievable Operating Leverage
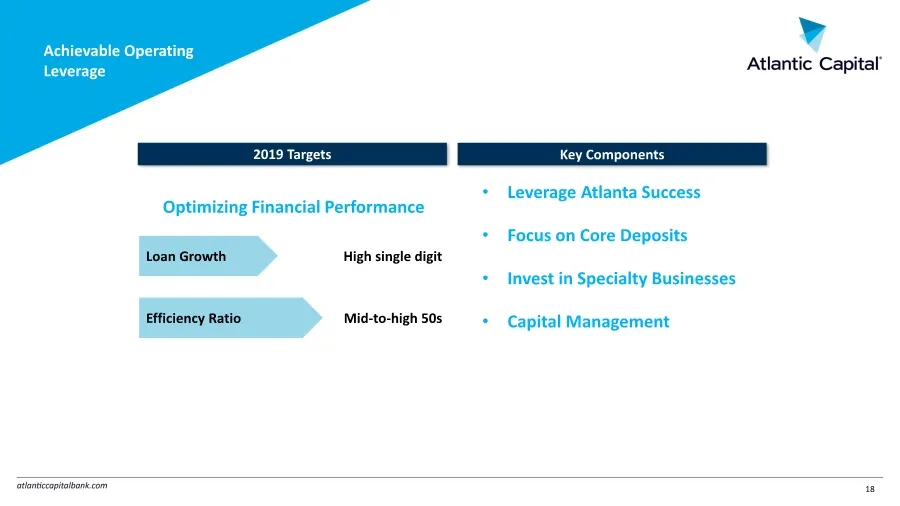
Achievable Operating Leverage 18 High single digit Loan Growth Mid-to-high 50s Efficiency Ratio Optimizing Financial Performance 2019 Targets Key Components • Invest in Specialty Businesses • Capital Management • Leverage Atlanta Success • Focus on Core Deposits
Slide 19: Appendix
v Atlantic Capital’ Appendix
Slide 20: Management Biographies
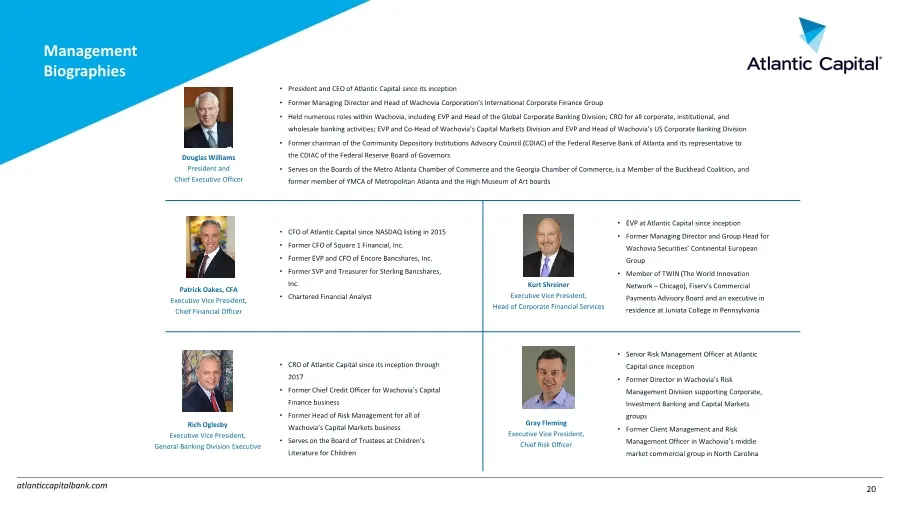
Management Biographies 20 Douglas Williams President and Chief Executive Officer • President and CEO of Atlantic Capital since its inception • Former Managing Director and Head of Wachovia Corporation’s International Corporate Finance Group • Held numerous roles within Wachovia, including EVP and He
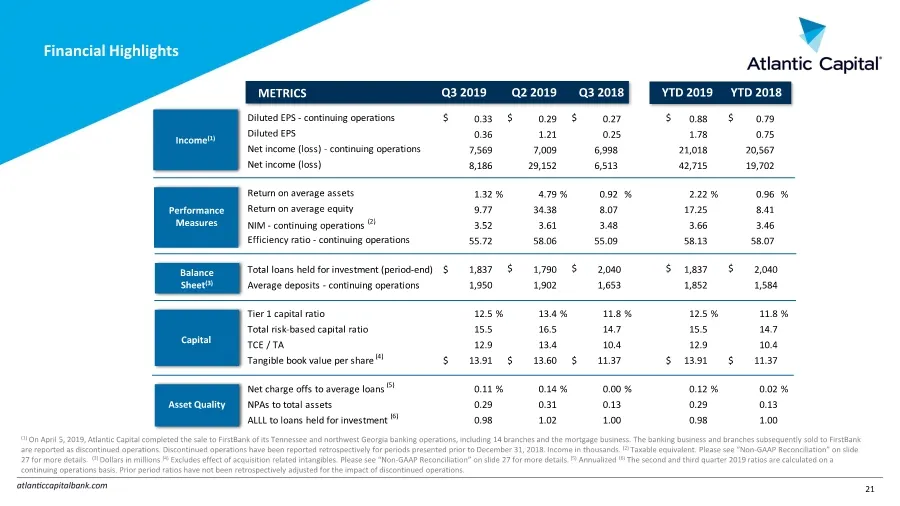
Slide 21: Financial Highlights
Financial Highlights 21 Income(1) Balance Sheet(3) Capital Asset Quality METRICS Q2 2019 Q3 2019 Q3 2018 YTD 2019 YTD 2018 Performance Measures (1) On April 5, 2019, Atlantic Capital completed the sale to FirstBank of its Tennessee and northwest Georgia banking operations, including 14 branches and
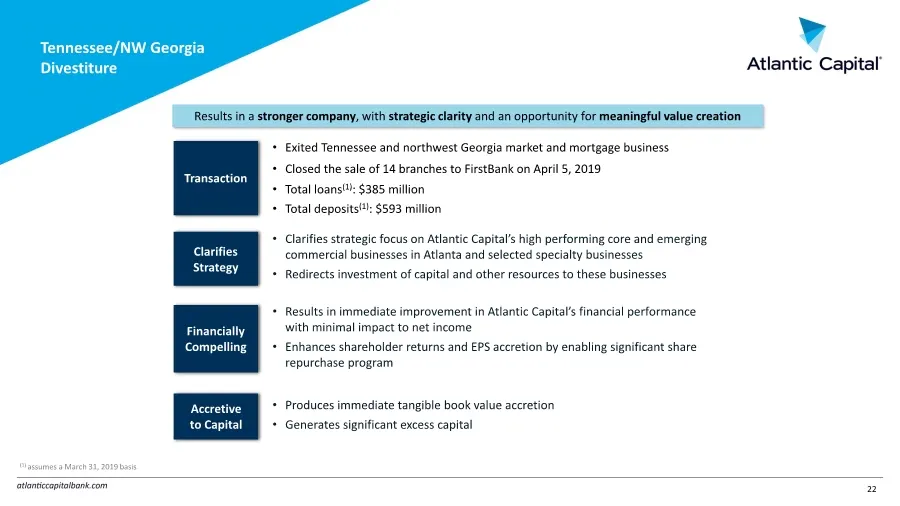
Slide 22: Tennessee/NW Georgia Divestiture
Tennessee/NW Georgia Divestiture • Exited Tennessee and northwest Georgia market and mortgage business • Closed the sale of 14 branches to FirstBank on April 5, 2019 • Total loans(1): $385 million • Total deposits(1): $593 million Transaction Balance Sheet Impact(1) Projected Impact (1) assumes a Ma
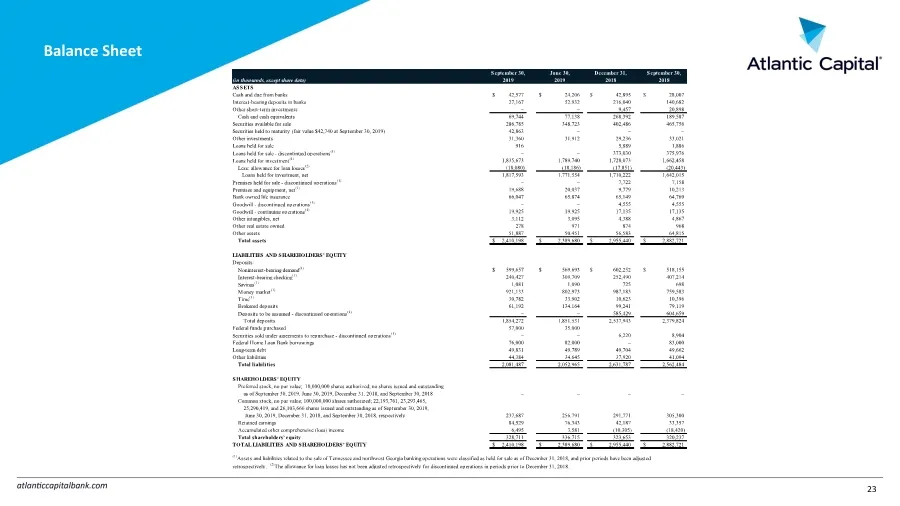
Slide 23: Balance Sheet
Balance Sheet 23 September 30, June 30, December 31, September 30, (in thousands, except share data) 2019 2019 2018 2018 ASSETS Cash and due from banks $ 42,577 $ 24,206 $ 42,895 $ 28,007 Interest-bearing deposits in banks 27,167 52,932 216,040 140,682 Other short-term investments – – 9,457 20,898 C
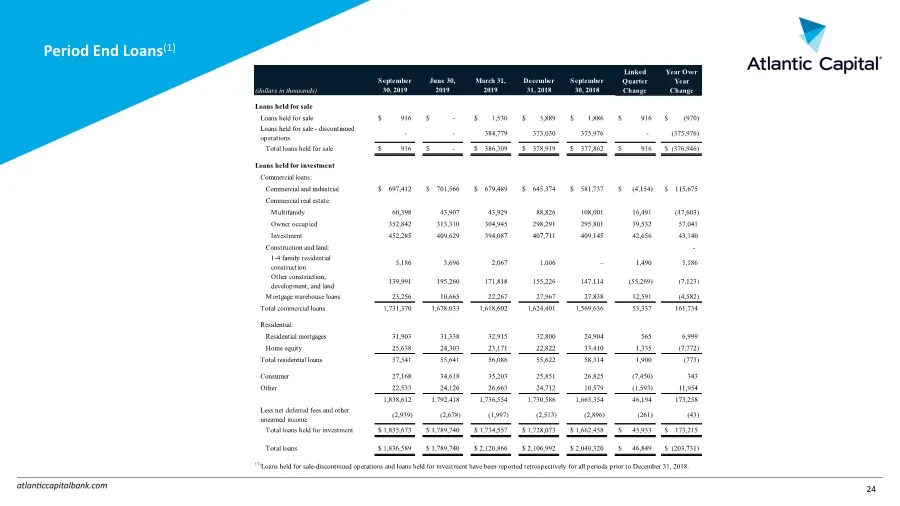
Slide 24: Period End Loans
Period End Loans(1) 24 (dollars in thousands) September 30, 2019 June 30, 2019 March 31, 2019 December 31, 2018 September 30, 2018 Loans held for sale Loans held for sale $ 916 $ - $ 1,530 $ 5,889 $ 1,886 $ 916 $ (970) Loans held for sale - discontinued operations - - 384,779 373,030 375,976 - (375,
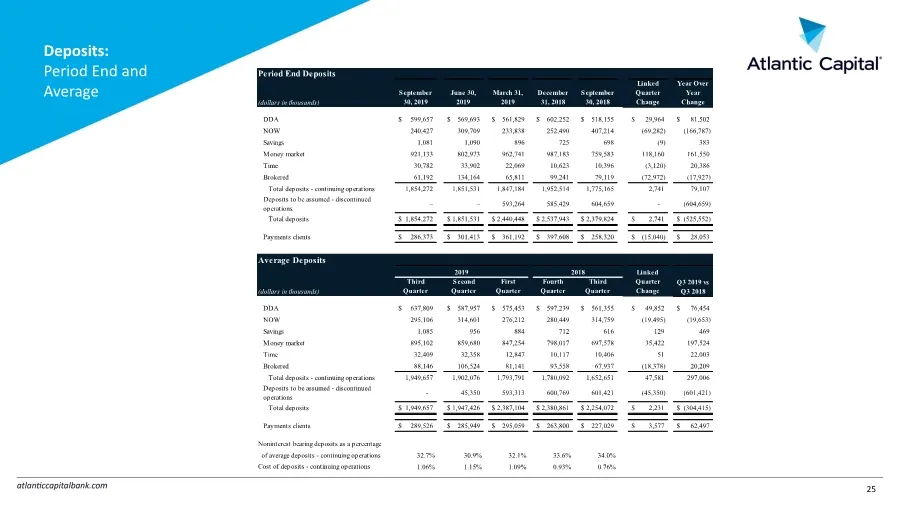
Slide 25: Period End Deposits
Period End Deposits (dollars in thousands) September 30, 2019 June 30, 2019 March 31, 2019 December 31, 2018 September 30, 2018 Linked Quarter Change Year Over Year Change DDA $ 599,657 $ 569,693 $ 561,829 $ 602,252 $ 518,155 $ 29,964 $ 81,502 NOW 240,427 309,709 233,838 252,490 407,214 (69,282) (16
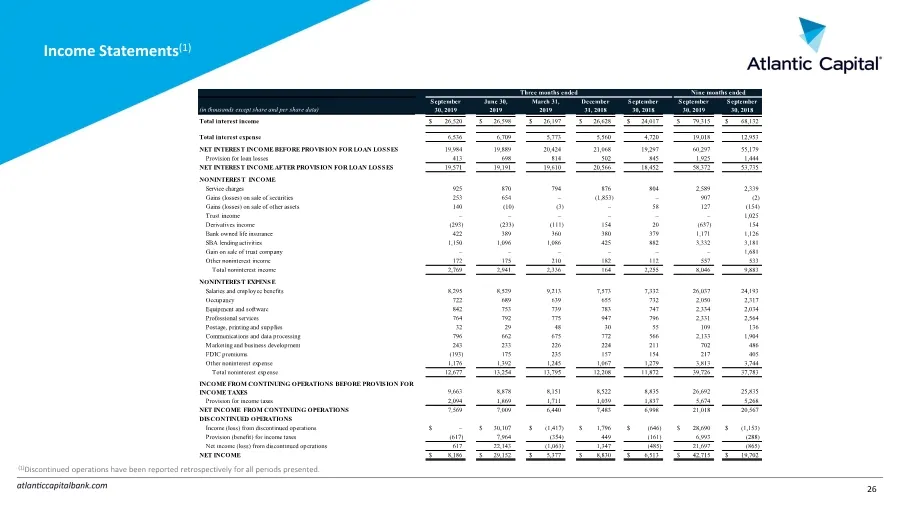
Slide 26: Income Statements
Income Statements(1) 26 (1)Discontinued operations have been reported retrospectively for all periods presented. (in thousands except share and per share data) September 30, 2019 June 30, 2019 March 31, 2019 December 31, 2018 September 30, 2018 September 30, 2019 September 30, 2018 Total interest in
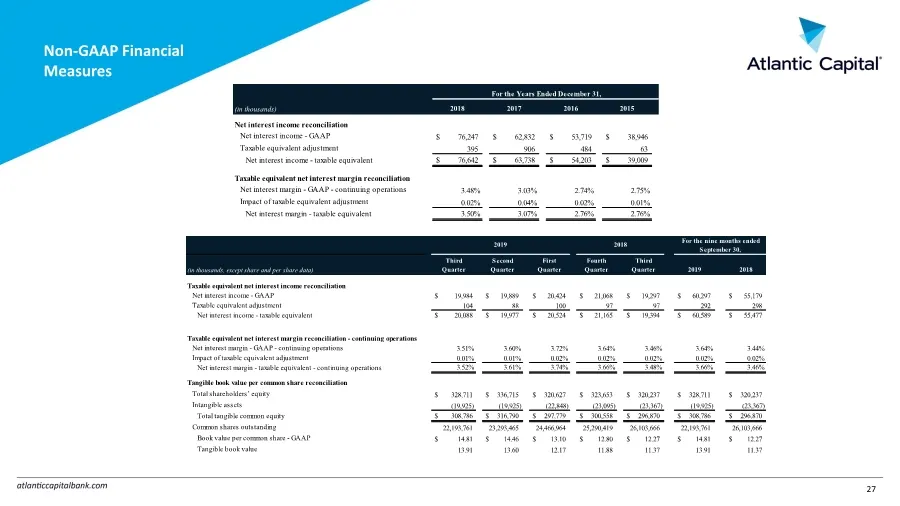
Slide 27: Non-GAAP Financial Measures
Non-GAAP Financial Measures 27 (in thousands, except share and per share data) Third Quarter Second Quarter First Quarter Fourth Quarter Third Quarter 2019 2018 Taxable equivalent net interest income reconciliation Net interest income - GAAP $ 19,984 $ 19,889 $ 20,424 $ 21,068 $ 19,297 $ 60,297 $ 55
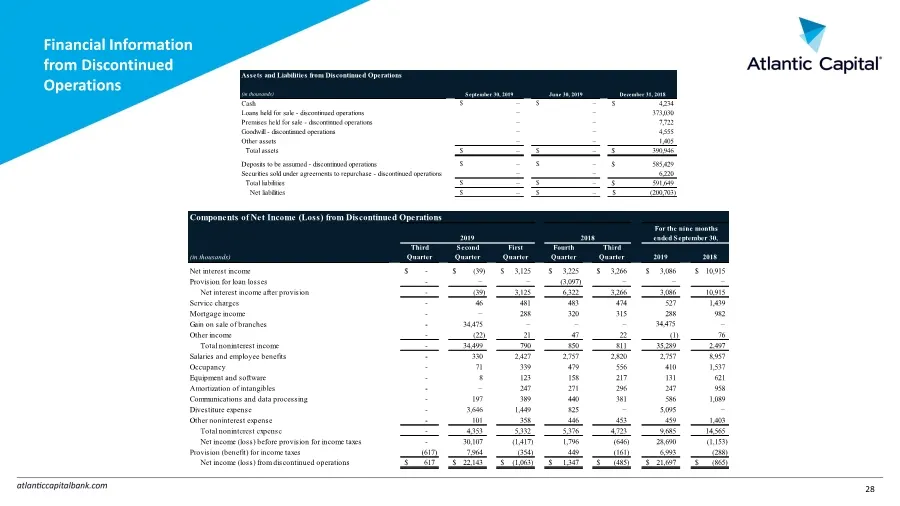
Slide 28: Financial Information from Discontinued Operations
Financial Information from Discontinued Operations 28 Assets and Liabilities from Discontinued Operations (in thousands) Cash Loans held for sale - discontinued operations Premises held for sale - discontinued operations Goodwill - discontinued operations Other assets Total assets Deposits to be ass
Slide 29: Thank You
v Atlantic Capital’ Thank You
Source: SEC EDGAR · 8-K filed Nov 4, 2019
More decks from Atlantic Capital Bancshares Inc
 Q4 2021 Earnings Presentation27 slides · Jan 24, 2022
 Q3 2021 Earnings Presentation30 slides · Oct 27, 2021
 Q3 2021 Earnings Presentation40 slides · Oct 27, 2021
 Q2 2021 Earnings Presentation33 slides · Jul 23, 2021
 Merger or Acquisition (July 2021)16 slides · Jul 23, 2021
 Q2 2021 Earnings Presentation39 slides · Jul 23, 2021