Newalliance Bancshares — Sidoti & Company Second Annual Emerging Growth Institutional Investor Forum 2005
32 slides from Newalliance Bancshares's conference presentation, Jun 7, 2005
Slide 1: Presentation
Presentation Sidoti & Company Second Annual Emerging Growth Institutional Investor Forum June 2005
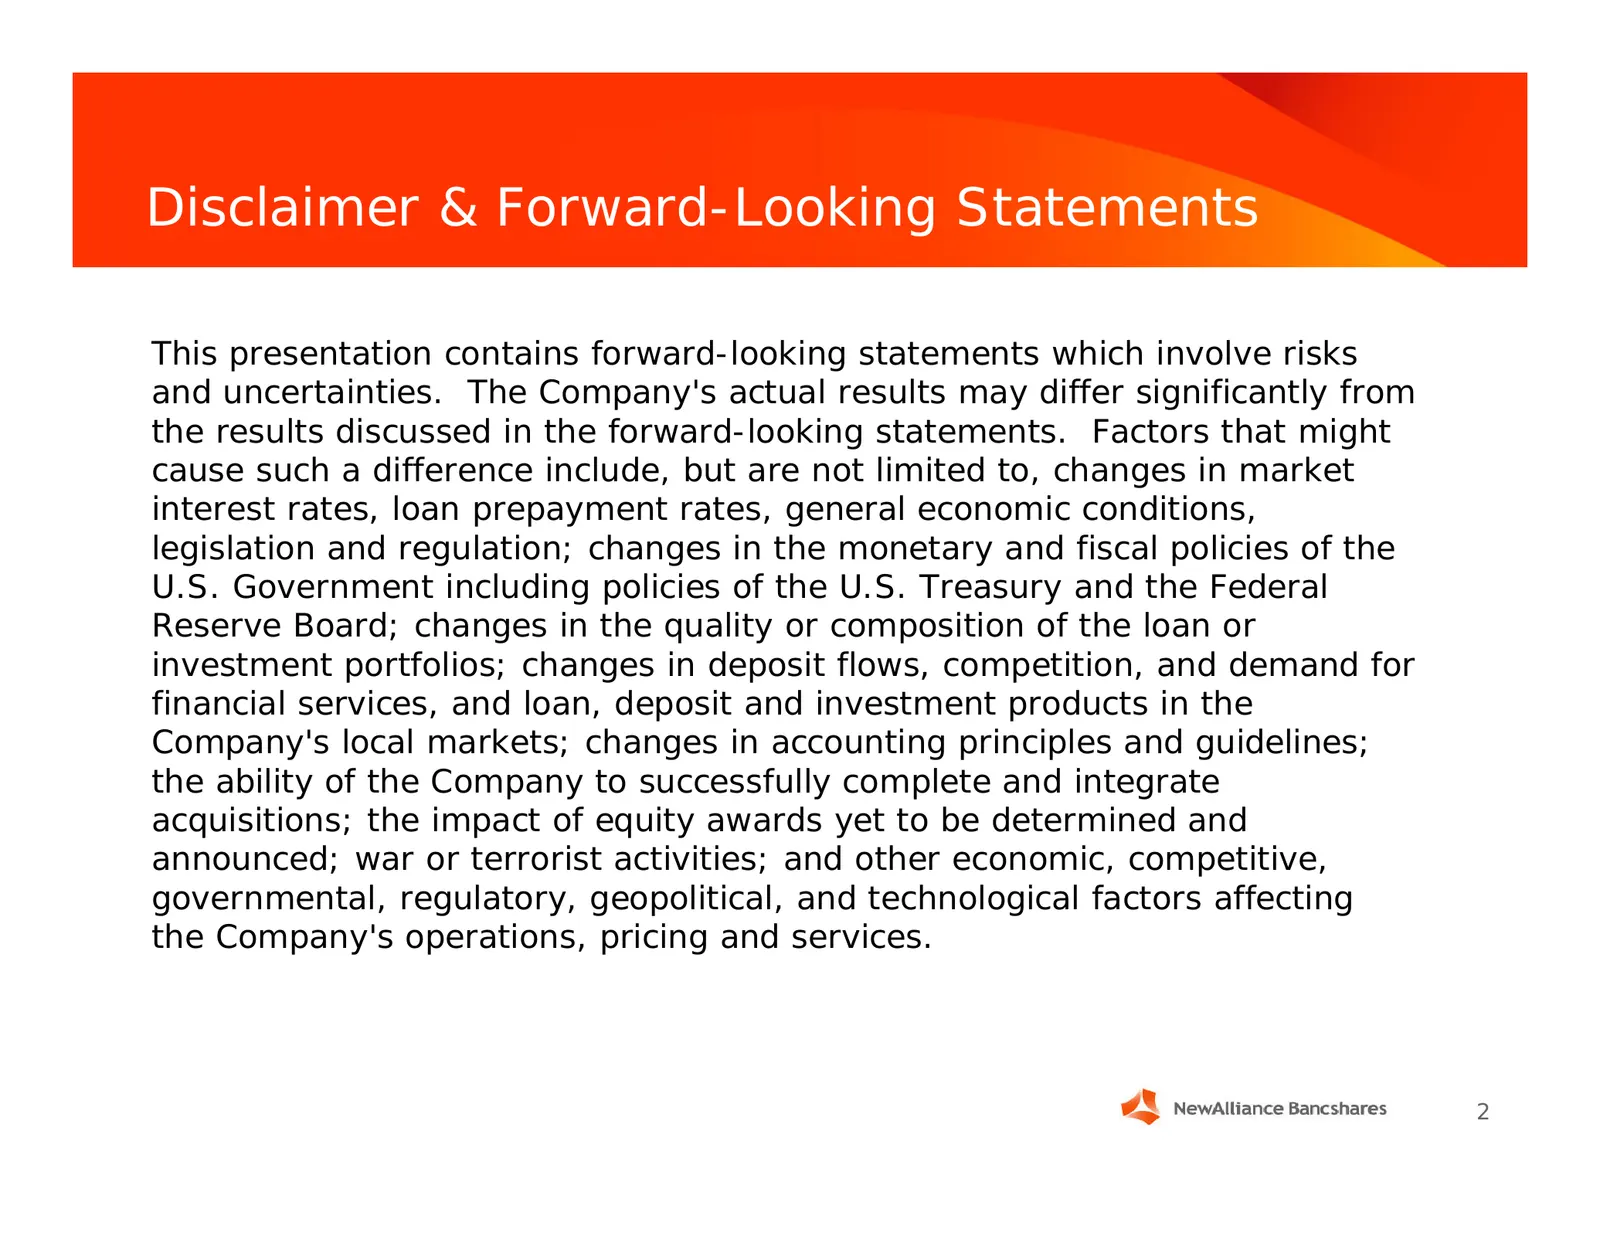
Slide 2: Disclaimer & Forward-Looking Statements
Disclaimer & Forward-Looking Statements This presentation contains forward-looking statements which involve risks and uncertainties. The Company's actual results may differ significantly from the results discussed in the forward-looking statements. Factors that might cause such a difference include,
Slide 3: Strategic Priorities
Strategic Priorities • Maintain Sound Financial Performance • Manage Our Capital • Grow Profitably • Manage Risk • Sustain Investor Interest
Slide 4: Financial Performance
Financial Performance
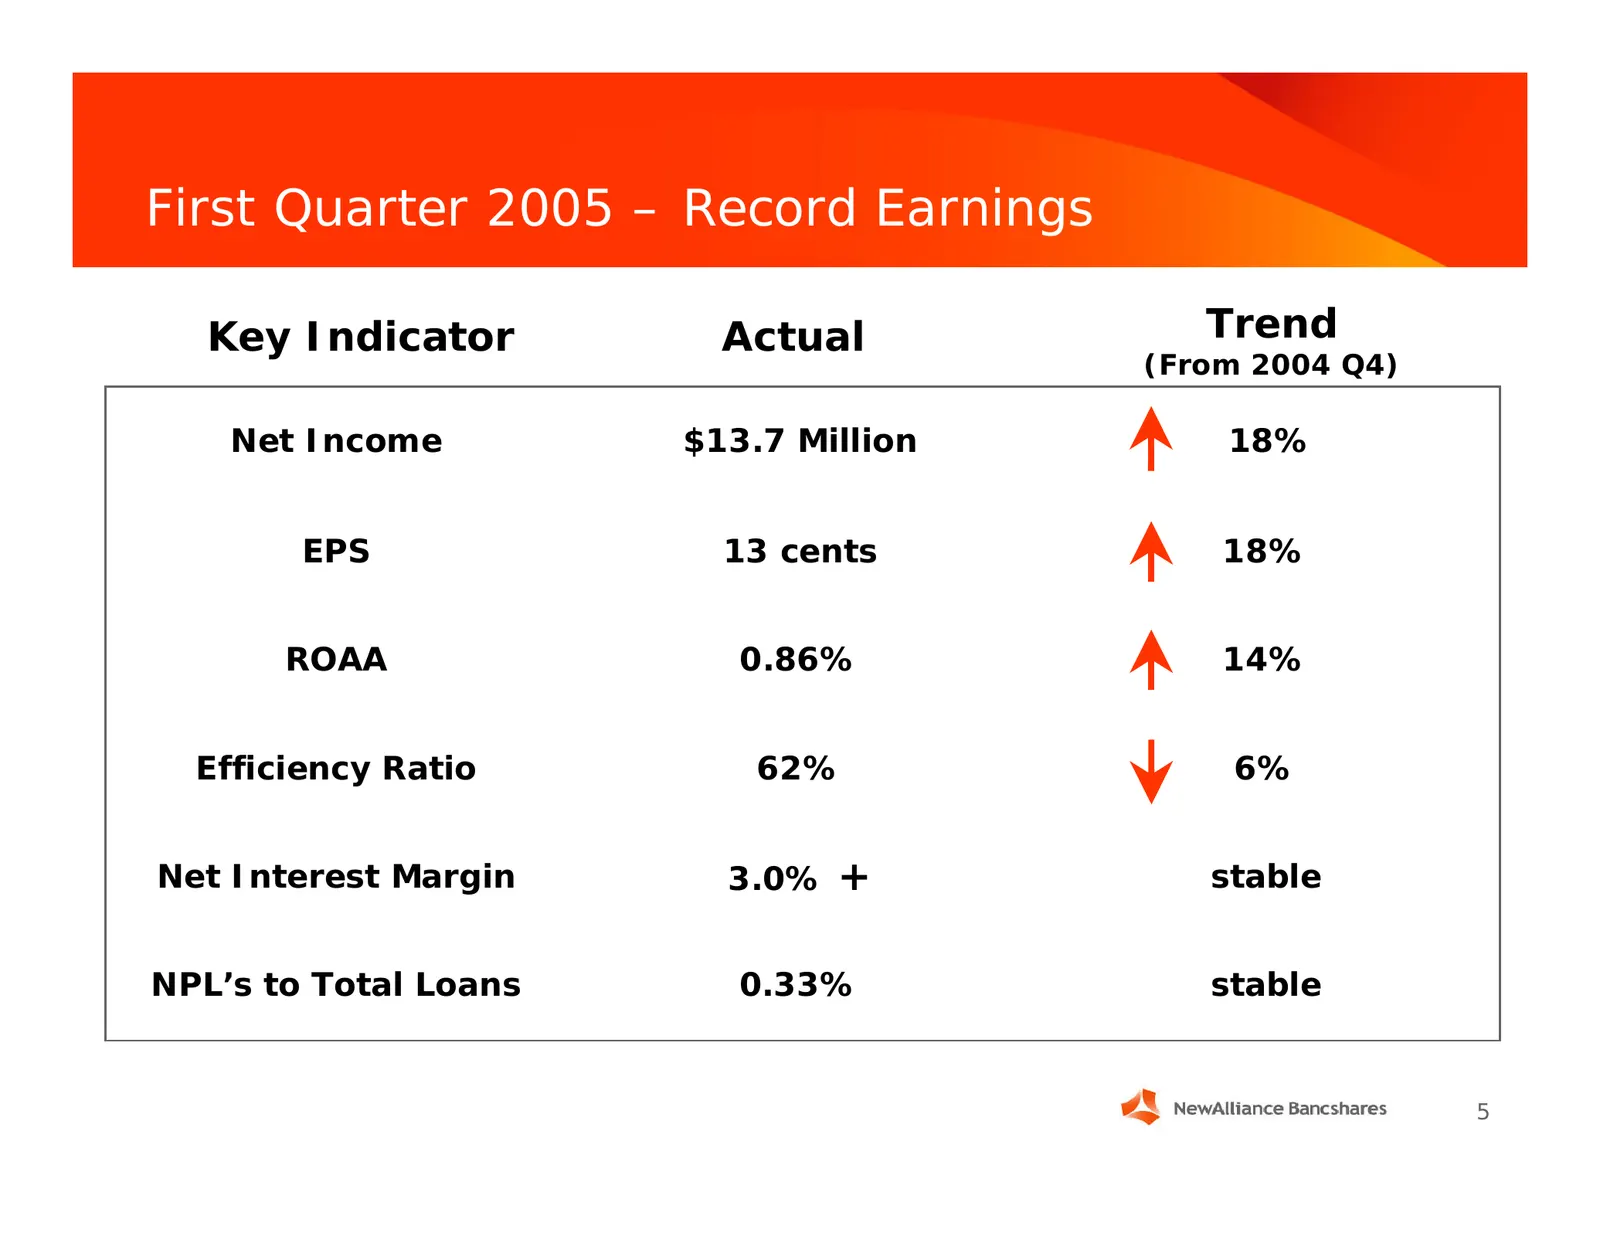
Slide 5: First Quarter 2005 – Record Earnings
First Quarter 2005 – Record Earnings Key Indicator Actual Trend (From 2004 Q4) Net Income $13.7 Million 18% EPS 13 cents 18% ROAA 0.86% 14% Efficiency Ratio 62% 6% Net Interest Margin 3.0% + stable NPL’s to Total Loans 0.33% stable 5
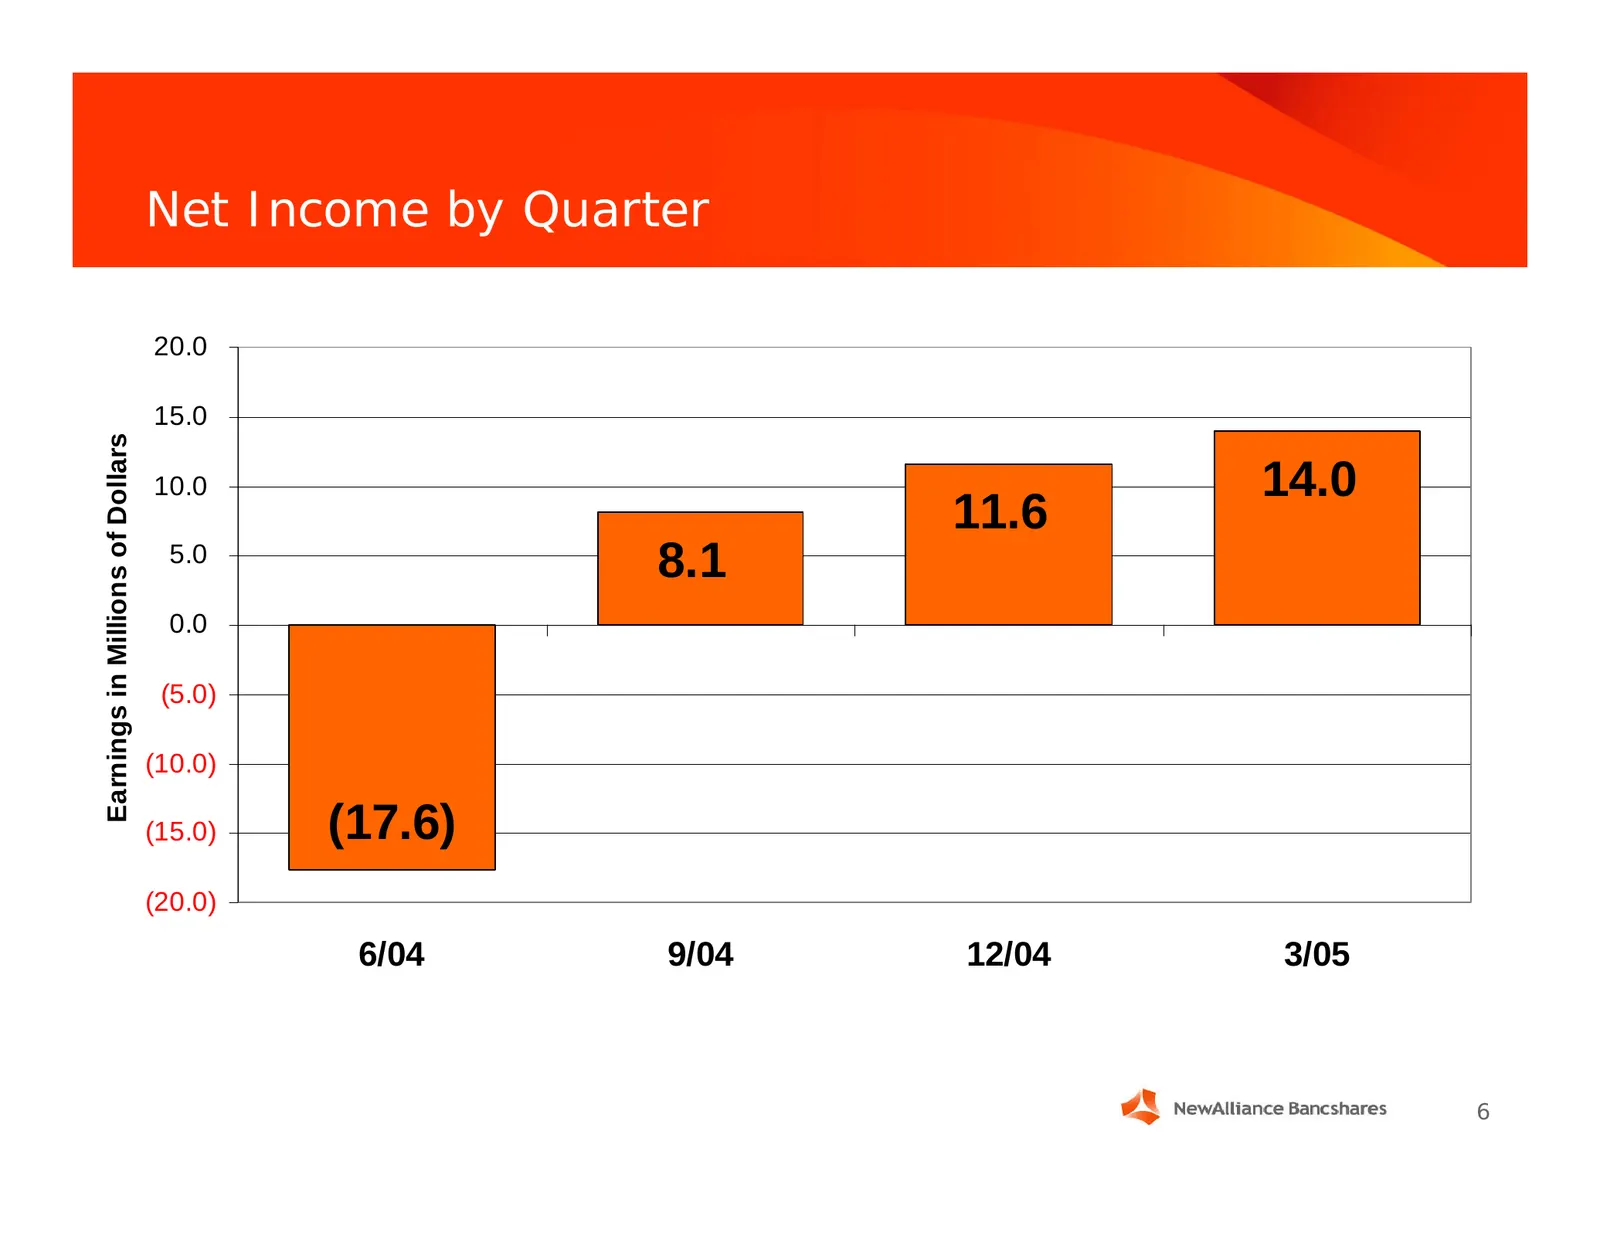
Slide 6: Net Income by Quarter
Net Income by Quarter 20.0 15.0 Earnings in Millions of Dollars 10.0 14.0 11.6 5.0 8.1 0.0 (5.0) (10.0) (15.0) (17.6) (20.0) 6/04 9/04 12/04 3/05 6
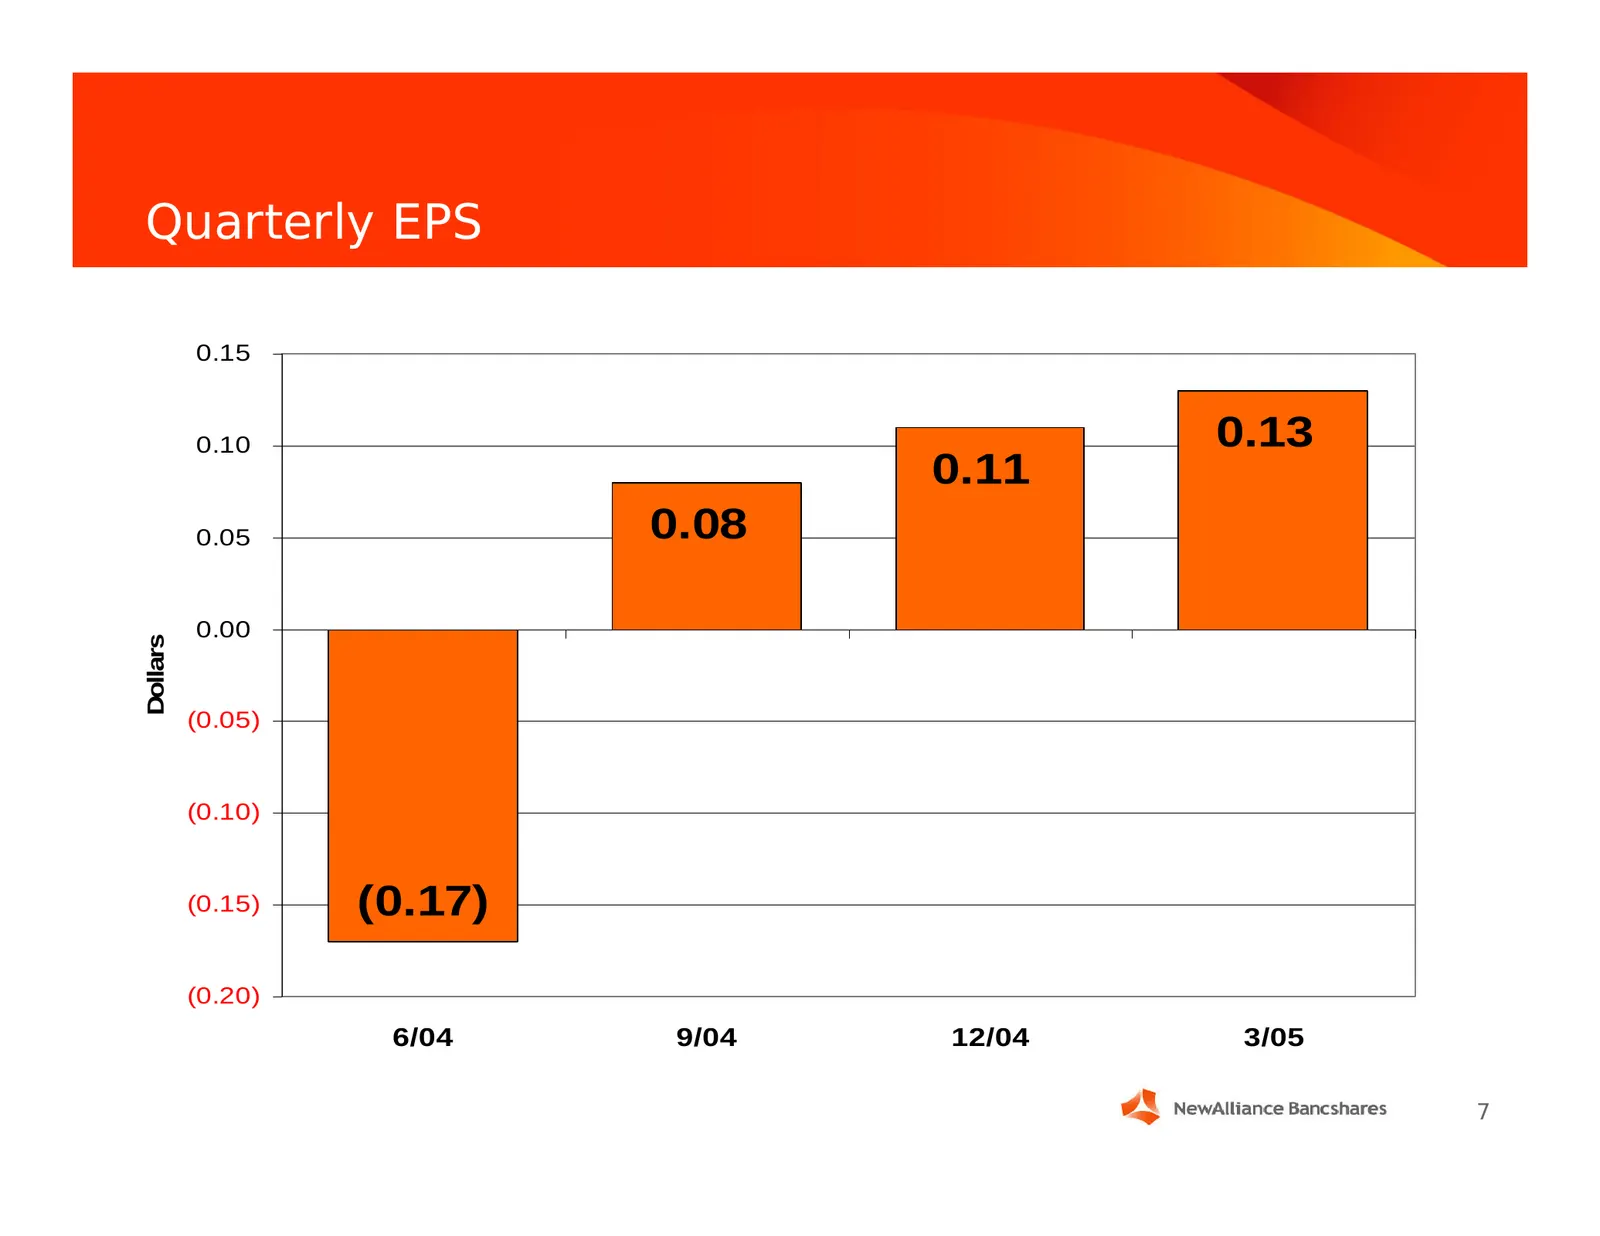
Slide 7: Quarterly EPS
Quarterly EPS 0.15 0.10 0.13 0.11 0.05 0.08 0.00 Dollars (0.05) (0.10) (0.15) (0.17) (0.20) 6/04 9/04 12/04 3/05 7
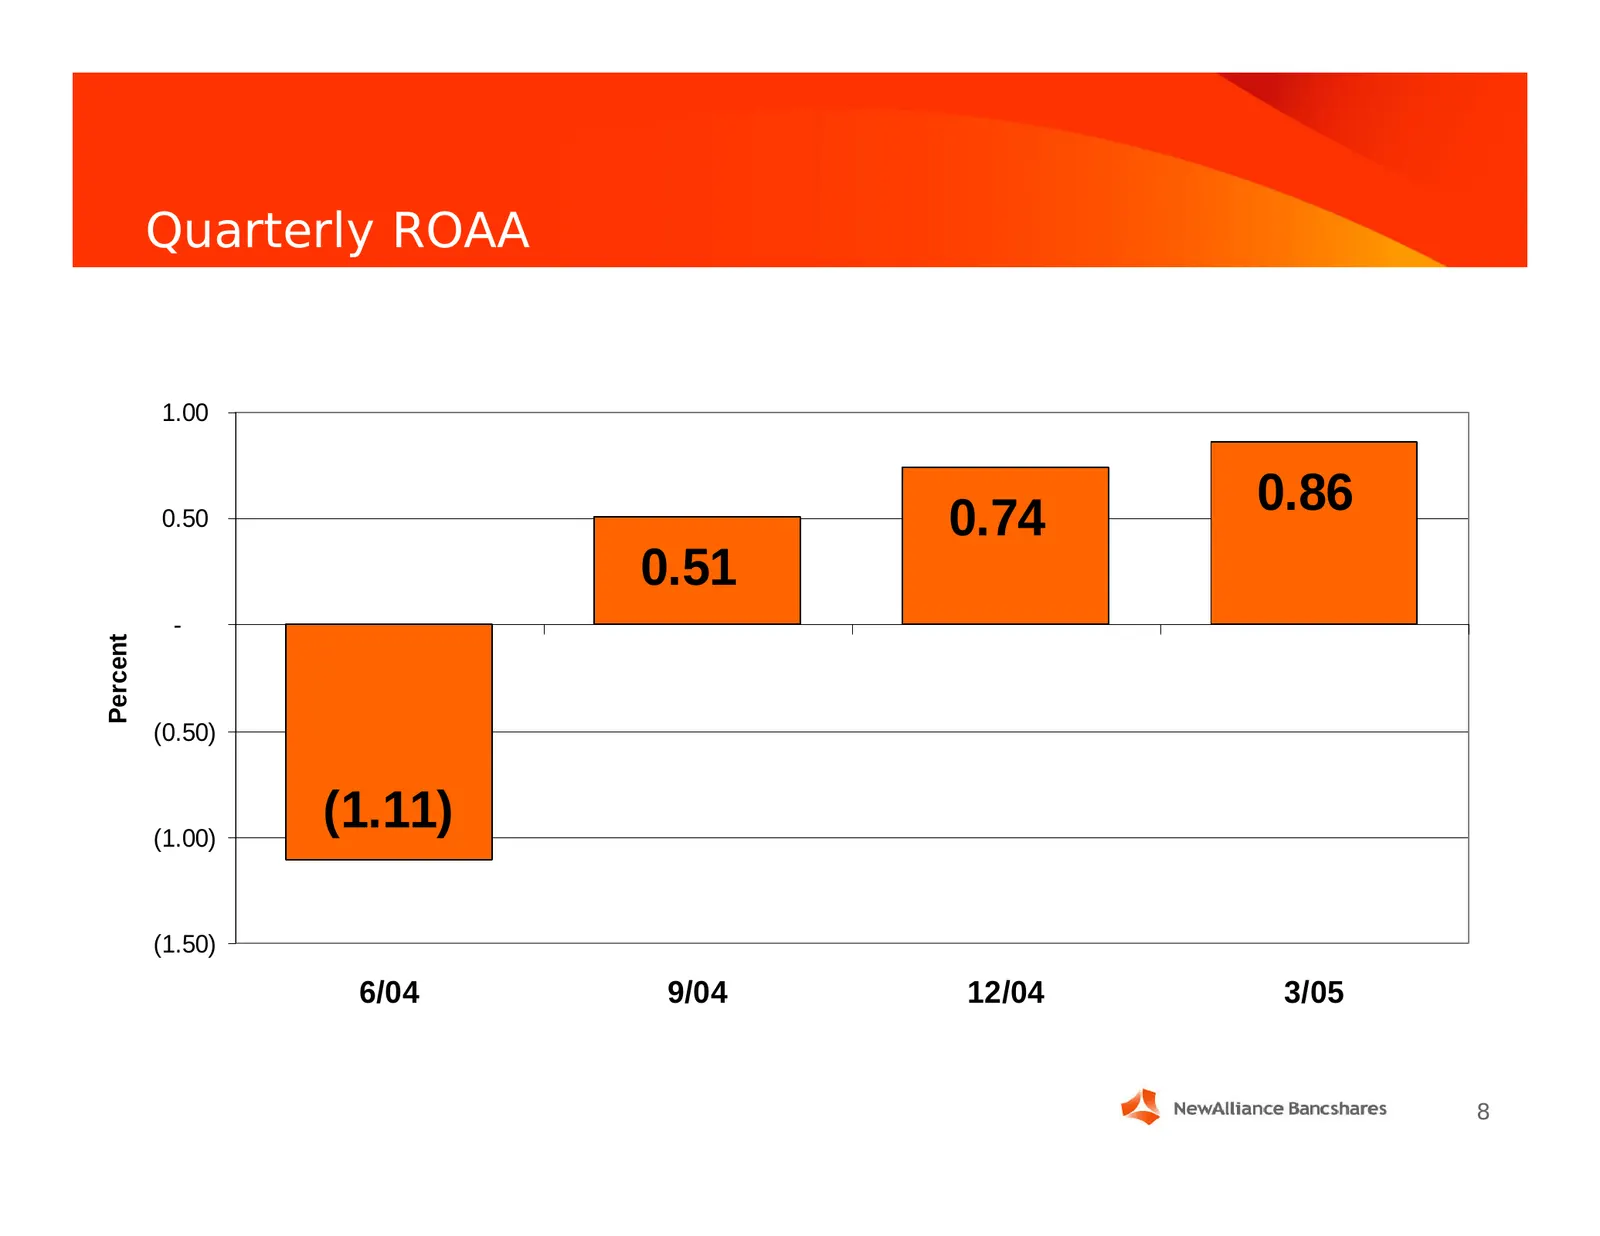
Slide 8: Quarterly ROAA
Quarterly ROAA 1.00 0.50 0.74 0.86 0.51 - Percent (0.50) (1.00) (1.11) (1.50) 6/04 9/04 12/04 3/05 8
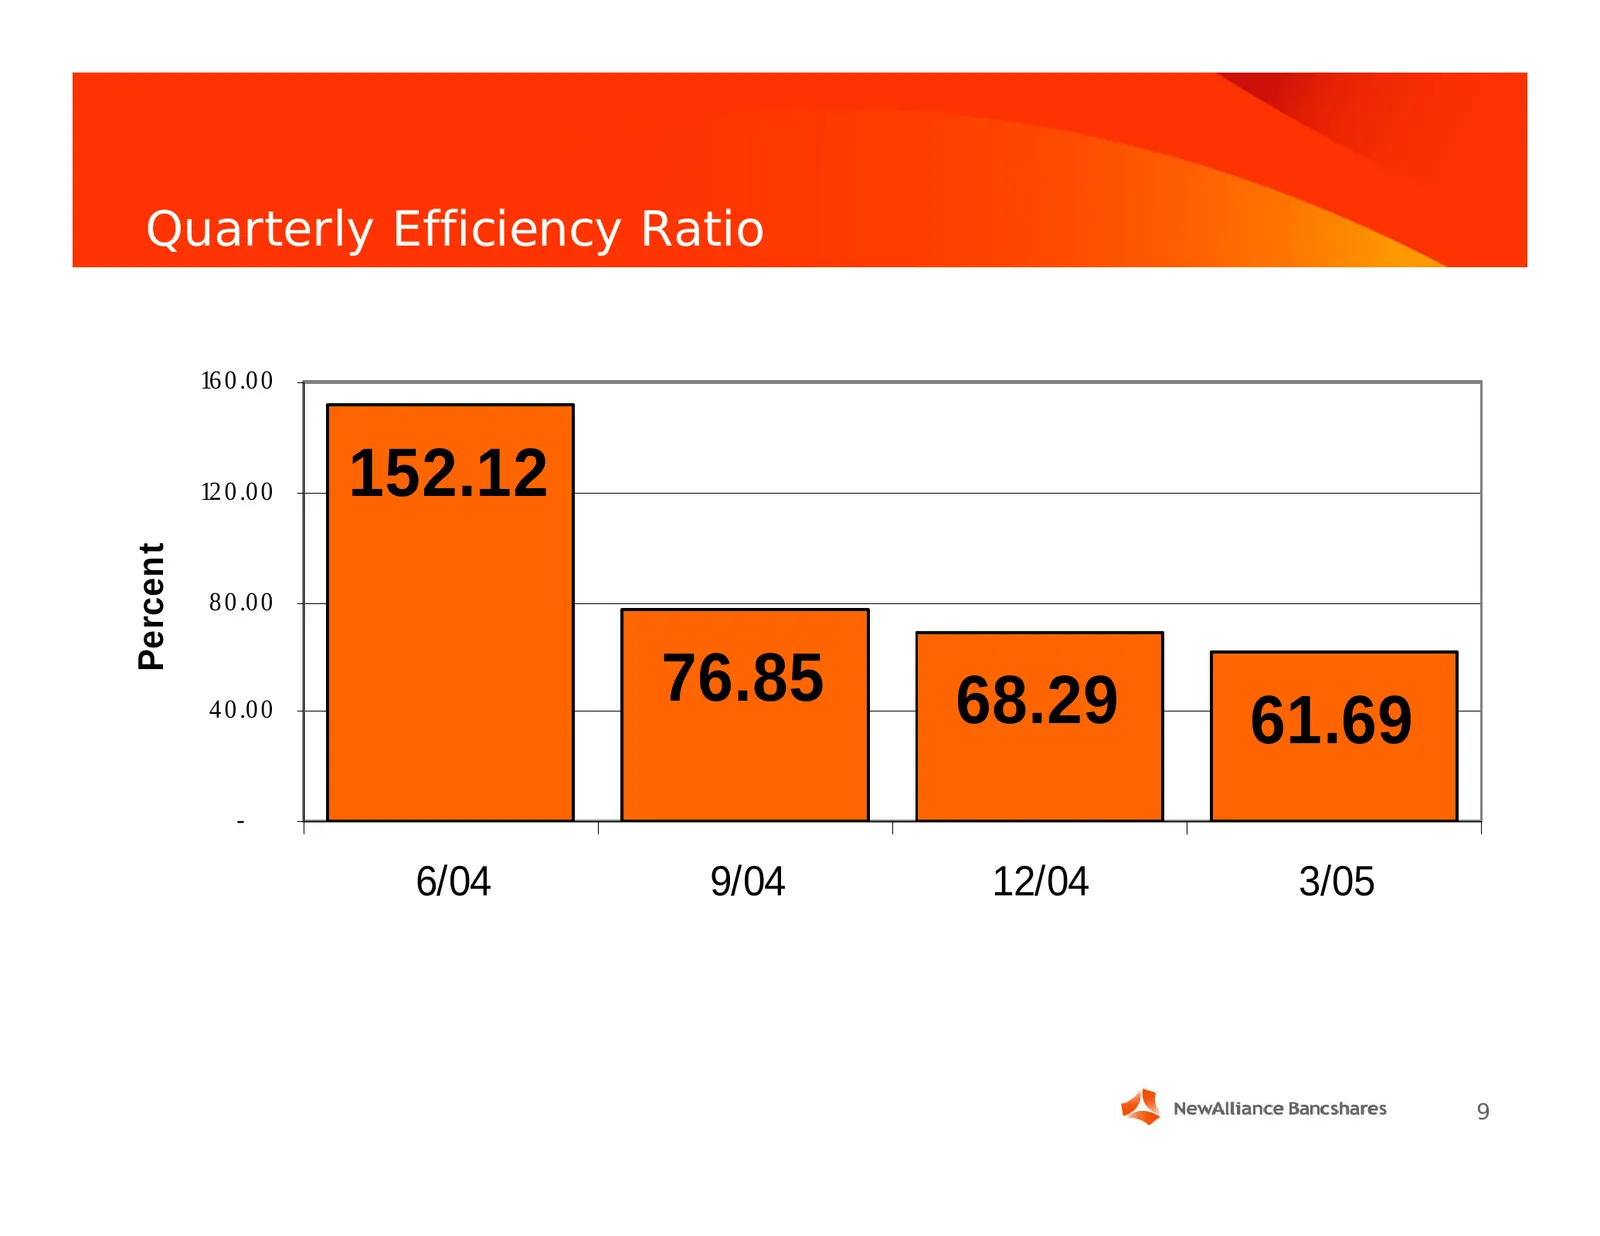
Slide 9: Quarterly Efficiency Ratio
Quarterly Efficiency Ratio 16 0 .0 0 12 0 .0 0 152.12 Percent 8 0 .0 0 76.85 68.29 4 0 .0 0 61.69 - 6/04 9/04 12/04 3/05 9
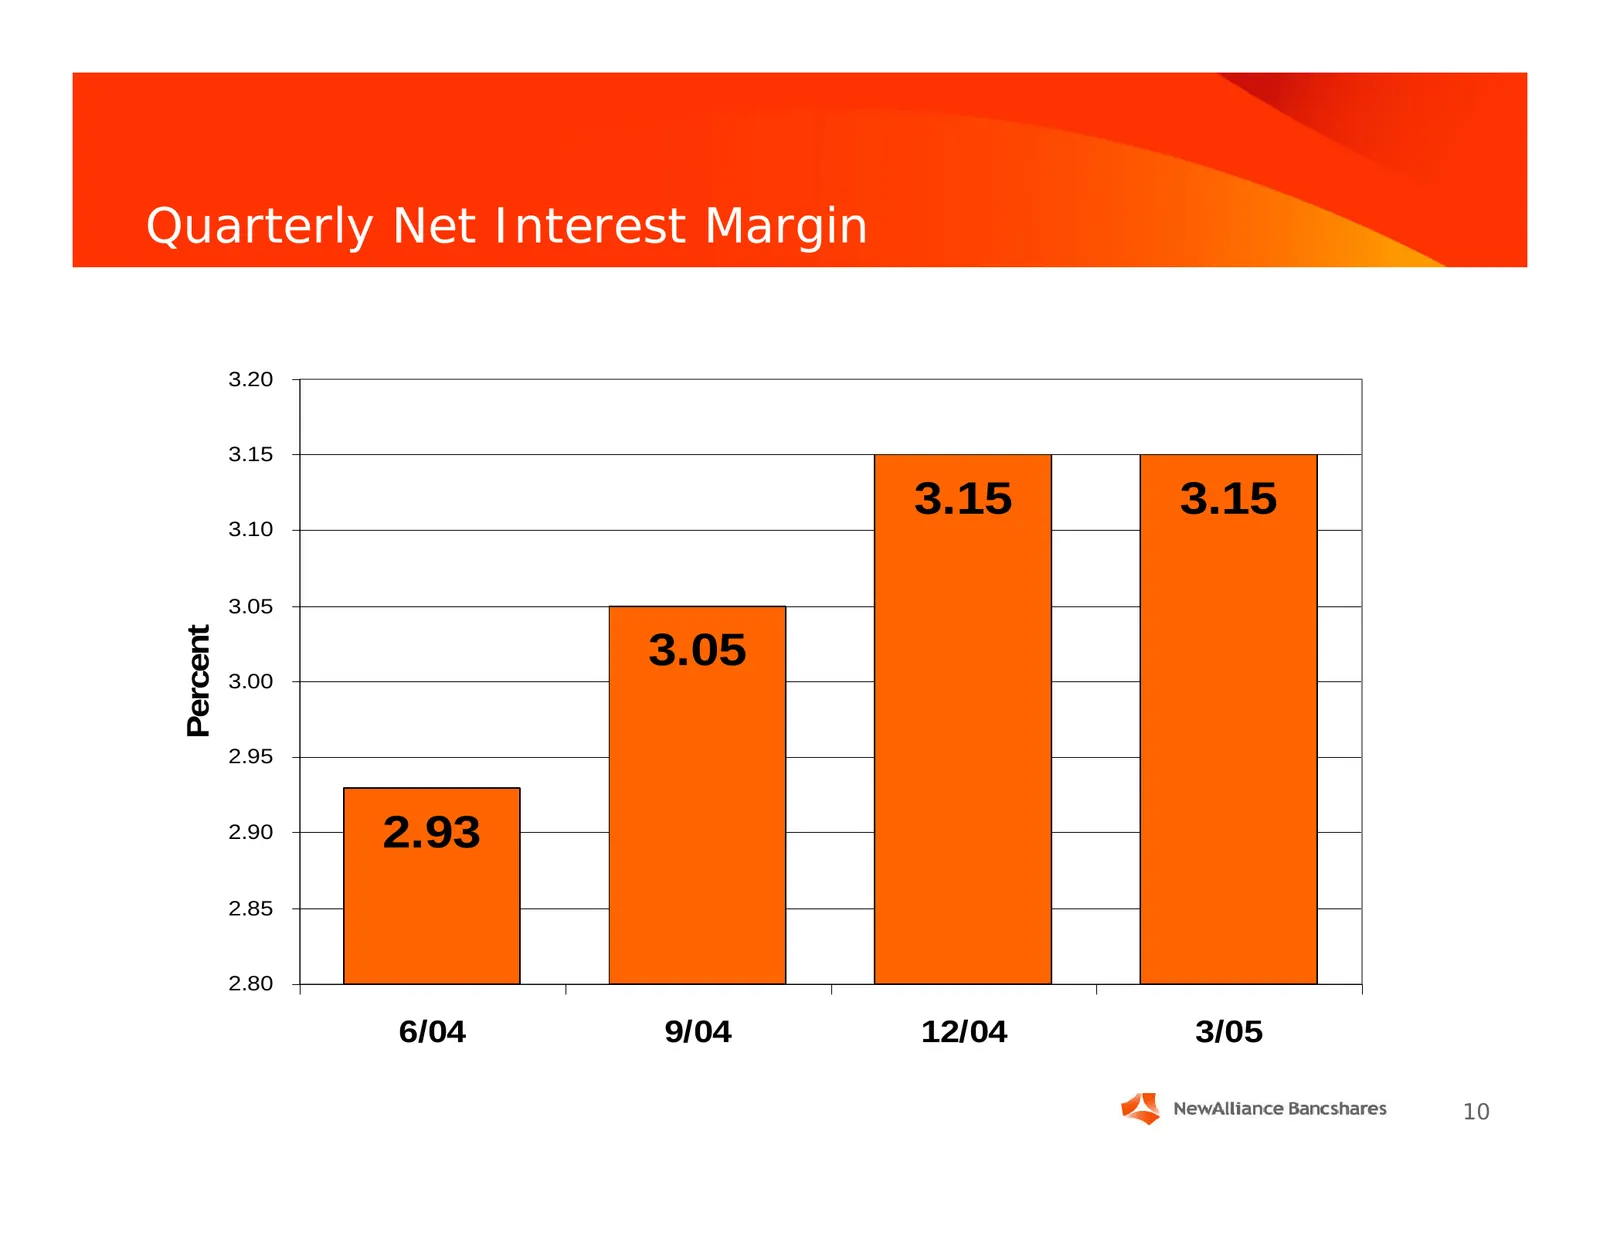
Slide 10: Quarterly Net Interest Margin
Quarterly Net Interest Margin 3.20 3.15 3.15 3.15 3.10 3.05 Percent 3.05 3.00 2.95 2.90 2.93 2.85 2.80 6/04 9/04 12/04 3/05 10
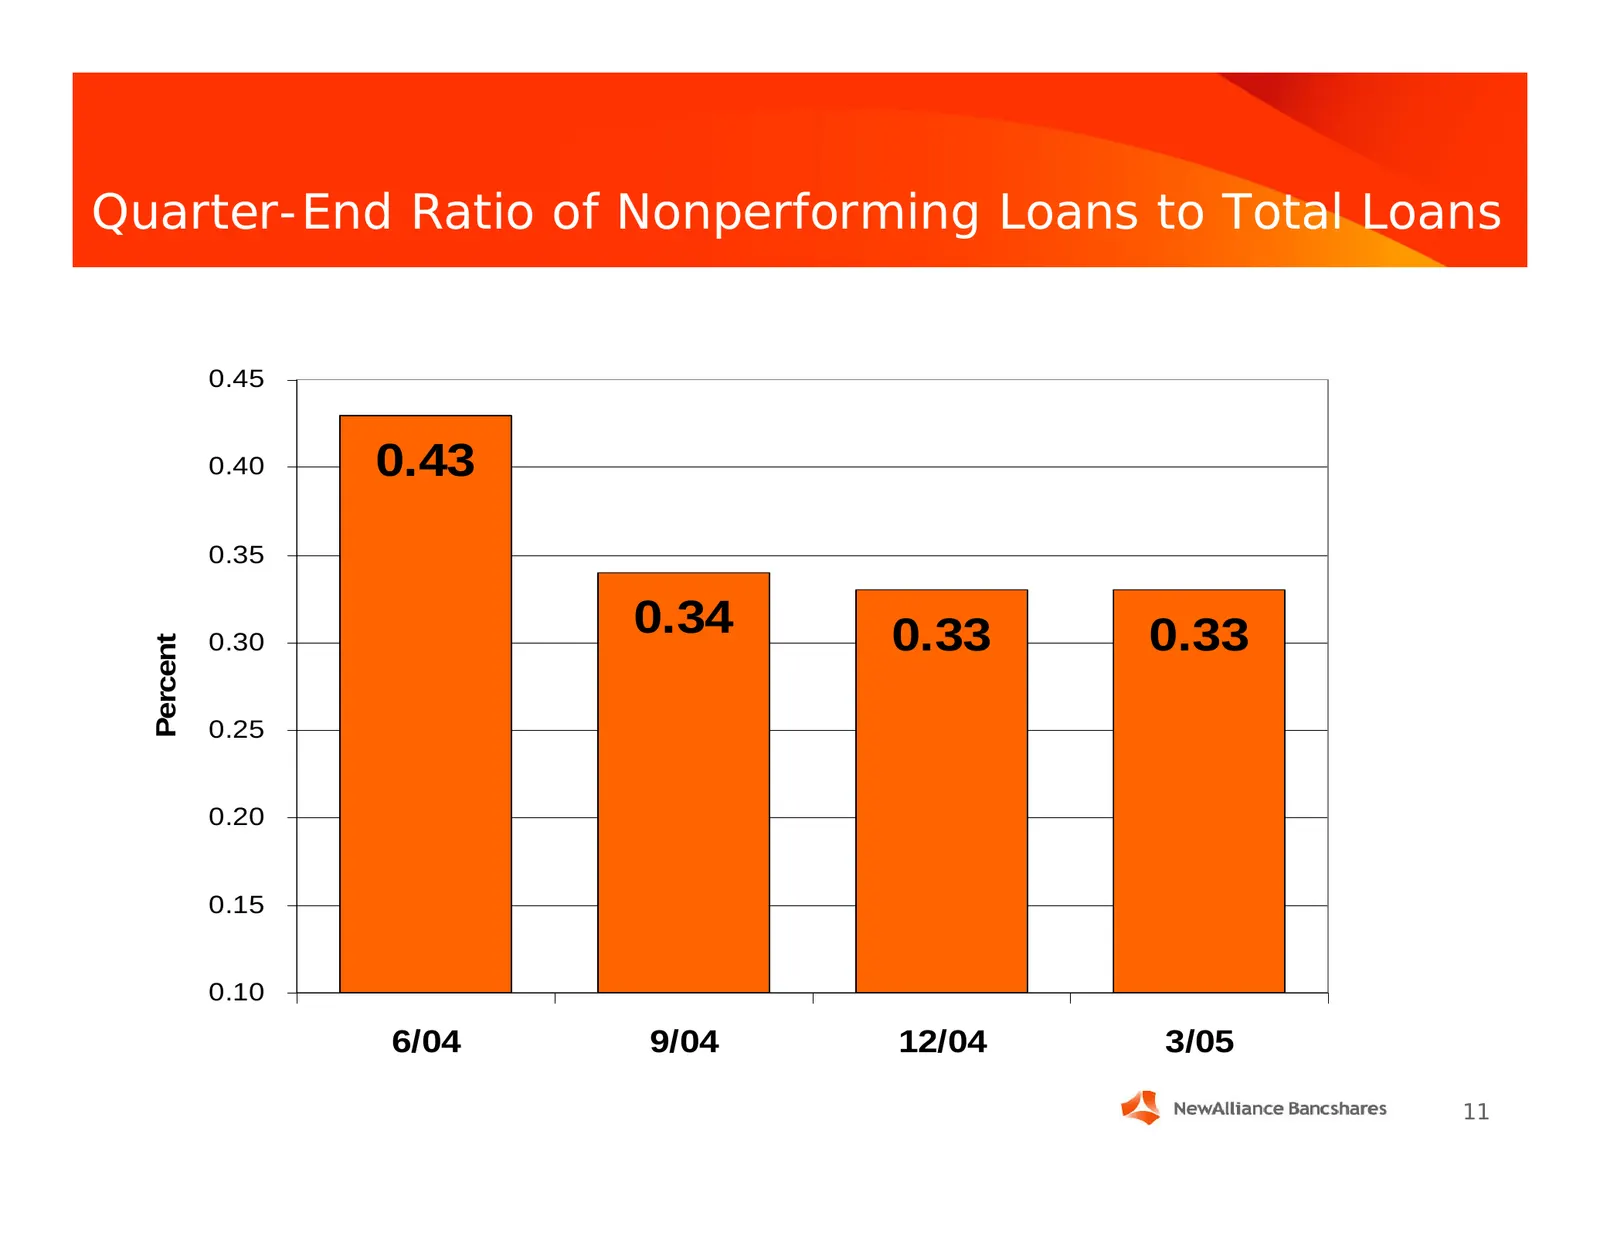
Slide 11: Quarter-End Ratio of Nonperforming Loans to Total Loans
Quarter-End Ratio of Nonperforming Loans to Total Loans 0.45 0.40 0.43 0.35 0.30 0.34 0.33 0.33 Percent 0.25 0.20 0.15 0.10 6/04 9/04 12/04 3/05 11
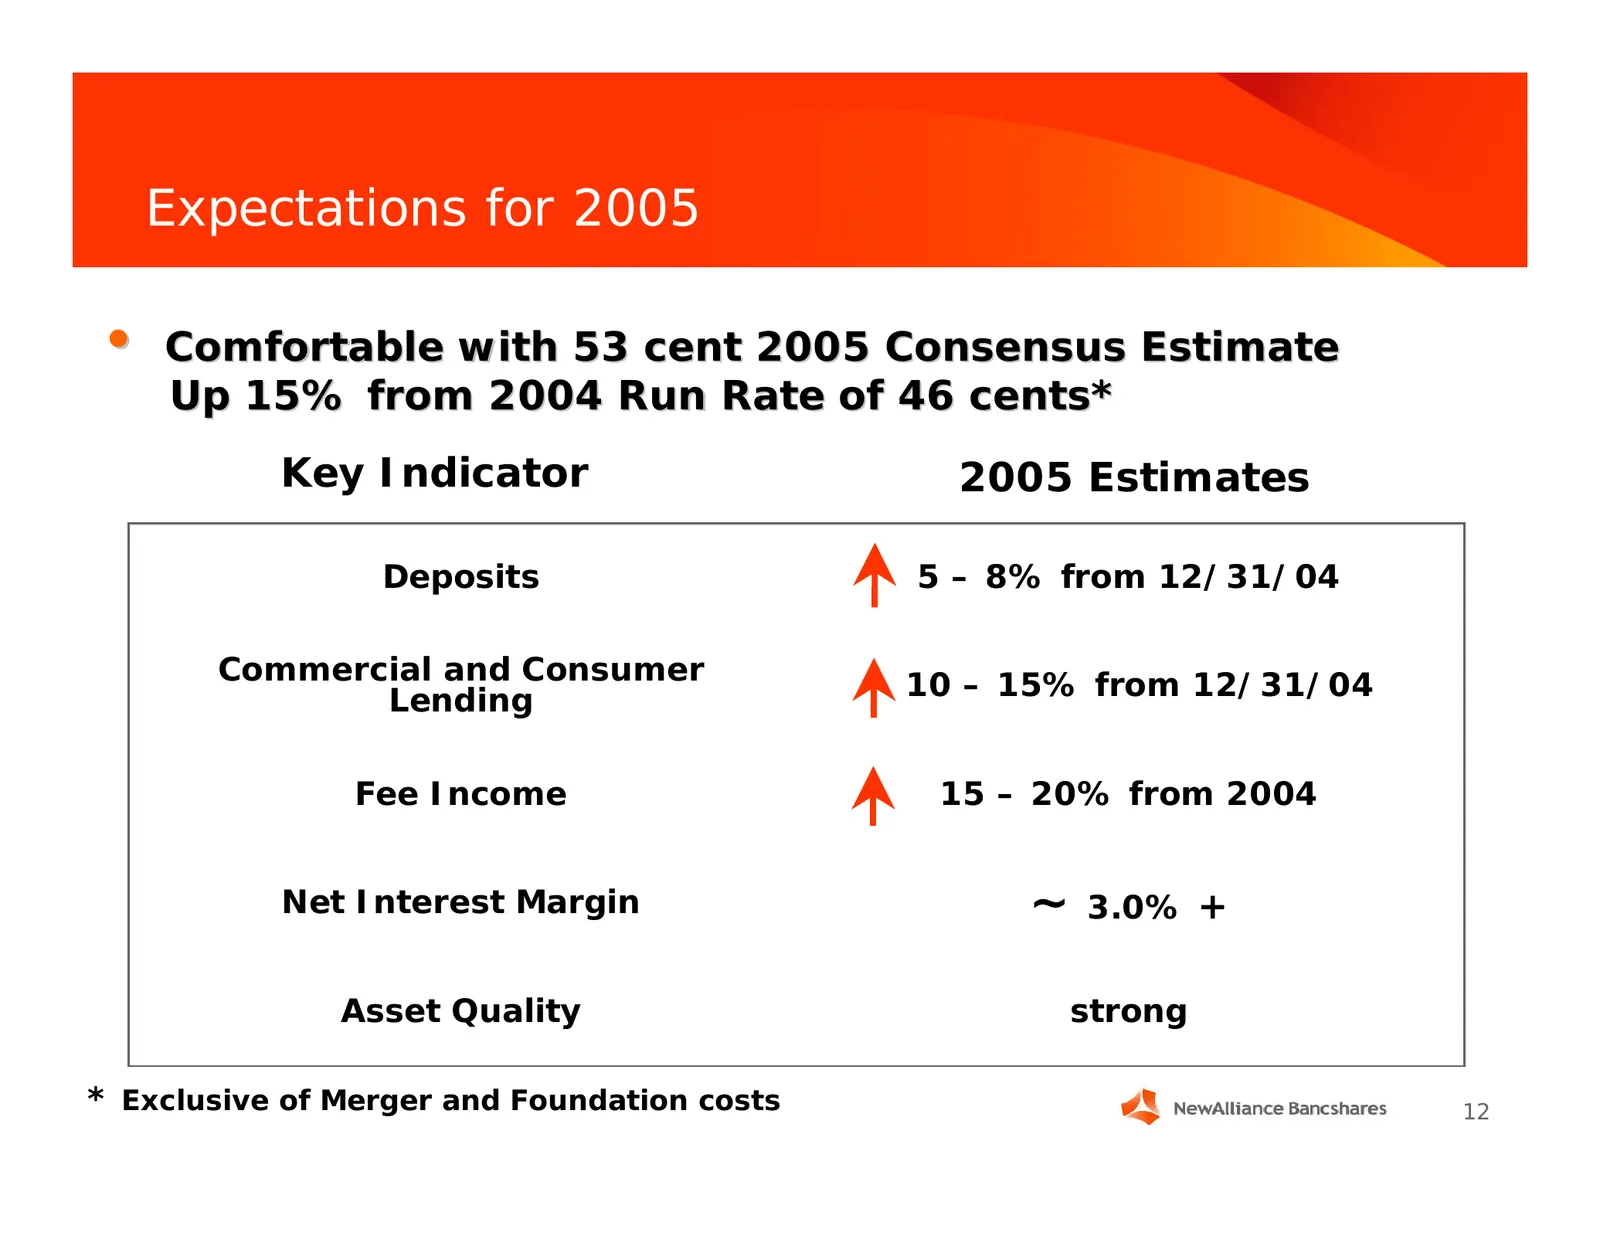
Slide 12: Expectations for 2005
Expectations for 2005 • Comfortable with 53 cent 2005 Consensus Estimate Up 15% from 2004 Run Rate of 46 cents* Key Indicator 2005 Estimates Deposits 5 – 8% from 12/31/04 Commercial and Consumer 10 – 15% from 12/31/04 Lending Fee Income 15 – 20% from 2004 Net Interest Margin ~ 3.0% + Asset Quality s
Slide 13: Stock Price Performance
Stock Price Performance
Slide 14: NewAlliance Price Performance – Since IPO
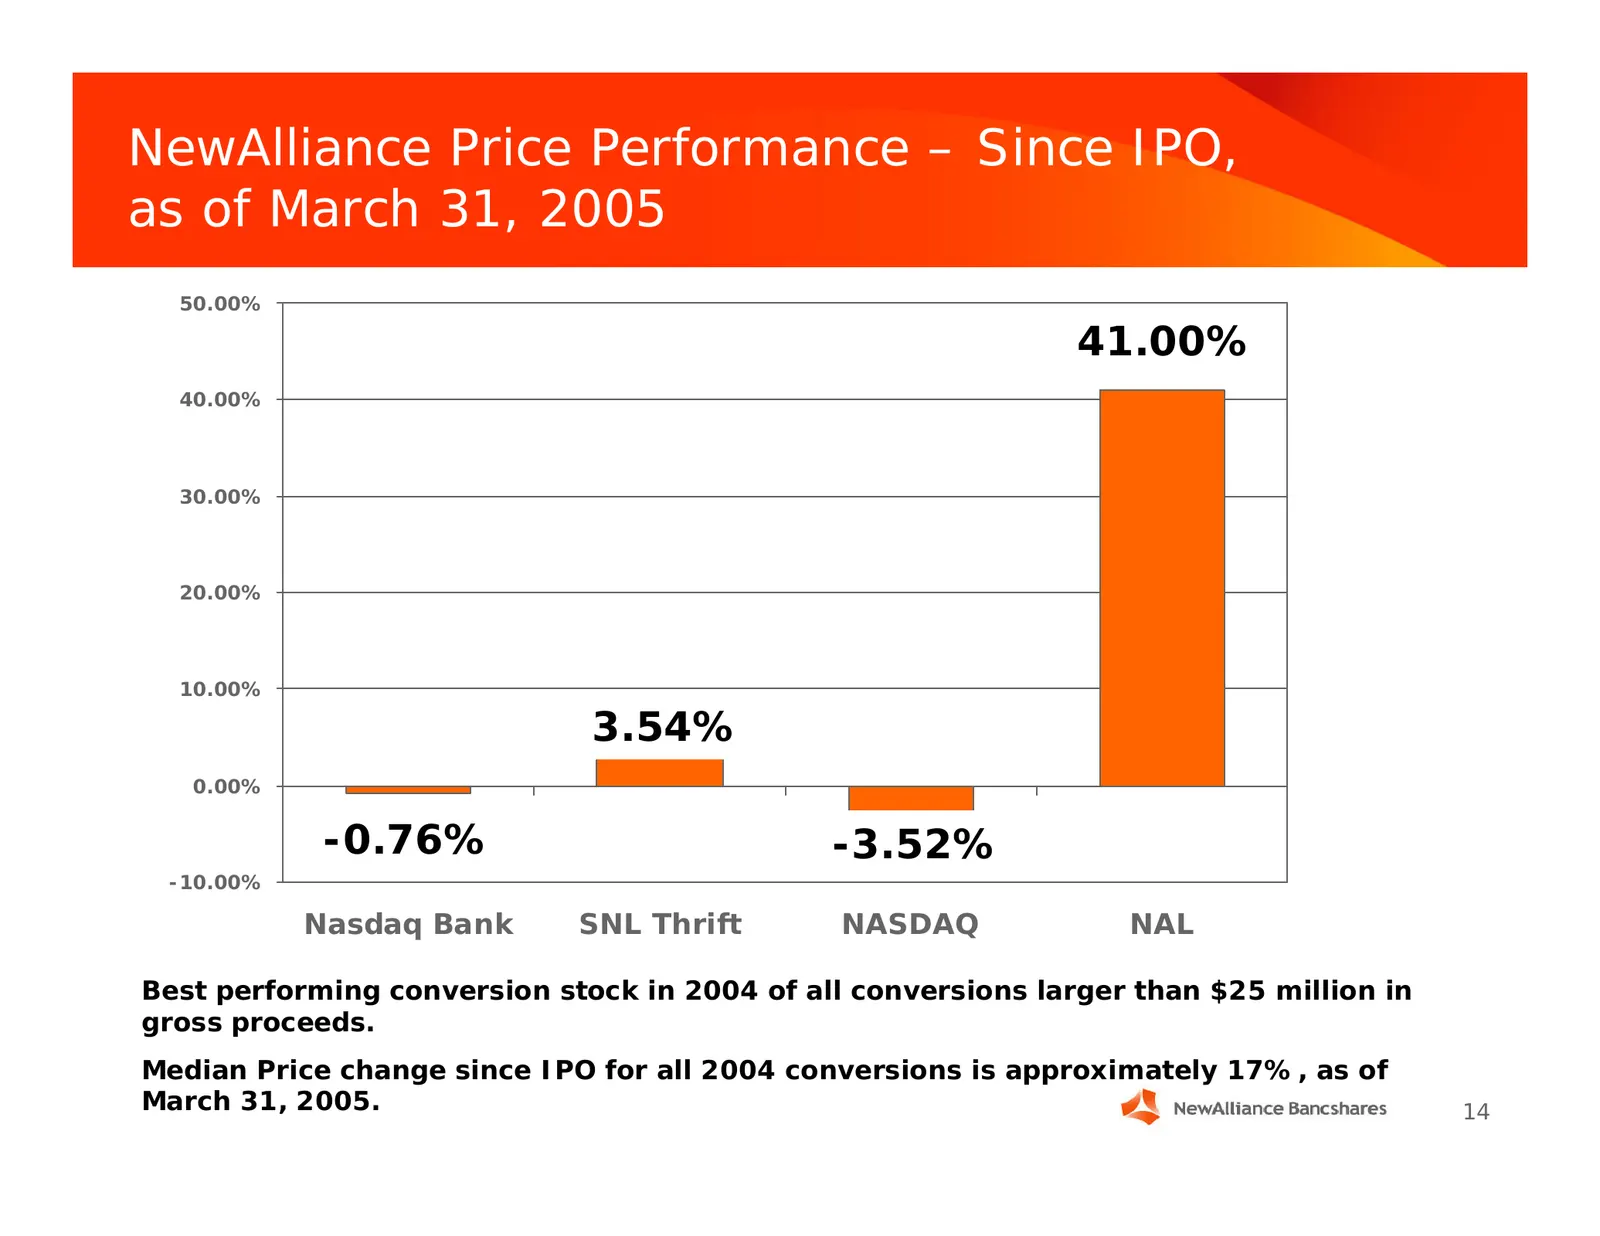
NewAlliance Price Performance – Since IPO, as of March 31, 2005 50.00% 41.00% 40.00% 30.00% 20.00% 10.00% 3.54% 0.00% -0.76% -3.52% -10.00% Nasdaq Bank SNL Thrift NASDAQ NAL Best performing conversion stock in 2004 of all conversions larger than $25 million in gross proceeds. Median Price change sin
Slide 15: NewAlliance Price Performance – Month Following IPO
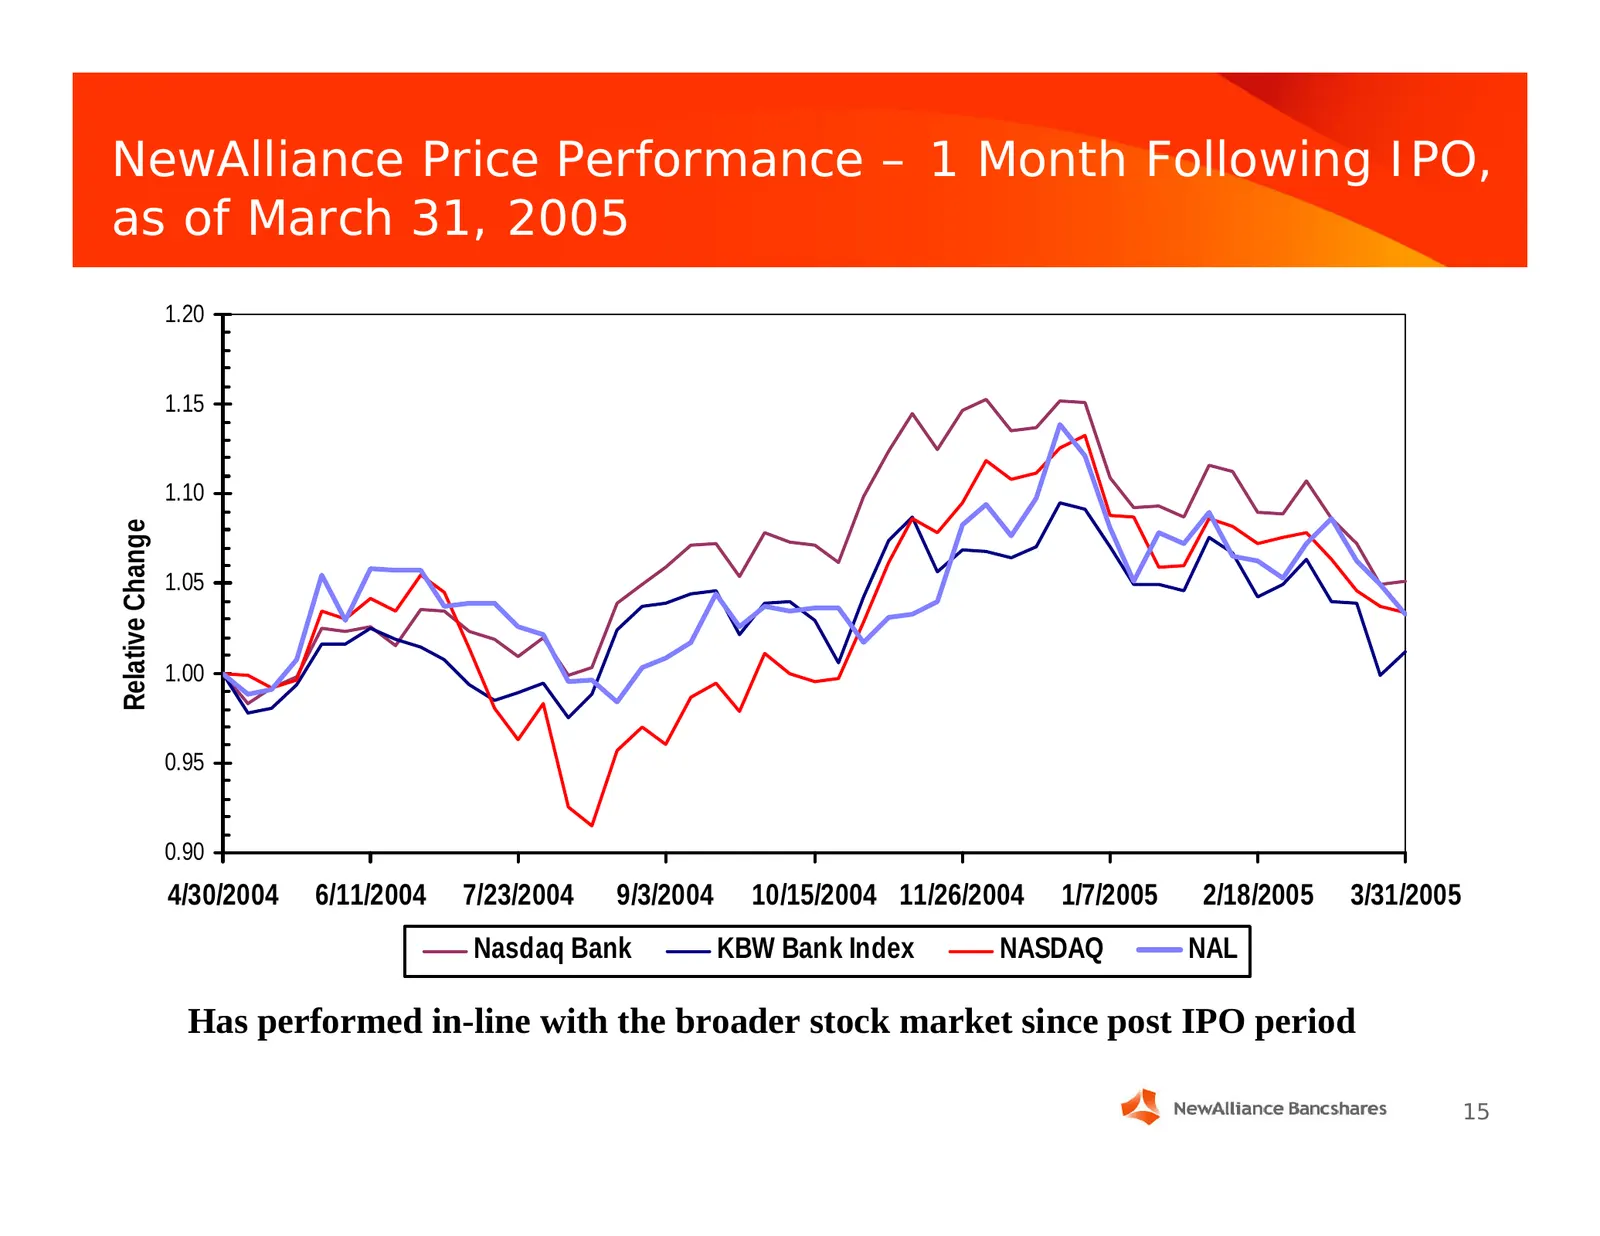
NewAlliance Price Performance – 1 Month Following IPO, as of March 31, 2005 1.20 1.15 1.10 Relative Change 1.05 1.00 0.95 0.90 4/30/2004 6/11/2004 7/23/2004 9/3/2004 10/15/2004 11/26/2004 1/7/2005 2/18/2005 3/31/2005 Nasdaq Bank KBW Bank Index NASDAQ NAL Has performed in-line with the broader stock
Slide 16: Deploying Our Capital
Deploying Our Capital
Slide 17: Managing Our Capital – What We Said in 2004
Managing Our Capital – What We Said in 2004 Deploy capital in a disciplined, opportunistic way through: Dividends Share Repurchases Acquisitions 17
Slide 18: Managing Our Capital ... Dividends
Managing Our Capital ... Dividends Fourth Consecutive Quarterly Dividend Announced 5 cents per share paid in May Approximately 40% of earnings being returned to shareholders in quarterly dividends 18 cents per share in past 4 quarters 18
Slide 19: Managing Our Capital ... Share Repurchases
Managing Our Capital ... Share Repurchases 10% Buyback Announced 10.7 Million Shares can be purchased in the open market starting in 3rd Quarter, pending regulatory approval Additional Buybacks to be evaluated 19
Slide 20: Two Strategically and Financially Sound Acquisitions Announced
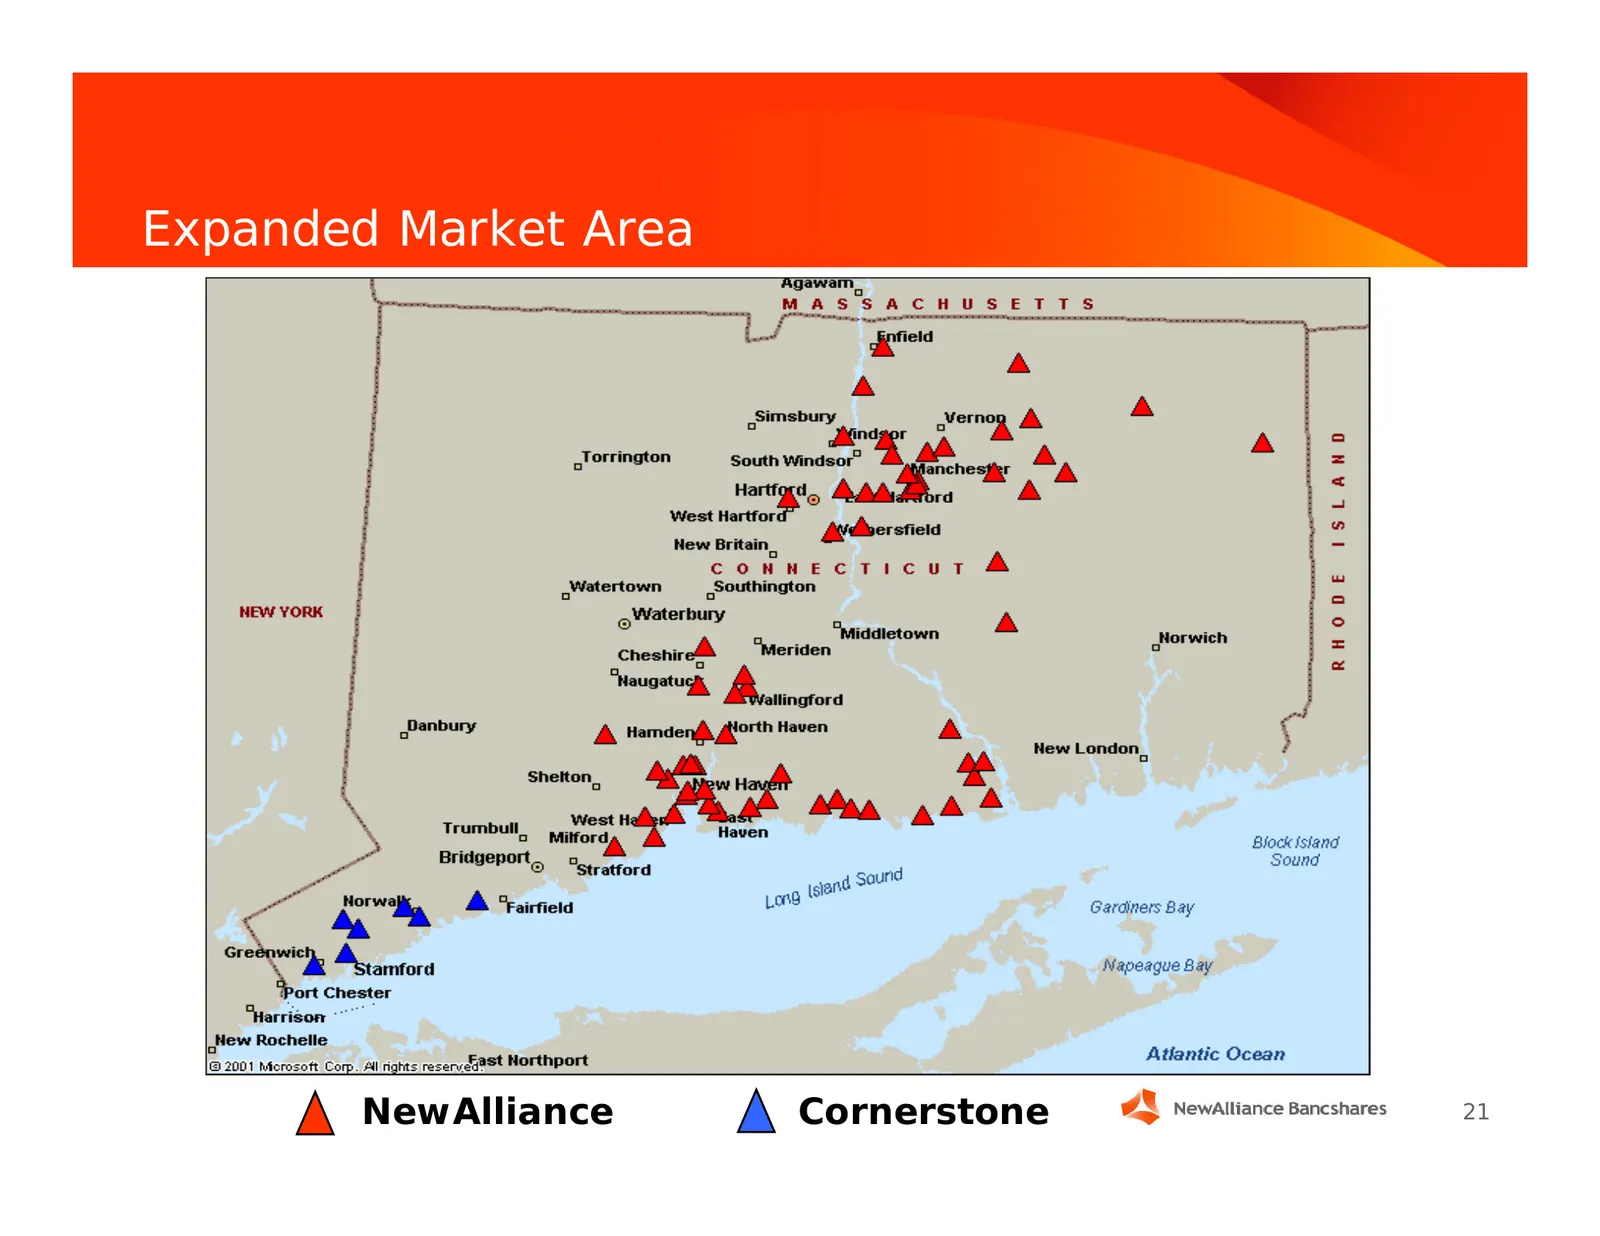
Managing Our Capital ... Two Strategically and Financially Sound Acquisitions Announced Trust Company of Connecticut; announced March 9, 2005 • $700 million in assets under management • Strong Statewide presence Cornerstone Bancorp; announced April 13, 2005 • More than $200 million in assets • E
Slide 21: Expanded Market Area
Expanded Market Area NewAlliance Cornerstone 21
Slide 22: Growth Initiatives
Growth Initiatives
Slide 23: Growth Initiatives
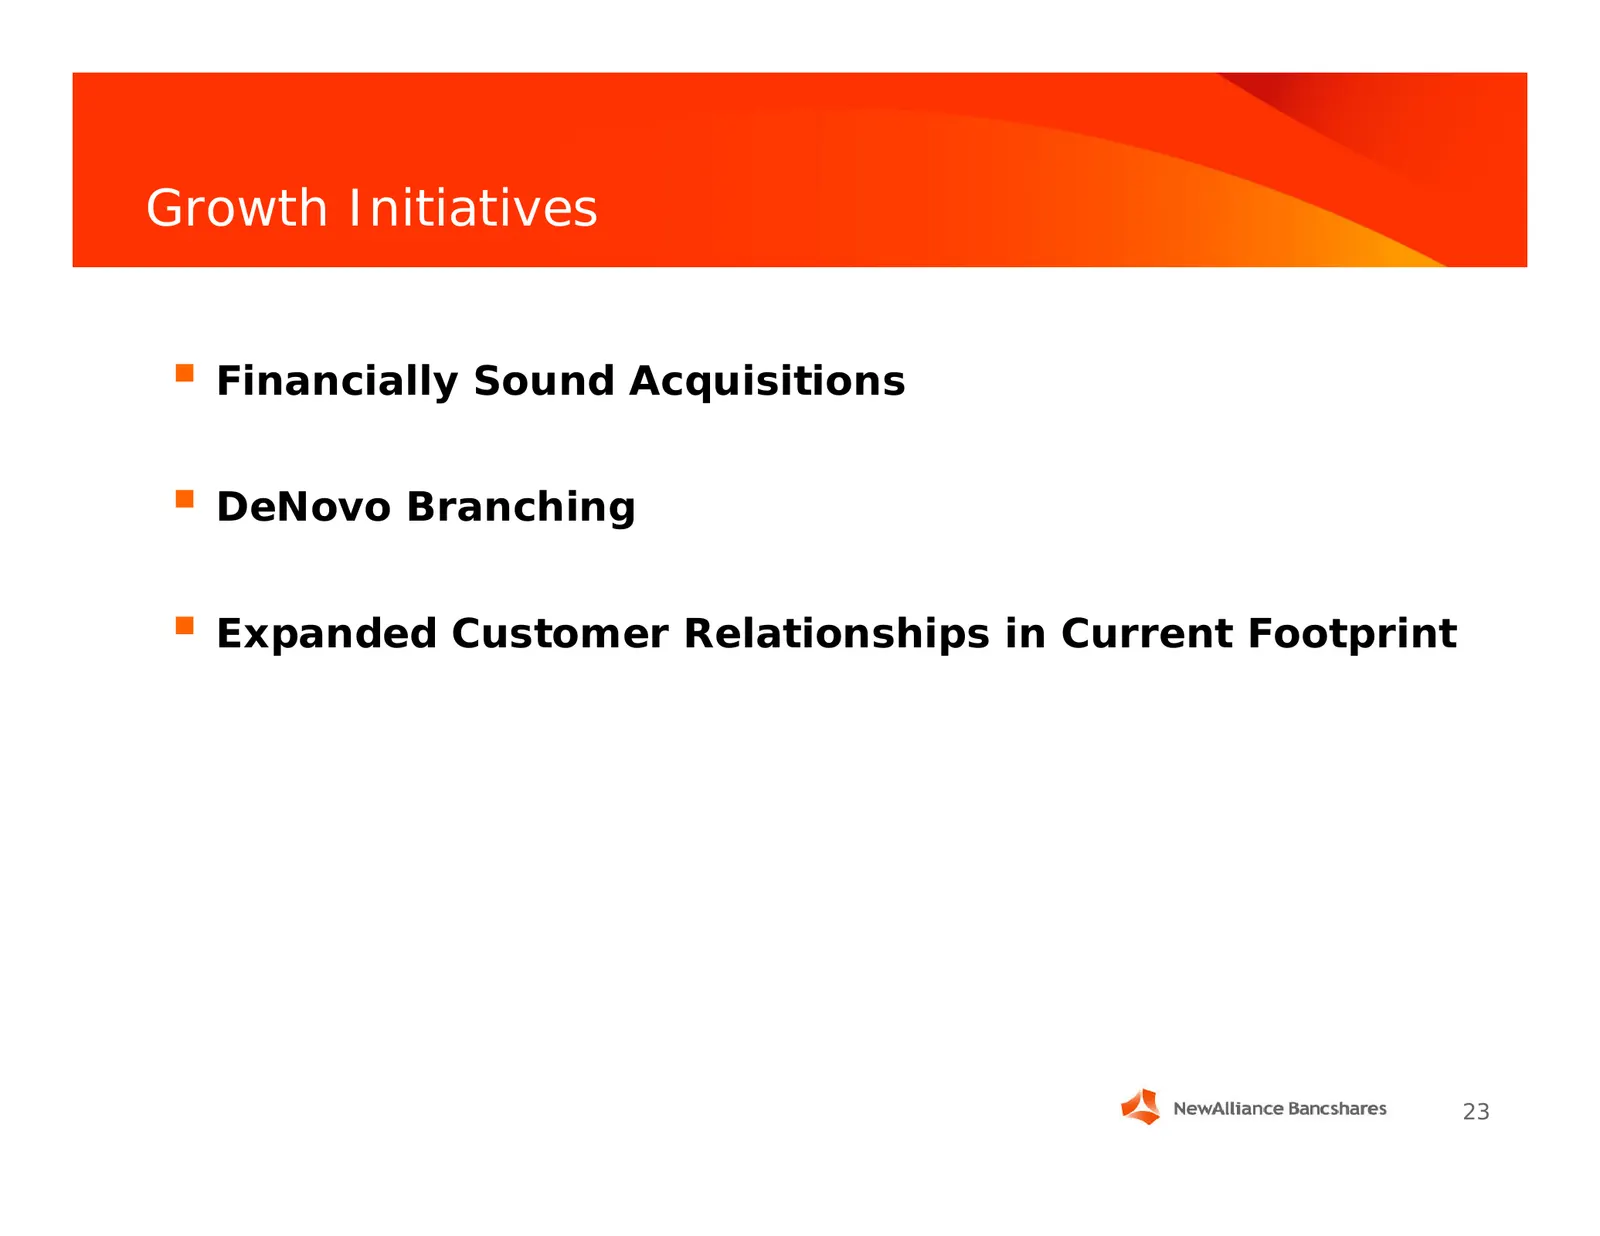
Growth Initiatives Financially Sound Acquisitions DeNovo Branching Expanded Customer Relationships in Current Footprint 23
Slide 24: Risk Management
Risk Marfagement
Slide 25: Risk Management
Risk Management Preserve margin Maintain Credit Quality Integrate acquisitions 25
Slide 26: Maintain Strong Asset Quality
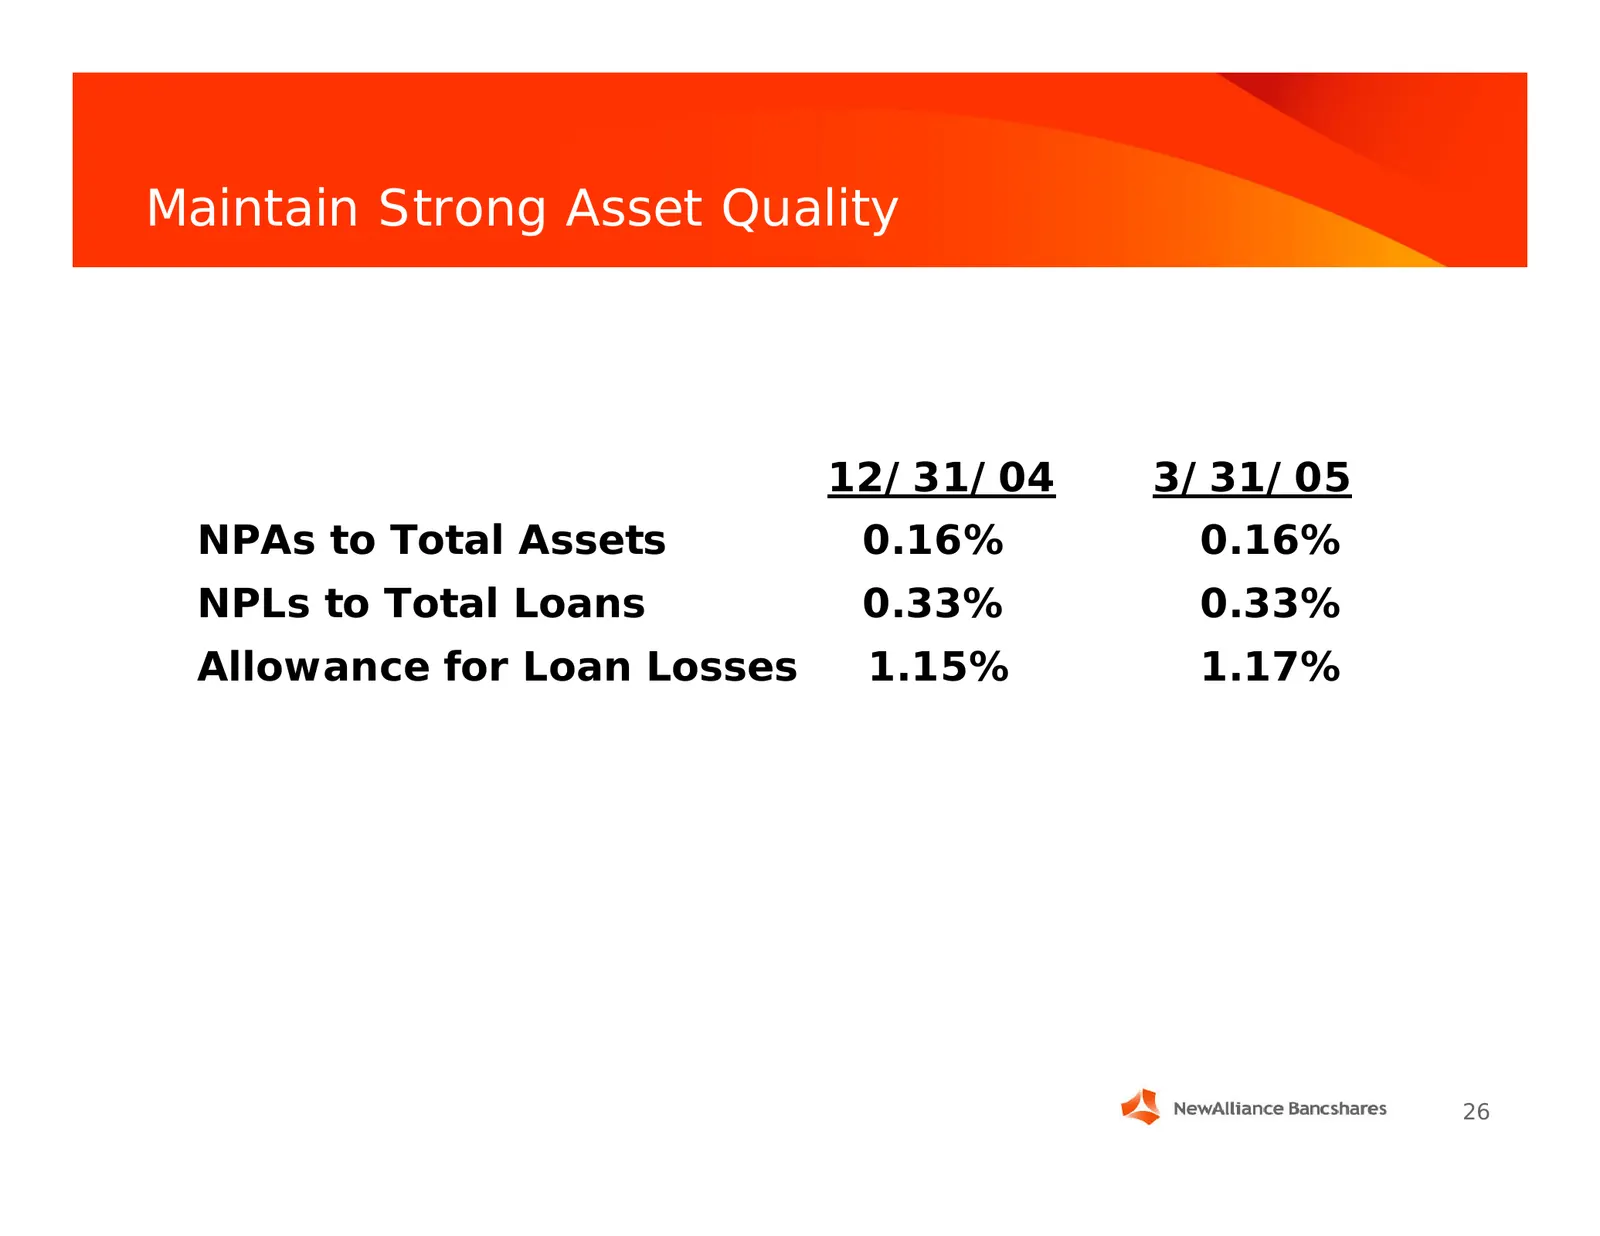
Maintain Strong Asset Quality 12/31/04 3/31/05 NPAs to Total Assets 0.16% 0.16% NPLs to Total Loans 0.33% 0.33% Allowance for Loan Losses 1.15% 1.17% 26

Slide 27: Sustaining Investor Interest
Sustaining Investor Interest
Slide 28: Research Coverage
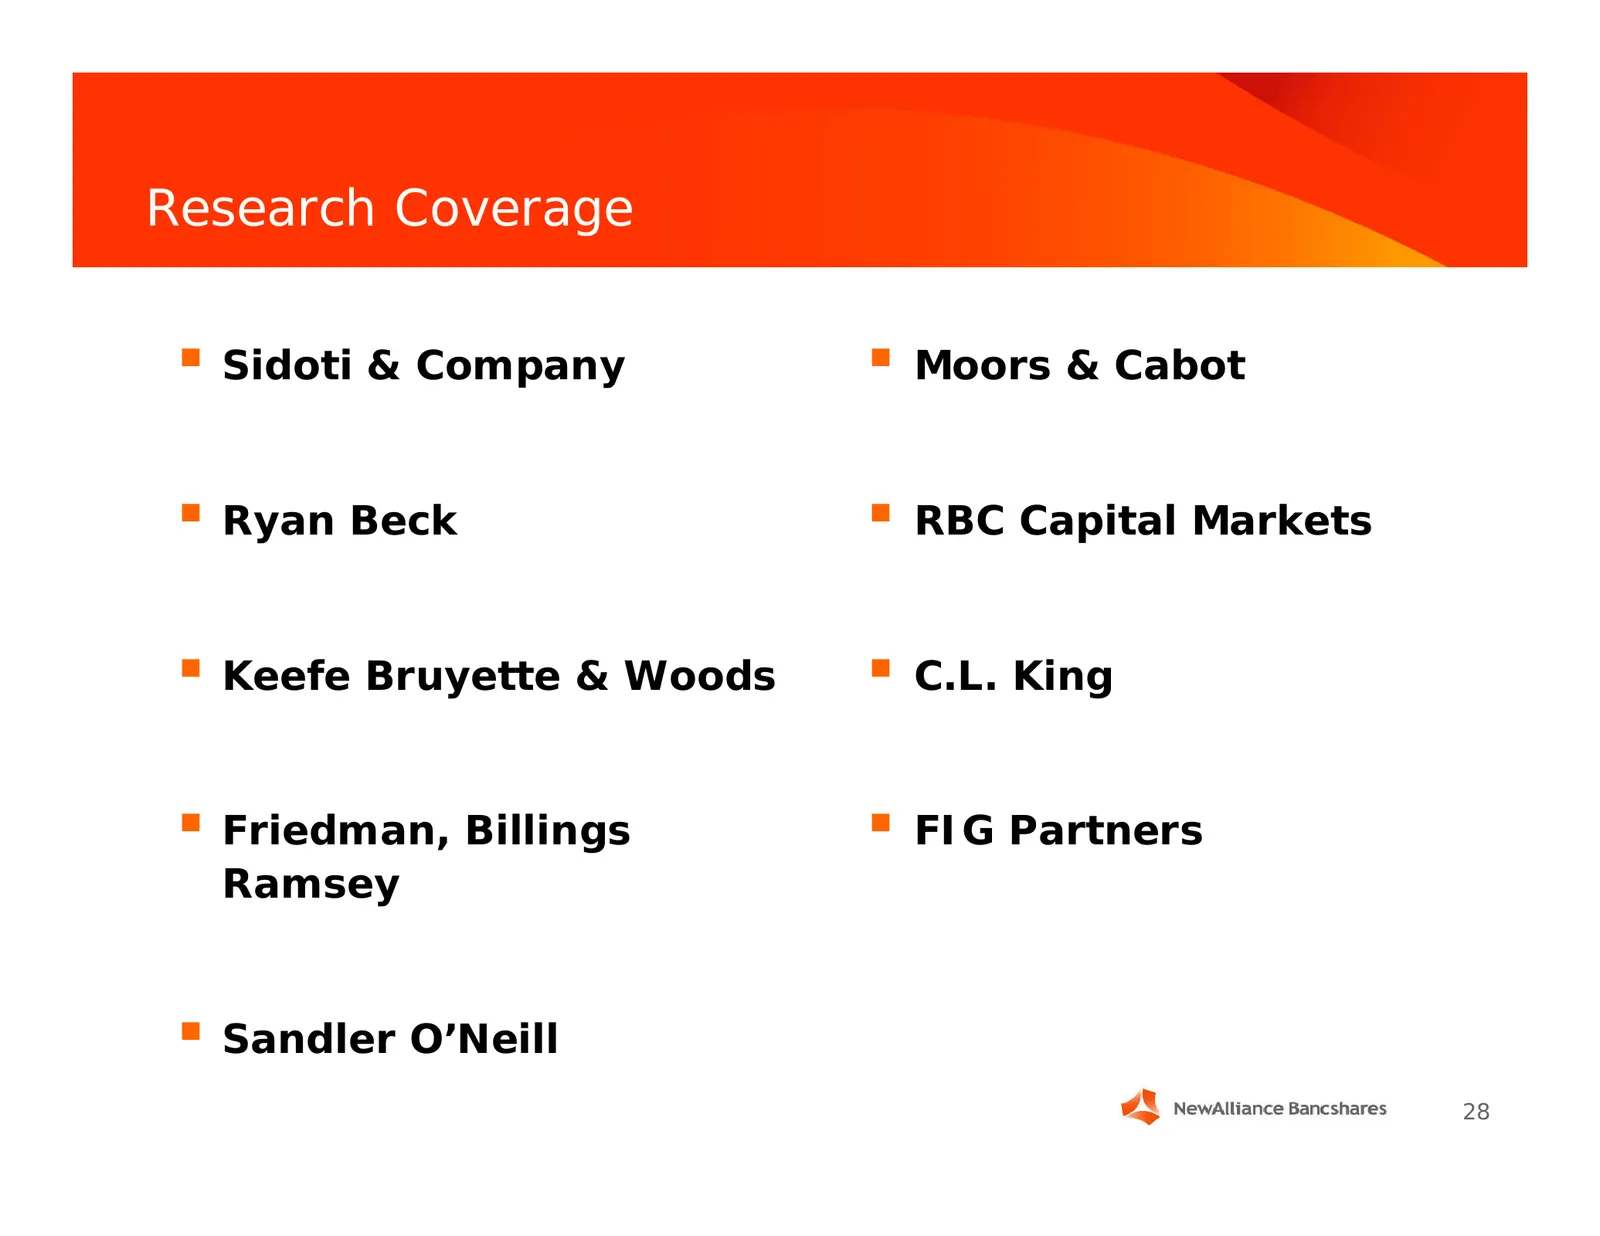
Research Coverage Sidoti & Company Moors & Cabot Ryan Beck RBC Capital Markets Keefe Bruyette & Woods C.L. King Friedman, Billings FIG Partners Ramsey Sandler O’Neill 28
Slide 29: Institutional Ownership
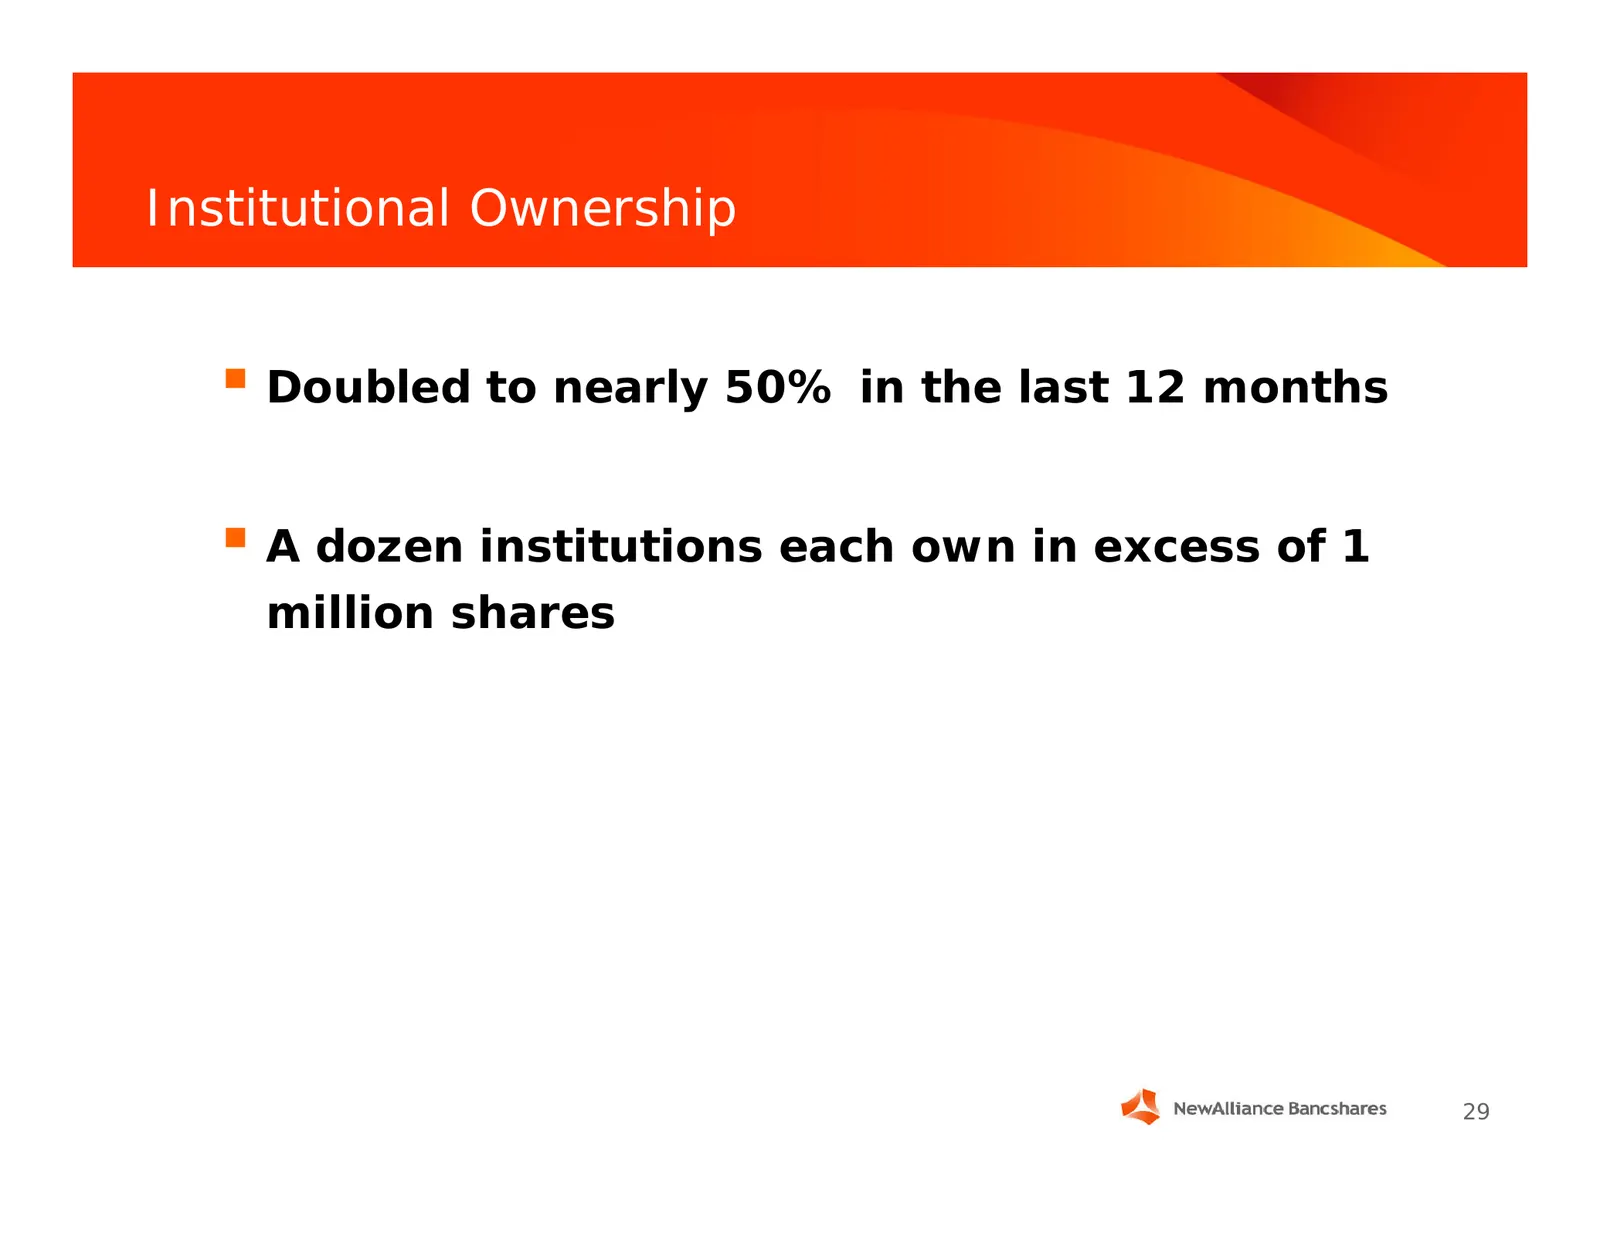
Institutional Ownership Doubled to nearly 50% in the last 12 months A dozen institutions each own in excess of 1 million shares 29
Slide 30: Market Feedback
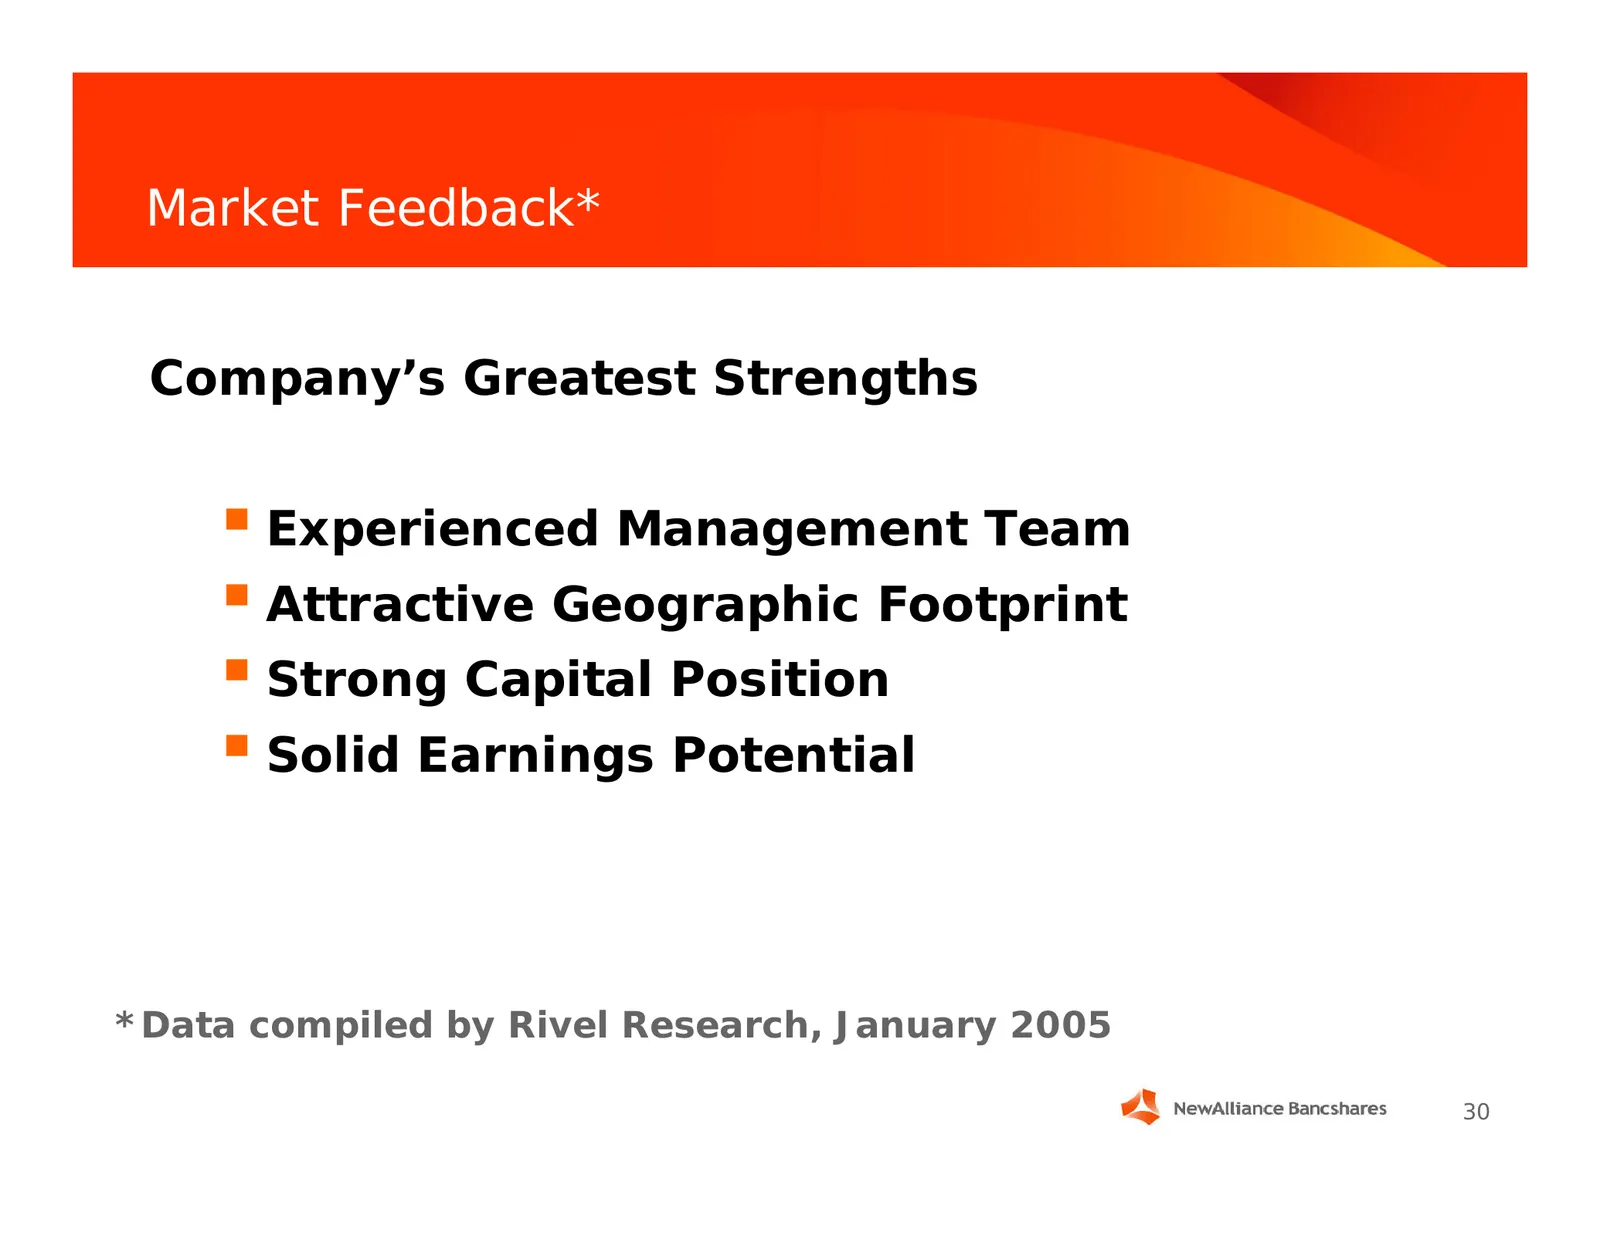
Market Feedback* Company’s Greatest Strengths Experienced Management Team Attractive Geographic Footprint Strong Capital Position Solid Earnings Potential *Data compiled by Rivel Research, January 2005 30
Slide 31: Strategic Priorities
Strategic Priorities • Maintain Sound Financial Performance • Manage Our Capital • Grow Profitably • Manage Risk • Sustain Investor Interest

Slide 32: NewAlliance Bank
a NewAlliance Bank Capital ideas. Human values.
Source: SEC EDGAR · 8-K filed Jun 7, 2005
More decks from Newalliance Bancshares Inc
 Merger or Acquisition (November 2010)45 slides · Nov 18, 2010
 Stifel, Nicolaus & Company, Inc. Bank and Thrift Conference 201037 slides · Nov 3, 2010
 Merger or Acquisition (August 2010)25 slides · Aug 25, 2010
 Merger or Acquisition (August 2010)24 slides · Aug 19, 2010
 Merger or Acquisition (August 2010)23 slides · Aug 19, 2010
 Q2 2010 Earnings Presentation31 slides · Jul 28, 2010