Beneficial Bancorp — Investor Presentation (November 2017)
23 slides from Beneficial Bancorp's investor presentation, Nov 7, 2017
Slide 1: Safe Harbor Statement
2 SAFE HARBOR STATEMENT This presentation contains forward-looking statements within the meaning of the Private Securities Litigation Reform Act of 1995 giving Beneficial Bancorp’s expectations or predictions of future financial or business performance or conditions. Forward-looking statements are t
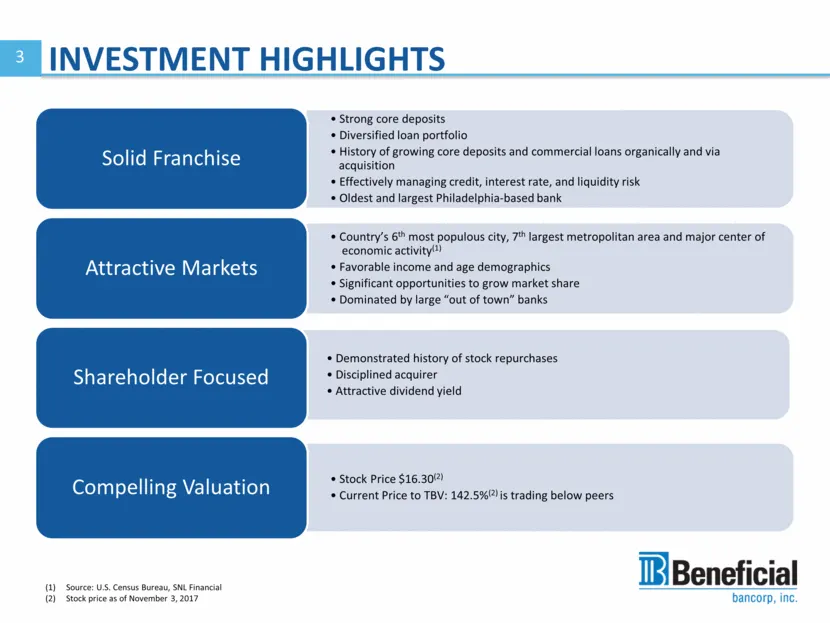
Slide 2: Investment Highlights
3 INVESTMENT HIGHLIGHTS Source: U.S. Census Bureau, SNL Financial Stock price as of November 3, 2017 Strong core deposits Diversified loan portfolio History of growing core deposits and commercial loans organically and via .acquisition Effectively managing credit, interest rate, and liquidity risk O
Slide 3: Overview of Beneficial Bancorp
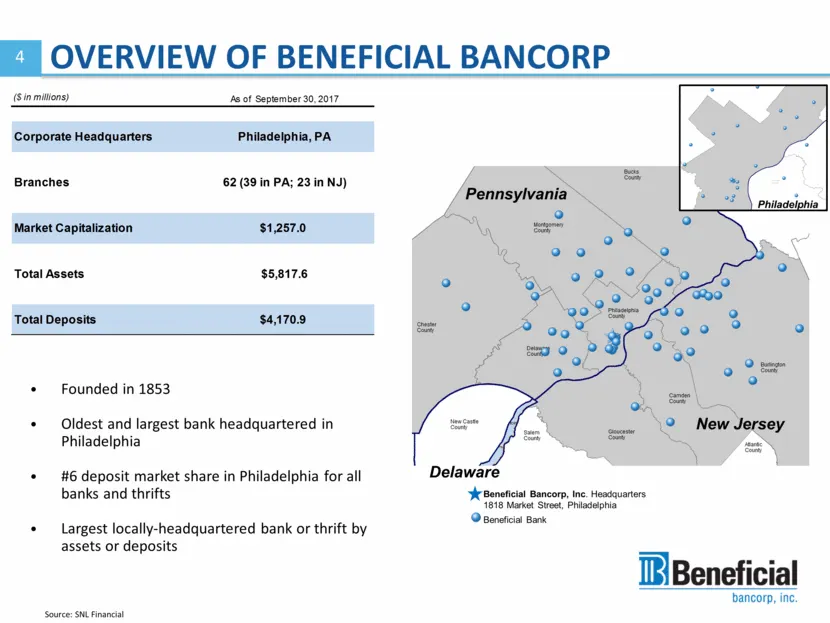
4 OVERVIEW OF BENEFICIAL BANCORP Founded in 1853 Oldest and largest bank headquartered in Philadelphia #6 deposit market share in Philadelphia for all banks and thrifts Largest locally-headquartered bank or thrift by assets or deposits Source: SNL Financial Beneficial Bancorp, Inc. Headquarters 1818
Slide 4: Our Market – Greater Philadelphia
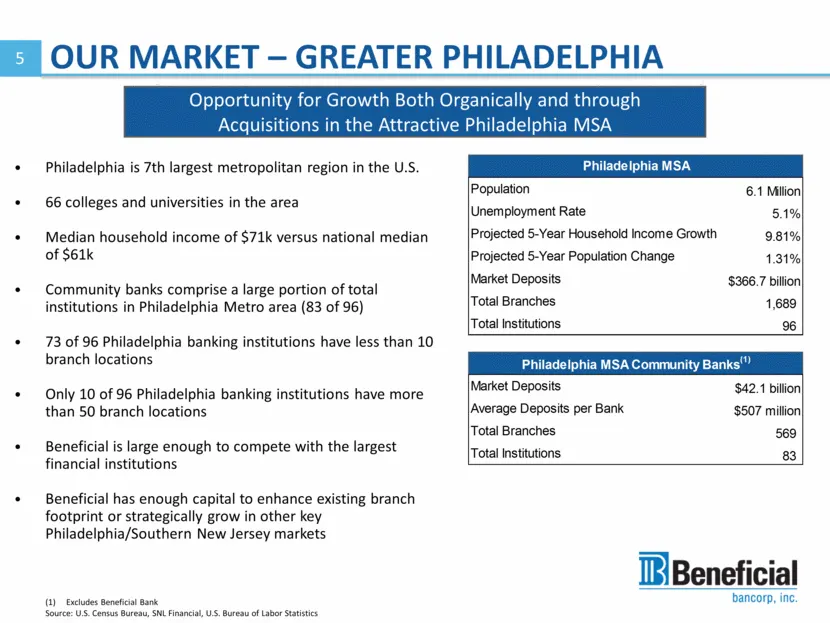
5 OUR MARKET – GREATER PHILADELPHIA Excludes Beneficial Bank Source: U.S. Census Bureau, SNL Financial, U.S. Bureau of Labor Statistics Opportunity for Growth Both Organically and through Acquisitions in the Attractive Philadelphia MSA Philadelphia is 7th largest metropolitan region in the U.S. 66 c
Slide 5: Beneficial Today – Competitive Advantage
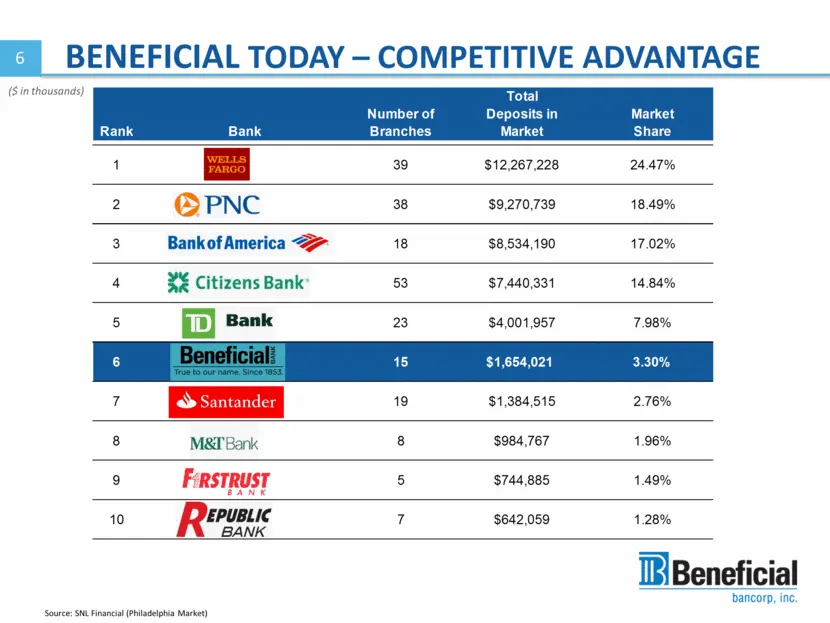
BENEFICIAL TODAY – COMPETITIVE ADVANTAGE Source: SNL Financial (Philadelphia Market) 6 ($ in thousands)
Slide 6: Strategic Priorities
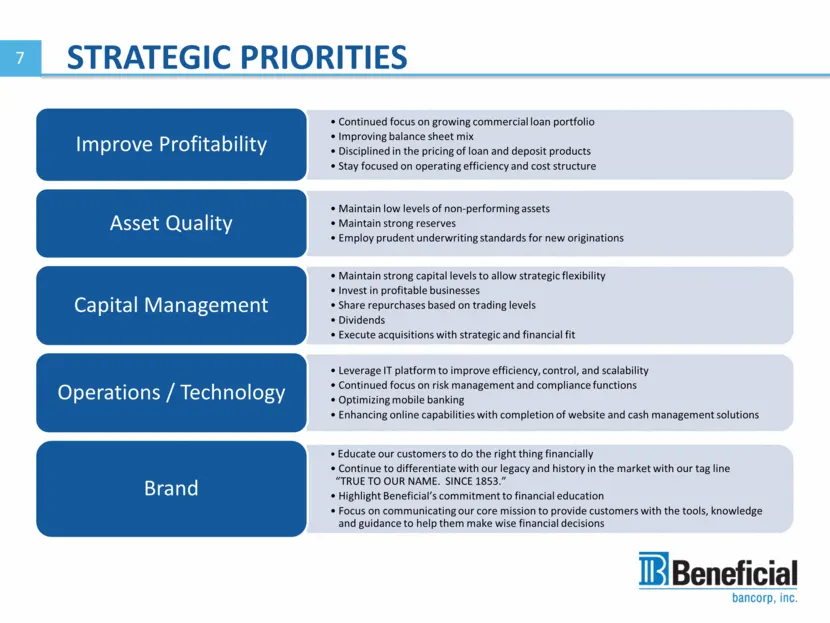
STRATEGIC PRIORITIES 7 Continued focus on growing commercial loan portfolio Improving balance sheet mix Disciplined in the pricing of loan and deposit products Stay focused on operating efficiency and cost structure Improve Profitability Maintain low levels of non-performing assets Maintain strong r
Slide 7: Capital Management
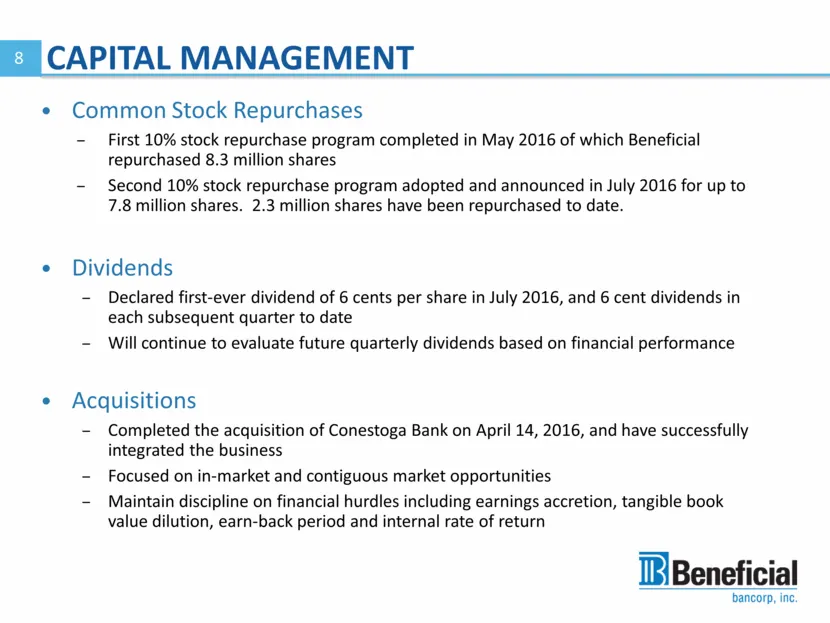
Common Stock Repurchases First 10% stock repurchase program completed in May 2016 of which Beneficial repurchased 8.3 million shares Second 10% stock repurchase program adopted and announced in July 2016 for up to 7.8 million shares. 2.3 million shares have been repurchased to date. Dividends Declar
Slide 8: Focused on Prudent Capital Management
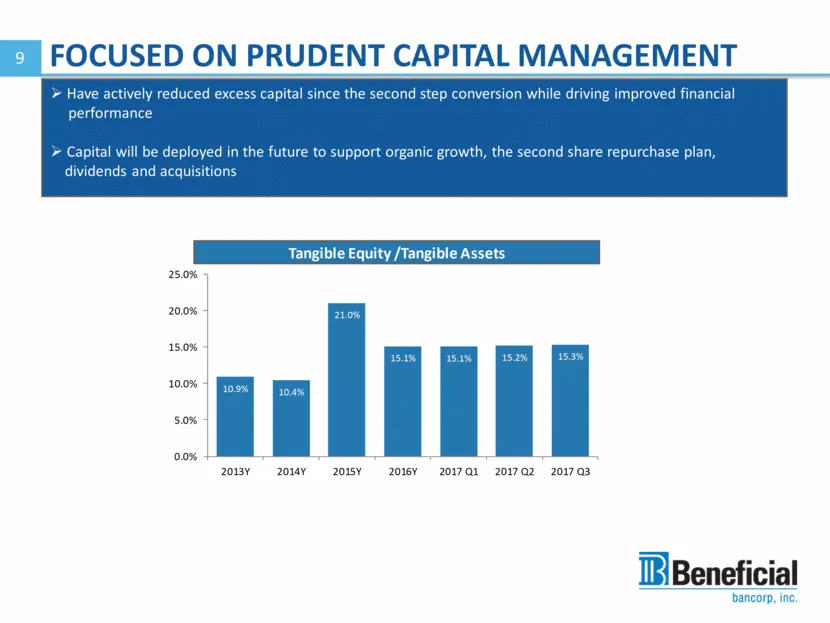
FOCUSED ON PRUDENT CAPITAL MANAGEMENT 9 Have actively reduced excess capital since the second step conversion while driving improved financial performance Capital will be deployed in the future to support organic growth, the second share repurchase plan, dividends and acquisitions
Slide 9: Stock Performance
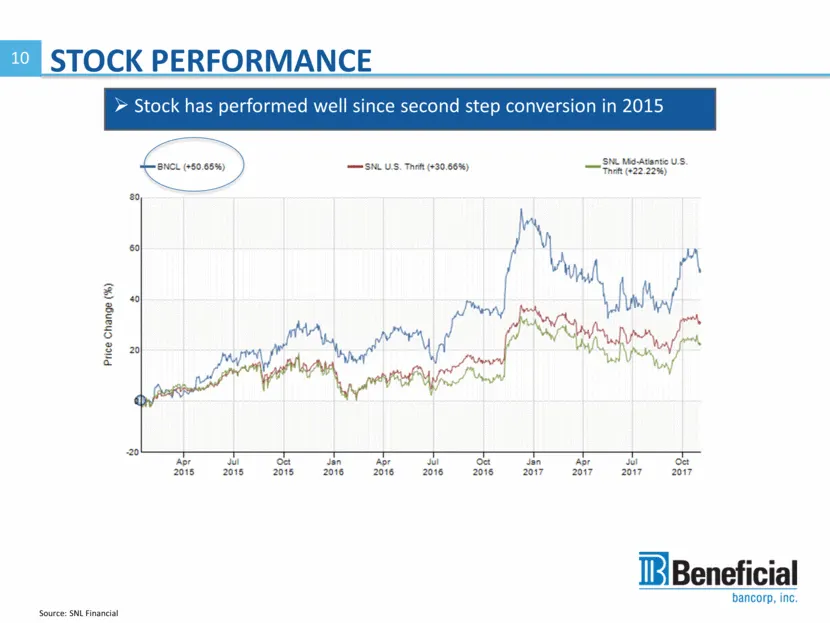
STOCK PERFORMANCE 10 Source: SNL Financial Stock has performed well since second step conversion in 2015
Slide 10: Q3 2017 Highlights
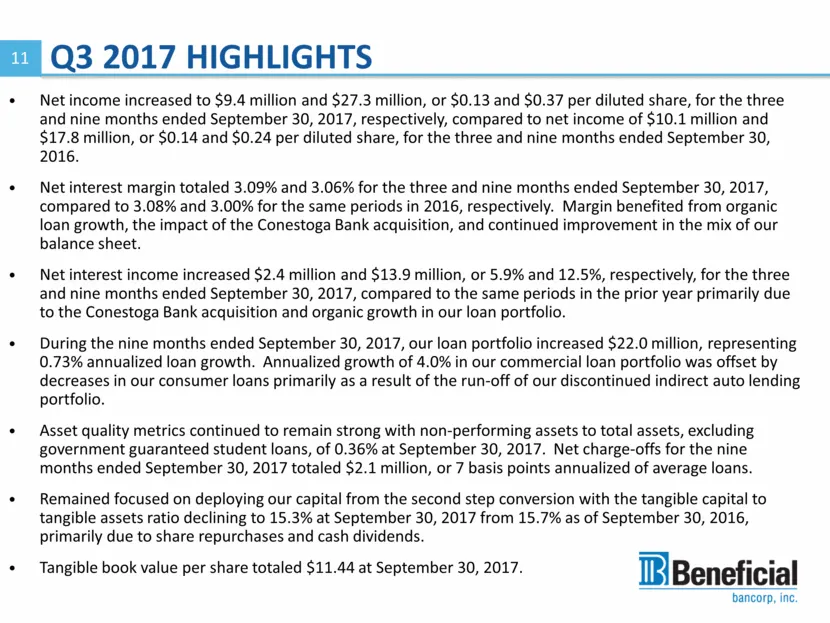
Q3 2017 HIGHLIGHTS Net income increased to $9.4 million and $27.3 million, or $0.13 and $0.37 per diluted share, for the three and nine months ended September 30, 2017, respectively, compared to net income of $10.1 million and $17.8 million, or $0.14 and $0.24 per diluted share, for the three and ni
Slide 11: Transformed Balance Sheet Composition to Improve Earnings
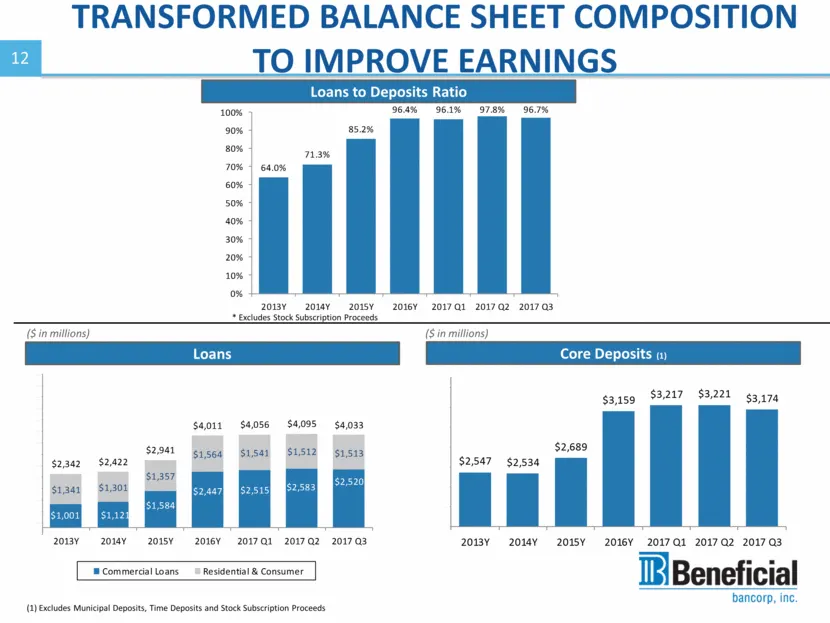
TRANSFORMED BALANCE SHEET COMPOSITION TO IMPROVE EARNINGS ($ in millions) ($ in millions) (1) Excludes Municipal Deposits, Time Deposits and Stock Subscription Proceeds 12 * Excludes Stock Subscription Proceeds Core Deposits (1) Loans to Deposits Ratio Loans
Slide 12: Earnings Performance Improving
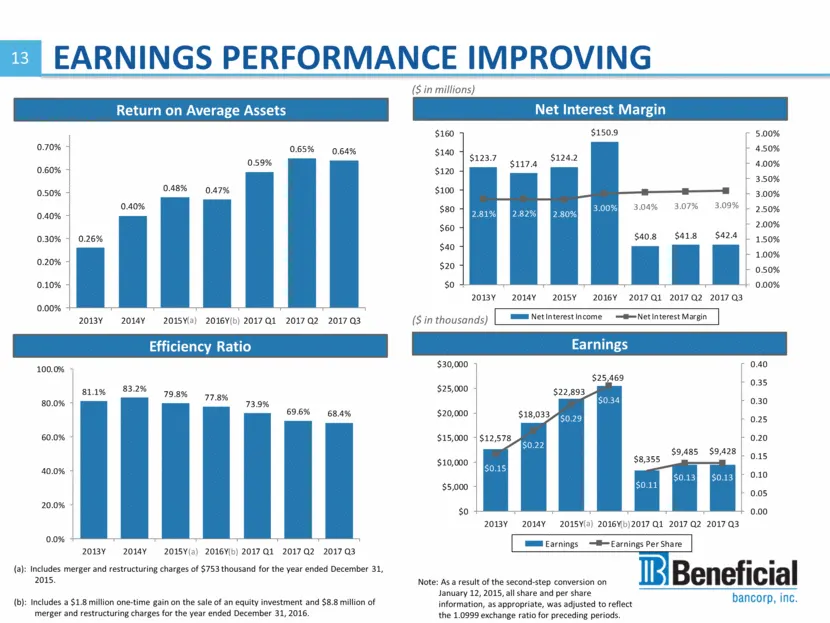
EARNINGS PERFORMANCE IMPROVING ($ in millions) 13 ($ in thousands) Note: As a result of the second-step conversion on January 12, 2015, all share and per share information, as appropriate, was adjusted to reflect the 1.0999 exchange ratio for preceding periods. (a): Includes merger and restructuring
Slide 13: Favorable Asset Quality Trends
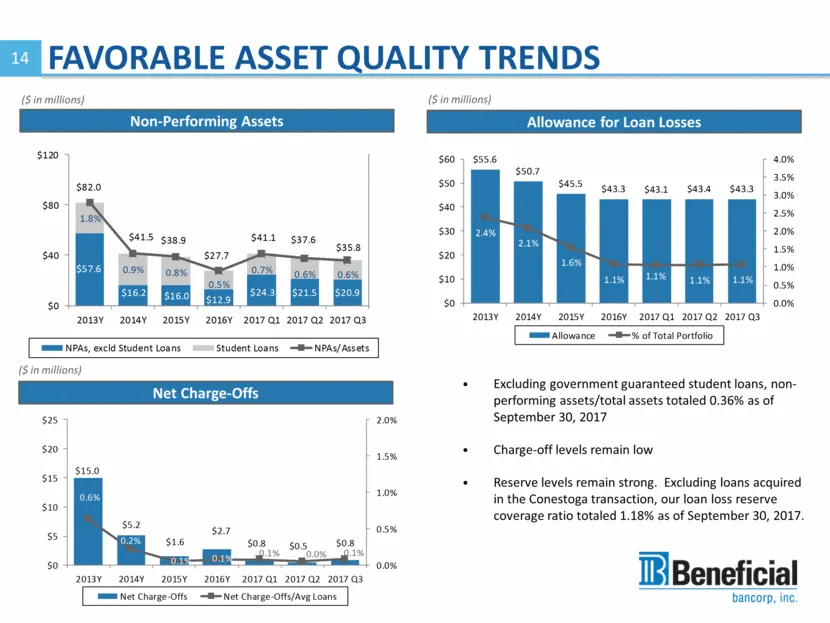
Excluding government guaranteed student loans, non-performing assets/total assets totaled 0.36% as of September 30, 2017 Charge-off levels remain low Reserve levels remain strong. Excluding loans acquired in the Conestoga transaction, our loan loss reserve coverage ratio totaled 1.18% as of Septembe
Slide 14: Appendix Financial Exhibits
APPENDIX FINANCIAL EXHIBITS
Slide 15: Appendix Financial Exhibits
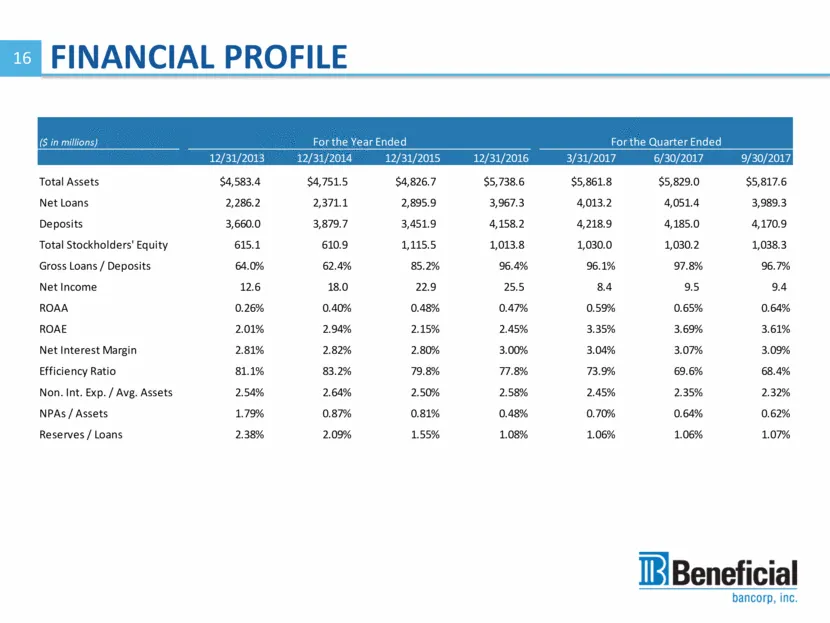
APPENDIX FINANCIAL EXHIBITS Beneficial
Slide 16: Loan Portfolio
LOAN PORTFOLIO Investments in our commercial lending teams has driven organic commercial loan growth Loan Portfolio Composition as of 9/30/2017 17
Slide 17: Securities Portfolio
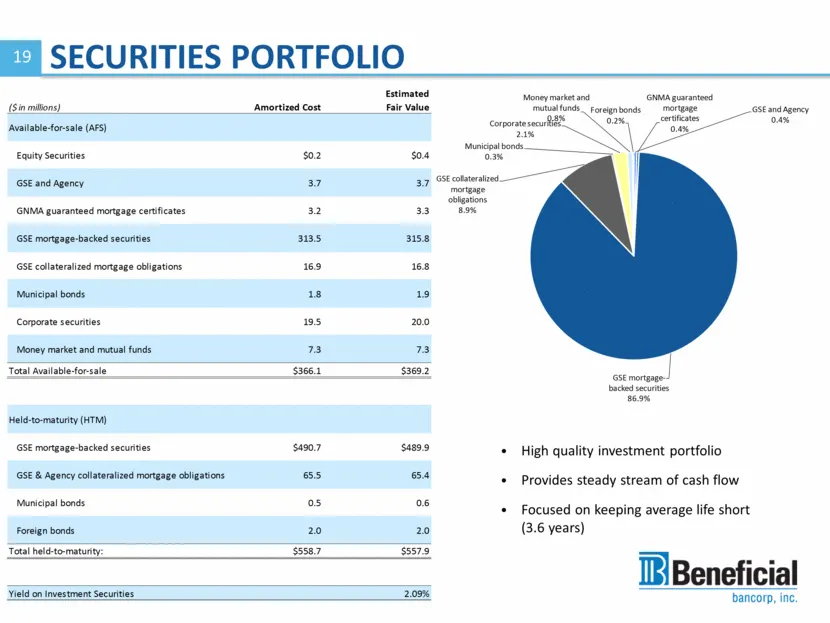
SECURITIES PORTFOLIO 19 High quality investment portfolio Provides steady stream of cash flow Focused on keeping average life short (3.6 years)
Slide 18: Deposit Composition
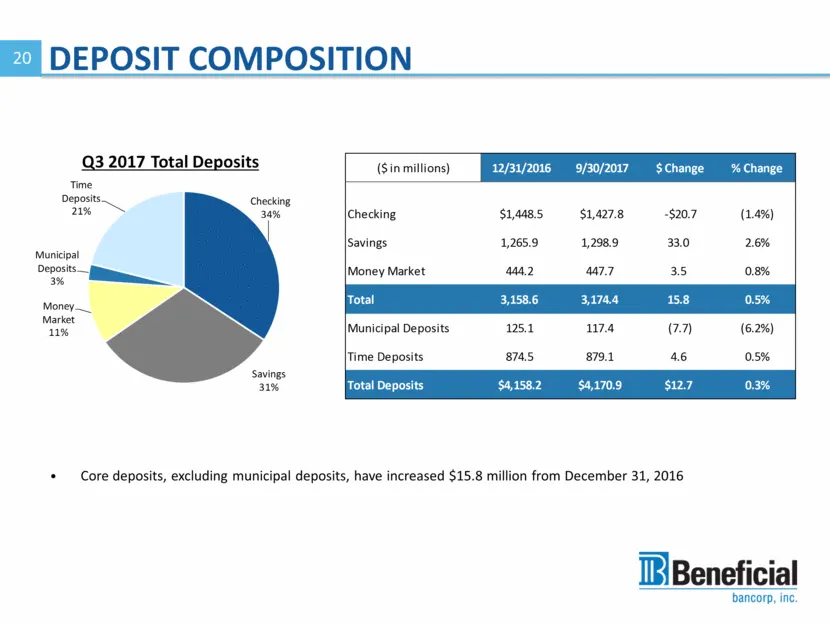
DEPOSIT COMPOSITION Core deposits, excluding municipal deposits, have increased $15.8 million from December 31, 2016 20
Slide 19: Cost of Deposits
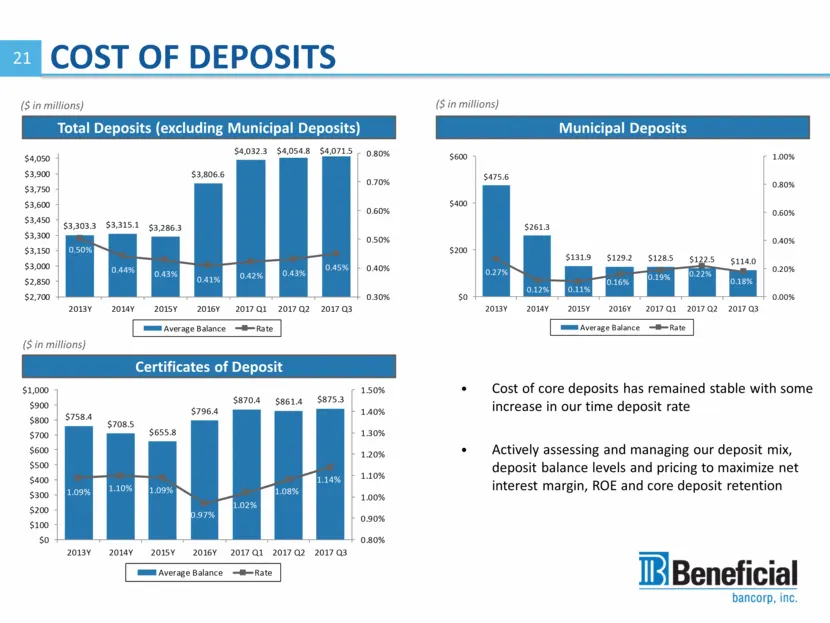
COST OF DEPOSITS ($ in millions) 21 ($ in millions) ($ in millions) Cost of core deposits has remained stable with some increase in our time deposit rate Actively assessing and managing our deposit mix, deposit balance levels and pricing to maximize net interest margin, ROE and core deposit retentio
Slide 20: Calculation of Efficiency Ratio
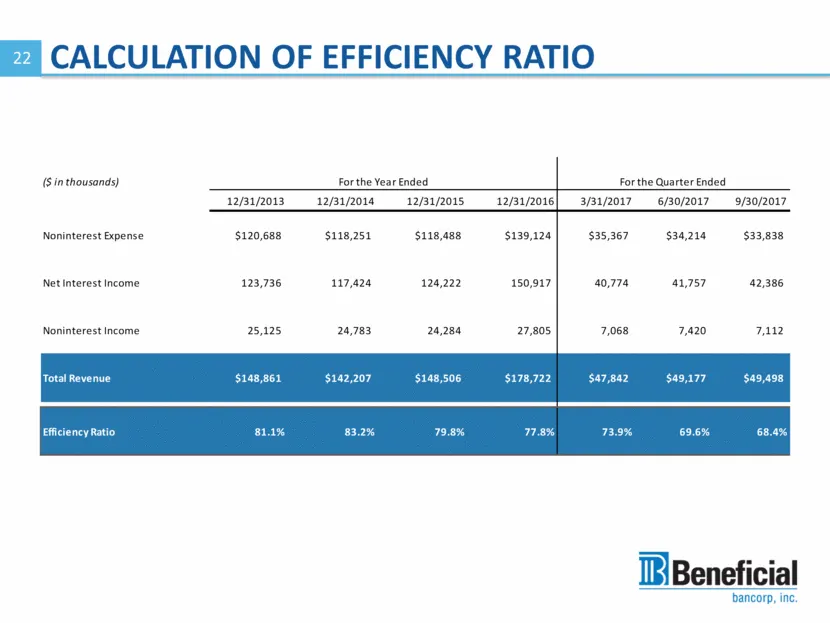
CALCULATION OF EFFICIENCY RATIO 22
Slide 21: Reconciliation of Non-GAAP Measures
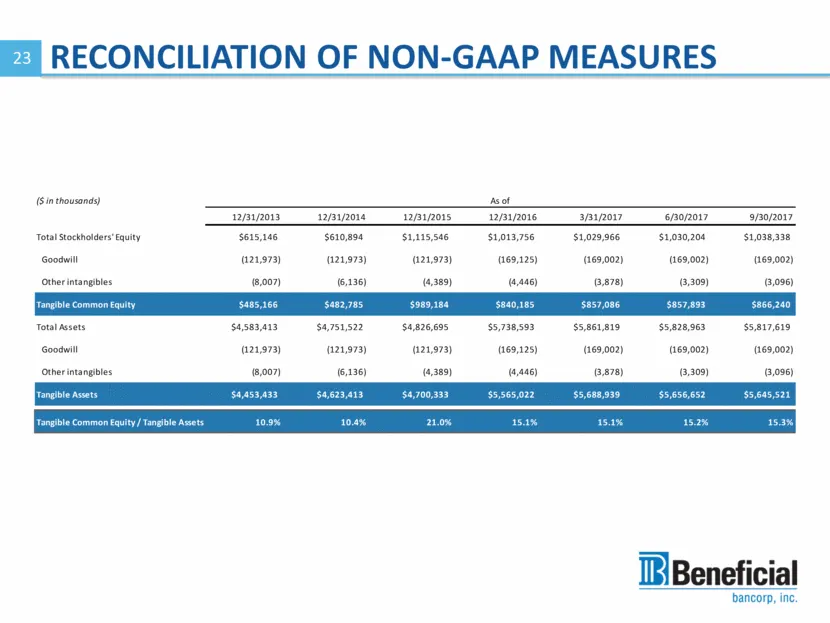
RECONCILIATION OF NON-GAAP MEASURES 23
Slide 22: Additional Information
24 For Additional Information Please Contact: Thomas Cestare, CFO @ (215)-864-6009 or [email protected] www.thebeneficial.com Corporate Headquarters: 1818 Beneficial Bank Place 1818 Market Street, 22nd Floor Philadelphia, PA 19103 ADDITIONAL INFORMATION
Slide 23: Additional Information
ADDITIONAL INFORMATION For Additional Information Please Contact: Thomas Cestare, CFO @ (215)-864-6009 or [email protected] www.thebeneficial.com Corporate Headquarters: 1818 Beneficial Bank Place 1818 Market Street, 22"¢ Floor Philadelphia, PA 19103 TBeneficial bancorp, inc.
Source: SEC EDGAR · 8-K filed Nov 7, 2017
More decks from Beneficial Bancorp Inc
 Merger or Acquisition (September 2018)68 slides · Sep 19, 2018
 Merger or Acquisition (August 2018)22 slides · Aug 8, 2018
 Investor Presentation (June 2018)23 slides · Jun 12, 2018
 Investor Presentation (April 2018)14 slides · Apr 19, 2018
 Investor Presentation (February 2018)21 slides · Feb 13, 2018
 Investor Presentation (April 2017)10 slides · Apr 20, 2017