Flagstar Bancorp — Non-Deal Roadshow (February 2016)
41 slides from Flagstar Bancorp's roadshow presentation, Feb 25, 2016
Slide 1: Mid-Atlantic Road Show February 25-26, 2016
Flagstar Bancorp, Inc. (NYSE: FBC) Mid-Atlantic Road Show February 25 - 26, 2016
Slide 2: Cautionary statement
Cautionary statement This presentation contains "forward-looking statements" within the meaning of the Private Securities Litigation Reform Act of 1995, as amended. Forward-looking statements are based on management’s current expectations and assumptions regarding the Company’s business and performa
Slide 3: Executive Summary
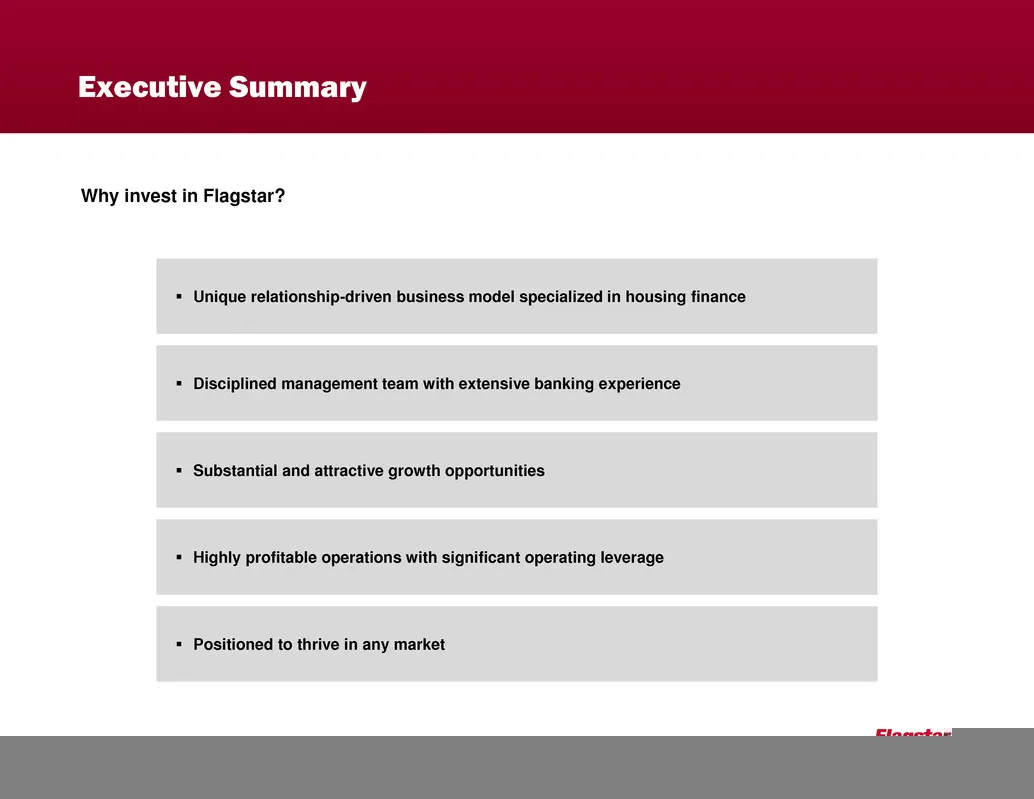
Executive Summary Unique relationship-driven business model specialized in housing finance Disciplined management team with extensive banking experience Substantial and attractive growth opportunities Highly profitable operations with significant operating leverage Positioned to thrive in

Slide 4: Unique relationship-driven business model specialized in housing finance
Unique relationship-driven business model specialized in housing finance 4
Slide 5: Flagstar at a glance
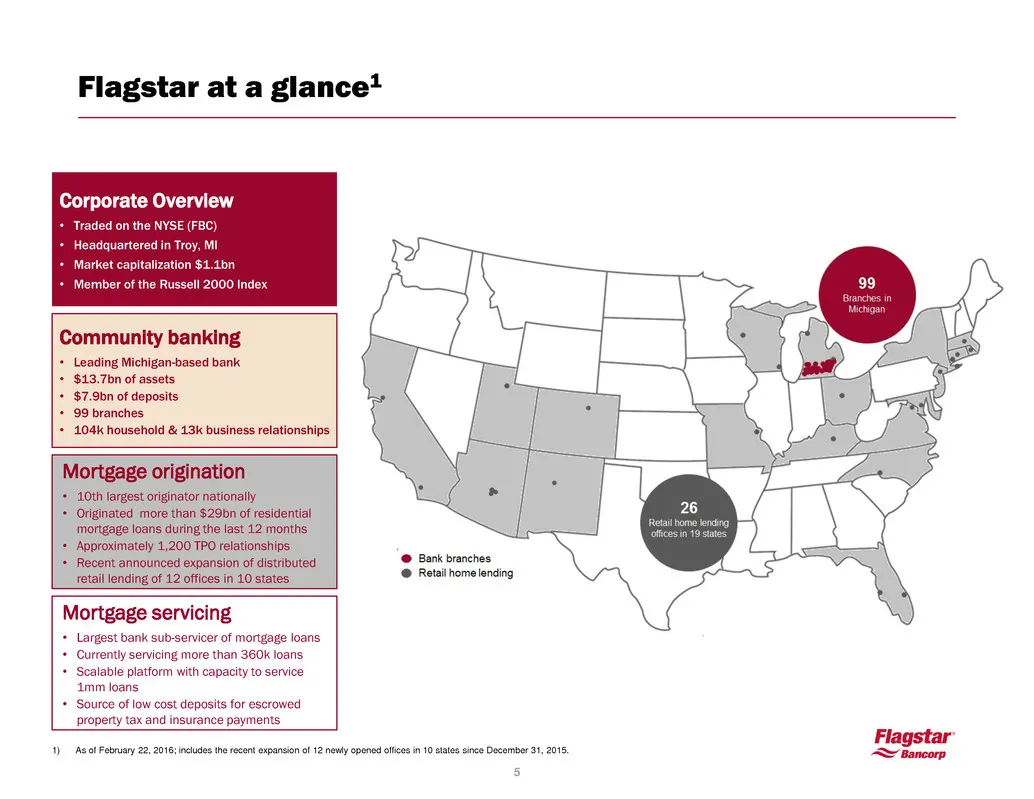
Flagstar at a glance1 Community banking • Leading Michigan-based bank • $13.7bn of assets • $7.9bn of deposits • 99 branches • 104k household & 13k business relationships Mortgage origination • 10th largest originator nationally • Originated more than $29bn of residential mortgage loans during the l
Slide 6: Flagstar's one-of-a-kind business model
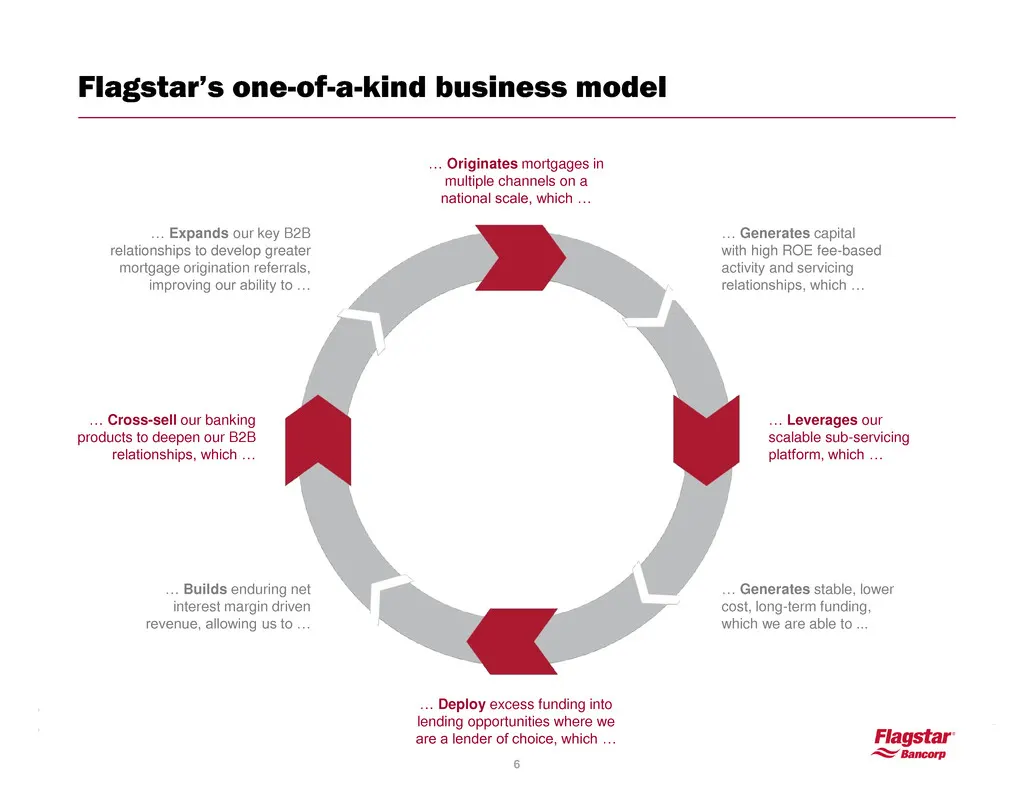
Flagstar’s one-of-a-kind business model … Originates mortgages in multiple channels on a national scale, which … … Deploy excess funding into lending opportunities where we are a lender of choice, which … … Cross-sell our banking products to deepen our B2B relationships, which … … Leverages our scal
Slide 7: Residential mortgage originations by channel
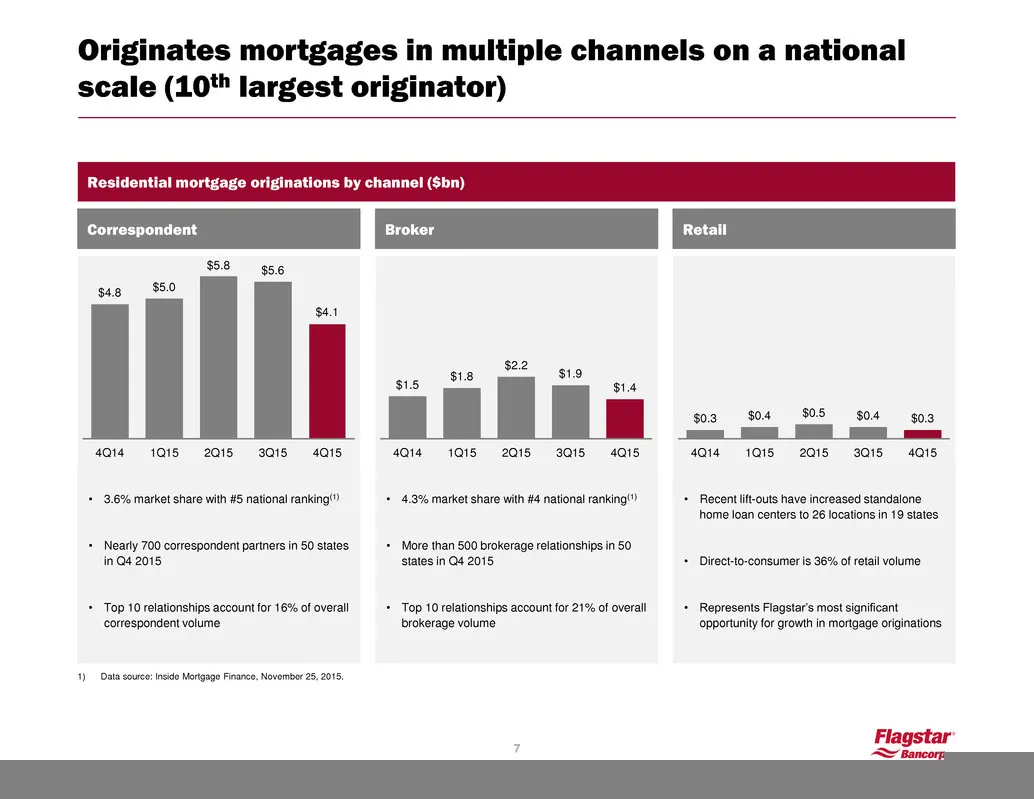
Residential mortgage originations by channel ($bn) Broker $1.5 $1.8 $2.2 $1.9 $1.4 4Q14 1Q15 2Q15 3Q15 4Q15 • 4.3% market share with #4 national ranking(1) • More than 500 brokerage relationships in 50 states in Q4 2015 • Top 10 relationships account for 21% of overall brokerage volume 1) Data sourc
Slide 8: Mortgage servicing key facts
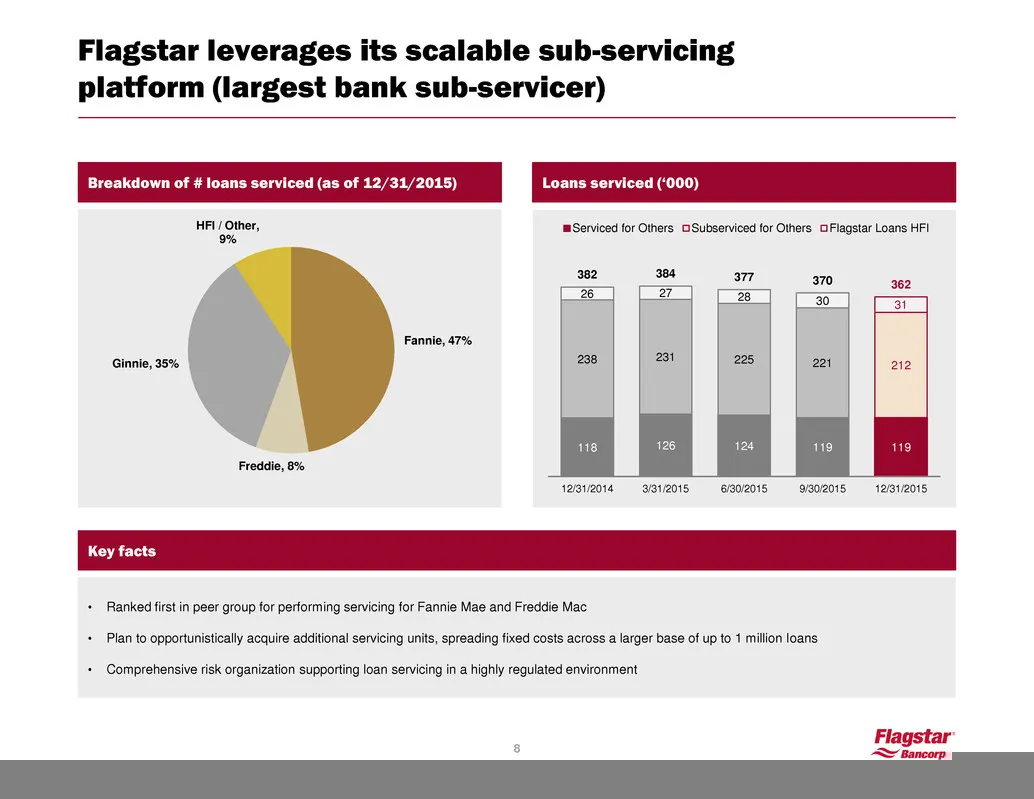
Key facts • Ranked first in peer group for performing servicing for Fannie Mae and Freddie Mac • Plan to opportunistically acquire additional servicing units, spreading fixed costs across a larger base of up to 1 million loans • Comprehensive risk organization supporting loan servicing in a highly r
Slide 9: Strong market position as leading Michigan-based community bank
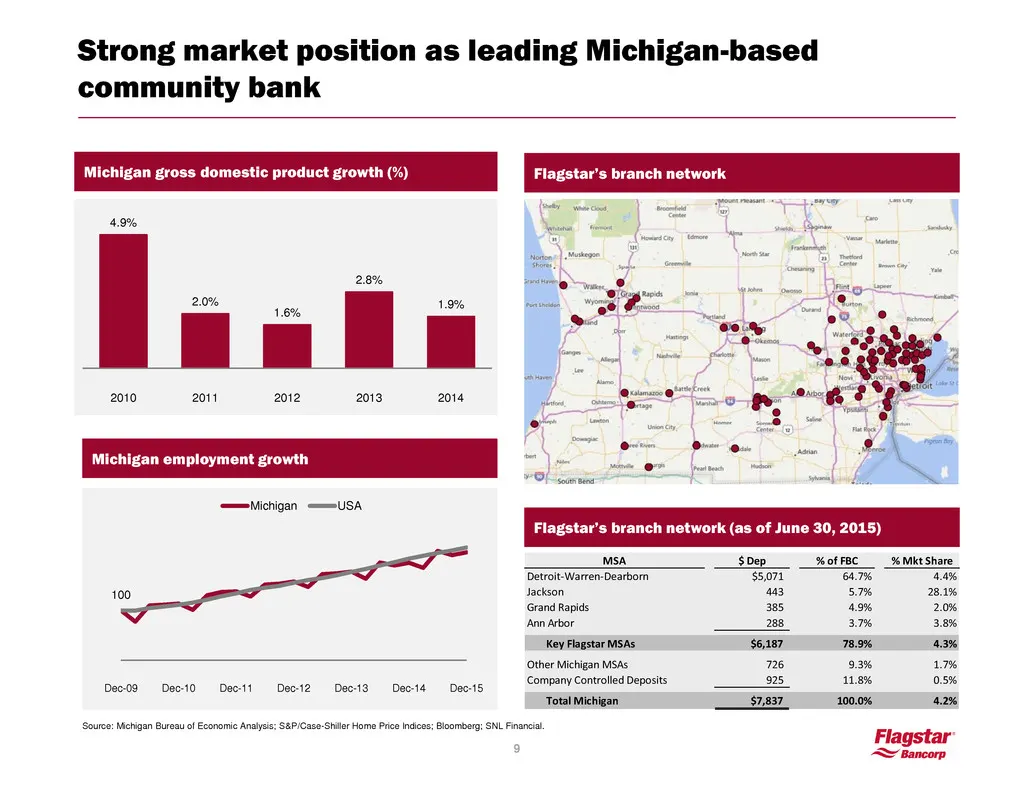
154 7 35 Strong market position as leading Michigan-based community bank Flagstar’s branch network Flagstar’s branch network (as of June 30, 2015) Michigan gross domestic product growth (%) 4.9% 2.0% 1.6% 2.8% 1.9% 2010 2011 2012 2013 2014 Michigan employment growth 100 Dec-09 Dec-10 Dec-11 Dec-12 D
Slide 10: Long-term targets
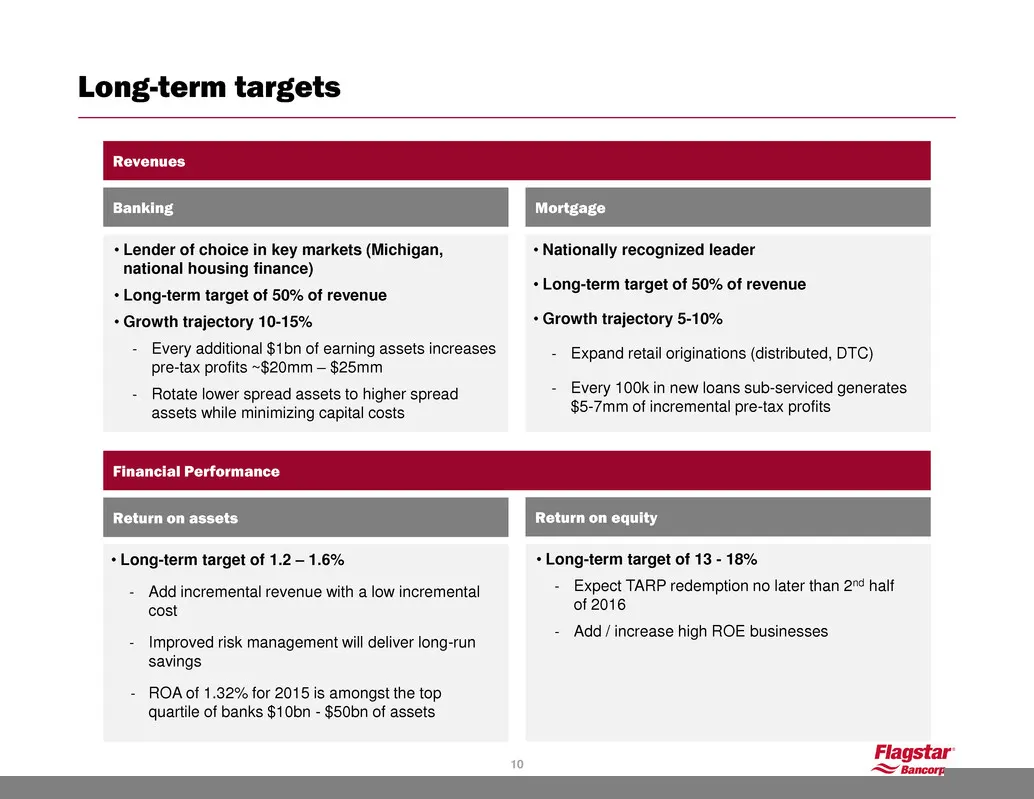
Long-term targets • Long-term target of 1.2 – 1.6% - Add incremental revenue with a low incremental cost - Improved risk management will deliver long-run savings - ROA of 1.32% for 2015 is amongst the top quartile of banks $10bn - $50bn of assets • Long-term target of 13 - 18% - Expect TARP redempti
Slide 11: Ownership structure
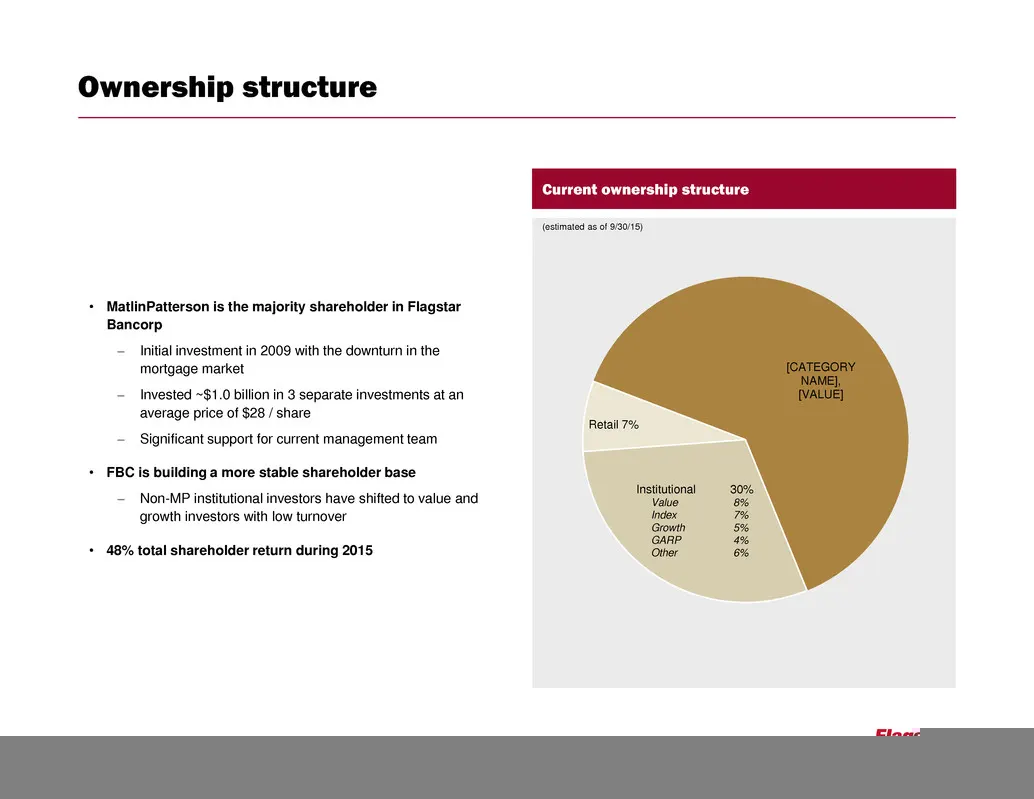
Ownership structure [CATEGORY NAME], [VALUE] Retail 7% Institutional 30% Value 8% Index 7% Growth 5% GARP 4% Other 6% Current ownership structure (estimated as of 9/30/15) • MatlinPatterson is the majority shareholder in Flagstar Bancorp – Initial investment in 2009 with the downturn in the mortgage
Slide 12: Disciplined management team with extensive banking experience
Disciplined management team with extensive banking experience 12
Slide 13: Assembled strong executive team
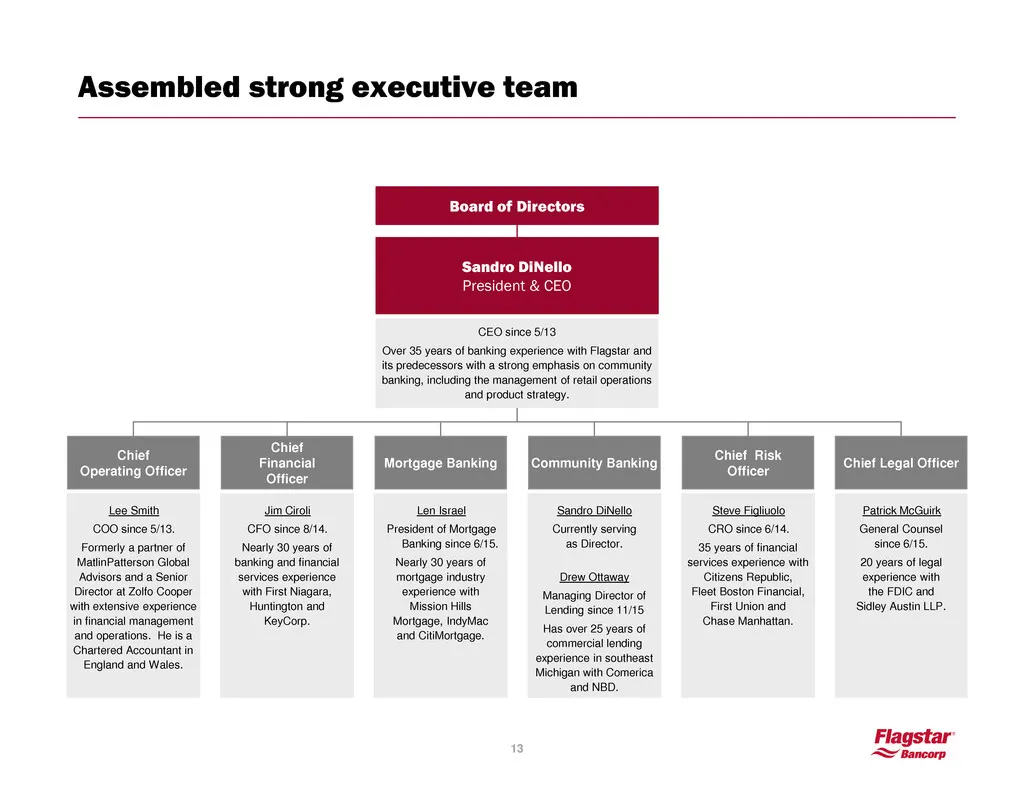
Assembled strong executive team Sandro DiNello President & CEO Board of Directors Community Banking Sandro DiNello Currently serving as Director. Drew Ottaway Managing Director of Lending since 11/15 Has over 25 years of commercial lending experience in southeast Michigan with Comerica and NBD. Chie
Slide 14: Lending team leadership
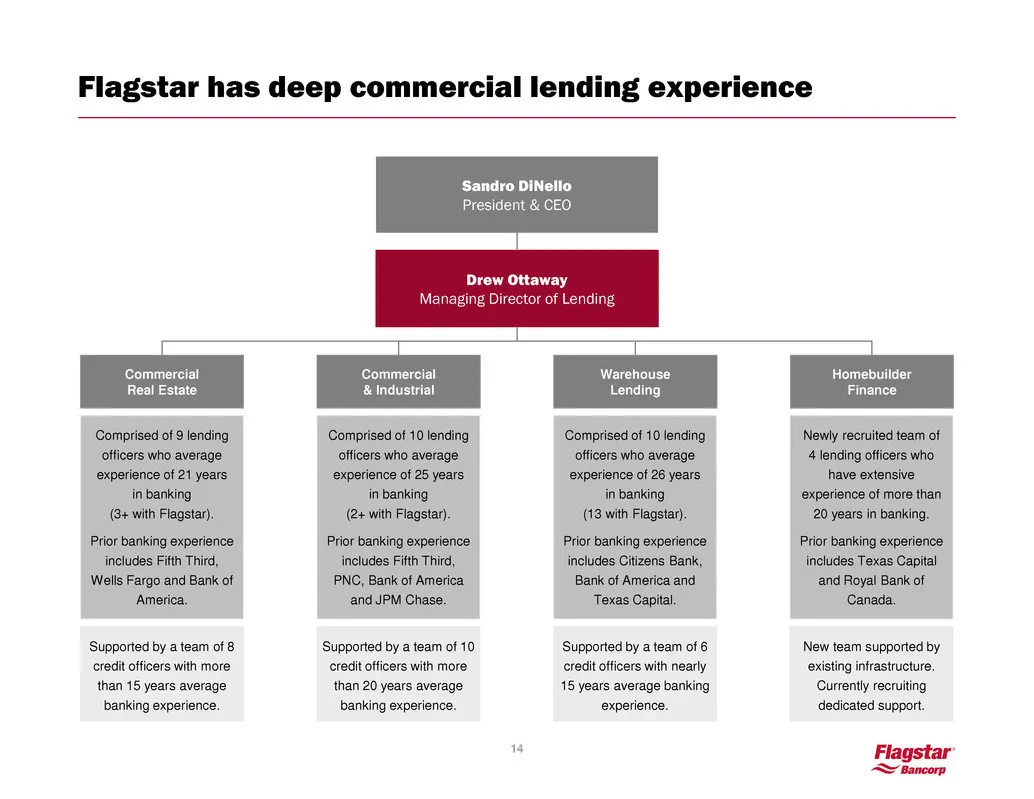
Sandro DiNello President & CEO Drew Ottaway Managing Director of Lending Warehouse Lending Commercial Real Estate Comprised of 9 lending officers who average experience of 21 years in banking (3+ with Flagstar). Prior banking experience includes Fifth Third, Wells Fargo and Bank of America. Homebuil
Slide 15: Risk management organization
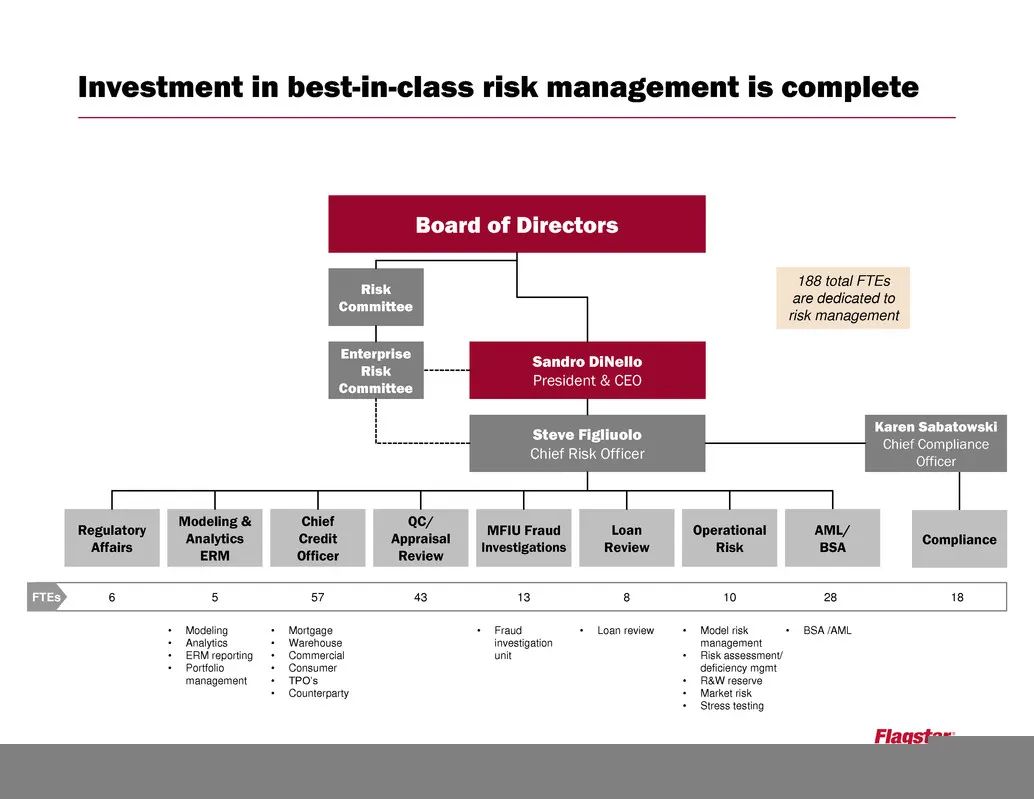
Karen Sabatowski Chief Compliance Officer Sandro DiNello President & CEO Board of Directors Steve Figliuolo Chief Risk Officer Risk Committee Enterprise Risk Committee • Modeling • Analytics • ERM reporting • Portfolio management • Mortgage • Warehouse • Commercial • Consumer • TPO’s • Counterparty

Slide 16: Substantial and attractive growth opportunities
Substantial and attractive growth opportunities 16
Slide 17: Strong growth opportunities
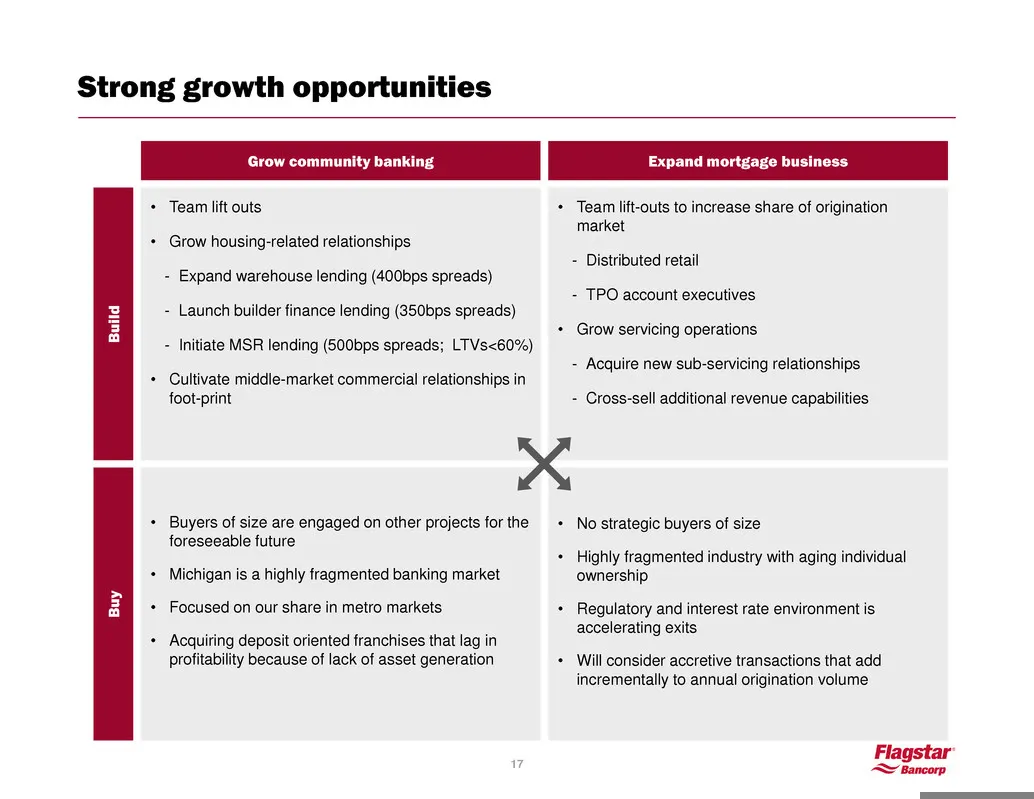
Strong growth opportunities Grow community banking • Team lift outs • Grow housing-related relationships - Expand warehouse lending (400bps spreads) - Launch builder finance lending (350bps spreads) - Initiate MSR lending (500bps spreads; LTVs<60%) • Cultivate middle-market commercial relationships
Slide 18: Flagstar has built an attractive middle-market loan portfolio
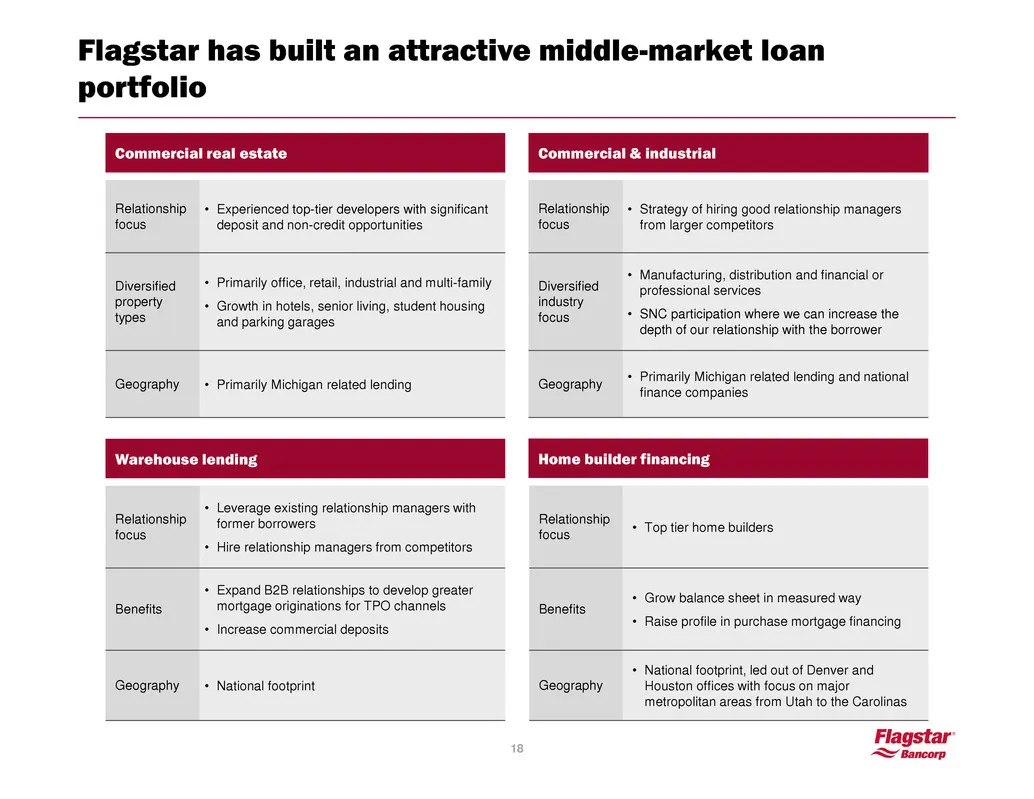
Flagstar has built an attractive middle-market loan portfolio 18 Relationship focus • Experienced top-tier developers with significant deposit and non-credit opportunities Diversified property types • Primarily office, retail, industrial and multi-family • Growth in hotels, senior living, student ho
Slide 19: Expanding into complementary products
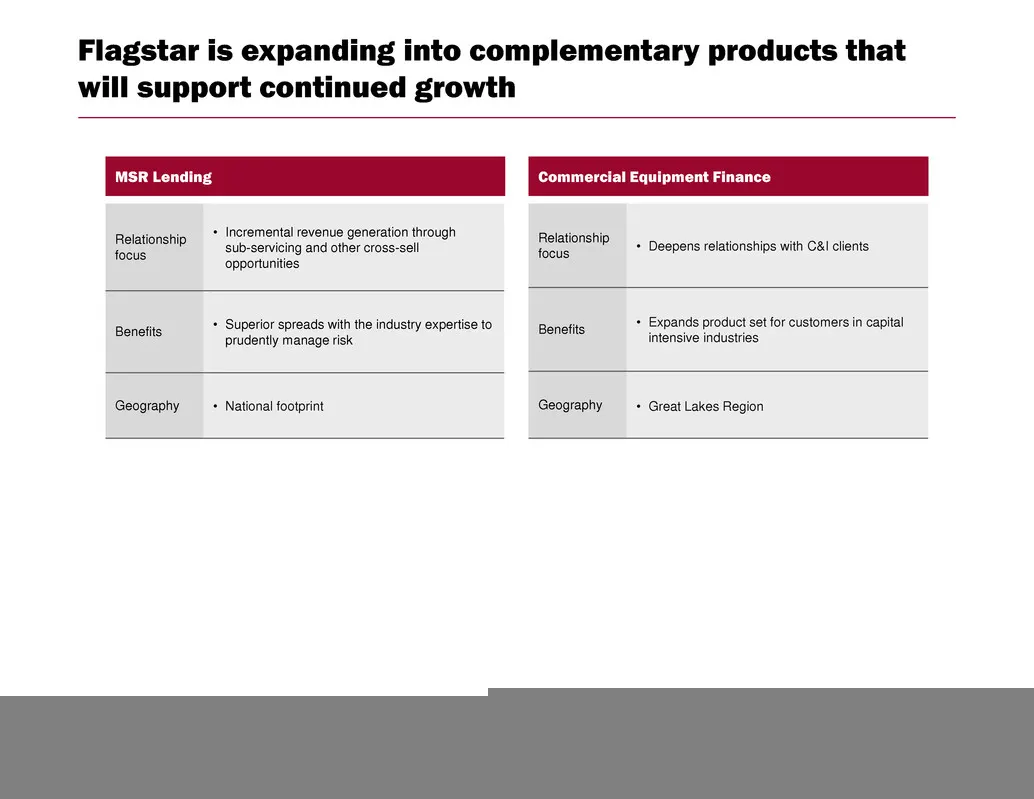
MSR Lending Commercial Equipment Finance Relationship focus • Deepens relationships with C&I clients Benefits • Expands product set for customers in capital intensive industries Geography • Great Lakes Region Relationship focus • Incremental revenue generation through • sub-servicing and other cross
Slide 20: Deposit growth opportunities
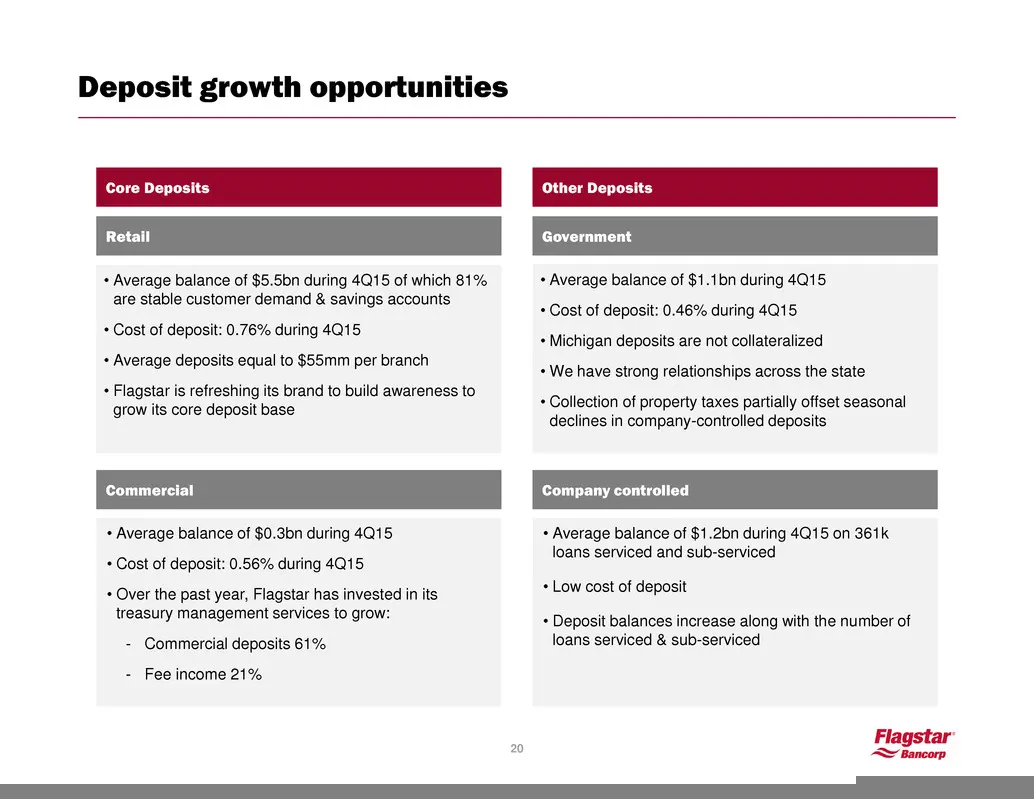
Deposit growth opportunities • Average balance of $1.1bn during 4Q15 • Cost of deposit: 0.46% during 4Q15 • Michigan deposits are not collateralized •We have strong relationships across the state • Collection of property taxes partially offset seasonal declines in company-controlled deposits • Avera
Slide 21: Highly profitable operations with significant operating leverage
Highly profitable operations with significant operating leverage 21
Slide 22: 4th quarter 2015 key highlights
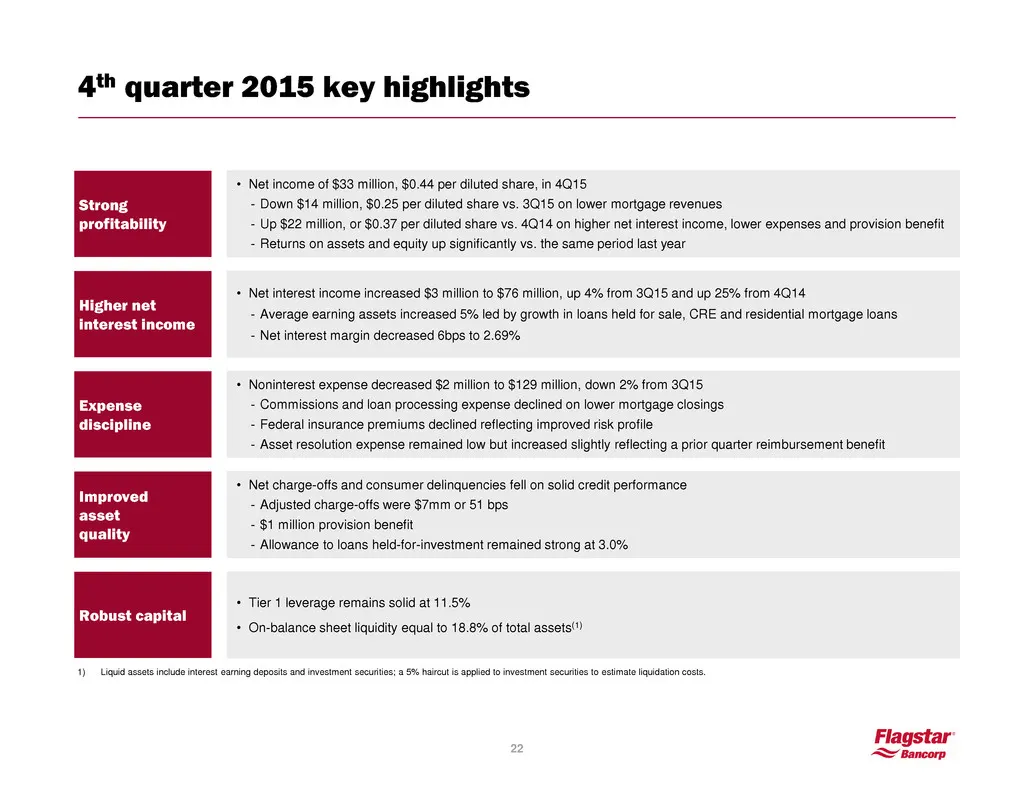
4th quarter 2015 key highlights Strong profitability • Net income of $33 million, $0.44 per diluted share, in 4Q15 - Down $14 million, $0.25 per diluted share vs. 3Q15 on lower mortgage revenues - Up $22 million, or $0.37 per diluted share vs. 4Q14 on higher net interest income, lower expenses and p
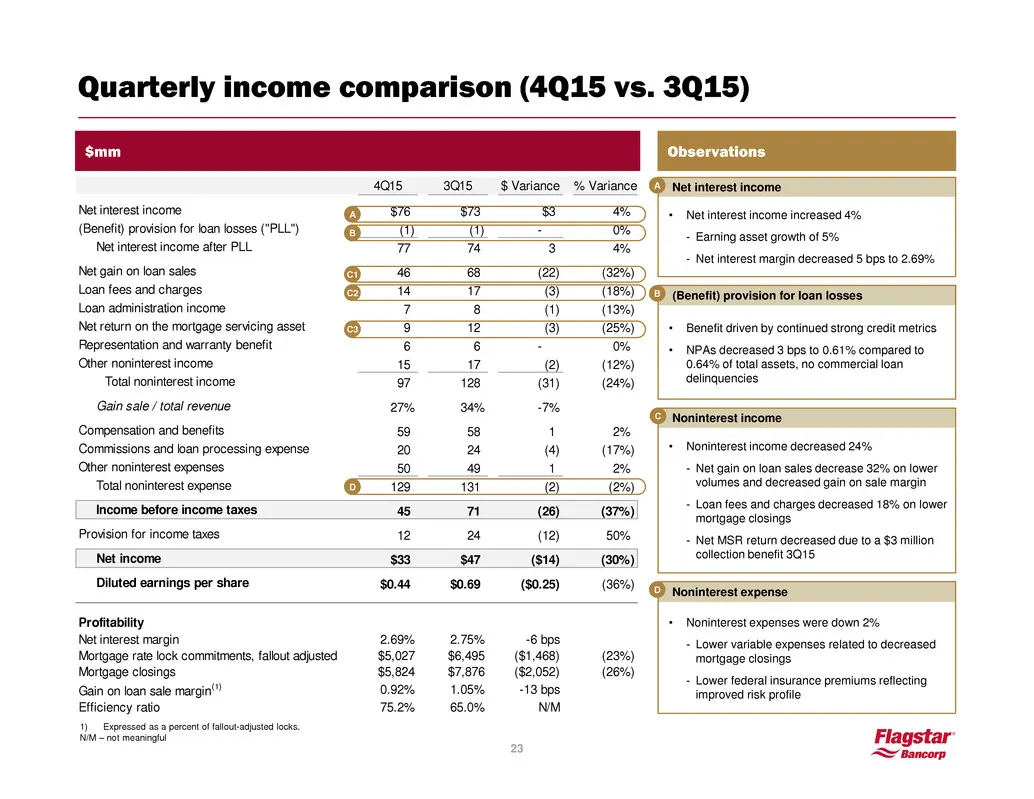
Slide 23: Quarterly income comparison (4Q15 vs. 3Q15)
(Benefit) provision for loan losses • Benefit driven by continued strong credit metrics • NPAs decreased 3 bps to 0.61% compared to 0.64% of total assets, no commercial loan delinquencies B Quarterly income comparison (4Q15 vs. 3Q15) $mm Observations Noninterest income • Noninterest income decreased
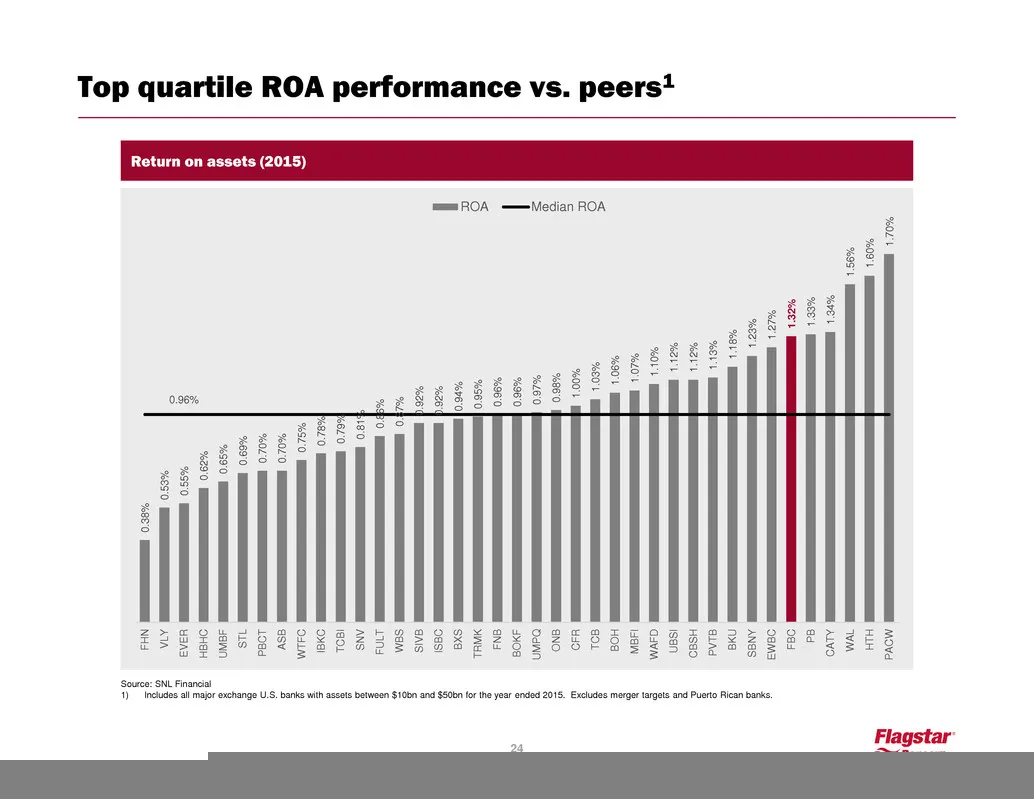
Slide 24: ROA performance vs. peers
0. 38 % 0. 53 % 0. 55 % 0. 62 % 0. 65 % 0. 69 % 0. 70 % 0. 70 % 0. 75 % 0. 78 % 0. 79 % 0. 81 % 0. 86 % 0. 87 % 0. 92 % 0. 92 % 0. 94 % 0. 95 % 0. 96 % 0. 96 % 0. 97 % 0. 98 % 1. 00 % 1. 03 % 1. 06 % 1. 07 % 1. 10 % 1. 12 % 1. 12 % 1. 13 % 1. 18 % 1. 23 % 1. 27 % 1. 32 % 1. 33 % 1. 34 % 1. 56 % 1. 6
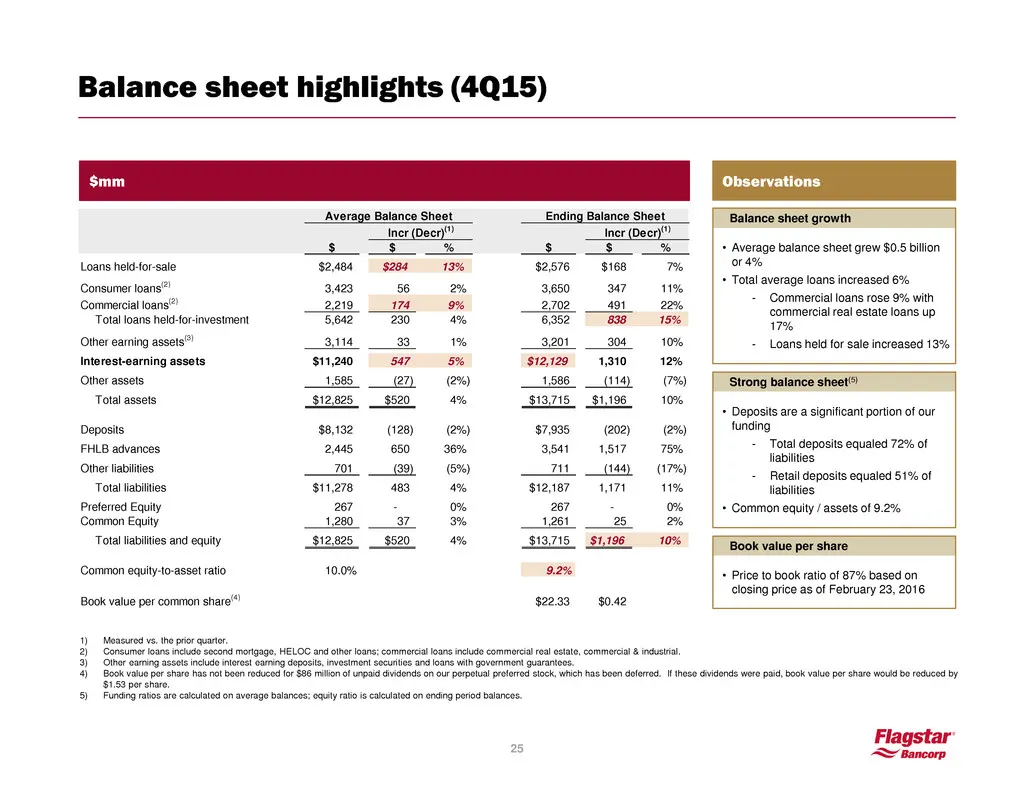
Slide 25: Book value per share and balance sheet
Book value per share • Price to book ratio of 87% based on closing price as of February 23, 2016 1) Measured vs. the prior quarter. 2) Consumer loans include second mortgage, HELOC and other loans; commercial loans include commercial real estate, commercial & industrial. 3) Other earning assets incl
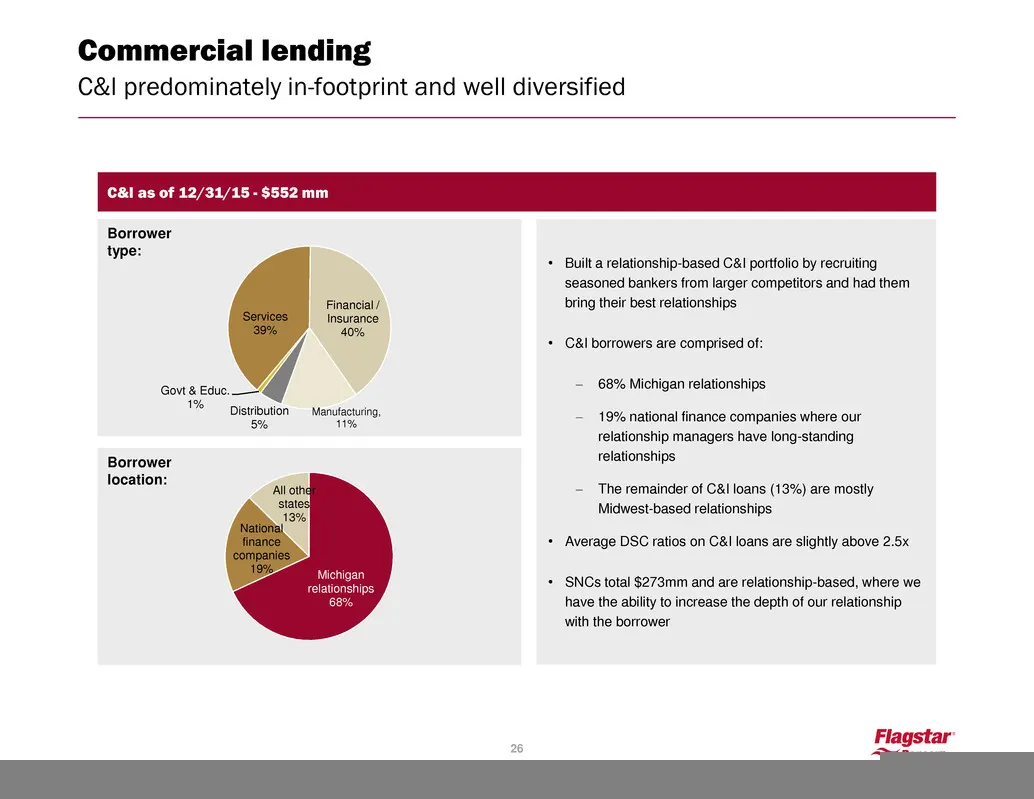
Slide 26: Commercial lending
Commercial lending C&I predominately in-footprint and well diversified 26 Services 39% Financial / Insurance 40% Manufacturing, 11% Distribution 5% Govt & Educ. 1% C&I as of 12/31/15 - $552 mm Borrower location: • Built a relationship-based C&I portfolio by recruiting seasoned bankers from larger co
Slide 27: Commercial real estate lending
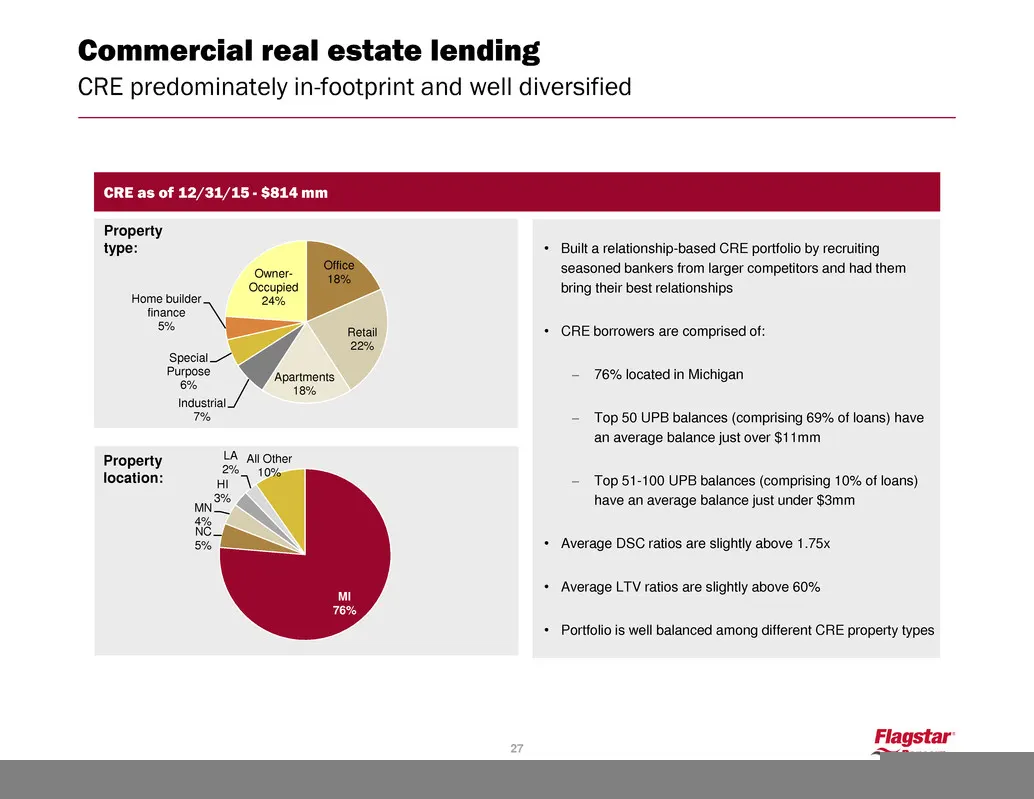
Commercial real estate lending CRE predominately in-footprint and well diversified 27 Office 18% Retail 22% Apartments 18% Industrial 7% Special Purpose 6% Home builder finance 5% Owner- Occupied 24% CRE as of 12/31/15 - $814 mm Property type: Property location: MI 76% NC 5% MN 4% HI 3% LA 2% All Ot
Slide 28: Mortgage originations and gain on loan sale
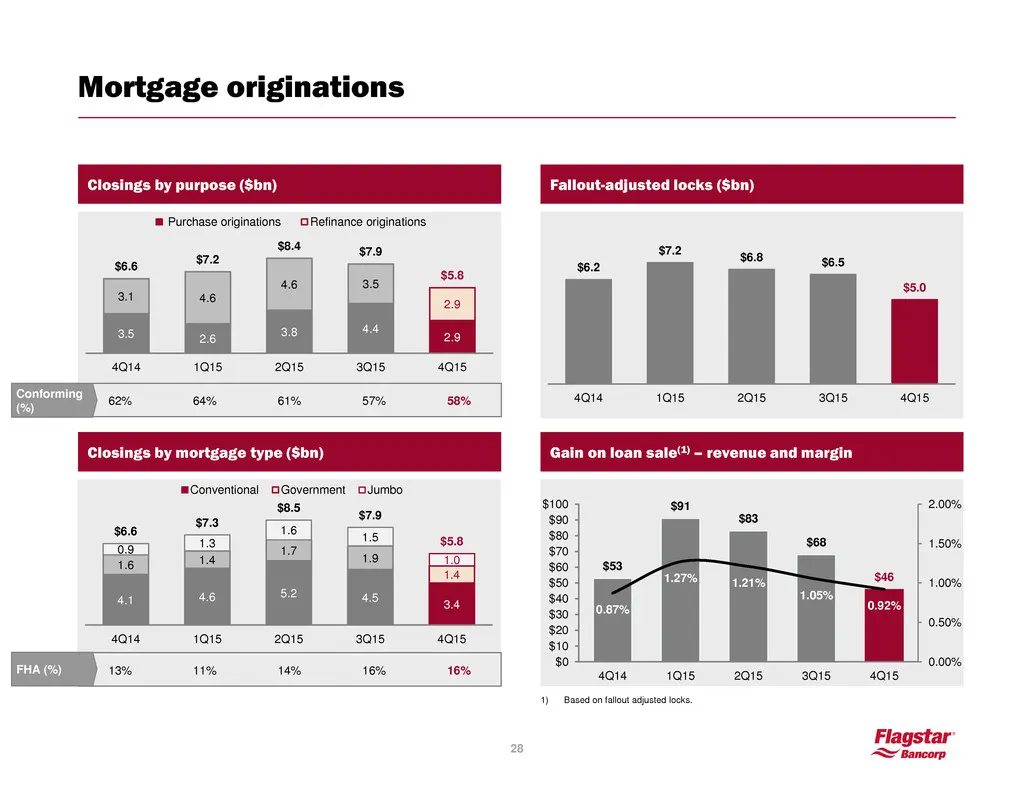
4.1 4.6 5.2 4.5 3.4 1.6 1.4 1.7 1.9 1.4 0.9 1.3 1.6 1.5 1.0 $6.6 $7.3 $8.5 $7.9 $5.8 4Q14 1Q15 2Q15 3Q15 4Q15 Conventional Government Jumbo Mortgage originations Closings by purpose ($bn) 3.5 2.6 3.8 4.4 2.9 3.1 4.6 4.6 3.5 2.9 $6.6 $7.2 $8.4 $7.9 $5.8 4Q14 1Q15 2Q15 3Q15 4Q15 Purchase originations
Slide 29: MSR asset return and portfolio statistics
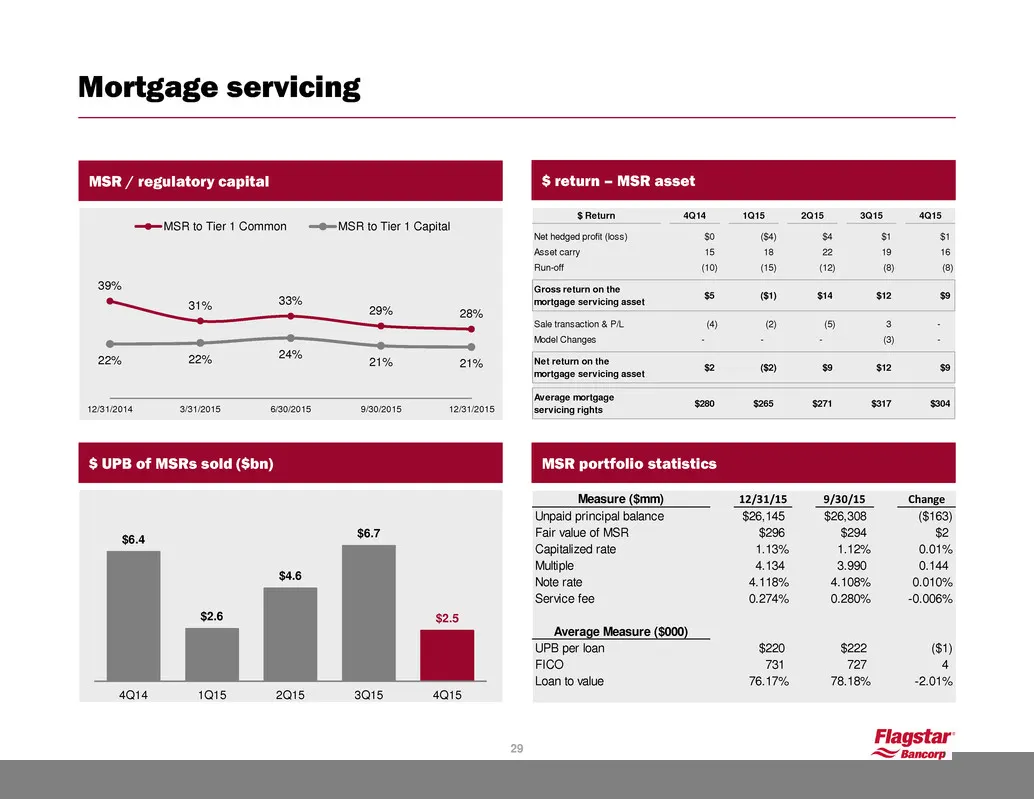
$ return – MSR asset MSR portfolio statistics Measure ($mm) 12/31/15 9/30/15 Change Unpaid principal balance $26,145 $26,308 ($163) Fair value of MSR $296 $294 $2 Capitalized rate 1.13% 1.12% 0.01% Multiple 4.134 3.990 0.144 Note rate 4.118% 4.108% 0.010% Service fee 0.274% 0.280% -0.006% Average Me
Slide 30: Guidance
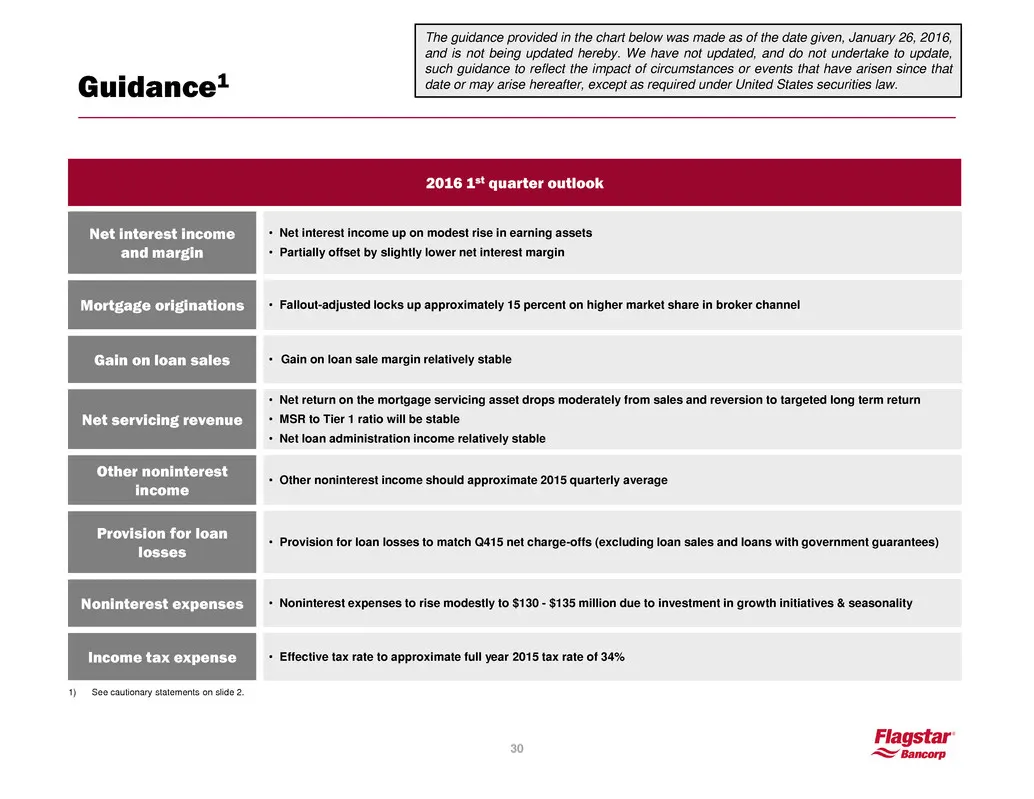
Guidance1 1) See cautionary statements on slide 2. Net interest income and margin • Net interest income up on modest rise in earning assets • Partially offset by slightly lower net interest margin Mortgage originations • Fallout-adjusted locks up approximately 15 percent on higher market share in br

Slide 31: Positioned to thrive in any market
Positioned to thrive in any market 31
Slide 32: Low credit risk
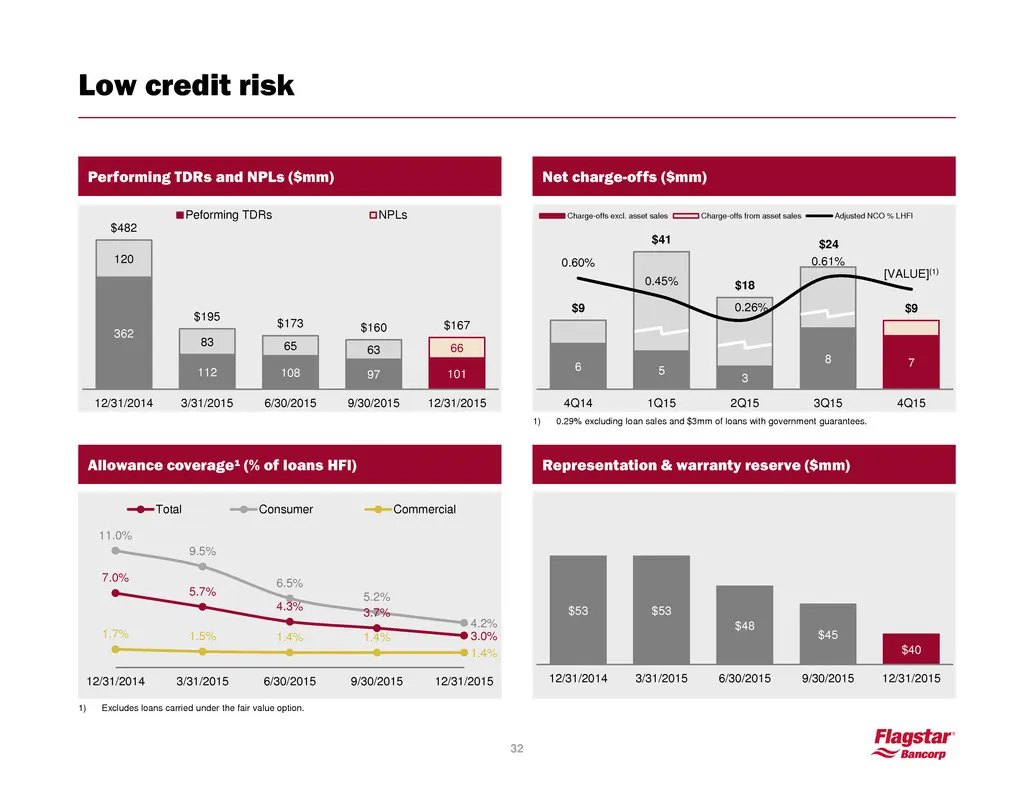
Low credit risk Performing TDRs and NPLs ($mm) 362 112 108 97 101 120 83 65 63 66 $482 $195 $173 $160 $167 12/31/2014 3/31/2015 6/30/2015 9/30/2015 12/31/2015 Peforming TDRs NPLs 1) Excludes loans carried under the fair value option. Representation & warranty reserve ($mm) Allowance coverage¹ (% of
Slide 33: Interest rate risk management
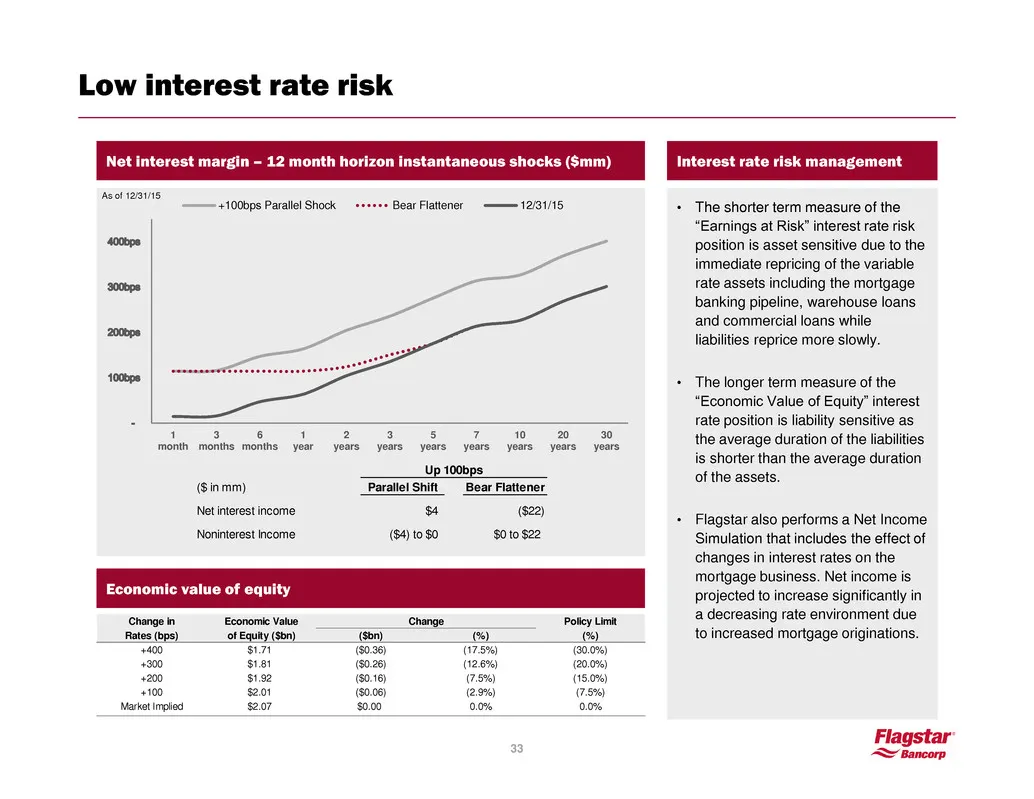
Interest rate risk management • The shorter term measure of the “Earnings at Risk” interest rate risk position is asset sensitive due to the immediate repricing of the variable rate assets including the mortgage banking pipeline, warehouse loans and commercial loans while liabilities reprice more sl
Slide 34: Low liquidity risk
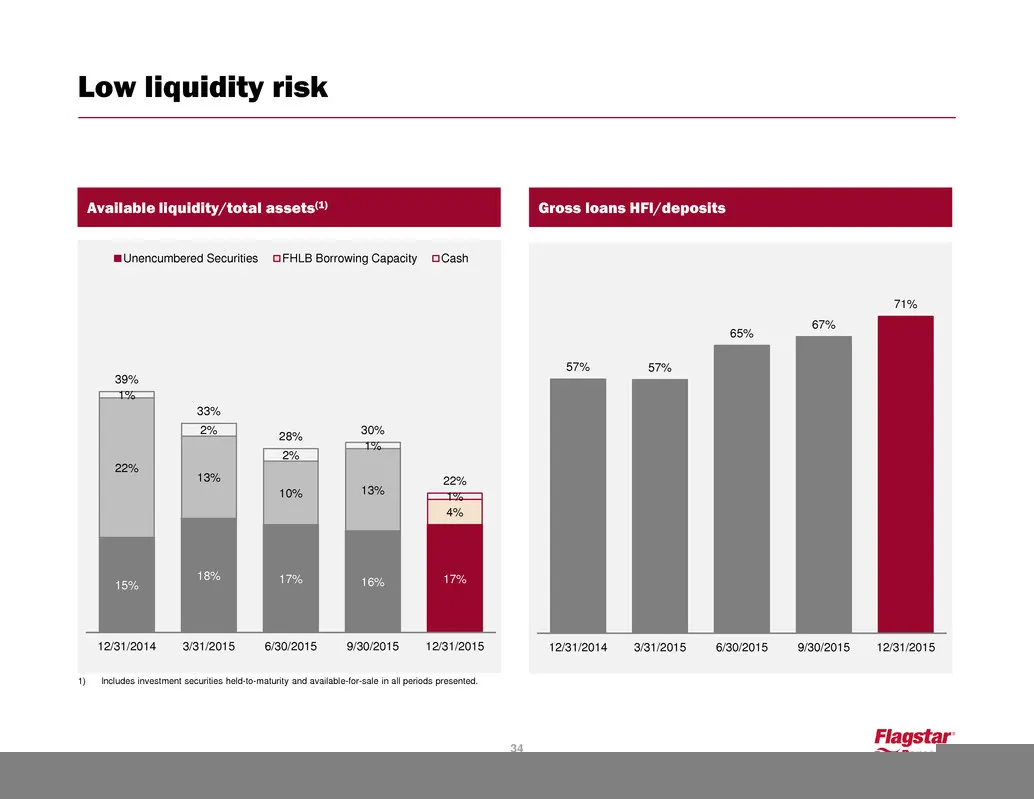
Low liquidity risk 1) Includes investment securities held-to-maturity and available-for-sale in all periods presented. Gross loans HFI/deposits 57% 57% 65% 67% 71% 12/31/2014 3/31/2015 6/30/2015 9/30/2015 12/31/2015 Available liquidity/total assets(1) 15% 18% 17% 16% 17% 22% 13% 10% 13% 4% 1% 2% 2%
Slide 35: Efficiency ratio and strong operating leverage
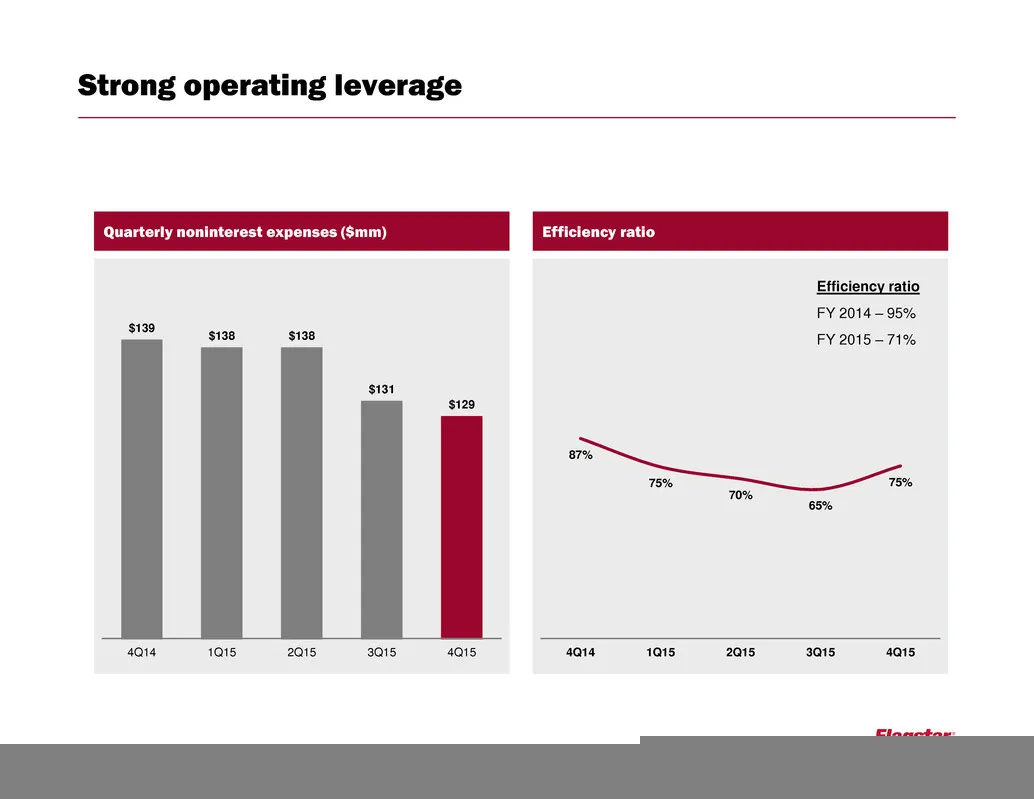
Efficiency ratio 87% 75% 70% 65% 75% 4Q14 1Q15 2Q15 3Q15 4Q15 Quarterly noninterest expenses ($mm) $139 $138 $138 $131 $129 4Q14 1Q15 2Q15 3Q15 4Q15 Efficiency ratio FY 2014 – 95% FY 2015 – 71% Strong operating leverage 35
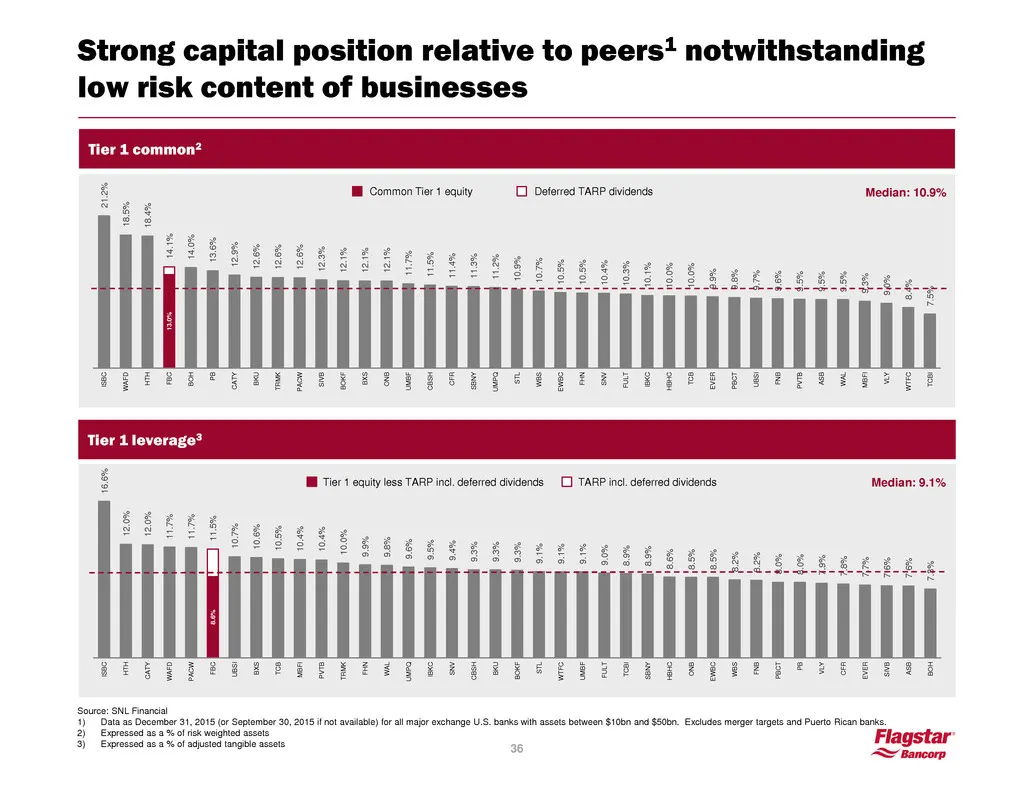
Slide 36: Capital ratios vs. peers
13.0 % 21.2 % 18.5 % 18.4 % 14.1 % 14.0 % 13.6 % 12.9 % 12.6 % 12.6 % 12.6 % 12.3 % 12.1 % 12.1 % 12.1 % 11.7 % 11.5 % 11.4 % 11.3 % 11.2 % 10.9 % 10.7 % 10.5 % 10.5 % 10.4 % 10.3 % 10.1 % 10.0 % 10.0 % 9.9% 9.8% 9.7% 9.6% 9.5% 9.5% 9.5% 9.3% 9.0% 8.4% 7.5% ISBC WAF D HTH FBC BOH PB CAT Y BKU TRM K
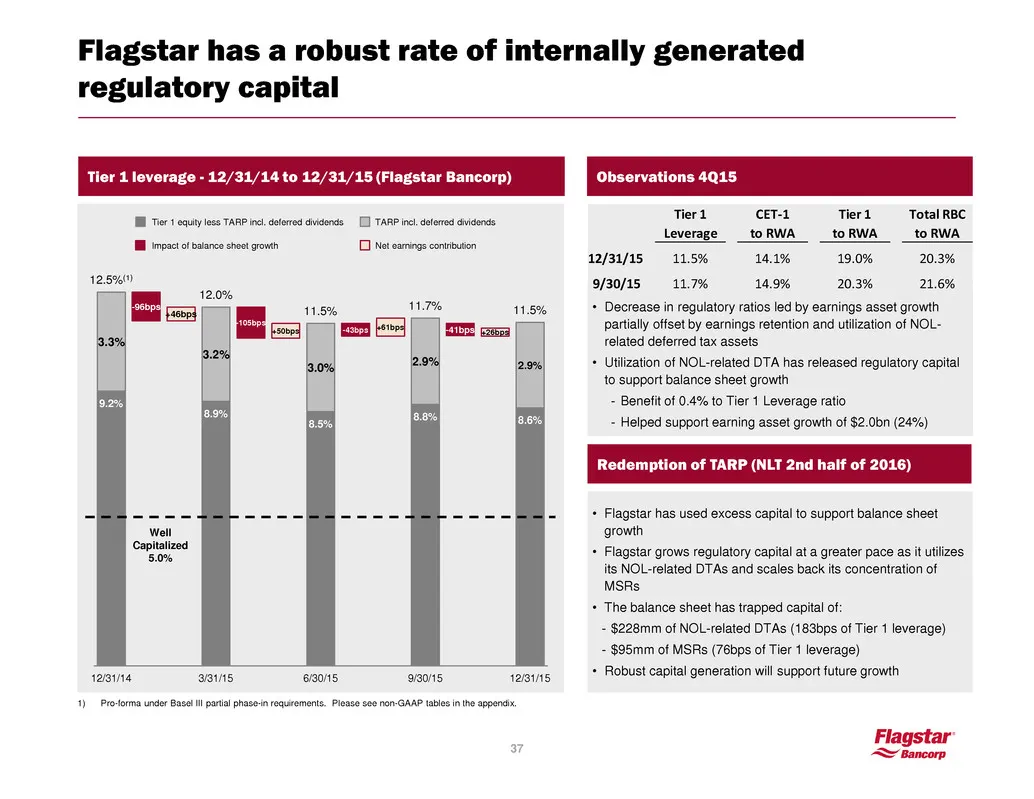
Slide 37: Regulatory capital and trapped capital
• Decrease in regulatory ratios led by earnings asset growth partially offset by earnings retention and utilization of NOL- related deferred tax assets • Utilization of NOL-related DTA has released regulatory capital to support balance sheet growth - Benefit of 0.4% to Tier 1 Leverage ratio - Helped
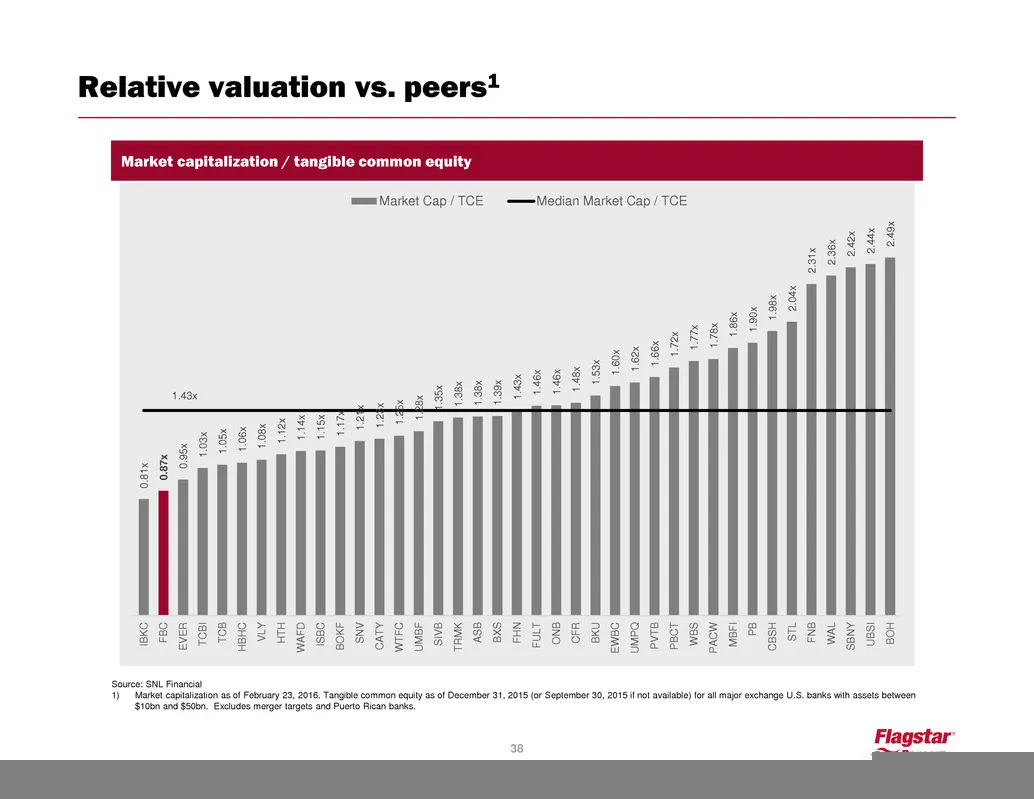
Slide 38: Relative valuation vs. peers
Relative valuation vs. peers1 Market capitalization / tangible common equity Astoria Financial (AF) 1.49x (Oct. 2015) Talmer Bancorp (TLMR) 1.46x (Jan. 2016) Recent M&A Transactions 38 Update chart with closing price 2/23/16 Source: SNL Financial 1) Market capitalization as of February 23, 2016. Tan
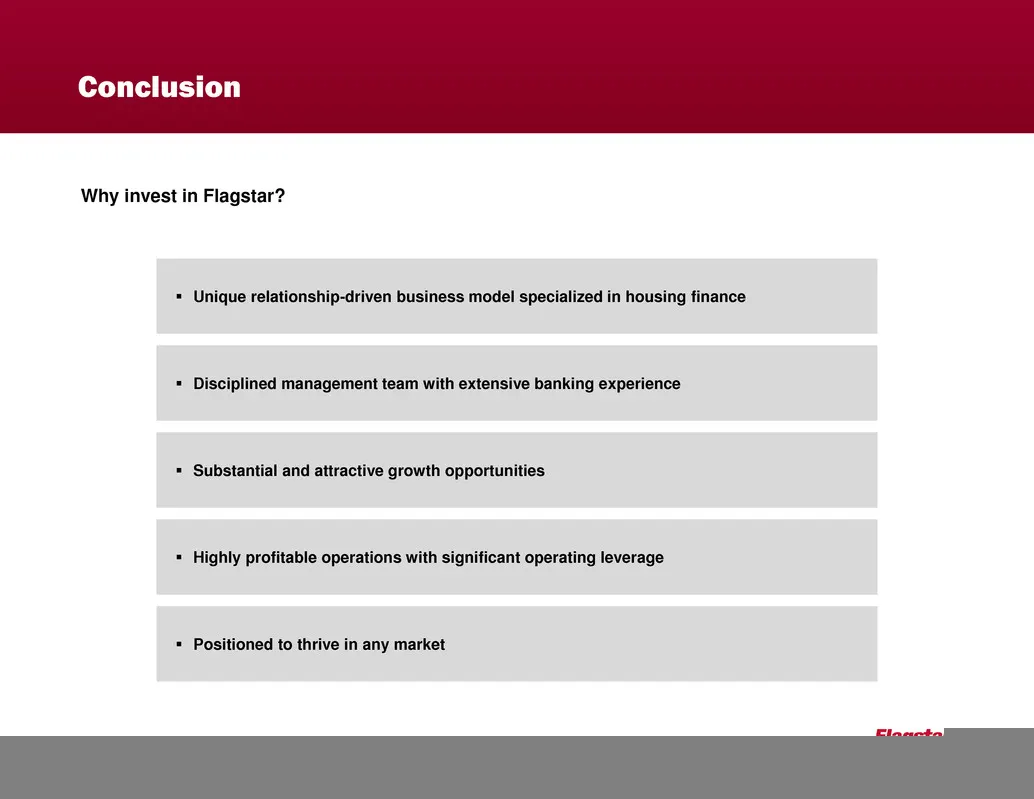
Slide 39: Conclusion
Conclusion 39 Unique relationship-driven business model specialized in housing finance Disciplined management team with extensive banking experience Substantial and attractive growth opportunities Highly profitable operations with significant operating leverage Positioned to thrive in any
Slide 40: Appendix Non-GAAP reconciliation
Appendix Non-GAAP reconciliation 41
Slide 41: Supplemental capital ratios
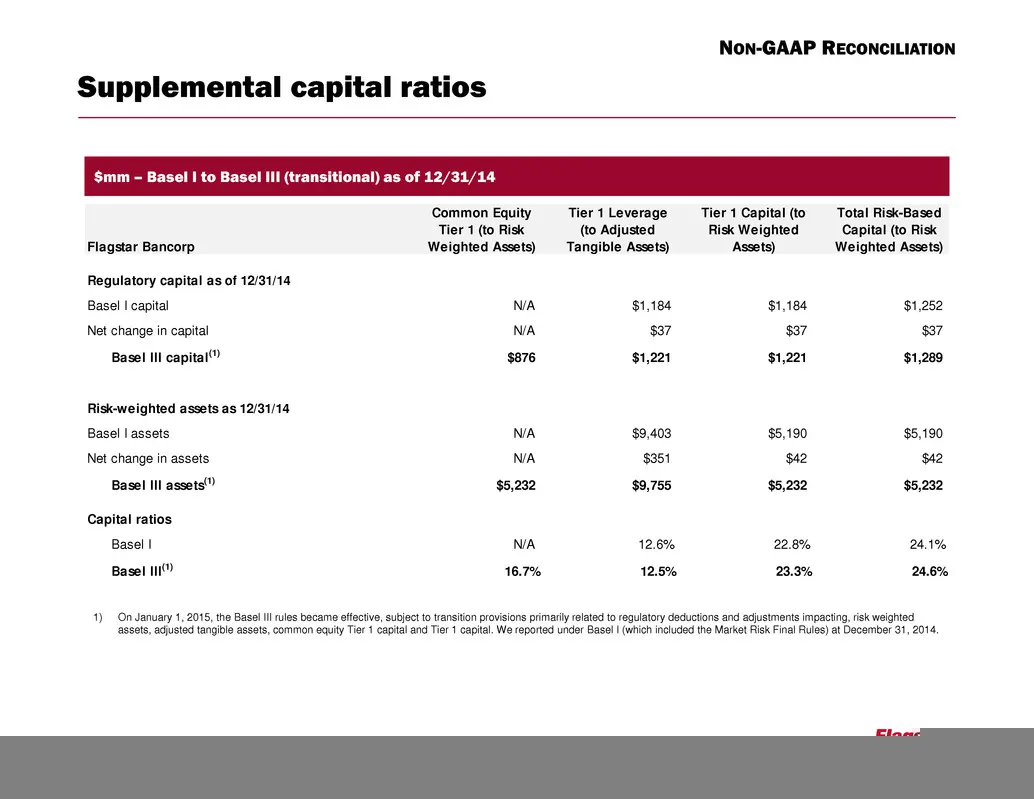
Supplemental capital ratios 41 NON-GAAP RECONCILIATION $mm – Basel I to Basel III (transitional) as of 12/31/14 1) On January 1, 2015, the Basel III rules became effective, subject to transition provisions primarily related to regulatory deductions and adjustments impacting, risk weighted assets, ad
Source: SEC EDGAR · 8-K filed Feb 25, 2016
More decks from Flagstar Bancorp Inc
 Q3 2022 Earnings Presentation39 slides · Oct 26, 2022
 Q2 2022 Earnings Presentation39 slides · Jul 27, 2022
 Q1 2022 Earnings Presentation40 slides · Apr 27, 2022
 Q4 2021 Earnings Presentation43 slides · Jan 26, 2022
 Q3 2021 Earnings Presentation44 slides · Oct 27, 2021
 Q2 2021 Earnings Presentation44 slides · Jul 28, 2021