Heidrick & Struggles International
Heidrick & Struggles International — Robert W. Baird Business Solutions Conference 2004
36 slides from Heidrick & Struggles International's conference presentation, Feb 25, 2004
Slide 1: Robert W. Baird Business Solutions Conference
TRUGGLES S & Robert W. Baird Business Solutions Conference February 25, 2004 EIDRICK H

Slide 2: Safe Harbor Statement
“anticipates,” and similar expressions. Forward- where we operate; price intangible assets; and “estimates,” “seeks,” Safe Harbor Statement “believes,” This presentation contains forward-looking statements. The forward-looking statements in which we operate and management’s beliefs and assumptions.

Slide 3: Business Overview
Business Overview
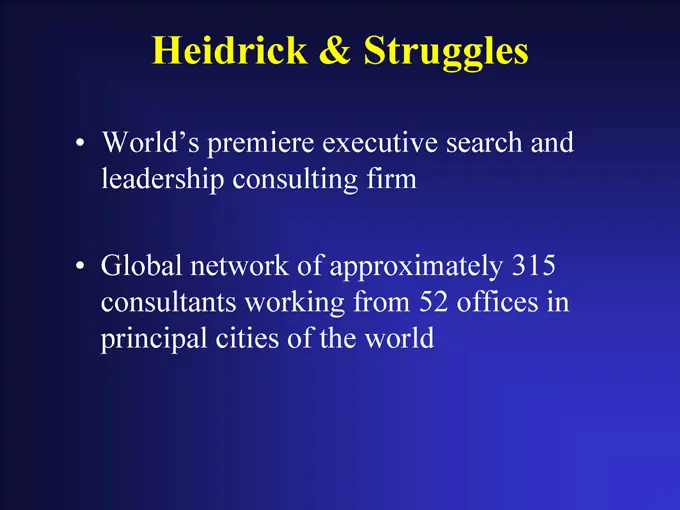
Slide 4: World's Premier Executive Search Firm
• and in 315 offices search 52 Struggles executive firm approximately from world & the consulting of working of Heidrick premiere network cities World’s leadership Global consultants principal •
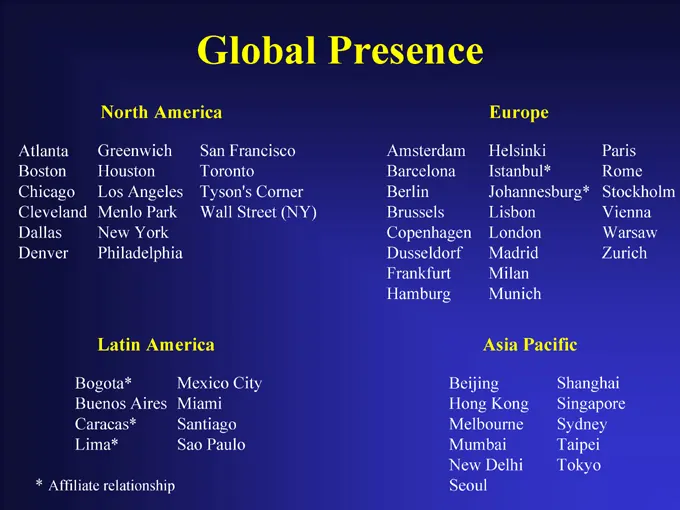
Slide 5: Global Presence
Paris Rome Stockholm Vienna Warsaw Zurich Shanghai Singapore Sydney Taipei Tokyo Europe Helsinki Istanbul* Johannesburg* Lisbon London Madrid Milan Munich Asia Pacific Beijing Hong Kong Melbourne Mumbai New Delhi Seoul Amsterdam Barcelona Berlin Brussels Copenhagen Dusseldorf Frankfurt Hamburg Globa
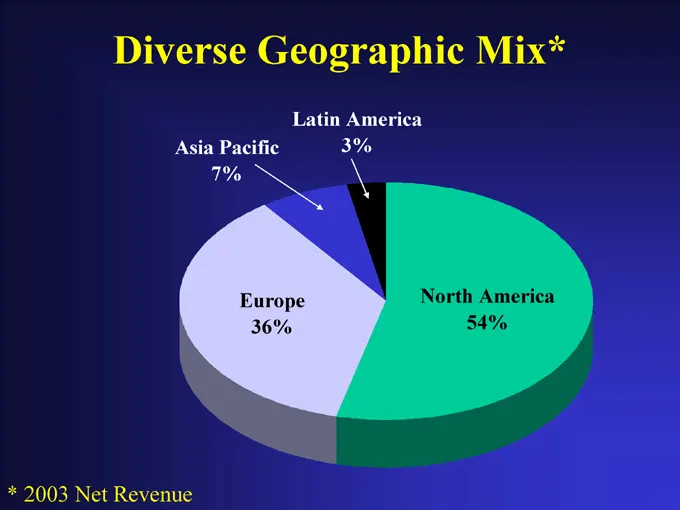
Slide 6: Diverse Geographic Mix
North America 54% Latin America 3% Europe 36% Diverse Geographic Mix* Asia Pacific 7% * 2003 Net Revenue
Slide 7: 2003 Industry Practice Mix
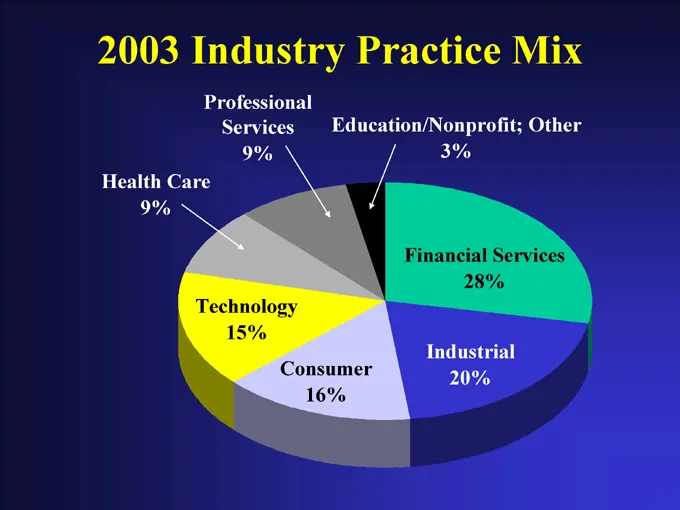
28% 20% Education/Nonprofit; Other 3% Financial Services Industrial Consumer 16% Professional Services 9% Technology 15% 2003 Industry Practice Mix Health Care 9%
Slide 8: World's Largest Search Firms
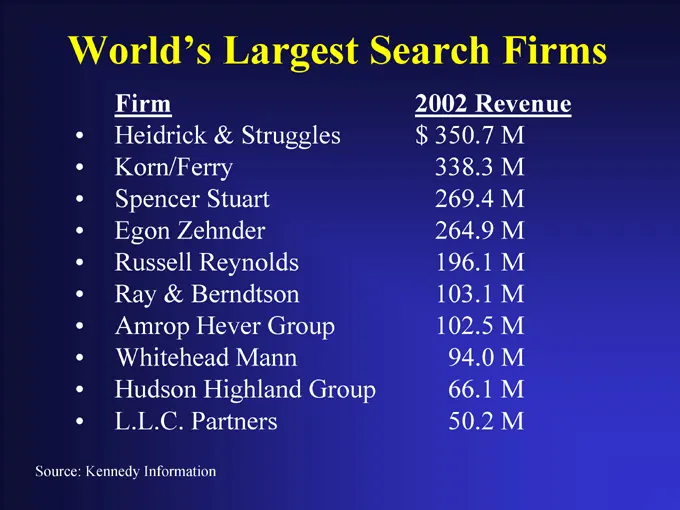
2002 Revenue $ 350.7 M 338.3 M 269.4 M 264.9 M 196.1 M 103.1 M 102.5 M 94.0 M 66.1 M 50.2 M Firm Heidrick & Struggles Korn/Ferry Spencer Stuart Egon Zehnder Russell Reynolds Ray & Berndtson Amrop Hever Group Whitehead Mann Hudson Highland Group L.L.C. Partners World’s Largest Search Firms • • • • •
Slide 9: Focus on Top-Level Services
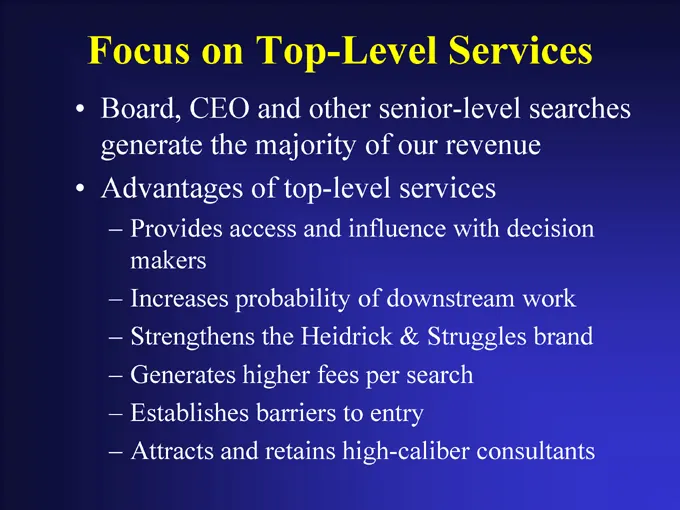
Provides access and influence with decision makers Increases probability of downstream work Strengthens the Heidrick & Struggles brand Generates higher fees per search Establishes barriers to entry Attracts and retains high-caliber consultants Focus on Top-Level Services Board, CEO and other senior-
Slide 10: Representative CEO/Board Searches in 2003
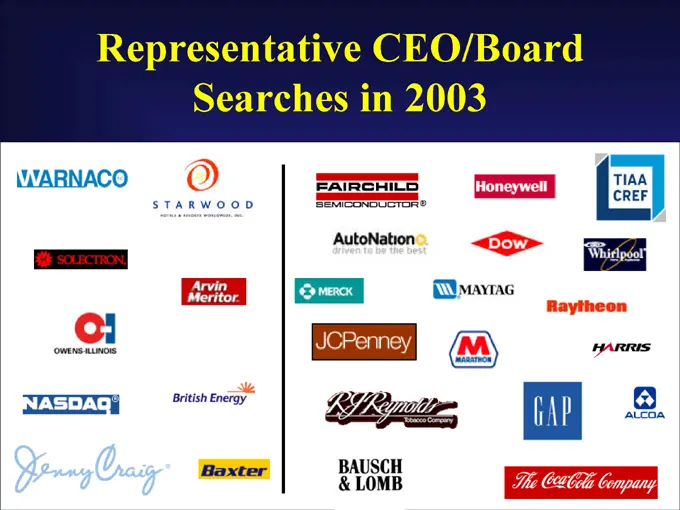
Representative CEO/Board Searches in 2003
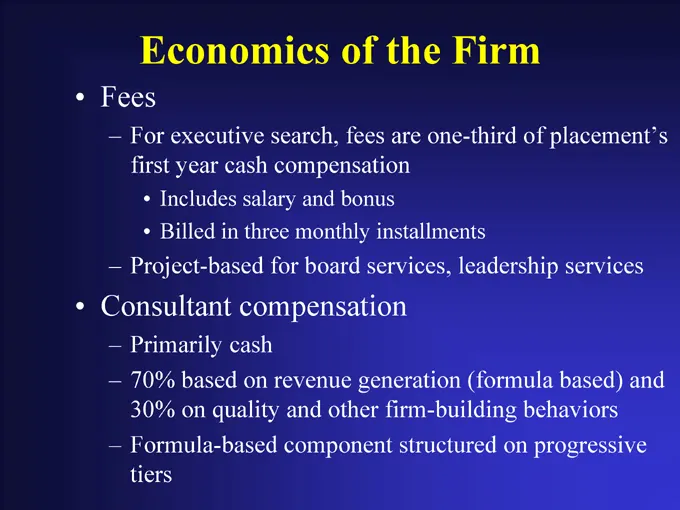
Slide 11: Economics of the Firm
Includes salary and bonus Billed in three monthly installments Economics of the Firm For executive search, fees are one-third of placement’s first year cash compensation • • Project-based for board services, leadership services Primarily cash 70% based on revenue generation (formula based) and 30% o

Slide 12: Heidrick & Struggles
TRUGGLES S & EIDRICK H
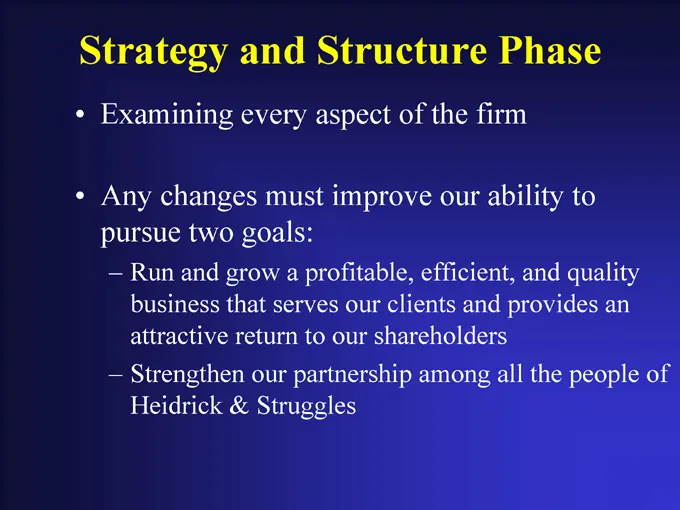
Slide 13: Strategy and Structure Phase
Run and grow a profitable, efficient, and quality business that serves our clients and provides an attractive return to our shareholders Strengthen our partnership among all the people of Heidrick & Struggles Strategy and Structure Phase Examining every aspect of the firm Any changes must improve ou
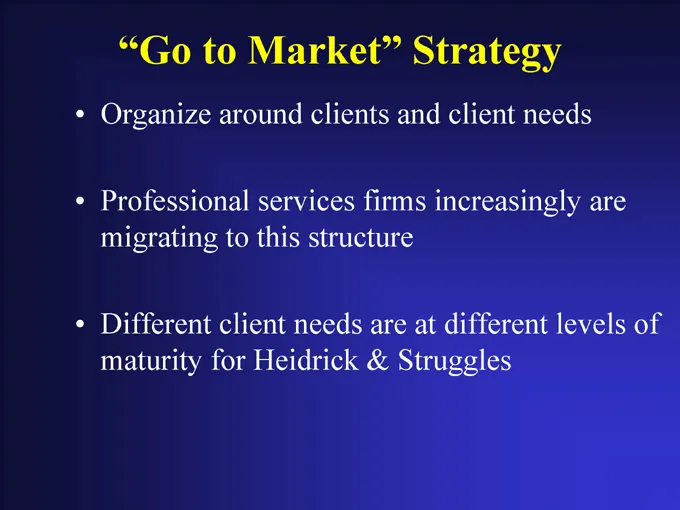
Slide 14: Organizing Around Client Needs
• of are levels needs client increasingly different Strategy and at Struggles clients firms structure are & services needs Market” this Heidrick around to client for • to • “Go Organize Professional migrating Different maturity • •
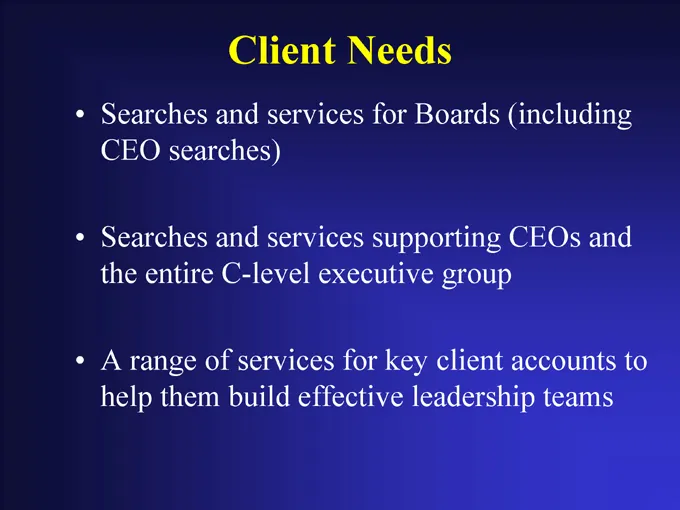
Slide 15: Client Leadership and Services
• to and accounts teams (including CEOs Boards group client leadership Needs for supporting key services services executive for effective Client and and C-level services build searches) of them entire range Searches CEO Searches the A help • •
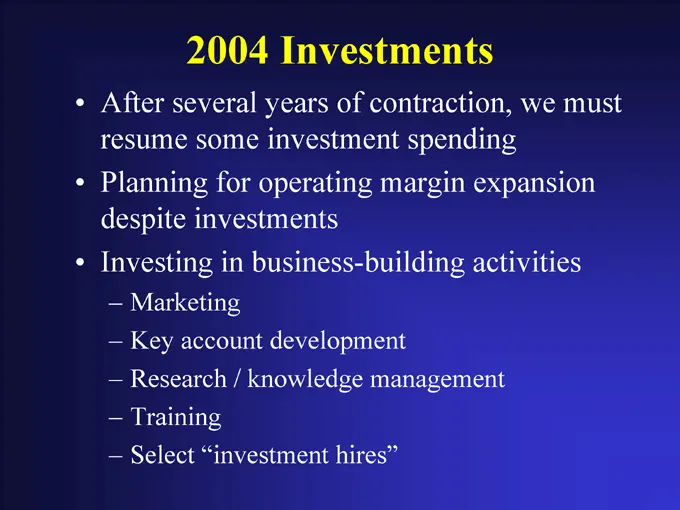
Slide 16: 2004 Investments
2004 Investments – Marketing Key account development Research / knowledge management Training Select “investment hires” After several years of contraction, we must resume some investment spending Planning for operating margin expansion despite investments Investing in business-building activities –
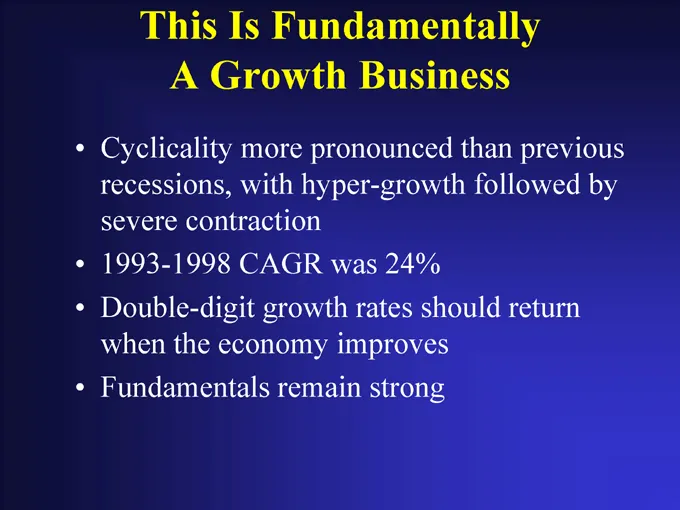
Slide 17: Industry Fundamentals and Cyclicality
• previous by followed return than should Business 24% strong rates improves Fundamentally pronounced hyper-growth was remain more with CAGR growth Is Growth contraction economy • This A the • Cyclicality recessions, severe 1993-1998 Double-digit when Fundamentals • • •
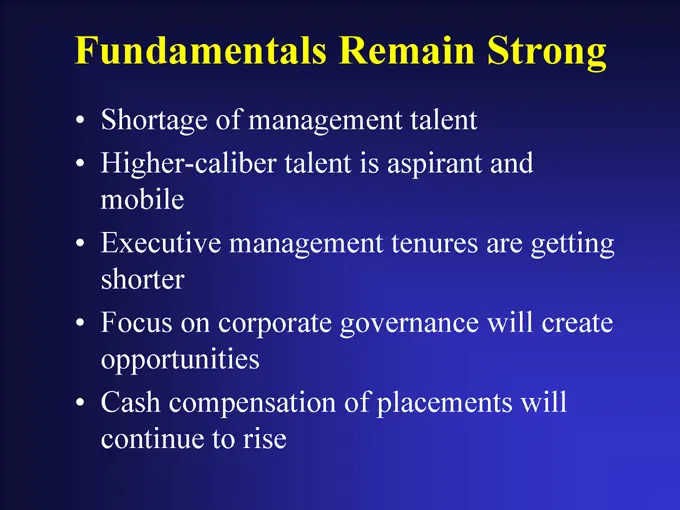
Slide 18: Fundamentals Remain Strong
• getting create will Strong and are will talent aspirant tenures placements Remain is governance of management talent management corporate rise of to on compensation Shortage Higher-caliber mobile Executive shorter Focus opportunities Cash continue • Fundamentals • • • •

Slide 19: Heidrick & Struggles
TRUGGLES S & EIDRICK H

Slide 20: Financial Performance
Financial Performance
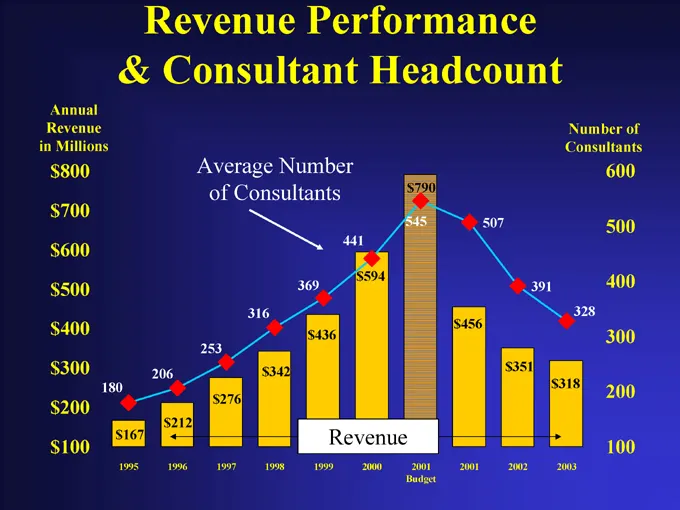
Slide 21: Revenue Performance & Consultant Headcount
600 500 400 300 200 Number of Consultants 328 $318 2003 391 $351 2002 $456 2001 $790 545 2001 Budget $594 2000 441 Revenue $436 1999 $342 1998 of Consultants $276 1997 Average Number 253 $212 1996 Revenue Performance 206 & Consultant Headcount $167 1995 Annual Revenue in Millions $800 $700 $600 $500
Slide 22: Realigned Cost Structure
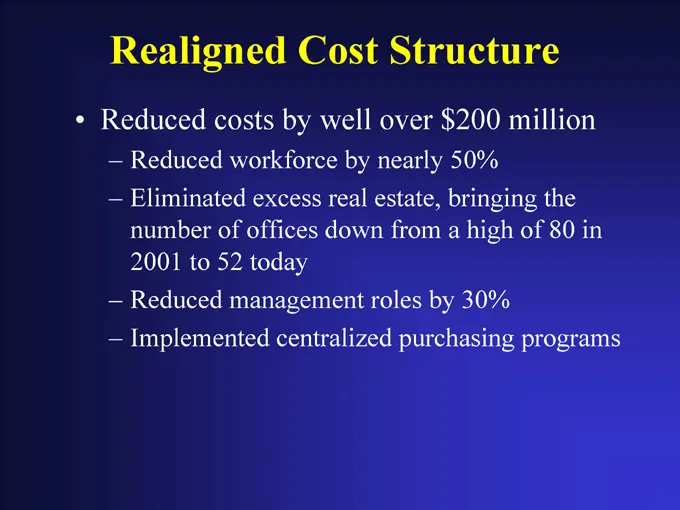
Realigned Cost Structure Reduced workforce by nearly 50% Eliminated excess real estate, bringing the number of offices down from a high of 80 in 2001 to 52 today Reduced management roles by 30% Implemented centralized purchasing programs Reduced costs by well over $200 million – – – –•
Slide 23: Pro Forma Financial Results
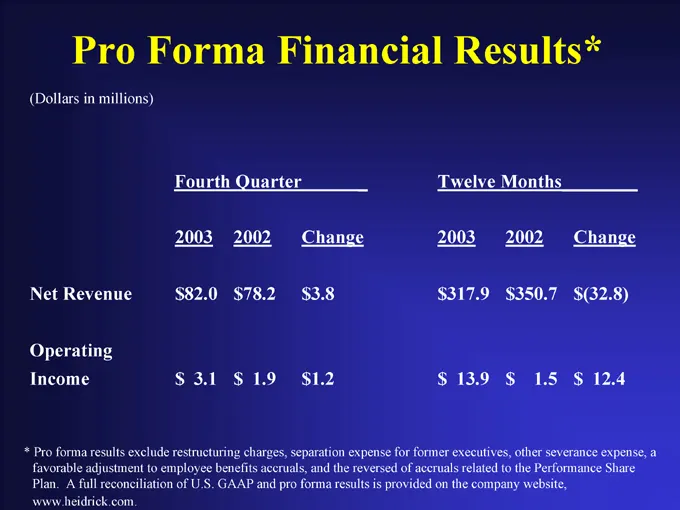
Change $(32.8) 12.4 $ 1.5 2002 $350.7 $ Twelve Months 2003 $317.9 13.9 $ _ Change $3.8 $1.2 2002 $78.2 1.9 $ 2003 $82.0 3.1 Pro Forma Financial Results* Fourth Quarter $ favorable adjustment to employee benefits accruals, and the reversed of accruals related to the Performance Share A full reconcili
Slide 24: Q4 2003 Non-Comparable Charges
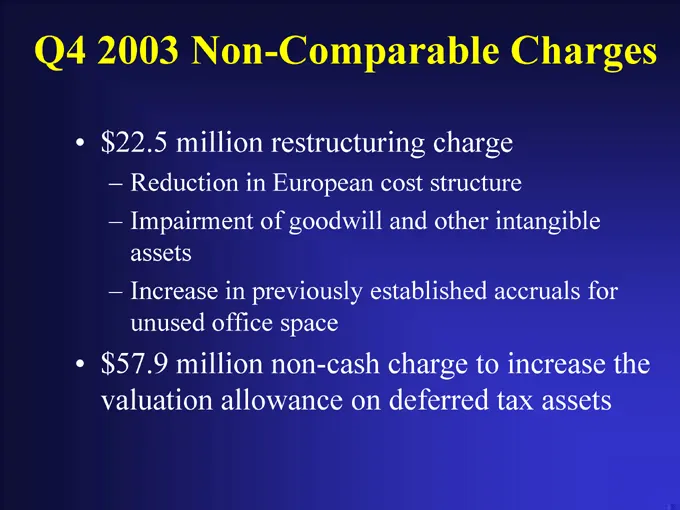
Reduction in European cost structure Impairment of goodwill and other intangible assets Increase in previously established accruals for unused office space $22.5 million restructuring charge – – – $57.9 million non-cash charge to increase the valuation allowance on deferred tax assets Q4 2003 Non-Co
Slide 25: Pro Forma Results by Geography
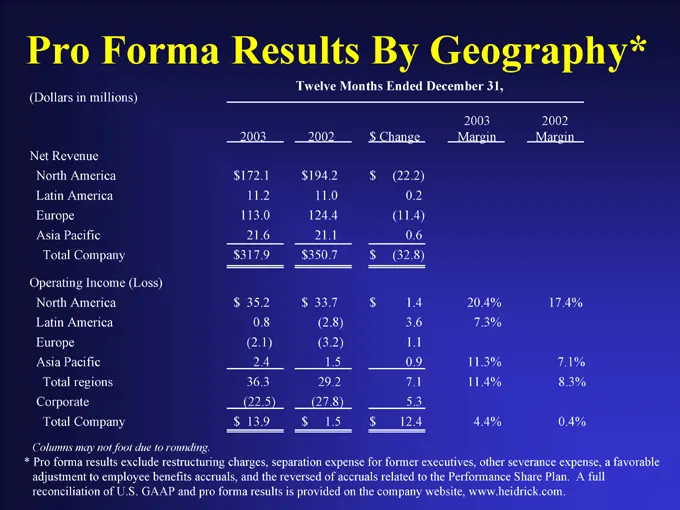
• favorable a full • 17.4% 7.1% 8.3% 0.4% expense, A 2002 Margin Plan. severance Share • 31, 20.4% 7.3% 11.3% 11.4% 4.4% other www.heidrick.com. • 2003 Margin Performance Geography* December executives, the website, • Ended (22.2) 0.2 (11.4) 0.6 (32.8) 1.4 3.6 1.1 0.9 7.1 5.3 12.4 to • By Change for
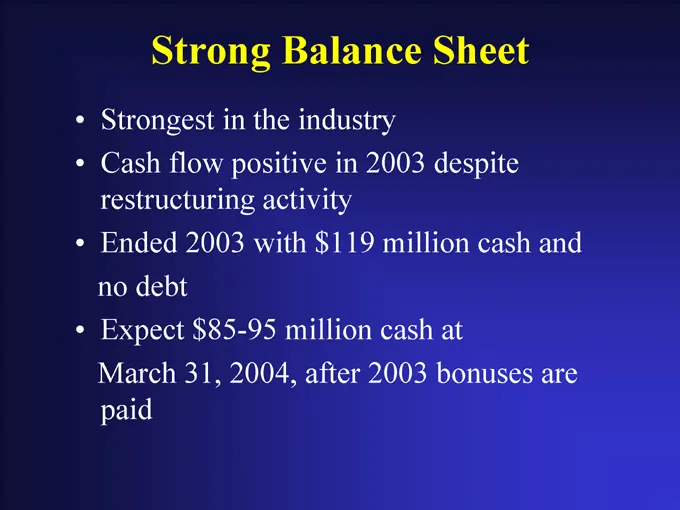
Slide 26: Strong Balance Sheet and Cash Flow
• and are cash Sheet despite million at bonuses 2003 cash 2003 Balance industry in activity $119 million after the positive with 2004, in 2003 $85-95 Strong flow 31, debt Strongest Cash restructuring Ended no Expect March paid • • •
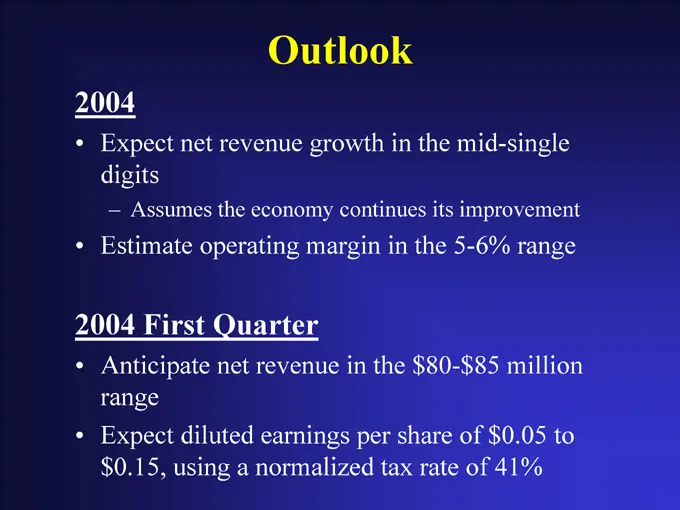
Slide 27: 2004 Outlook
Outlook Assumes the economy continues its improvement Expect net revenue growth in the mid-single digits – Estimate operating margin in the 5-6% range Anticipate net revenue in the $80-$85 million range Expect diluted earnings per share of $0.05 to $0.15, using a normalized tax rate of 41% 2004 • •
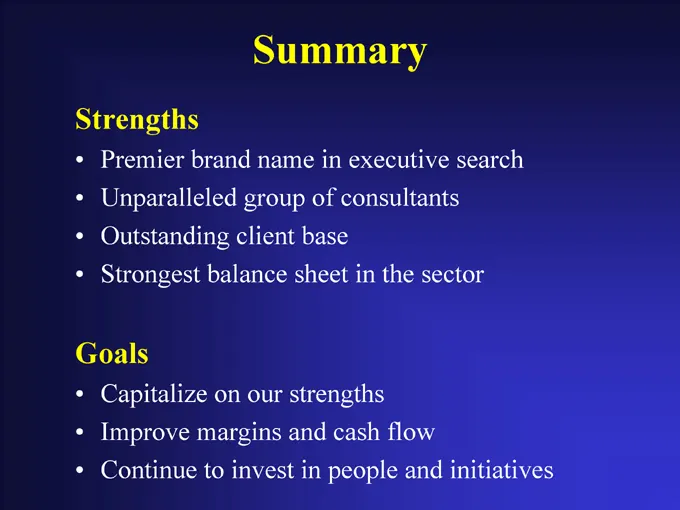
Slide 28: Summary
• search initiatives sector and the flow executive consultants in cash people in of base Summary name sheet strengths and in group client our invest balance on brand Unparalleled margins to Premier Outstanding Strongest Capitalize Improve Continue • Strengths • • • Goals • • •

Slide 29: Heidrick & Struggles
TRUGGLES S & EIDRICK H
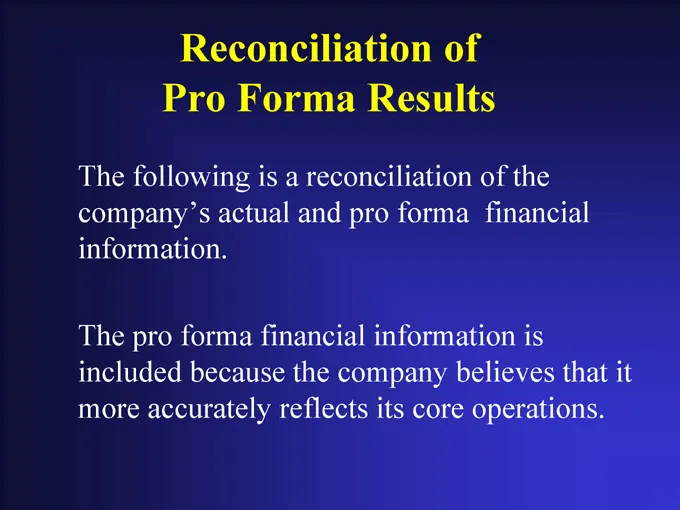
Slide 30: Reconciliation of Pro Forma Results
financial Reconciliation of Pro Forma Results company’s actual and pro forma The following is a reconciliation of the information. The pro forma financial information is included because the company believes that it more accurately reflects its core operations.
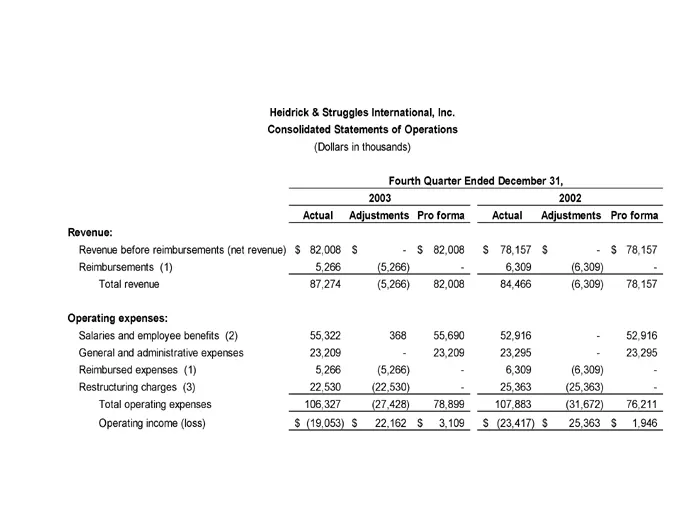
Slide 31: Consolidated Statements of Operations, Fourth Quarter
78,157—78,157 52,916 23,295—- 76,211 1,946 Pro forma $ $ - (6,309) (6,309) -—(6,309) (25,363) (31,672) 25,363 2002 Adjustments $ $ Actual 78,157 6,309 84,466 52,916 23,295 6,309 25,363 107,883 (23,417) $ $ 82,008—82,008 55,690 23,209—- 78,899 3,109 Pro forma $ $ Fourth Quarter Ended December 31, - (
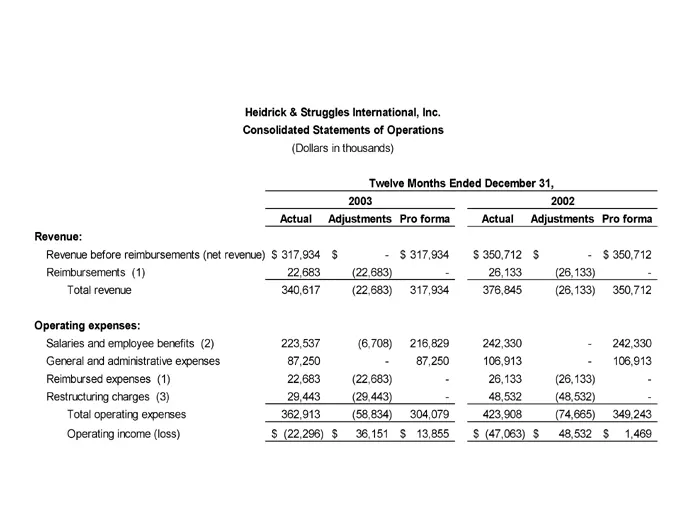
Slide 32: Consolidated Statements of Operations, Twelve Months
350,712—350,712 242,330 106,913—- 349,243 1,469 Pro forma $ $ - (26,133) (26,133) -—(26,133) (48,532) (74,665) 48,532 2002 Adjustments $ $ Actual 350,712 26,133 376,845 242,330 106,913 26,133 48,532 423,908 (47,063) $ $ 317,934—317,934 216,829 87,250—- 304,079 13,855 Pro forma $ $ Twelve Months Ende
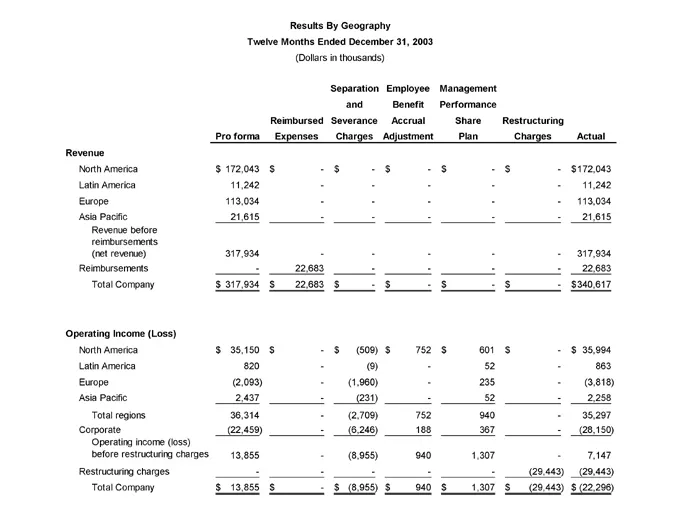
Slide 33: Results by Geography, Twelve Months 2003
Actual 172,043 11,242 113,034 21,615 317,934 22,683 340,617 35,994 863 (3,818) 2,258 35,297 (28,150) 7,147 (29,443) (22,296) $ $ $ $ - - -—- -—- -—-—-—- (29,443) (29,443) Charges Restructuring $ $ $ $ - -—- -—- 601 52 235 52 940 367 1,307—1,307 Share Plan Management Performance $ $ $ $ - -—- -—- 752
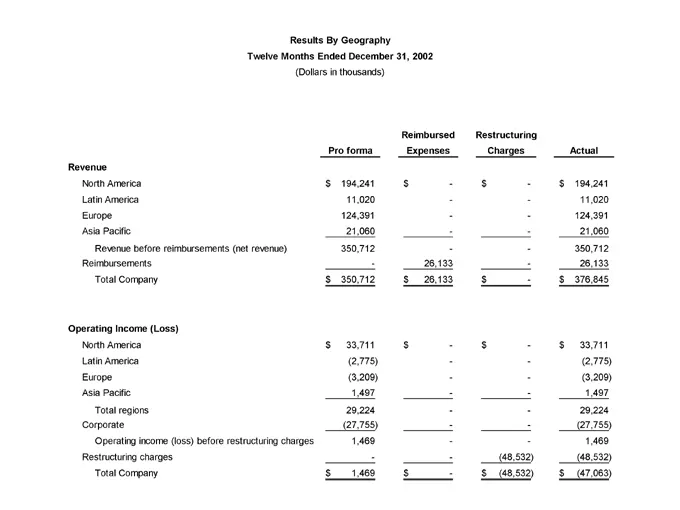
Slide 34: Results by Geography, Twelve Months 2002
Actual 194,241 11,020 124,391 21,060 350,712 26,133 376,845 33,711 (2,775) (3,209) 1,497 29,224 (27,755) 1,469 (48,532) (47,063) $ $ $ $ - - -—-—- - -—-—-—- (48,532) (48,532) Charges Restructuring $ $ $ $ - -—-—26,133 26,133 -—-—-—-—- Expenses Reimbursed $ $ $ $ - 1,497 1,469 - 1,469 11,020 21,060 3
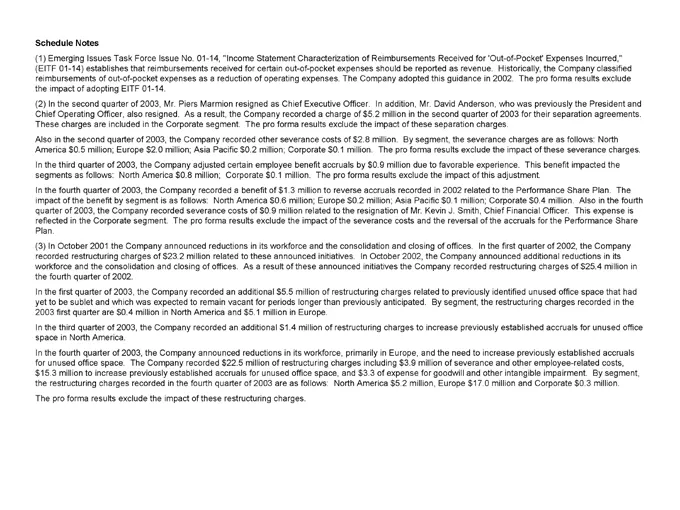
Slide 35: Notes to Pro Forma Adjustments
The Also in the fourth This expense is By segment, Historically, the Company classified The pro forma results exclude By segment, the severance charges are as follows: North impact of these severance charges. This benefit impacted the In the first quarter of 2002, the Company By segment, the restruc

Slide 36: Heidrick & Struggles
TRUGGLES S & EIDRICK H
Source: SEC EDGAR · 8-K filed Feb 25, 2004
More decks from Heidrick & Struggles International
 Q1 2025 Earnings Presentation20 slides · May 5, 2025
 Q4 2024 Earnings Presentation26 slides · Mar 3, 2025
 Investor Day (December 2024)68 slides · Dec 3, 2024
 Q3 2024 Earnings Presentation24 slides · Nov 4, 2024
 Q2 2024 Earnings Presentation25 slides · Jul 29, 2024
 Q1 2024 Earnings Presentation25 slides · May 6, 2024