EP Energy — Credit Suisse Energy Summit 2014
25 slides from EP Energy's conference presentation, Feb 10, 2014
Slide 1: Credit Suisse Energy Summit
Credit Suisse Energy Summit Brent Smolik President and Chief Executive Officer EP Energy Corporation February 11, 2014
Slide 2: Forward Looking Statements
Forward Looking Statements This February 11, 2014 presentation includes certain forward-looking statements and projections of EP Energy. We have made every reasonable effort to ensure that the information and assumptions on which these statements and projections are based are current, reasonable, an
Slide 3: Cautionary Note Regarding Hydrocarbon Quantities
Cautionary Note Regarding Hydrocarbon Quantities EP Energy has provided internally generated estimates for proved reserves in this February 11, 2014 presentation in accordance with SEC guidelines and definitions. Unless otherwise noted, reserve estimates are as of December 31, 2013, assuming SEC pri
Slide 4: Successful history in resource plays
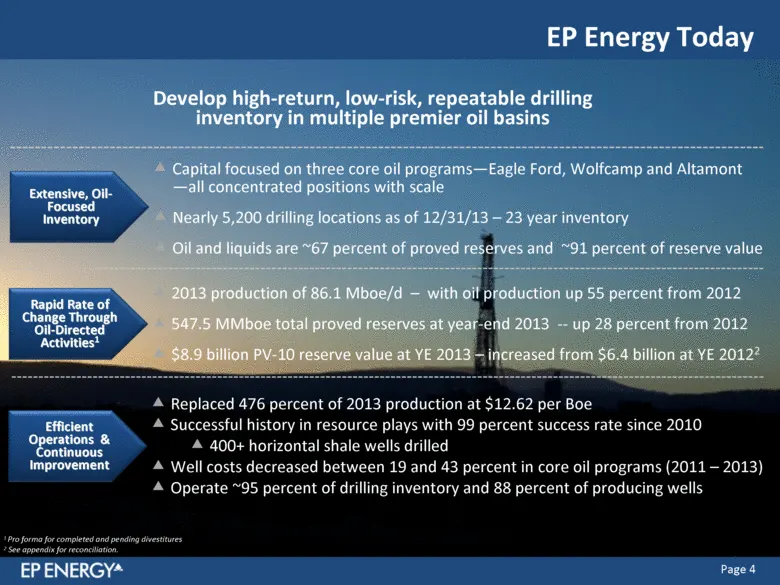
Replaced 476 percent of 2013 production at $12.62 per Boe Successful history in resource plays with 99 percent success rate since 2010 400+ horizontal shale wells drilled Well costs decreased between 19 and 43 percent in core oil programs (2011 – 2013) Operate ~95 percent of drilling inventory and 8
Slide 5: Narrow Focus in Premier Basins – Large Scale for Efficient Operations
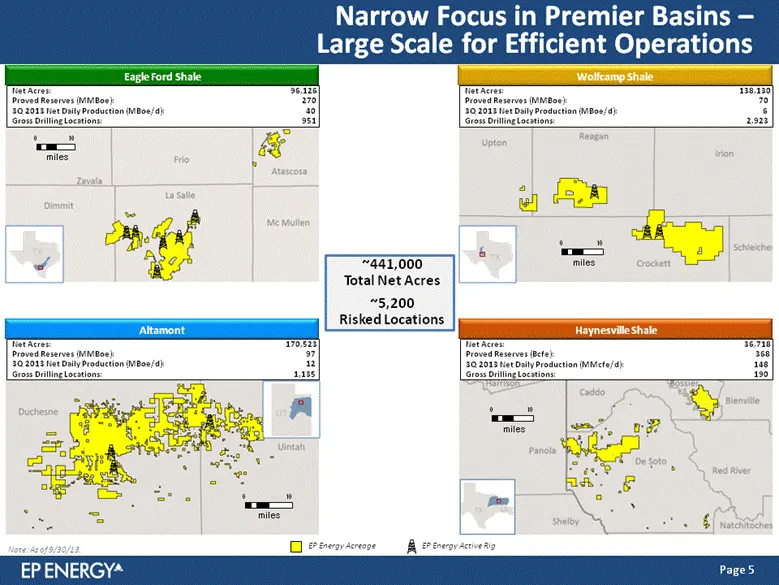
Narrow Focus in Premier Basins – Large Scale for Efficient Operations EP Energy Acreage EP Energy Active Rig Note: As of 9/30/13. ~441,000 Total Net Acres ~5,200 Risked Locations TX Eagle Ford Shale Net Acres: 96,126 Proved Reserves (MMBoe): 270 3Q 2013 Net Daily Production (MBoe/d): 40 Gross Drilli
Slide 6: Significant Value Uplift From Growing Reserve Base
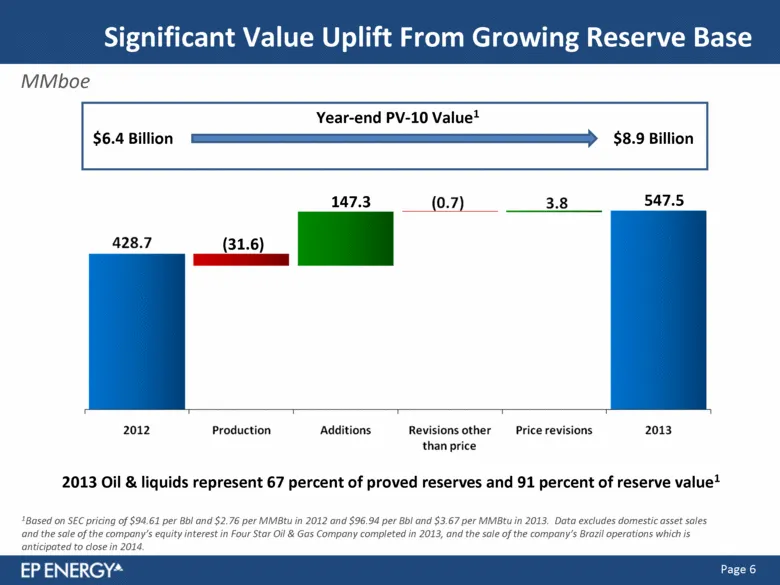
Significant Value Uplift From Growing Reserve Base 1Based on SEC pricing of $94.61 per Bbl and $2.76 per MMBtu in 2012 and $96.94 per Bbl and $3.67 per MMBtu in 2013. Data excludes domestic asset sales and the sale of the company’s equity interest in Four Star Oil & Gas Company completed in 2013, an
Slide 7: A New High Growth Company
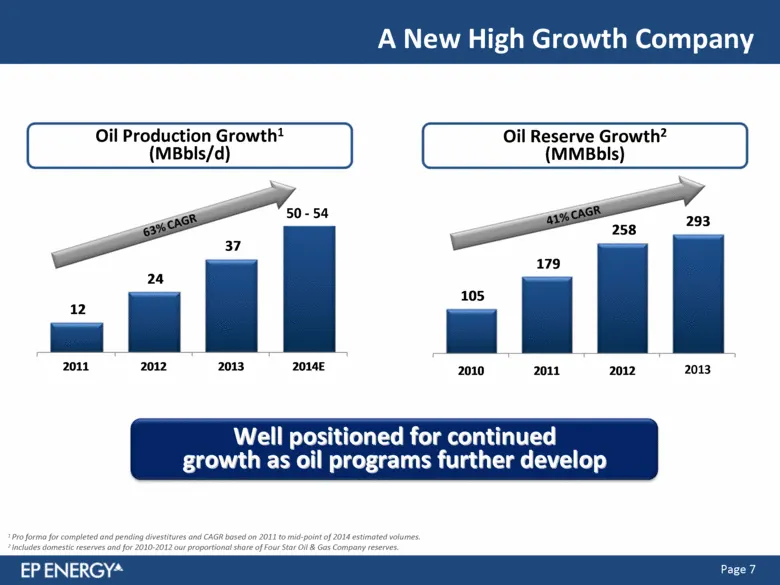
A New High Growth Company 1 Pro forma for completed and pending divestitures and CAGR based on 2011 to mid-point of 2014 estimated volumes. 2 Includes domestic reserves and for 2010-2012 our proportional share of Four Star Oil & Gas Company reserves. Oil Production Growth1 (MBbls/d) Oil Reserve Grow
Slide 8: Outstanding Execution and Cost Reduction
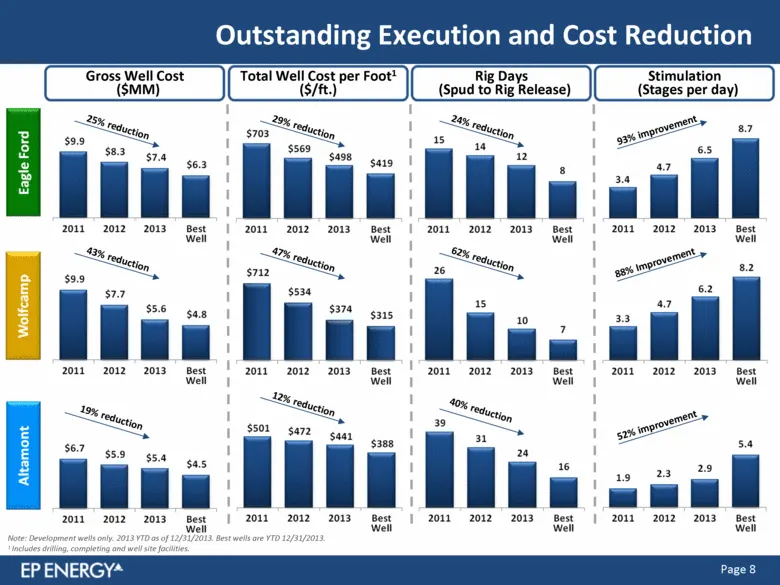
Outstanding Execution and Cost Reduction Note: Development wells only. 2013 YTD as of 12/31/2013. Best wells are YTD 12/31/2013. 1 Includes drilling, completing and well site facilities. Gross Well Cost ($MM) 19% reduction Rig Days (Spud to Rig Release) 62% reduction 40% reduction 24% reduction Stim
Slide 9: High-Quality, Concentrated Asset Portfolio
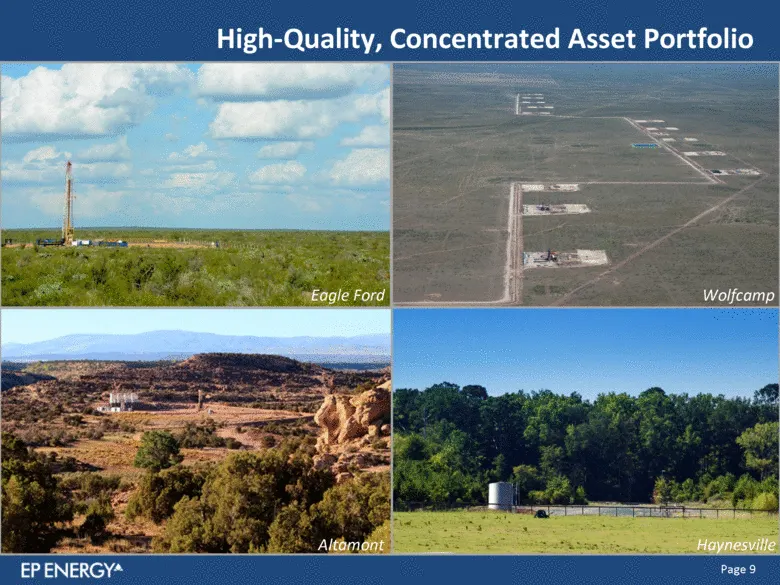
High-Quality, Concentrated Asset Portfolio Wolfcamp Altamont Eagle Ford Haynesville
Slide 10: Eagle Ford – World Class Core Position In Volatile Oil Window
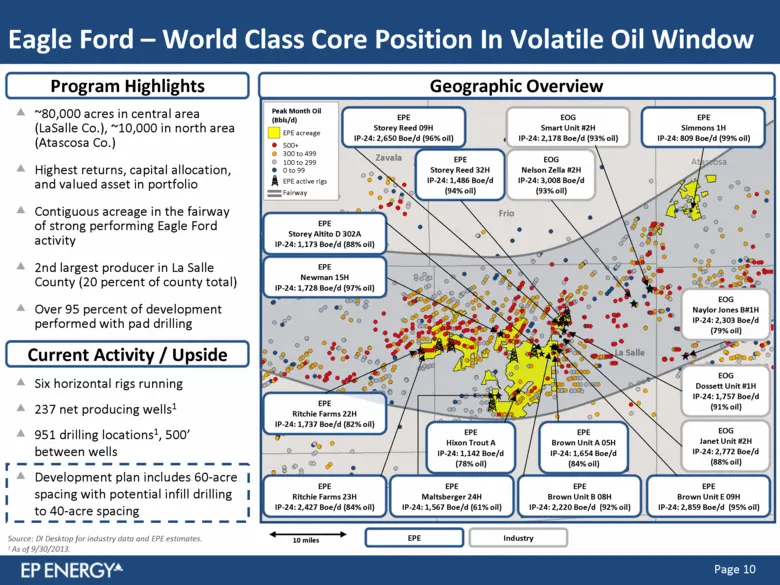
Program Highlights Eagle Ford – World Class Core Position In Volatile Oil Window ~80,000 acres in central area (LaSalle Co.), ~10,000 in north area (Atascosa Co.) Highest returns, capital allocation, and valued asset in portfolio Contiguous acreage in the fairway of strong performing Eagle Ford acti
Slide 11: Eagle Ford - Rapidly Improving Rates and EURs
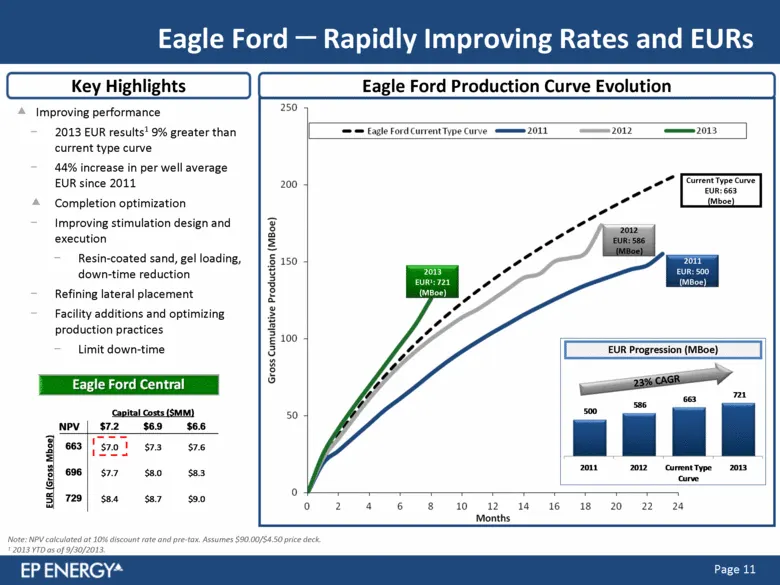
Key Highlights Eagle Ford Production Curve Evolution Eagle Ford - Rapidly Improving Rates and EURs Improving performance 2013 EUR results1 9% greater than current type curve 44% increase in per well average EUR since 2011 Completion optimization Improving stimulation design and execution Resin-coate
Slide 12: Wolfcamp – Derisked Oil Position
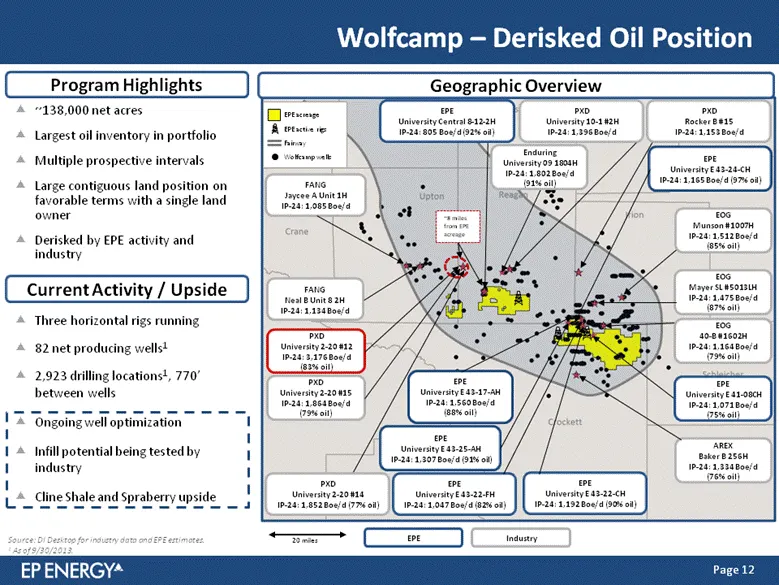
Program Highlights ~138,000 net acres Largest oil inventory in portfolio Multiple prospective intervals Large contiguous land position on favorable terms with a single land owner Derisked by EPE activity and industry Wolfcamp – Derisked Oil Position Current Activity / Upside Three horizontal rigs ru
Slide 13: Wolfcamp – Bullseye of the Southern Midland Basin
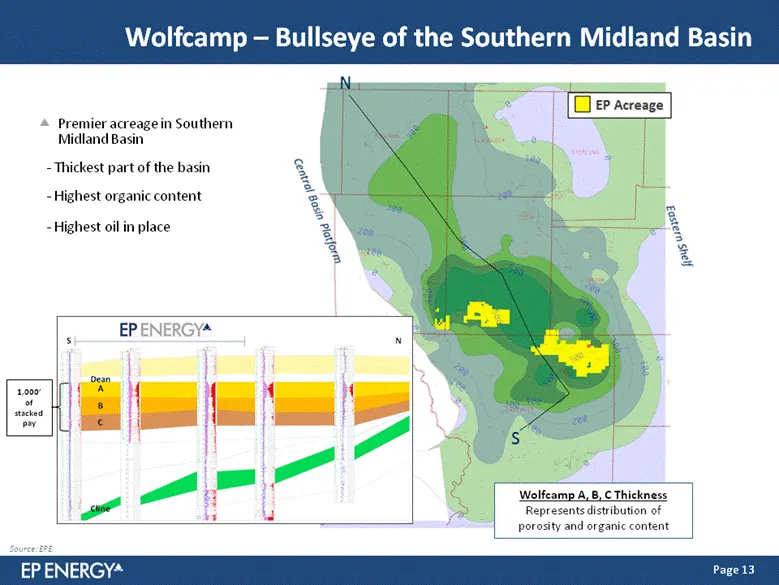
Wolfcamp – Bullseye of the Southern Midland Basin Premier acreage in Southern Midland Basin - Thickest part of the basin - Highest organic content - Highest oil in place Wolfcamp A, B, C Thickness Represents distribution of porosity and organic content 1,000’ of stacked pay Source: EPE.
Slide 14: Altamont – EPE in Unique Geology
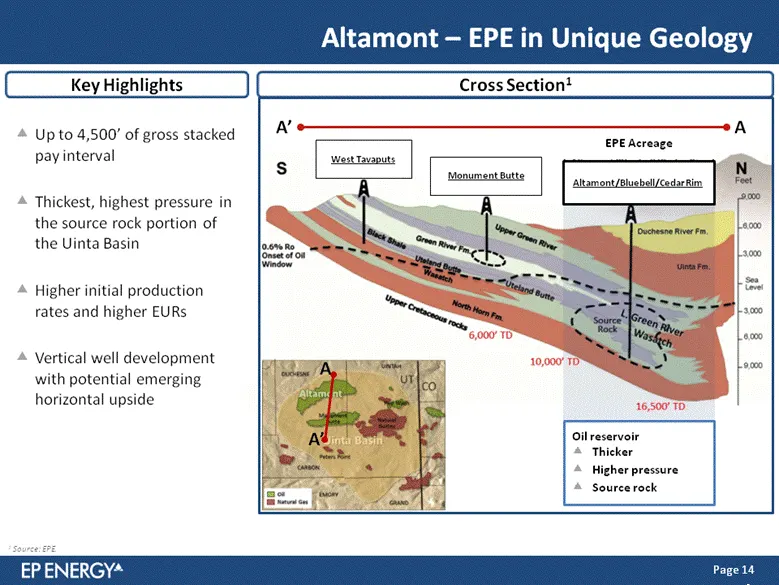
Up to 4,500’ of gross stacked pay interval Thickest, highest pressure in the source rock portion of the Uinta Basin Higher initial production rates and higher EURs Vertical well development with potential emerging horizontal upside Altamont – EPE in Unique Geology Cross Section1 Key Highlights Altam
Slide 15: Altamont – Advantaged Position in Basin
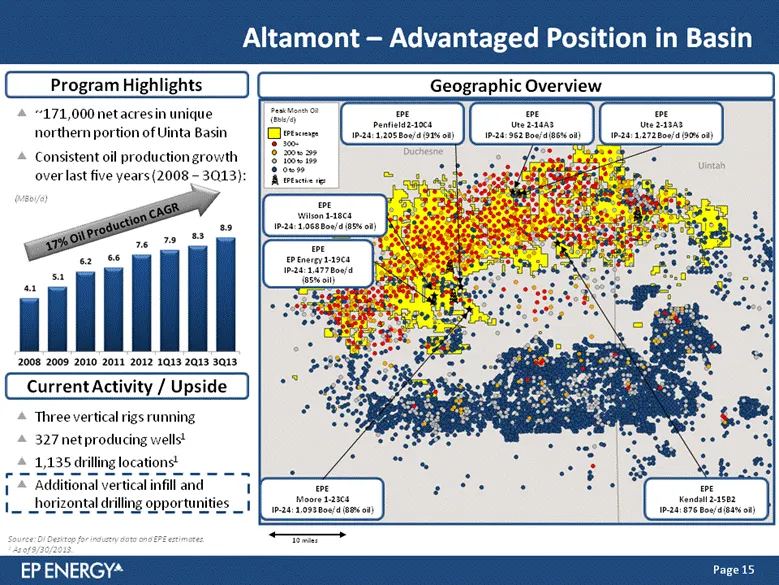
~171,000 net acres in unique northern portion of Uinta Basin Consistent oil production growth over last five years (2008 - 3Q13): Program Highlights Altamont – Advantaged Position in Basin Current Activity / Upside Three vertical rigs running 327 net producing wells1 1,135 drilling locations1 Additi
Slide 16: Altamont – Growing Oil Market Infrastructure
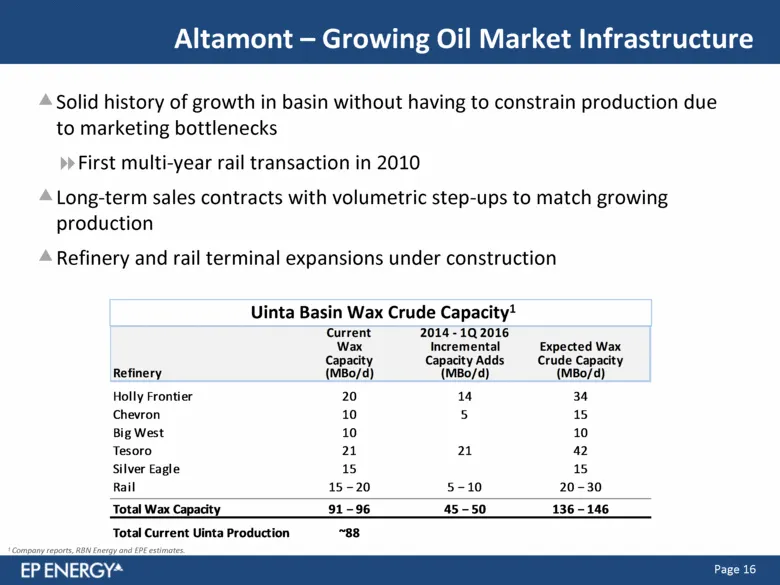
Solid history of growth in basin without having to constrain production due to marketing bottlenecks First multi-year rail transaction in 2010 Long-term sales contracts with volumetric step-ups to match growing production Refinery and rail terminal expansions under construction Altamont – Growing Oi
Slide 17: Significant Upside Potential Across Portfolio
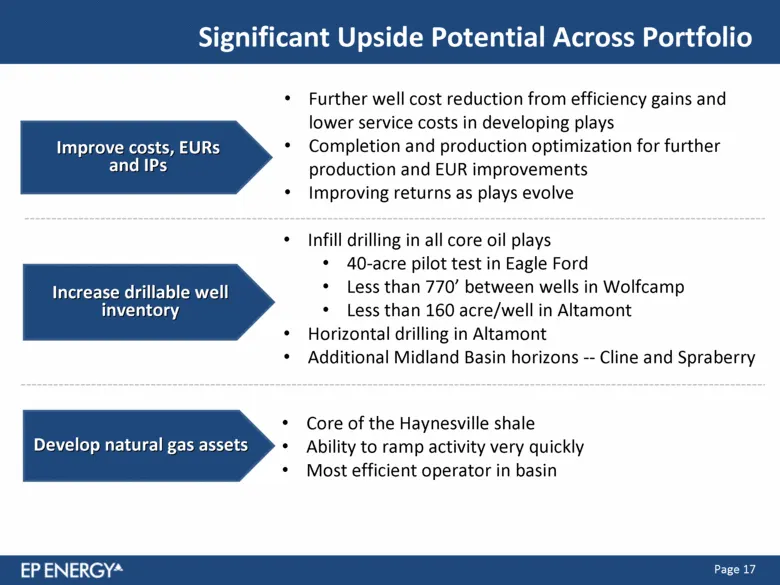
Significant Upside Potential Across Portfolio Further well cost reduction from efficiency gains and lower service costs in developing plays Completion and production optimization for further production and EUR improvements Improving returns as plays evolve Infill drilling in all core oil plays 40-ac
Slide 18: Returns Focused Capital Allocation
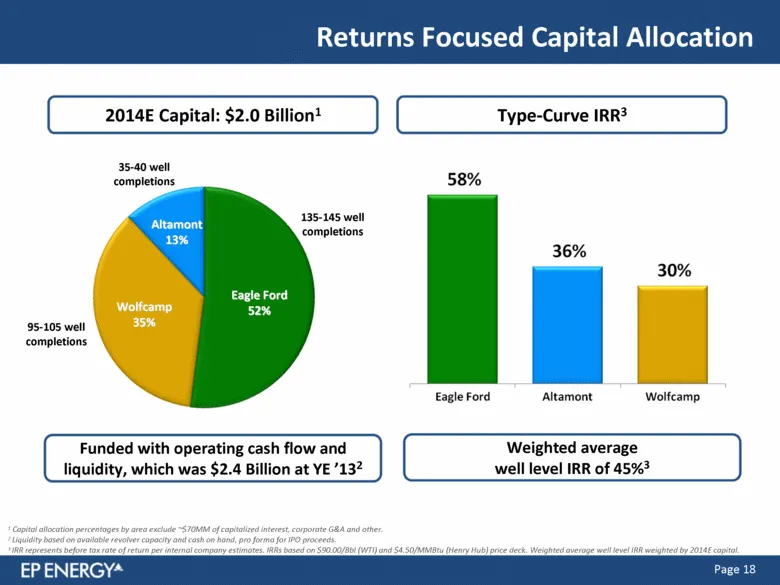
Returns Focused Capital Allocation 1 Capital allocation percentages by area exclude ~$70MM of capitalized interest, corporate G&A and other. 2 Liquidity based on available revolver capacity and cash on hand, pro forma for IPO proceeds. 3 IRR represents before tax rate of return per internal company
Slide 19: Dynamic Hedge Program
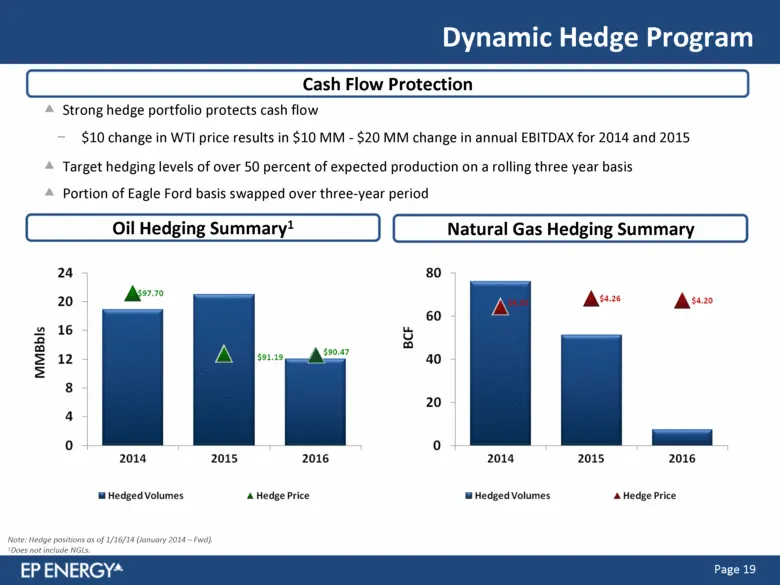
Dynamic Hedge Program Natural Gas Hedging Summary Cash Flow Protection Oil Hedging Summary1 Strong hedge portfolio protects cash flow $10 change in WTI price results in $10 MM - $20 MM change in annual EBITDAX for 2014 and 2015 Target hedging levels of over 50 percent of expected production on a rol
Slide 20: Exciting Growth in 2014
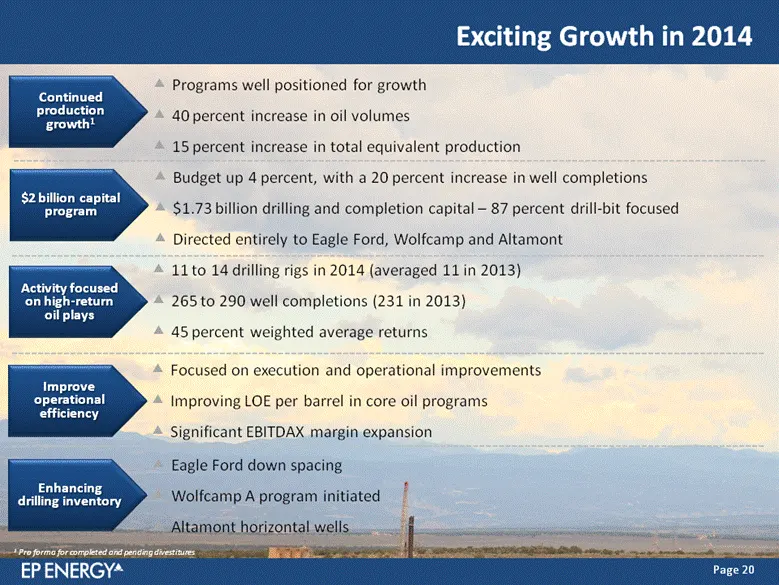
Focused on execution and operational improvements Improving LOE per barrel in core oil programs Significant EBITDAX margin expansion Improve operational efficiency Budget up 4 percent, with a 20 percent increase in well completions $1.73 billion drilling and completion capital – 87 percent drill-bit
Slide 21: Credit Suisse Energy Summit
Credit Suisse Energy Summit Brent Smolik President and Chief Executive Officer EP Energy Corporation February 2014
Slide 22: Appendix
Appendix gs -s EP ENERGY“
Slide 23: Non-GAAP Disclosures
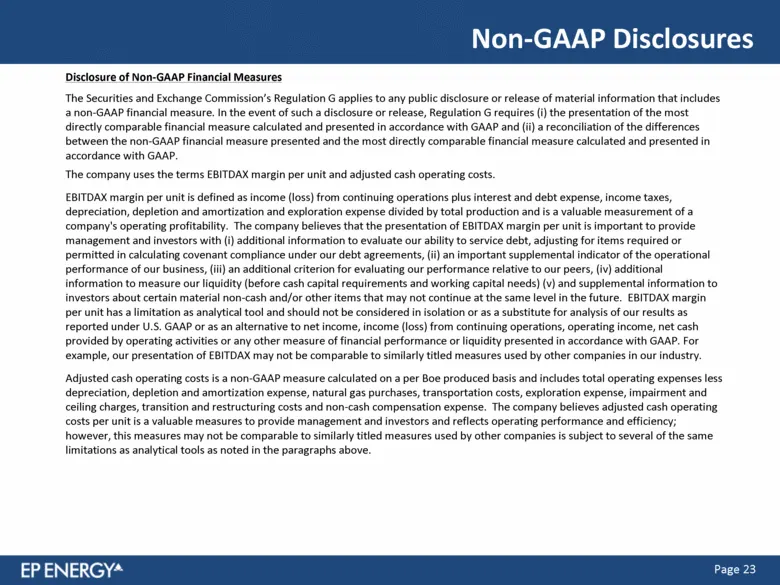
Non-GAAP Disclosures Disclosure of Non-GAAP Financial Measures The Securities and Exchange Commission’s Regulation G applies to any public disclosure or release of material information that includes a non-GAAP financial measure. In the event of such a disclosure or release, Regulation G requires (i)
Slide 24: PV-10 Reconciliation
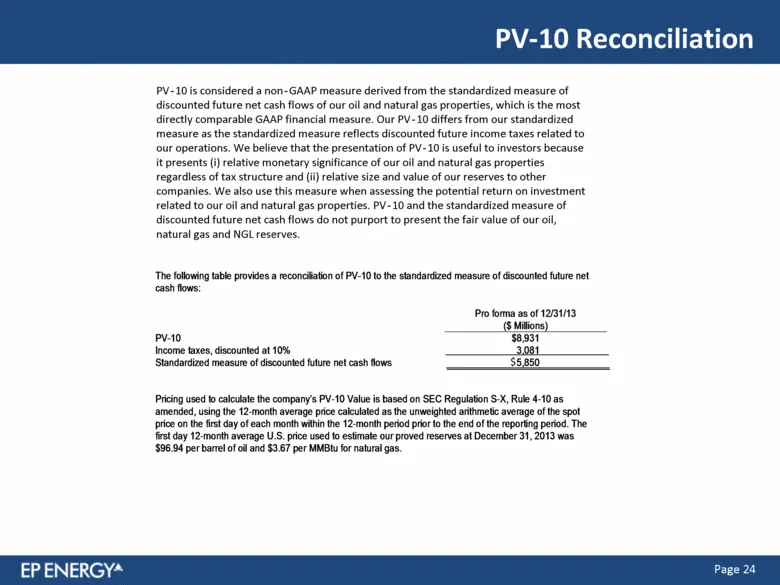
PV-10 Reconciliation PV-10 is considered a non-GAAP measure derived from the standardized measure of discounted future net cash flows of our oil and natural gas properties, which is the most directly comparable GAAP financial measure. Our PV-10 differs from our standardized measure as the standardiz
Slide 25: 2014 Outlook Summary
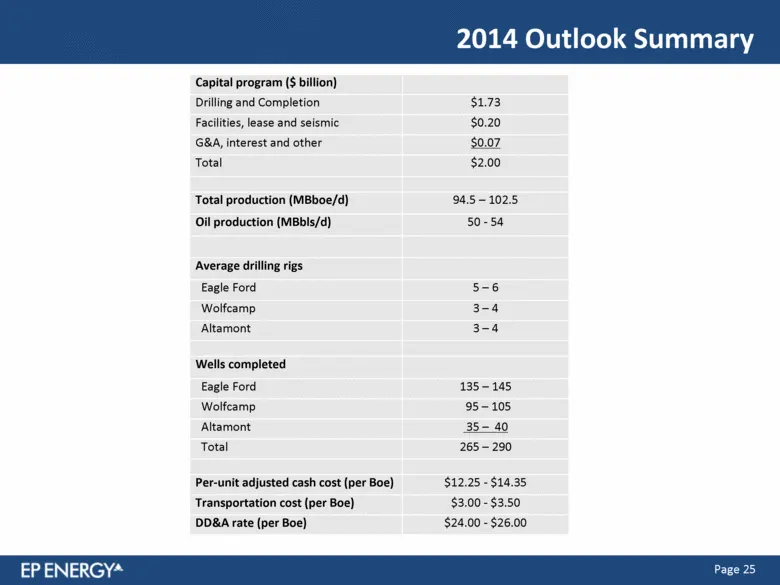
2014 Outlook Summary Capital program ($ billion) Drilling and Completion $1.73 Facilities, lease and seismic $0.20 G&A, interest and other $0.07 Total $2.00 Total production (MBboe/d) 94.5 – 102.5 Oil production (MBbls/d) 50 - 54 Average drilling rigs Eagle Ford 5 – 6 Wolfcamp 3 – 4 Altamont 3 – 4 W
Source: SEC EDGAR · 8-K filed Feb 10, 2014
More decks from EP Energy Corp
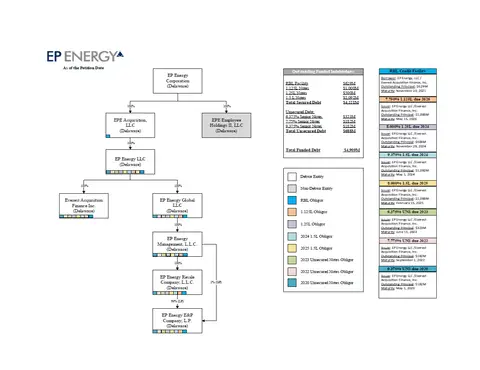 Presentation (January 2020)6 slides · Jan 9, 2020
 Investor Presentation (October 2019)83 slides · Oct 4, 2019
 IPO Roadshow (October 2019)5 slides · Oct 4, 2019
 Investor Presentation (September 2018)11 slides · Sep 5, 2018
 Debt Investor Presentation (May 2018)25 slides · May 17, 2018
 Credit Suisse Energy Summit 201724 slides · Feb 14, 2017