Vertex Energy — Q1 2022 Earnings Presentation
26 slides from Vertex Energy's earnings presentation, May 10, 2022
Slide 1: Investor Presentation May 2022
INVESTOR PRESENTATION May 2022
Slide 2: Disclaimer
DISCLAIMER Certain of the matters discussed in this presentation which are not statements of historical fact constitute forward - looking statements within the meaning of the federal securities laws, including the Private Securities Litigation Reform Act of 1995 , that involve a number of risks and
Slide 3: Disclaimer
DISCLAIMER In addition to our results calculated under generally accepted accounting principles in the United States ("GAAP"), in this presentation we also present Free Cash Flow, EBITDA and Adjusted EBITDA and Adjusted net income . Free Cash Flow, EBITDA and Adjusted EBITDA and Adjusted net income
Slide 4: First Quarter 2022 Results Summary
FIRST QUARTER 2022 Results Summary
Slide 5: About Vertex
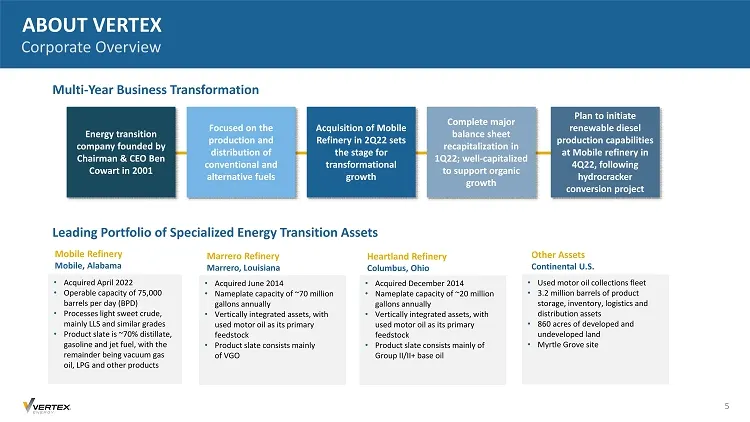
ABOUT VERTEX 5 Multi - Year Business Transformation Mobile Refinery Mobile, Alabama Marrero Refinery Marrero, Louisiana Heartland Refinery Columbus, Ohio • Acquired April 2022 • Operable capacity of 75,000 barrels per day (BPD) • Processes light sweet crude, mainly LLS and similar grades • Product s
Slide 6: Our Strategic Focus
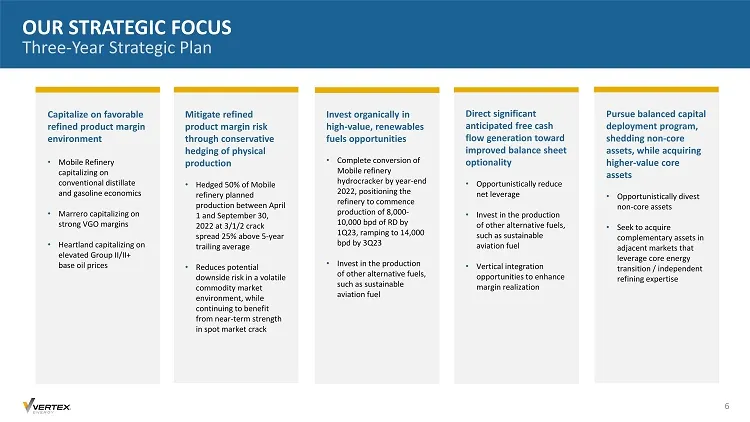
OUR STRATEGIC FOCUS 6 Capitalize on favorable refined product margin environment • Mobile Refinery capitalizing on conventional distillate and gasoline economics • Marrero capitalizing on strong VGO margins • Heartland capitalizing on elevated Group II/II+ base oil prices Mitigate refined product ma
Slide 7: Executive Summary
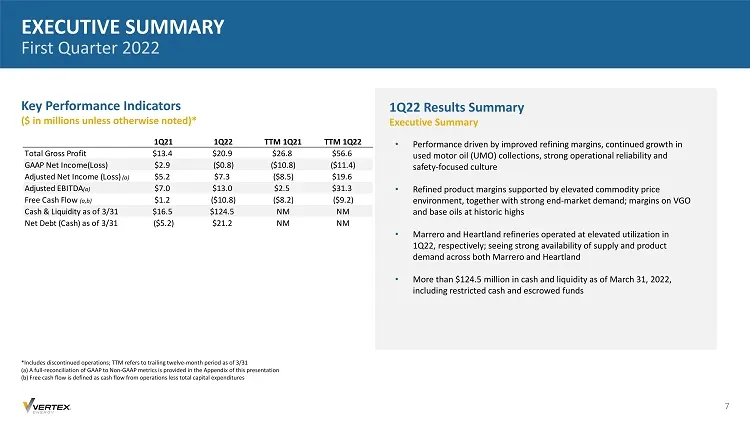
EXECUTIVE SUMMARY Strategic Milestones • Performance driven by improved refining margins, continued growth in used motor oil (UMO) collections, strong operational reliability and safety - focused culture • Refined product margins supported by elevated commodity price environment, together with stron
Slide 8: Financial Performance Bridge
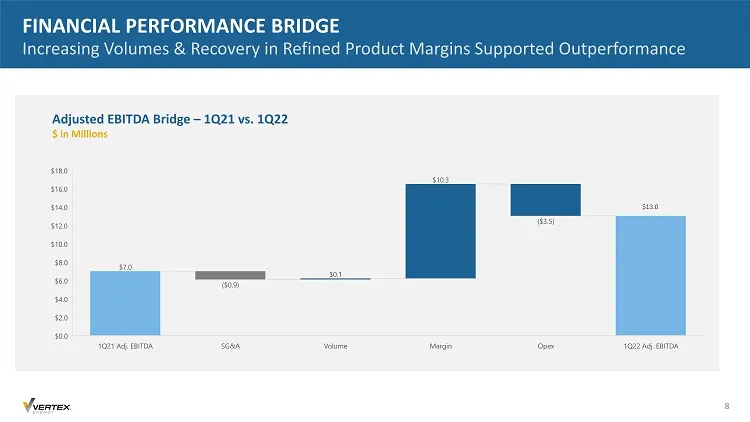
FINANCIAL PERFORMANCE BRIDGE $13.0 Adjusted EBITDA Bridge – 1Q21 vs. 1Q22 $ in Millions 8 $13.0
Slide 9: Balance Sheet Update
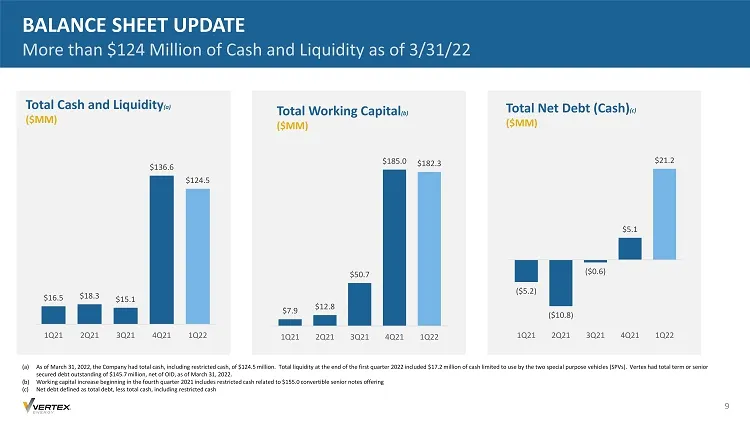
BALANCE SHEET UPDATE Total Cash and Liquidity (a) ($MM) Total Net Debt (Cash) (c) ($MM) 9 Total Working Capital (b) ($MM) $7.9 $12.8 $50.7 $185.0 $182.3 1Q21 2Q21 3Q21 4Q21 1Q22 (a) As of March 31, 2022, the Company had total cash, including restricted cash, of $124.5 million. Total liquidity at the
Slide 10: Mobile Refinery Overview
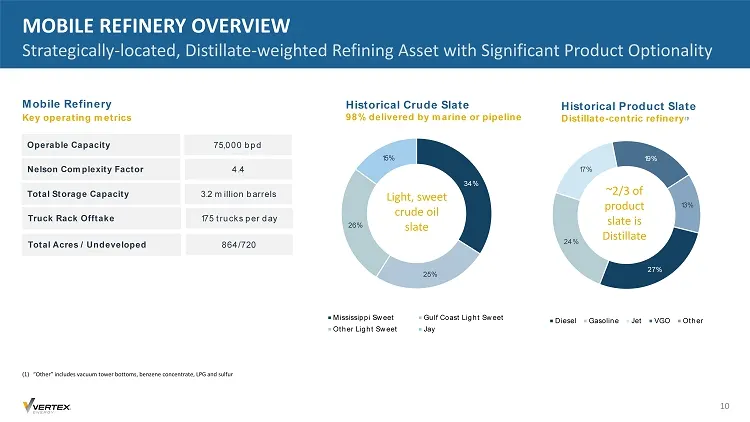
MOBILE REFINERY OVERVIEW 75,000 bpd Operable Capacity Mobile Refinery Key operating metrics 4.4 Nelson Complexity Factor 3.2 million barrels Total Storage Capacity 175 trucks per day Truck Rack Offtake 864/720 Total Acres / Undeveloped (1) “Other” includes vacuum tower bottoms, benzene concentrate,
Slide 11: Mobile Refinery Has Substantial Competitive Advantages
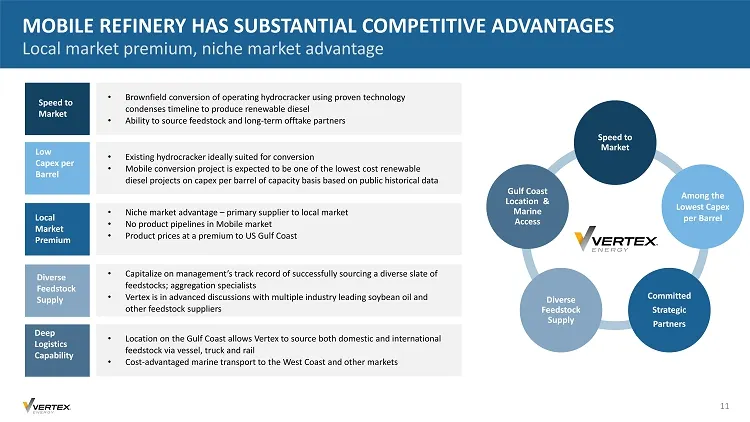
MOBILE REFINERY HAS SUBSTANTIAL COMPETITIVE ADVANTAGES Speed to Market • Brownfield conversion of operating hydrocracker using proven technology condenses timeline to produce renewable diesel • Ability to source feedstock and long - term offtake partners Low Capex per Barrel • Existing hydrocracker
Slide 12: Mobile Refinery Renewable Diesel Project
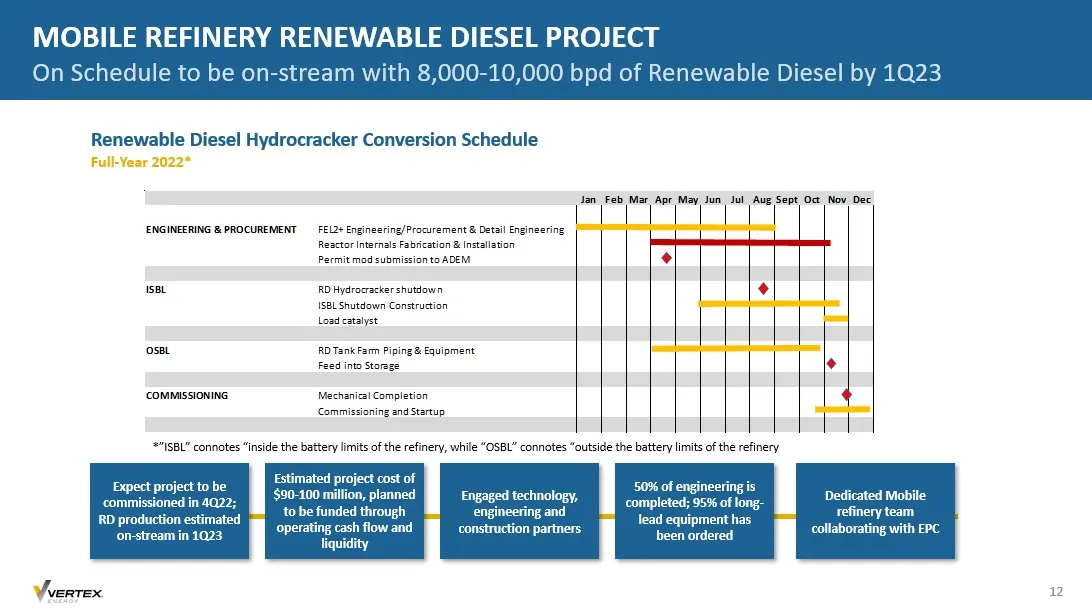
MOBILE REFINERY RENEWABLE DIESEL PROJECT 12 Renewable Diesel Hydrocracker Conversion Schedule Full - Year 2022* Jan Feb Mar Apr May Jun Jul AugSept Oct Nov Dec ENGINEERING & PROCUREMENT FEL2+ Engineering/Procurement & Detail Engineering Reactor Internals Fabrication & Installation Permit mod submiss
Slide 13: Mobile Refinery Outlook
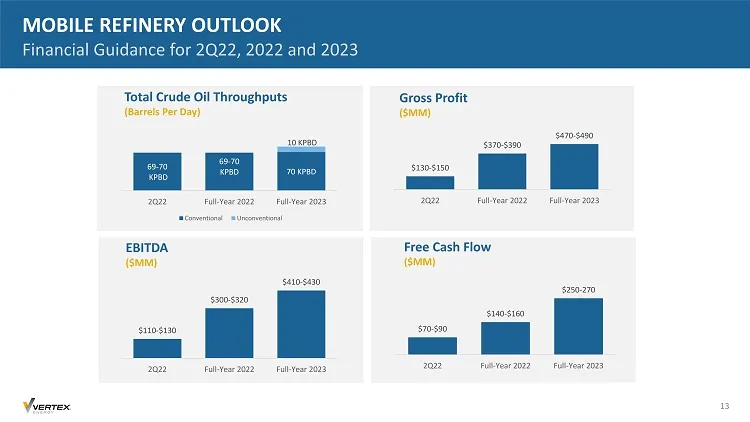
MOBILE REFINERY OUTLOOK Total Crude Oil Throughputs (Barrels Per Day) 69 - 70 KPBD 69 - 70 KPBD 70 KPBD 10 KPBD 2Q22 Full-Year 2022 Full-Year 2023 Conventional Unconventional Gross Profit ($MM) $130 - $150 $370 - $390 $470 - $490 2Q22 Full-Year 2022 Full-Year 2023 EBITDA ($MM) $110 - $130 $300 - $32
Slide 14: Consolidated Capital Spending Outlook
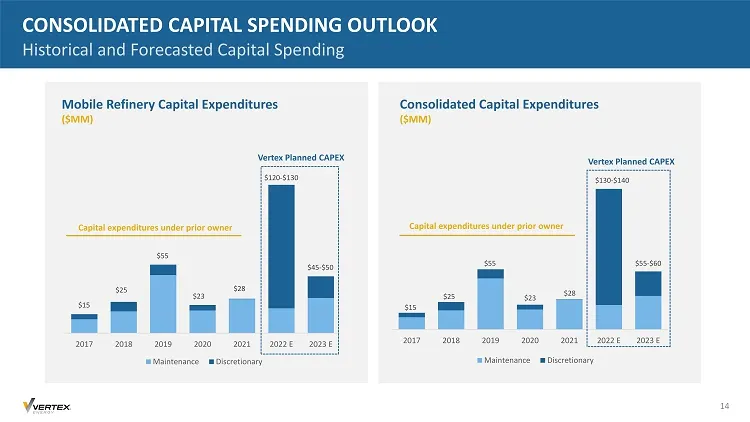
CONSOLIDATED CAPITAL SPENDING OUTLOOK Mobile Refinery Capital Expenditures ($MM) Consolidated Capital Expenditures ($MM) 2017 2018 2019 2020 2021 2022 E 2023 E Maintenance Discretionary $15 $25 $55 $23 $28 $120 - $130 $45 - $50 2017 2018 2019 2020 2021 2022 E 2023 E Maintenance Discretionary $15 $25
Slide 15: Gulf Coast Conventional Refining Economics at Multi-Year Highs
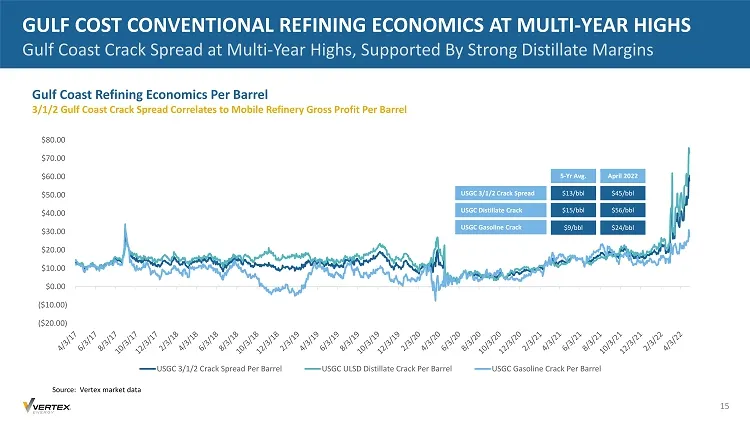
GULF COST CONVENTIONAL REFINING ECONOMICS AT MULTI - YEAR HIGHS Gulf Coast Refining Economics Per Barrel 3/1/2 Gulf Coast Crack Spread Correlates to Mobile Refinery Gross Profit Per Barrel 15 ($20.00) ($10.00) $0.00 $10.00 $20.00 $30.00 $40.00 $50.00 $60.00 $70.00 $80.00 USGC 3/1/2 Crack Spread Per
Slide 16: Consolidated Financial Outlook
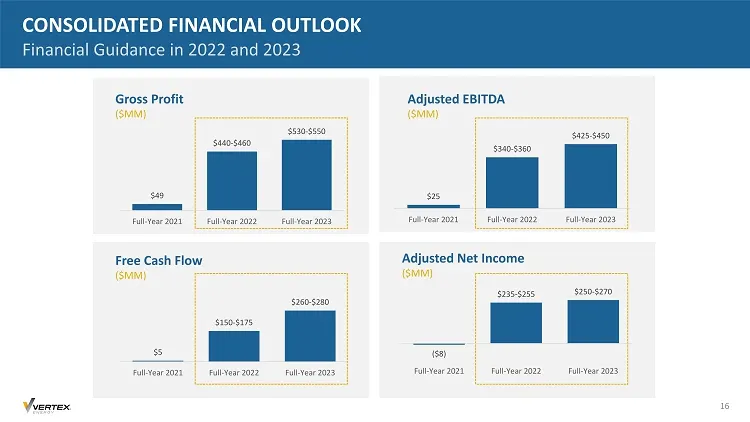
CONSOLIDATED FINANCIAL OUTLOOK Adjusted Net Income ($MM) Gross Profit ($MM) Adjusted EBITDA ($MM) Free Cash Flow ($MM) 16 $49 $440 - $460 $530 - $550 Full-Year 2021 Full-Year 2022 Full-Year 2023 $25 $340 - $360 $425 - $450 Full-Year 2021 Full-Year 2022 Full-Year 2023 $5 $150 - $175 $260 - $280 Full-
Slide 17: Credit Value Assumptions
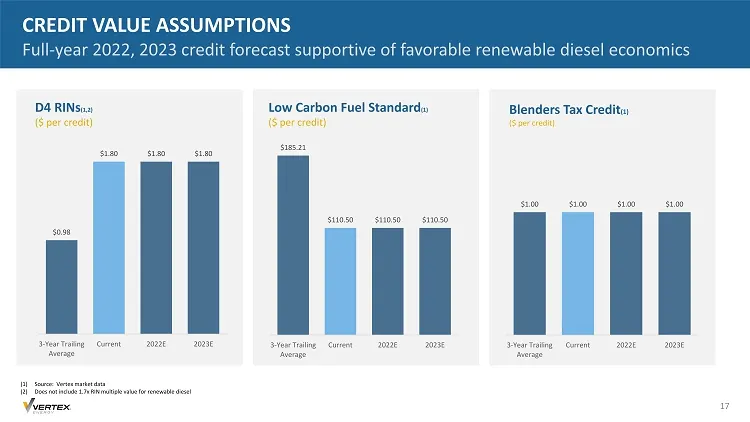
CREDIT VALUE ASSUMPTIONS D4 RINs (1,2) ($ per credit) Low Carbon Fuel Standard (1) ($ per credit) Blenders Tax Credit (1) ($ per credit) $0.98 $1.80 $1.80 $1.80 3-Year Trailing Average Current 2022E 2023E $185.21 $110.50 $110.50 $110.50 3-Year Trailing Average Current 2022E 2023E $1.00 $1.00 $1.00 $
Slide 18: Appendix
APPENDIX
Slide 19: GAAP to Non-GAAP Reconciliation
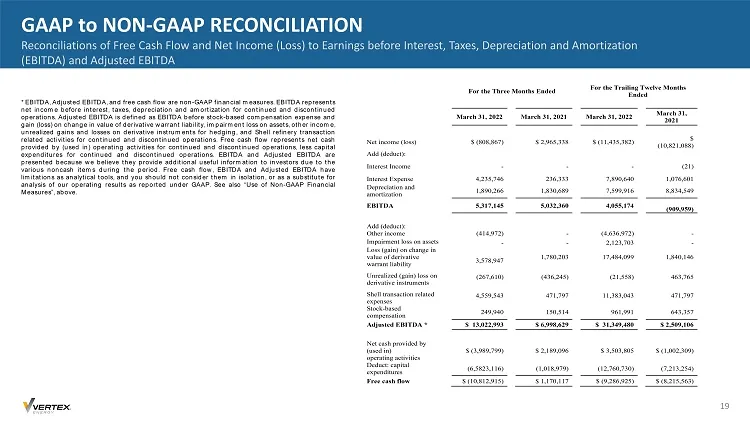
GAAP to NON - GAAP RECONCILIATION 19 * EBITDA, Adjusted EBITDA, and free cash flow are non - GAAP financial measures . EBITDA represents net income before interest, taxes, depreciation and amortization for continued and discontinued operations . Adjusted EBITDA is defined as EBITDA before stock - ba
Slide 20: GAAP to Non-GAAP Reconciliation
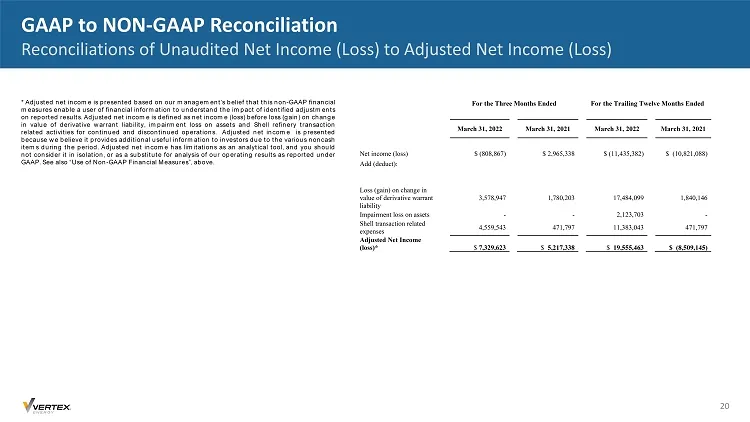
GAAP to NON - GAAP Reconciliation 20 * Adjusted net income is presented based on our management’s belief that this non - GAAP financial measures enable a user of financial information to understand the impact of identified adjustments on reported results . Adjusted net income is defined as net incom
Slide 21: GAAP to Non-GAAP Reconciliation of Forecasts
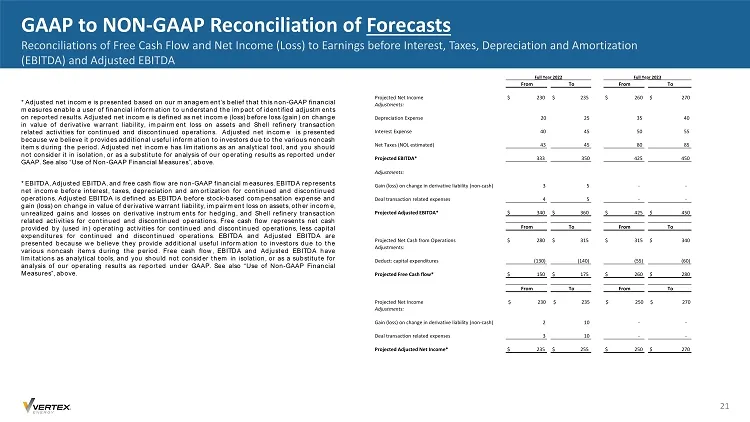
GAAP to NON - GAAP Reconciliation of Forecasts 21 * Adjusted net income is presented based on our management’s belief that this non - GAAP financial measures enable a user of financial information to understand the impact of identified adjustments on reported results . Adjusted net income is defined
Slide 22: $155.0 Million Convertible Senior Notes
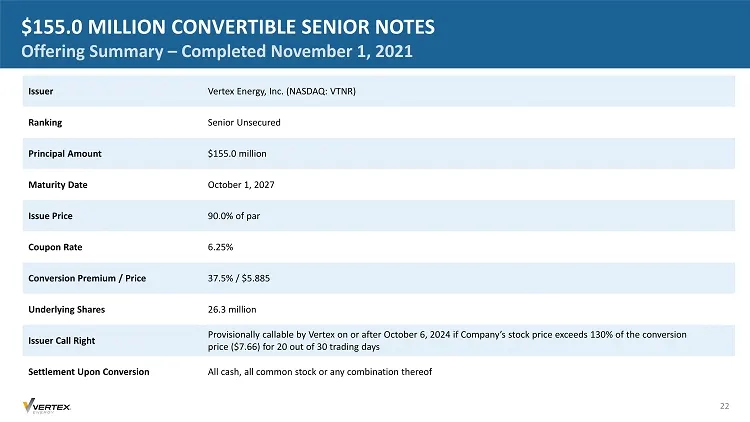
$155.0 MILLION CONVERTIBLE SENIOR NOTES Issuer Vertex Energy, Inc. (NASDAQ: VTNR) Ranking Senior Unsecured Principal Amount $155.0 million Maturity Date October 1, 2027 Issue Price 90.0% of par Coupon Rate 6.25% Conversion Premium / Price 37.5% / $5.885 Underlying Shares 26.3 million Issuer Call Rig
Slide 23: $125.0 Million Senior Secured Term Loan
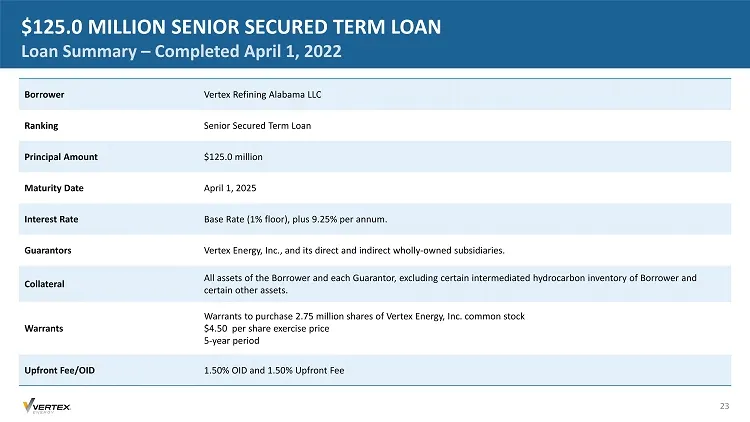
$125.0 MILLION SENIOR SECURED TERM LOAN 23 Borrower Vertex Refining Alabama LLC Ranking Senior Secured Term Loan Principal Amount $125.0 million Maturity Date April 1, 2025 Interest Rate Base Rate (1% floor), plus 9.25% per annum. Guarantors Vertex Energy, Inc., and its direct and indirect wholly -
Slide 24: Senior Secured Intermediation Summary
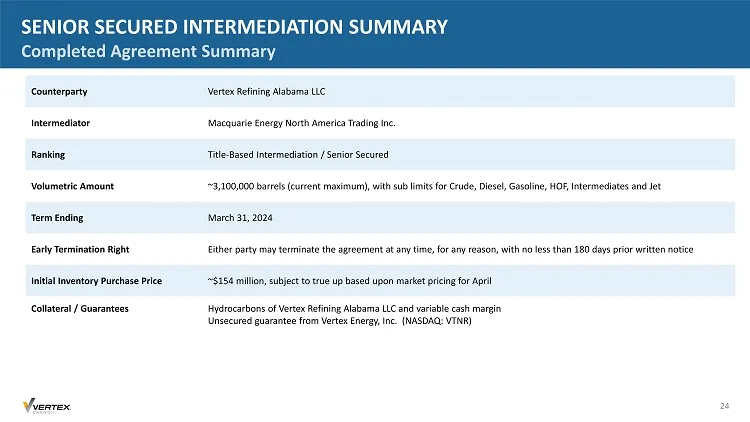
SENIOR SECURED INTERMEDIATION SUMMARY Counterparty Vertex Refining Alabama LLC Intermediator Macquarie Energy North America Trading Inc. Ranking Title - Based Intermediation / Senior Secured Volumetric Amount ~3,100,000 barrels (current maximum), with sub limits for Crude, Diesel, Gasoline, HOF, Int
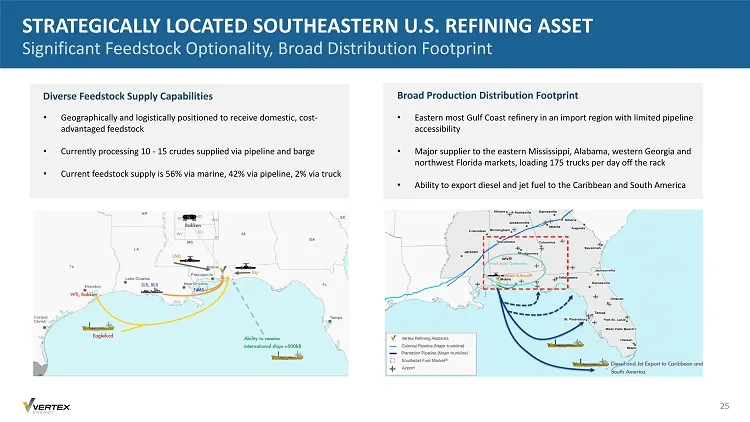
Slide 25: Strategically Located Southeastern U.S. Refining Asset
STRATEGICALLY LOCATED SOUTHEASTERN U.S. REFINING ASSET Diverse Feedstock Supply Capabilities Broad Production Distribution Footprint • Geographically and logistically positioned to receive domestic, cost - advantaged feedstock • Currently processing 10 - 15 crudes supplied via pipeline and barge • C
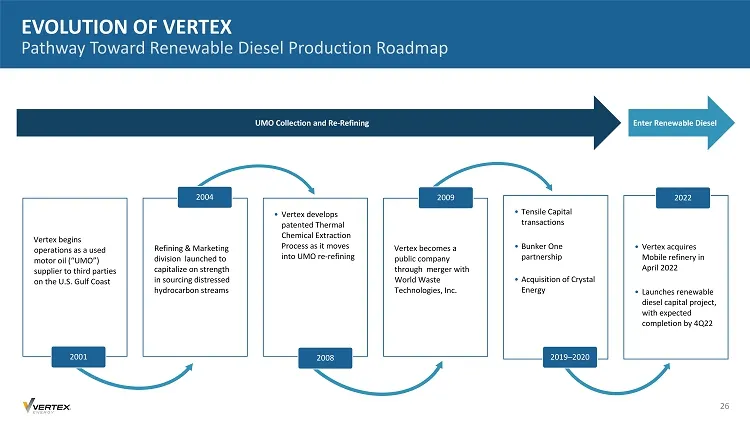
Slide 26: Evolution of Vertex
Vertex begins operations as a used motor oil (“UMO”) supplier to third parties on the U.S. Gulf Coast 2001 Refining & Marketing division launched to capitalize on strength in sourcing distressed hydrocarbon streams 2004 • Vertex develops patented Thermal Chemical Extraction Process as it moves into
Source: SEC EDGAR · 8-K filed May 10, 2022
More decks from Vertex Energy Inc
 Q2 2024 Earnings Presentation21 slides · Aug 8, 2024
 Q1 2024 Earnings Presentation20 slides · May 9, 2024
 Q4 2023 Earnings Presentation29 slides · Feb 28, 2024
 Q3 2023 Earnings Presentation27 slides · Nov 7, 2023
 Q2 2023 Earnings Presentation26 slides · Aug 9, 2023
 Q1 2023 Earnings Presentation26 slides · May 9, 2023