Enventis — Hickory Tech — Q4 2007 Earnings Presentation
18 slides from Enventis's earnings presentation, Mar 6, 2008
Slide 1: Q4 and Full Year 2007 Earnings Conference Call
1 Q4 and Full Year 2007 Q4 and Full Year 2007 Earnings Conference Call Earnings Conference Call February 28, 2008
Slide 2: Forward Looking Statement
2 This discussion may contain certain statements which are not historical facts, but are “forward-looking statements.” These forward-looking statements are based on current expectations, estimates and projections about the industry in which HickoryTech operates and management’s beliefs and assumptio
Slide 3: Fourth Quarter 2007 Highlights
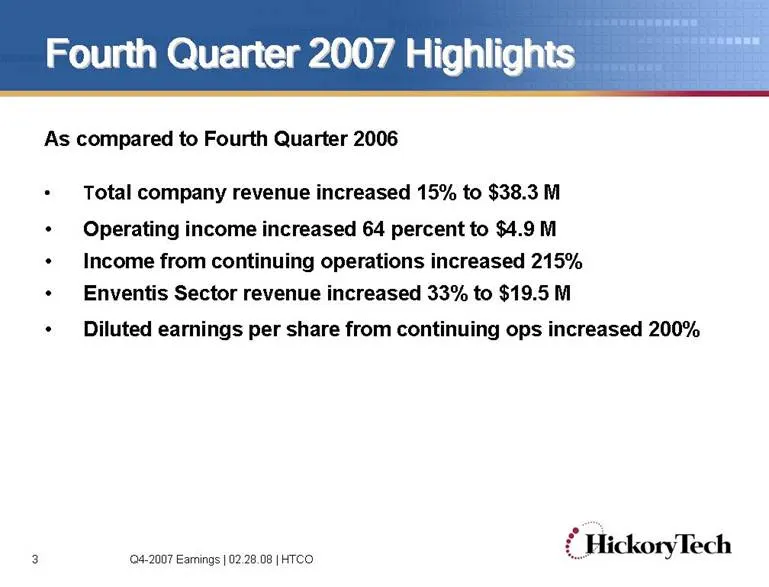
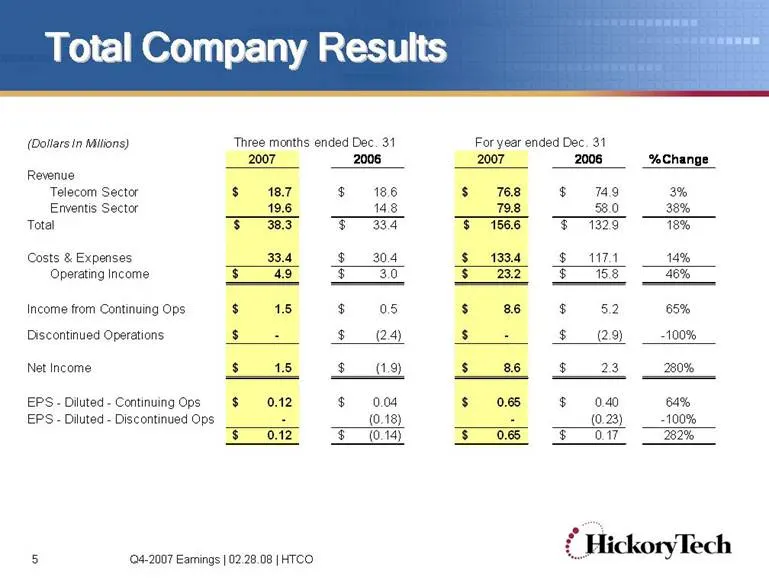
3 Fourth Quarter 2007 Highlights Fourth Quarter 2007 Highlights As compared to Fourth Quarter 2006 • Total company revenue increased 15% to $38.3 M • Operating income increased 64 percent to $4.9 M • Income from continuing operations increased 215% • Enventis Sector revenue increased 33% to $19.5 M
Slide 4: Full Year 2007 Highlights
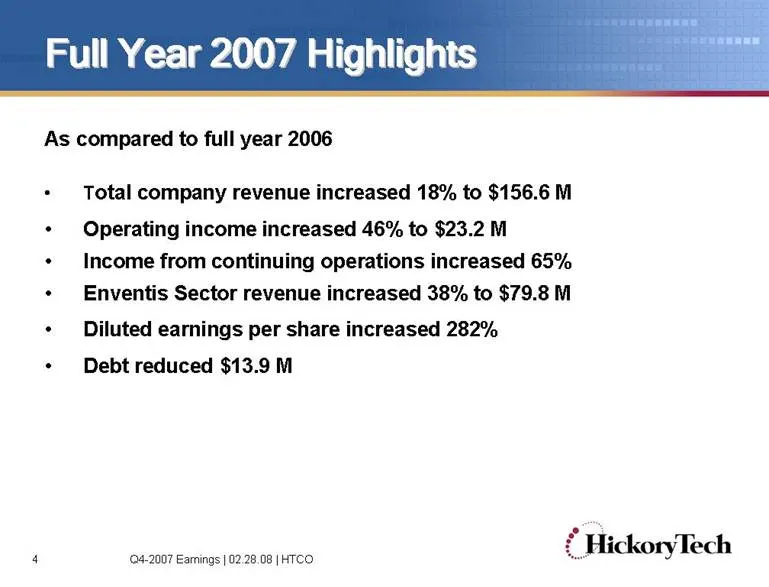
4 Full Year 2007 Highlights Full Year 2007 Highlights As compared to full year 2006 • Total company revenue increased 18% to $156.6 M • Operating income increased 46% to $23.2 M • Income from continuing operations increased 65% • Enventis Sector revenue increased 38% to $79.8 M • Diluted earnings pe
Slide 5: Total Company Results
5 Total Company Results Total Company Results Q4-2007 Earnings | 02.28.08 | HTCO 2007 2006 2007 2006 % Change Revenue Telecom Sector 18.7 $ 18.6 $ 76.8 $ 74.9 $ 3% Enventis Sector 19.6 14.8 79.8 58.0 38% Total 38.3 $ 33.4 $ 156.6 $ 132.9 $ 18% Costs & Expenses 33.4 30.4 $ 133.4 $ 117.1 $ 14% Operati
Slide 6: Telecom Sector Results
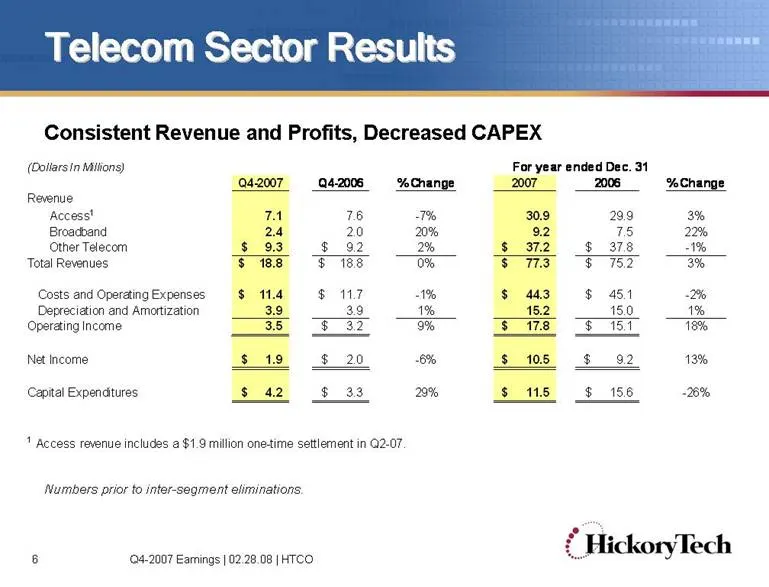
6 Telecom Sector Results Telecom Sector Results Numbers prior to inter-segment eliminations. Consistent Revenue and Profits, Decreased CAPEX Q4-2007 Earnings | 02.28.08 | HTCO (Dollars In Millions) Q4-2007 Q4-2006 % Change 2007 2006 % Change Revenue Access1 7.1 7.6 -7% 30.9 29.9 3% Broadband 2.4 2.0
Slide 7: Enventis Sector Results
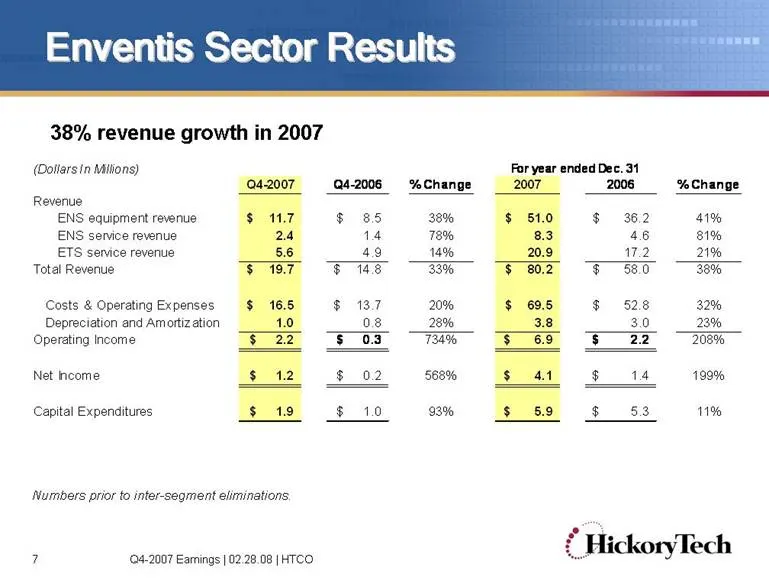
7 Enventis Sector Results Enventis Sector Results 38% revenue growth in 2007 Q4-2007 Q4-2006 % Change 2007 2006 % Change Revenue ENS equipment revenue 11.7 $ 8.5 $ 38% 51.0 $ 36.2 $ 41% ENS service revenue 2.4 1.4 78% 8.3 4.6 81% ETS service revenue 5.6 4.9 14% 20.9 17.2 21% Total Revenue 19.7 $ 14.
Slide 8: Enventis Product Line Results
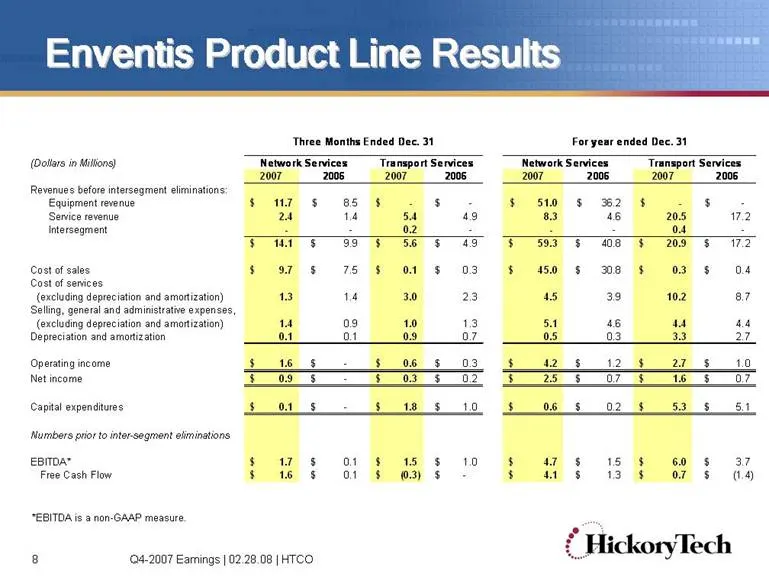
8 Enventis Product Line Results Enventis Product Line Results *EBITDA is a non-GAAP measure. (Dollars in Millions) 2007 2006 2007 2006 2007 2006 2007 2006 Revenues before intersegment eliminations: Equipment revenue 11.7 $ 8.5 $ - $ - $ 51.0 $ 36.2 $ - $ - $ Service revenue 2.4 1.4 5.4 4.9 8.3 4.6 2
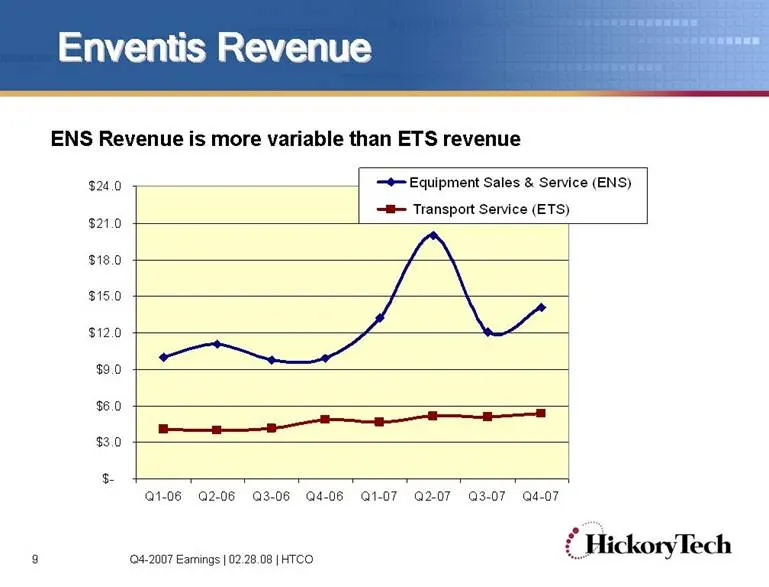
Slide 9: Enventis Revenue
9 Enventis Revenue Enventis Revenue $- $3.0 $6.0 $9.0 $12.0 $15.0 $18.0 $21.0 $24.0 Q1-06 Q2-06 Q3-06 Q4-06 Q1-07 Q2-07 Q3-07 Q4-07 Equipment Sales & Service (ENS) Transport Service (ETS) ENS Revenue is more variable than ETS revenue Q4-2007 Earnings | 02.28.08 | HTCO
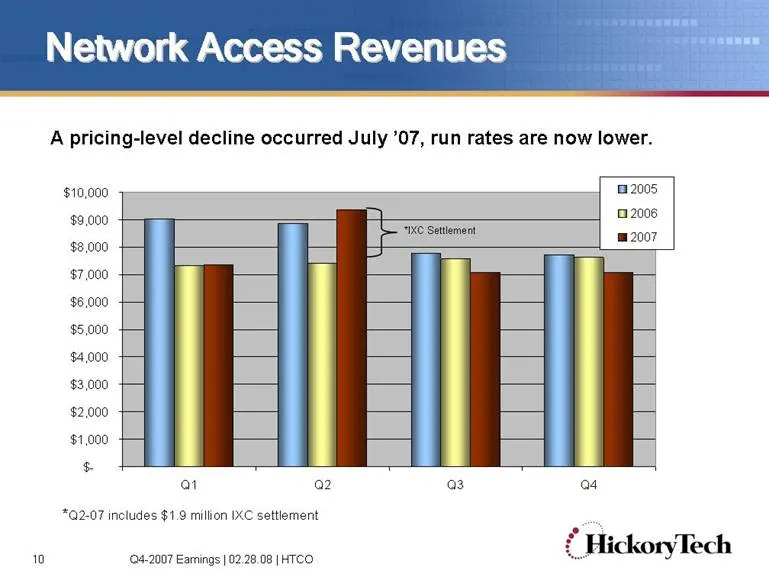
Slide 10: Network Access Revenues
10 Network Access Revenues Network Access Revenues *Q2-07 includes $1.9 million IXC settlement A pricing-level decline occurred July ’07, run rates are now lower. Q4-2007 Earnings | 02.28.08 | HTCO $- $1,000 $2,000 $3,000 $4,000 $5,000 $6,000 $7,000 $8,000 $9,000 $10,000 Q1 Q2 Q3 Q4 2005 2006 2007 *
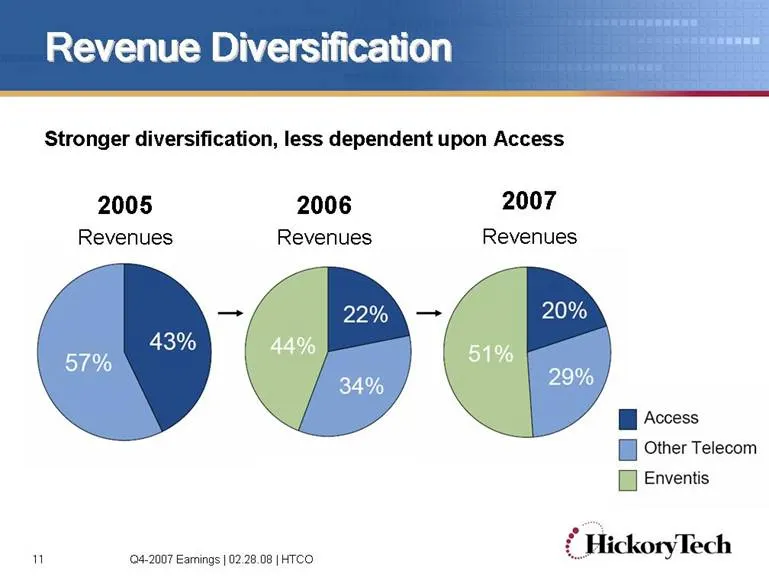
Slide 11: Revenue Diversification
11 Revenue Diversification Revenue Diversification 2005 Revenues 2006 Revenues 2007 Revenues Q4-2007 Earnings | 02.28.08 | HTCO Stronger diversification, less dependent upon Access
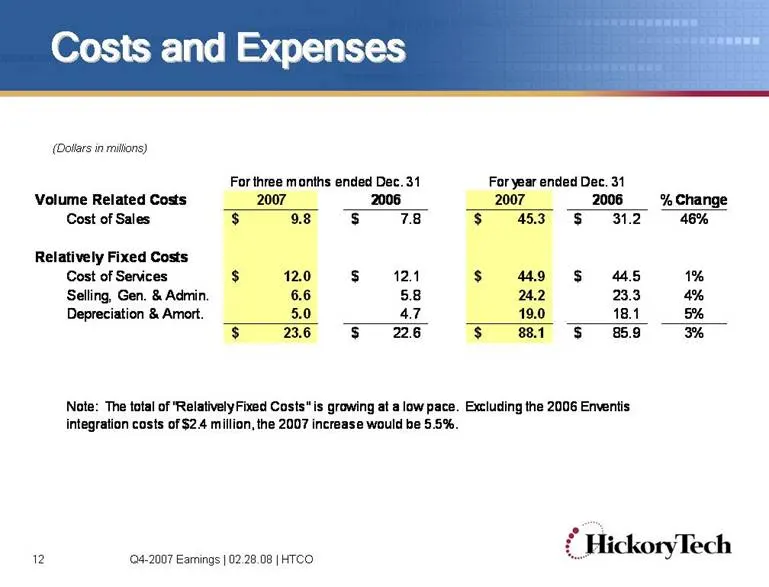
Slide 12: Costs and Expenses
12 Volume Related Costs 2007 2006 2007 2006 % Change Cost of Sales 9.8 $ 7.8 $ 45.3 $ 31.2 $ 46% Relatively Fixed Costs Cost of Services 12.0 $ 12.1 $ 44.9 $ 44.5 $ 1% Selling, Gen. & Admin. 6.6 5.8 24.2 23.3 4% Depreciation & Amort. 5.0 4.7 19.0 18.1 5% 23.6 $ 22.6 $ 88.1 $ 85.9 $ 3% Note: The tota
Slide 13: Debt Level
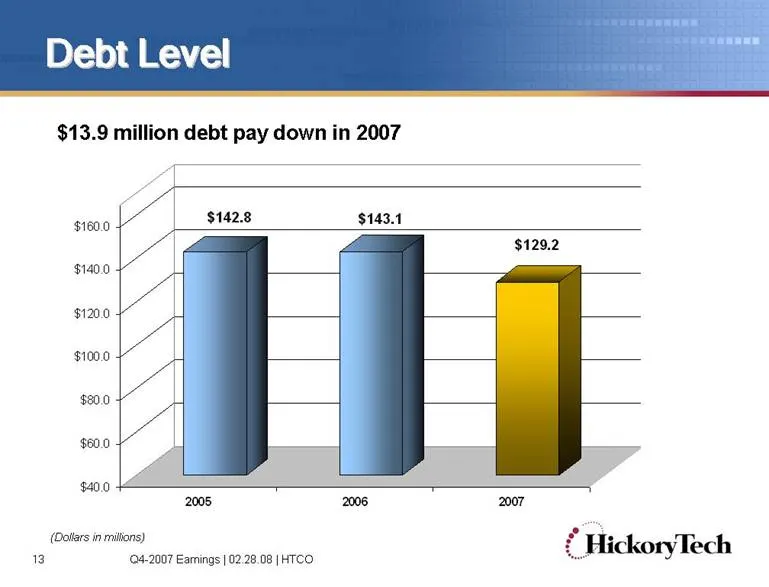
13 Debt Level Debt Level $13.9 million debt pay down in 2007 $142.8 $143.1 $129.2 $40.0 $60.0 $80.0 $100.0 $120.0 $140.0 $160.0 2005 2006 2007 (Dollars in millions) Q4-2007 Earnings | 02.28.08 | HTCO
Slide 14: Free Cash Flow
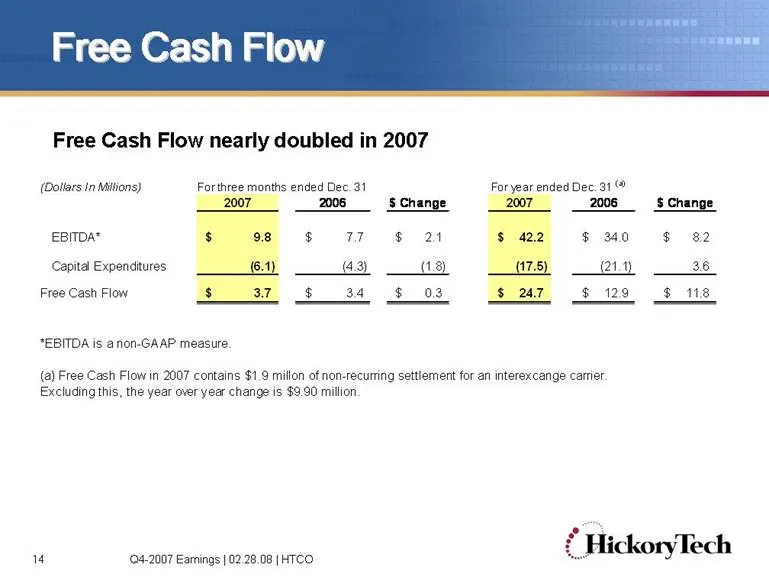
14 Free Cash Flow Free Cash Flow For year ended Dec. 31 (a) 2007 2006 $ Change 2007 2006 $ Change EBITDA* 9.8 $ 7.7 $ 2.1 $ 42.2 $ 34.0 $ 8.2 $ (6.1) (4.3) (1.8) (17.5) (21.1) 3.6 Free Cash Flow 3.7 $ 3.4 $ 0.3 $ 24.7 $ 12.9 $ 11.8 $ *EBITDA is a non-GAAP measure. (a) Free Cash Flow in 2007 contains
Slide 15: Reconciliation of Operating Income to EBITDA
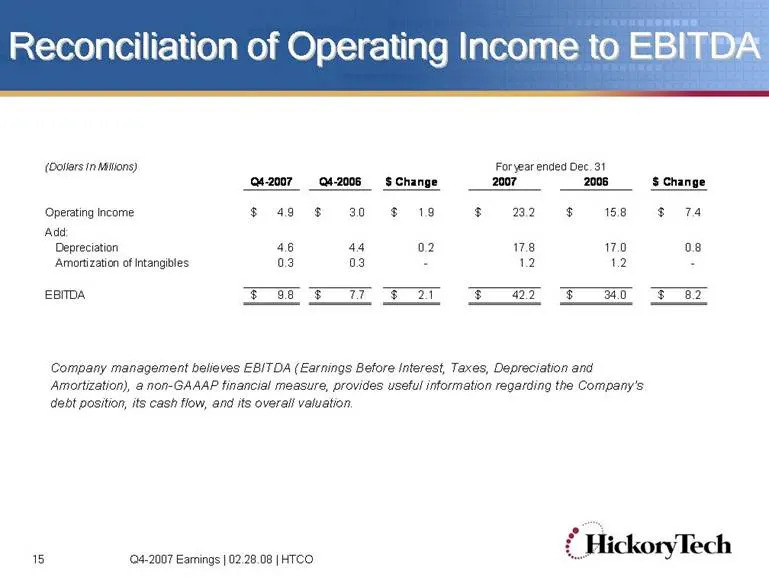
15 Reconciliation of Operating Income to EBITDA Reconciliation of Operating Income to EBITDA Q4-2007 Earnings | 02.28.08 | HTCO Company management believes EBITDA (Earnings Before Interest, Taxes, Depreciation and Amortization), a non-GAAAP financial measure, provides useful information regarding th
Slide 16: Fiscal 2008 Outlook
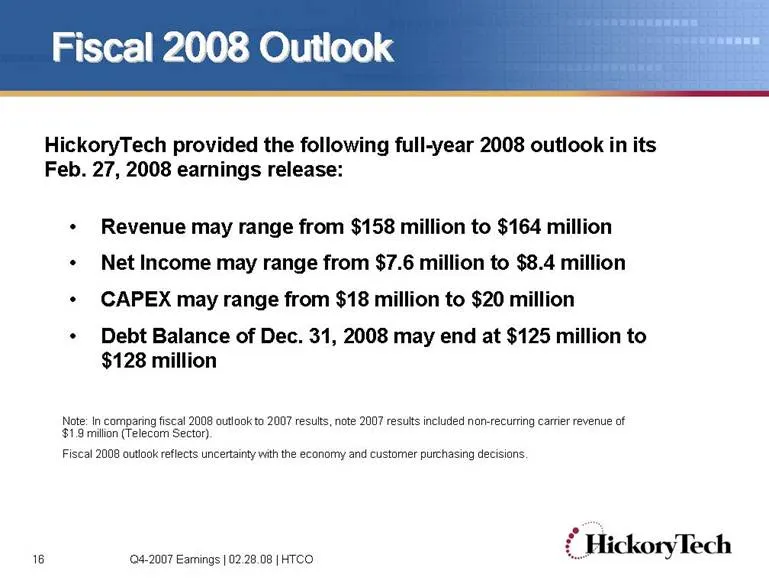
16 Fiscal 2008 Outlook Fiscal 2008 Outlook • Revenue may range from $158 million to $164 million • Net Income may range from $7.6 million to $8.4 million • CAPEX may range from $18 million to $20 million • Debt Balance of Dec. 31, 2008 may end at $125 million to $128 million Q4-2007 Earnings | 02.28
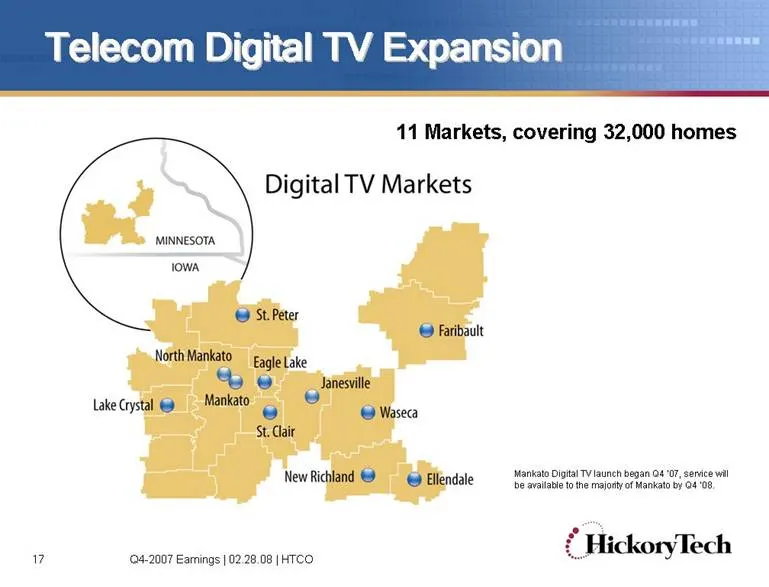
Slide 17: Telecom Digital TV Expansion
17 Telecom Digital TV Expansion Telecom Digital TV Expansion Q4-2007 Earnings | 02.28.08 | HTCO 11 Markets, covering 32,000 homes Mankato Digital TV launch began Q4 ‘07, serv ice will be av ailable to the majority of Mankato by Q4 ’08.
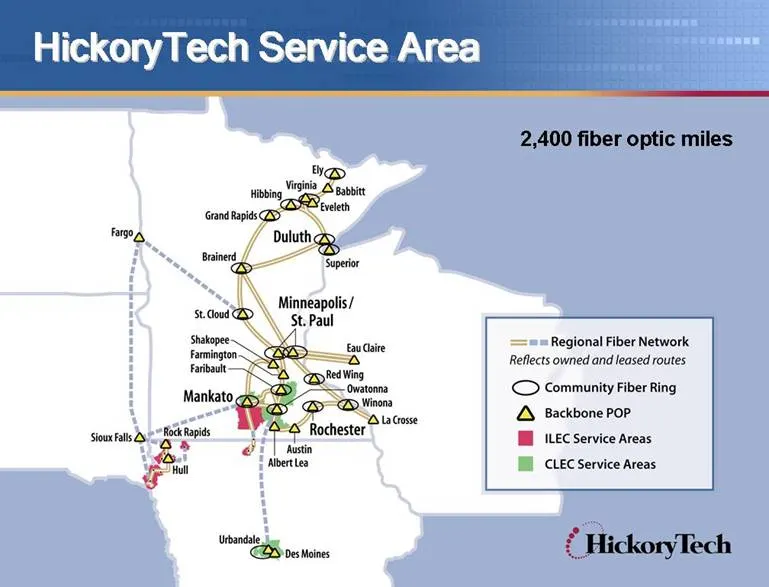
Slide 18: HickoryTech Service Area
18 Q4-2007 Earnings | 02.28.08 | HTCO HickoryTech Service Area HickoryTech Service Area 2,400 fiber optic miles
Source: SEC EDGAR · 8-K filed Mar 6, 2008
More decks from Enventis Corp
 Merger or Acquisition (June 2014)12 slides · Jun 30, 2014
 Hickory Tech — Shareholder Meeting (May 2014)36 slides · May 7, 2014
 Hickory Tech — Q1 2014 Earnings Presentation16 slides · May 2, 2014
 Hickory Tech — Deutsche Bank Media, Internet and Telecom Conference 201431 slides · Mar 11, 2014
 Hickory Tech — Q4 2013 Earnings Presentation21 slides · Mar 4, 2014
 Hickory Tech — Q3 2013 Earnings Presentation16 slides · Nov 7, 2013