Curo — Stephens Annual Investment Conference 2021
25 slides from Curo's conference presentation, Dec 1, 2021

Slide 1: Stephens Annual Investment Conference
Stephens Annual Investment Conference D E C E M B E R 1 , 2 0 2 1
Slide 2: Disclaimer
2 D I S C L A I M E R IMPORTANT: You must read the following information before continuing to the rest of the presentation, which is being provided to you for informational purposes only. FORWARD-LOOKING STATEMENTS This presentation contains forward-looking statements. These forward-looking statemen
Slide 3: Overview of CURO
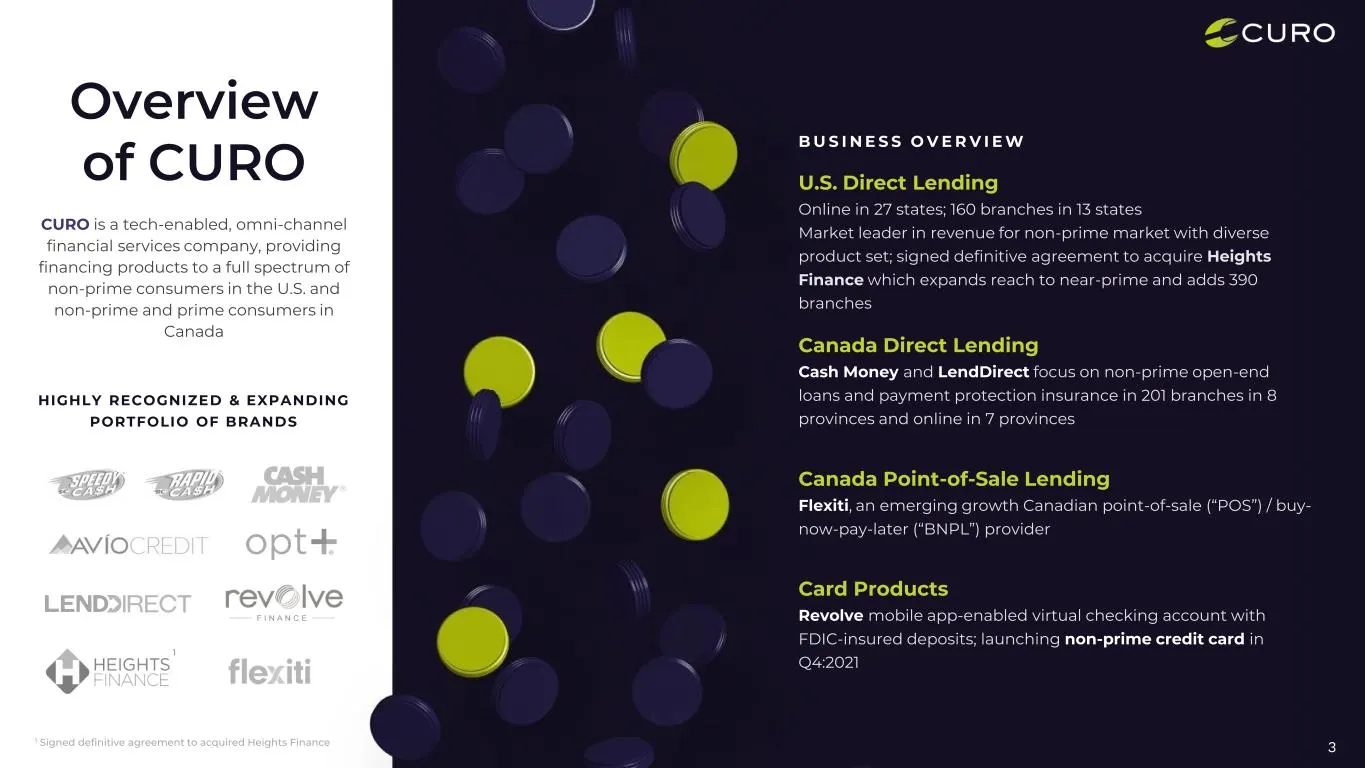
3 Overview of CURO CURO is a tech-enabled, omni-channel financial services company, providing financing products to a full spectrum of non-prime consumers in the U.S. and non-prime and prime consumers in Canada HIGHLY RECOGNIZED & EXPANDING PORTFOLIO OF BRANDS U.S. Direct Lending Online in 27 states
Slide 4: Heights Finance Acquisition
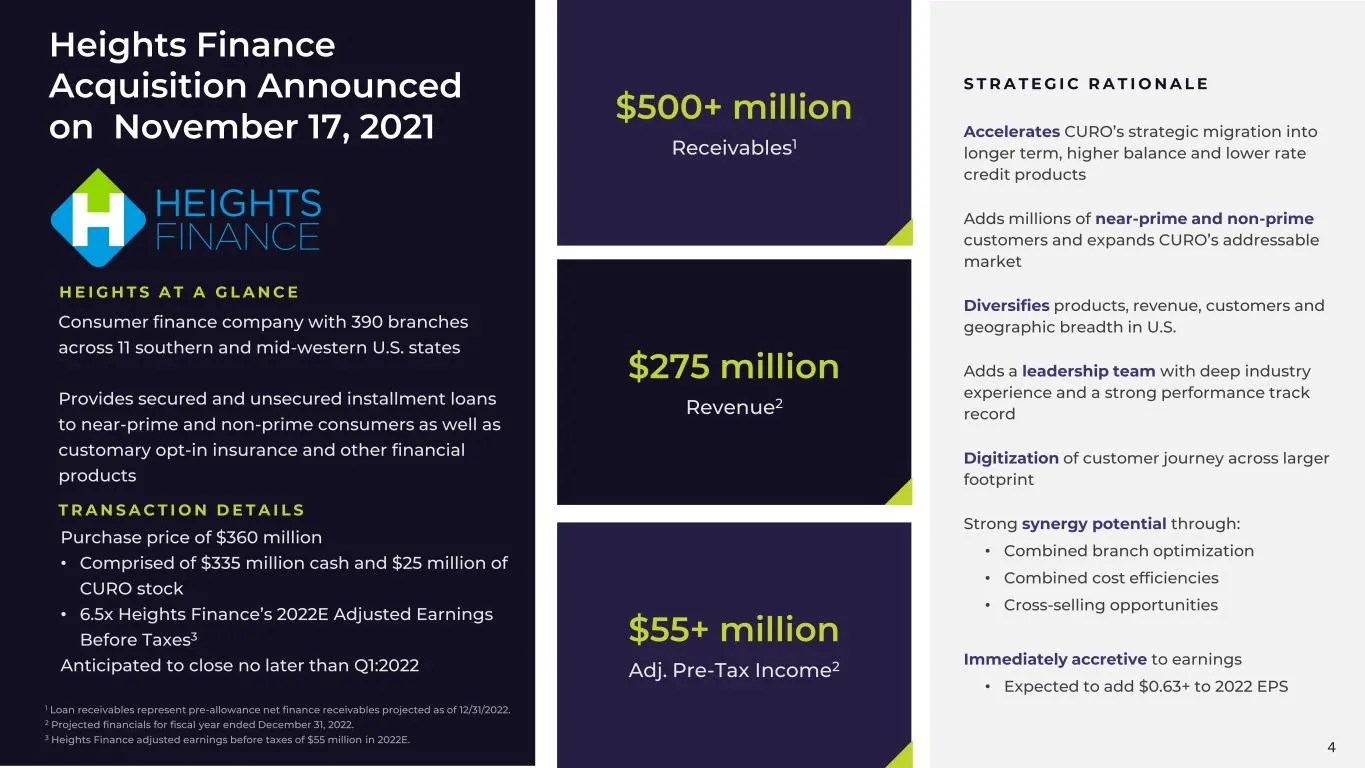
$55+ million Adj. Pre-Tax Income2 $275 million Revenue2 4 $500+ million Receivables1 H E I G H T S A T A G L A N C E Consumer finance company with 390 branches across 11 southern and mid-western U.S. states Provides secured and unsecured installment loans to near-prime and non-prime consumers as wel
Slide 5: Heights Finance branches and credit products
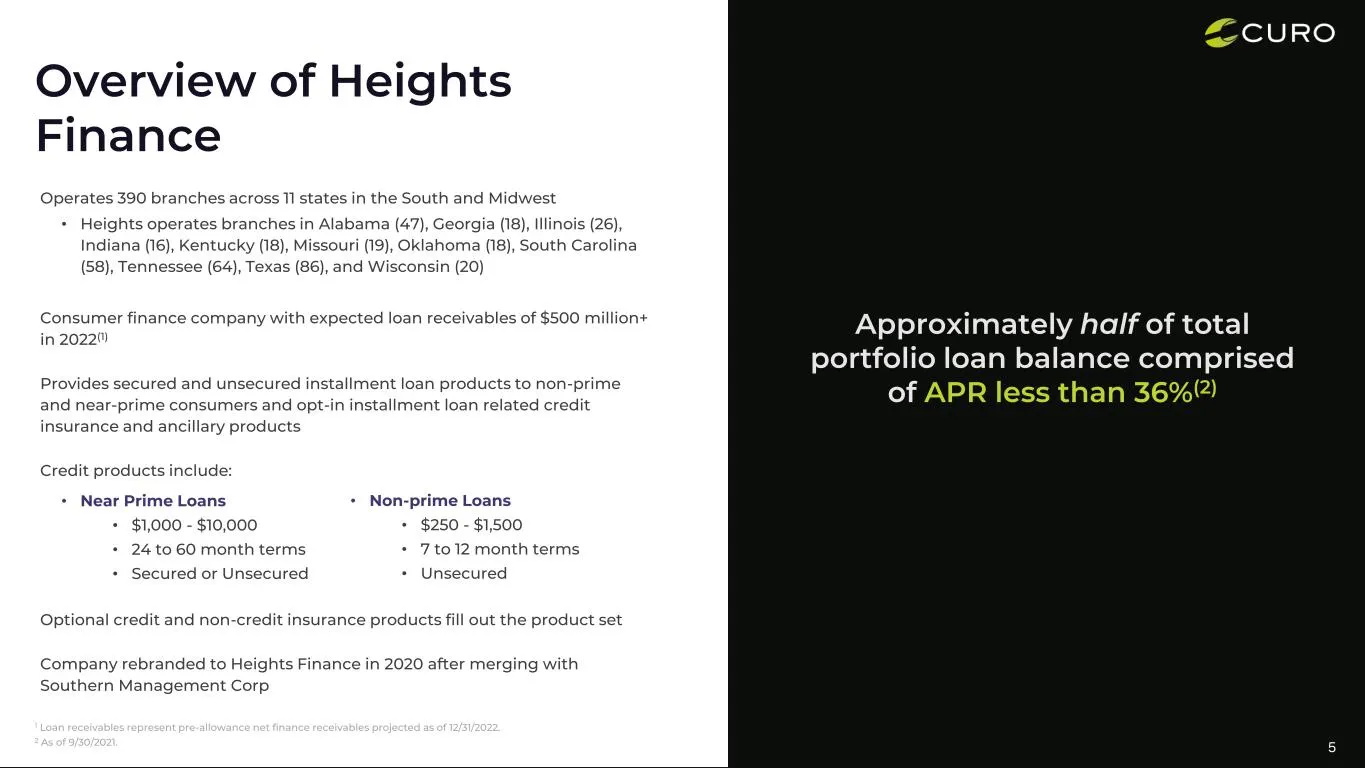
5 • Non-prime Loans • $250 - $1,500 • 7 to 12 month terms • Unsecured Operates 390 branches across 11 states in the South and Midwest • Heights operates branches in Alabama (47), Georgia (18), Illinois (26), Indiana (16), Kentucky (18), Missouri (19), Oklahoma (18), South Carolina (58), Tennessee (6

Slide 6: Heights Growth Plan
6 Heights Growth Plan Expand Heights Finance’s Near-Prime Credit Offering • State expansion • In-market branch expansion • Progressive credit products for CURO customers Card Products • Market Revolve through expanded branch network • Offer CURO non-prime credit cards to eligible customers Technolog
Slide 7: Canada Direct Lending
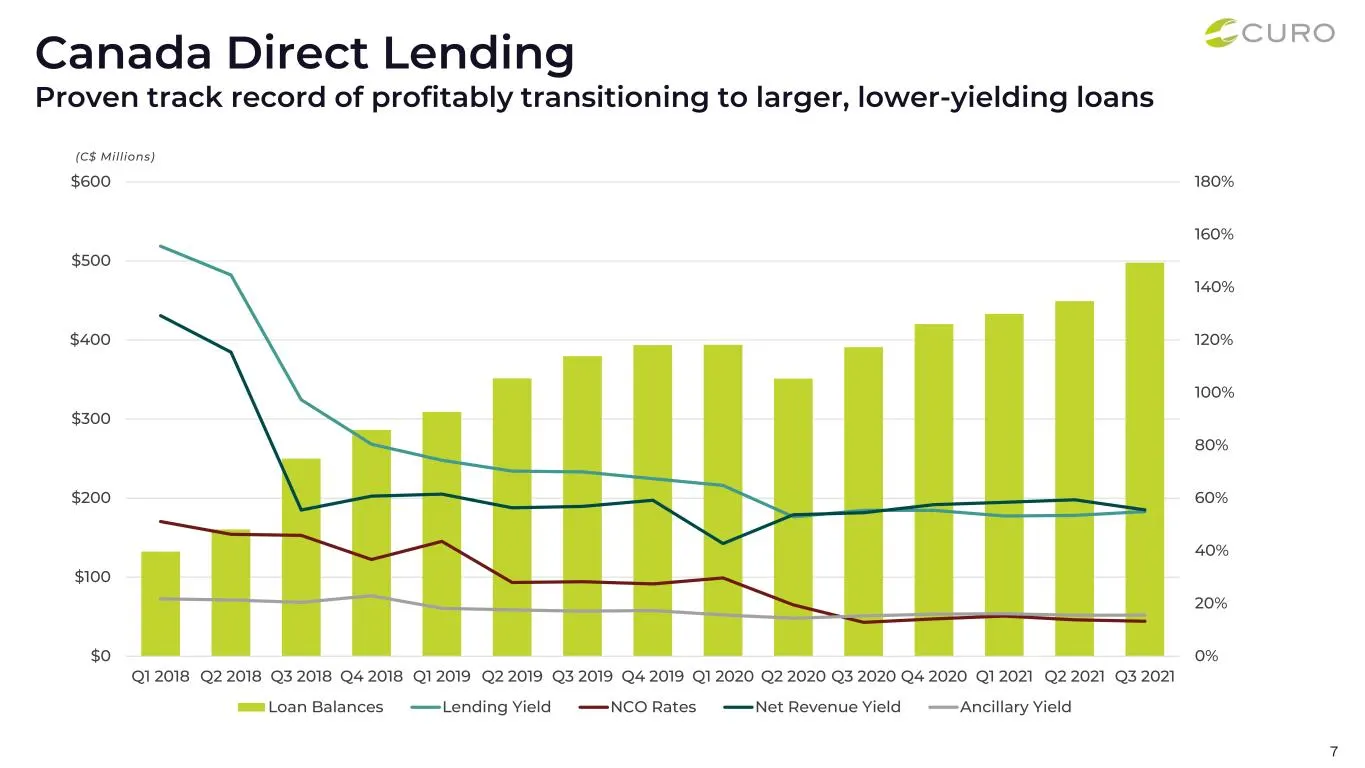
Canada Direct Lending Proven track record of profitably transitioning to larger, lower-yielding loans 77 0% 20% 40% 60% 80% 100% 120% 140% 160% 180% $0 $100 $200 $300 $400 $500 $600 Q1 2018 Q2 2018 Q3 2018 Q4 2018 Q1 2019 Q2 2019 Q3 2019 Q4 2019 Q1 2020 Q2 2020 Q3 2020 Q4 2020 Q1 2021 Q2 2021 Q3 202
Slide 8: Solidifies Position as a Full Spectrum Consumer Lender
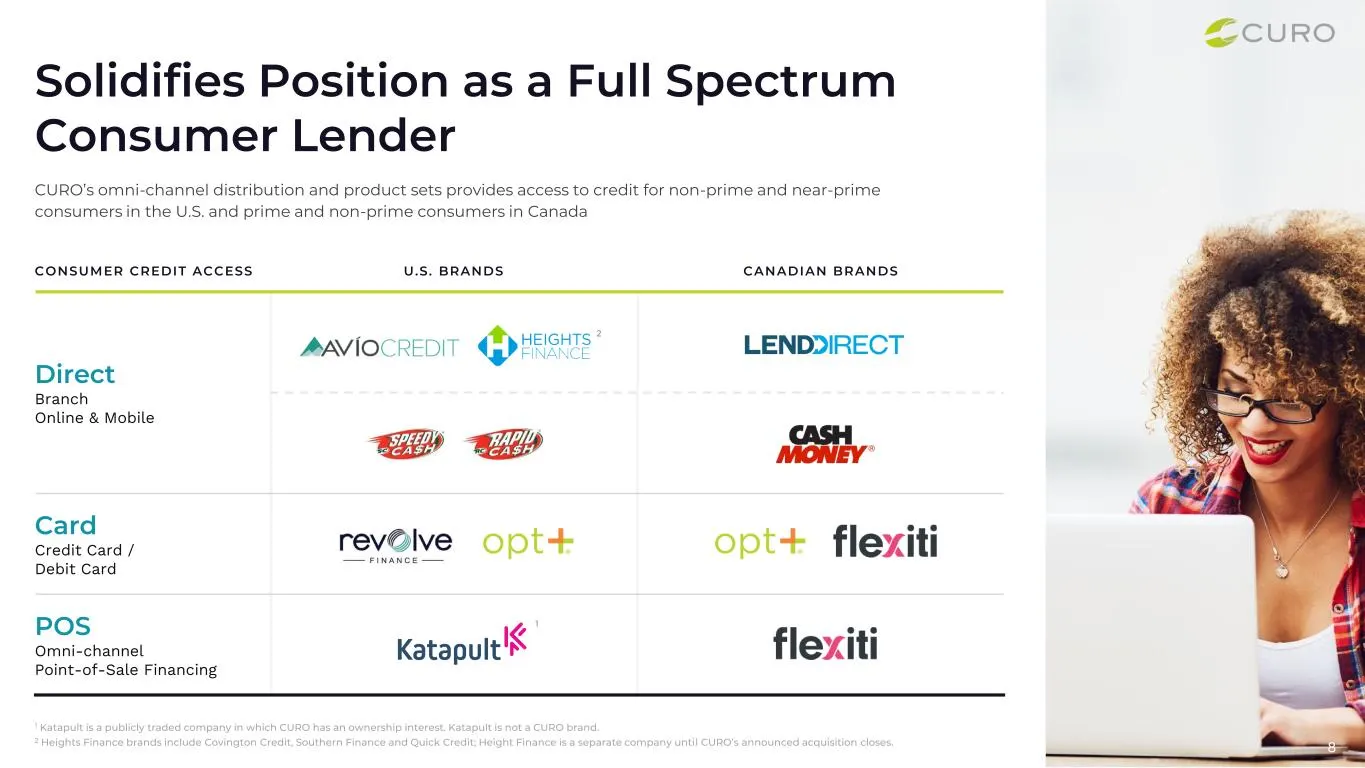
Solidifies Position as a Full Spectrum Consumer Lender 8 CURO’s omni-channel distribution and product sets provides access to credit for non-prime and near-prime consumers in the U.S. and prime and non-prime consumers in Canada CONSUMER CREDIT ACCESS U.S. BRANDS CANADIAN BRANDS Direct Branch Online

Slide 9: Financing on the Flexiticard
9 FINANCING ON THE FLEXITICARD® Deferred Payments Payments are deferred until end of promo period 0% interest1, 3-24 months Monthly Installments Split purchase into equal monthly payments 0% interest1, 3-72 months Revolving Credit Purchase Like a regular credit card Up to 30 days interest free Flexi
Slide 10: Flexiti has limited omnichannel competition
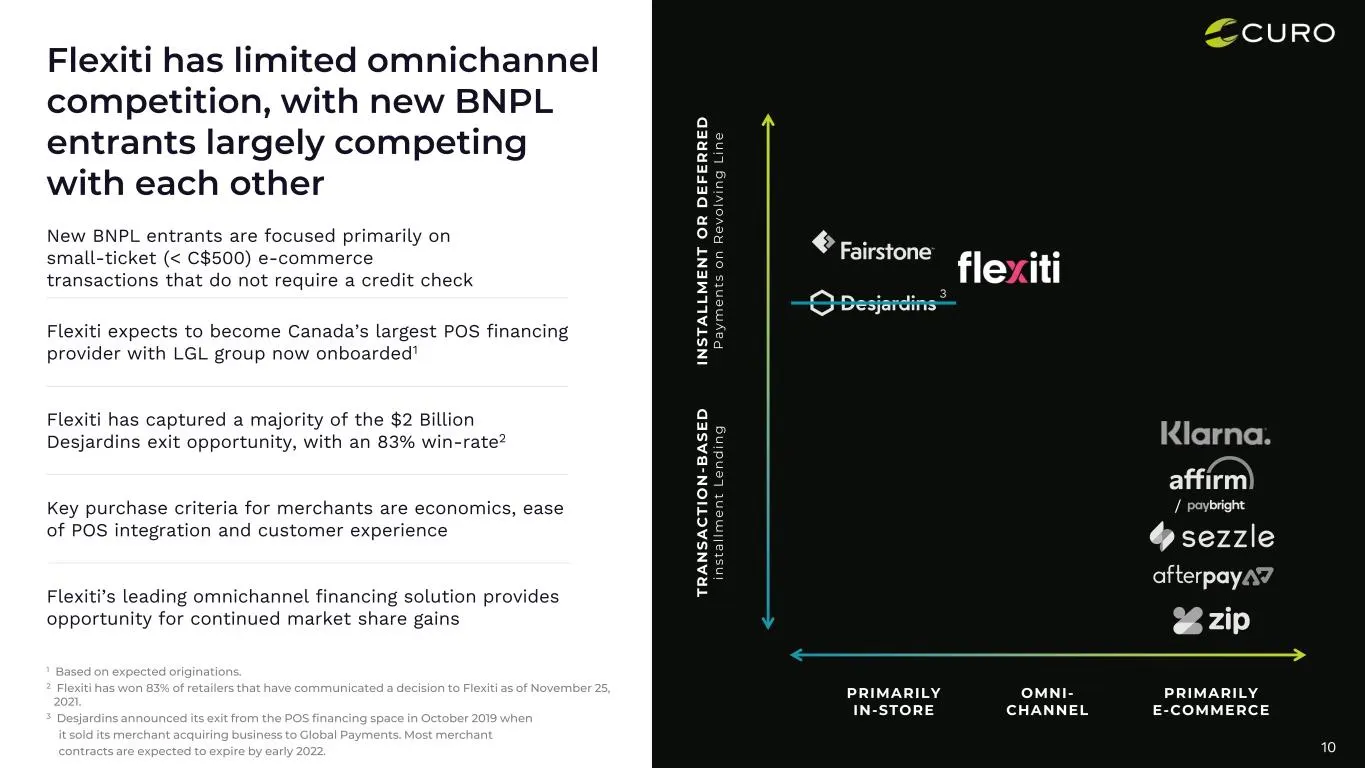
Flexiti has limited omnichannel competition, with new BNPL entrants largely competing with each other 10 Flexiti expects to become Canada’s largest POS financing provider with LGL group now onboarded1 Flexiti has captured a majority of the $2 Billion Desjardins exit opportunity, with an 83% win-rate
Slide 11: Flexiti's originations growth is accelerating
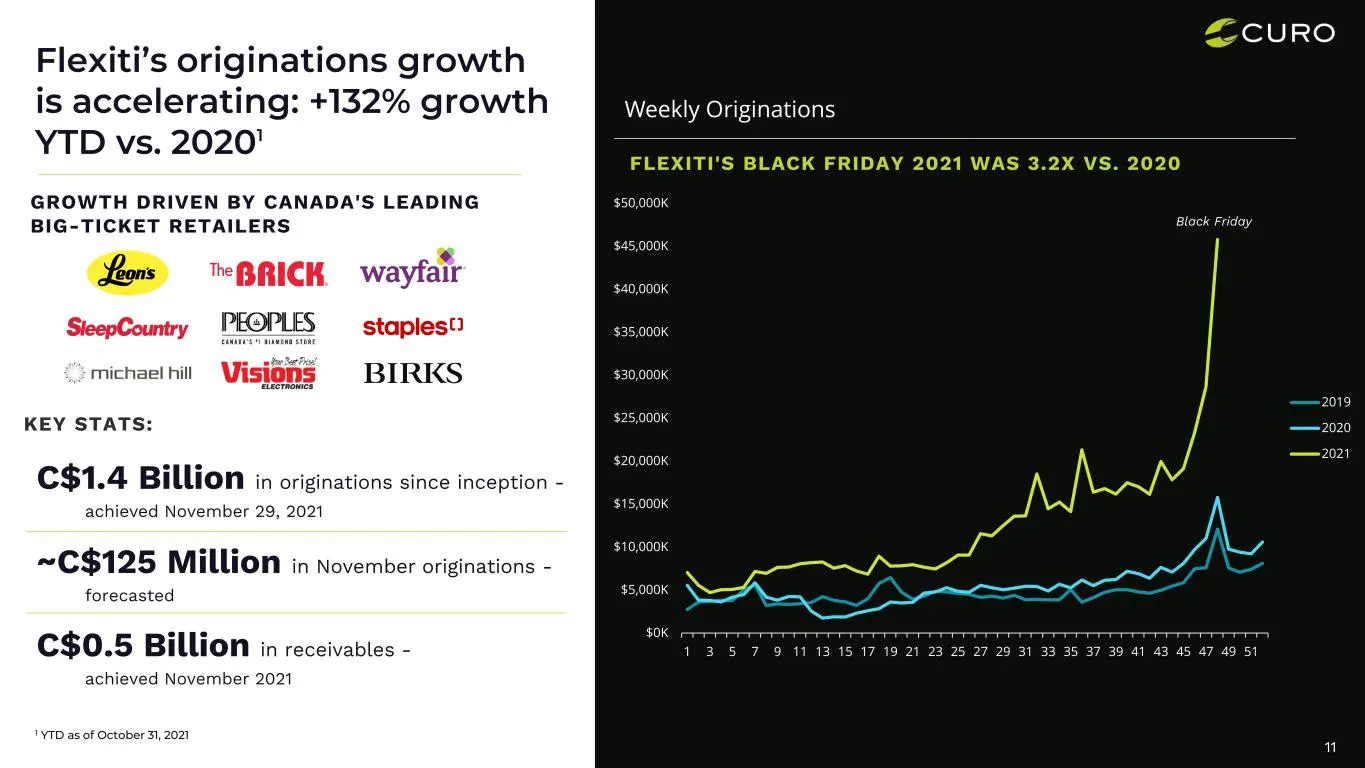
$0K $5,000K $10,000K $15,000K $20,000K $25,000K $30,000K $35,000K $40,000K $45,000K $50,000K 1 3 5 7 9 11 13 15 17 19 21 23 25 27 29 31 33 35 37 39 41 43 45 47 49 51 2019 2020 2021 Flexiti’s originations growth is accelerating: +132% growth YTD vs. 20201 11 1 YTD as of October 31, 2021 C$1.4 Billion
Slide 12: Flexiti is One of Canada's Fastest Growing Companies
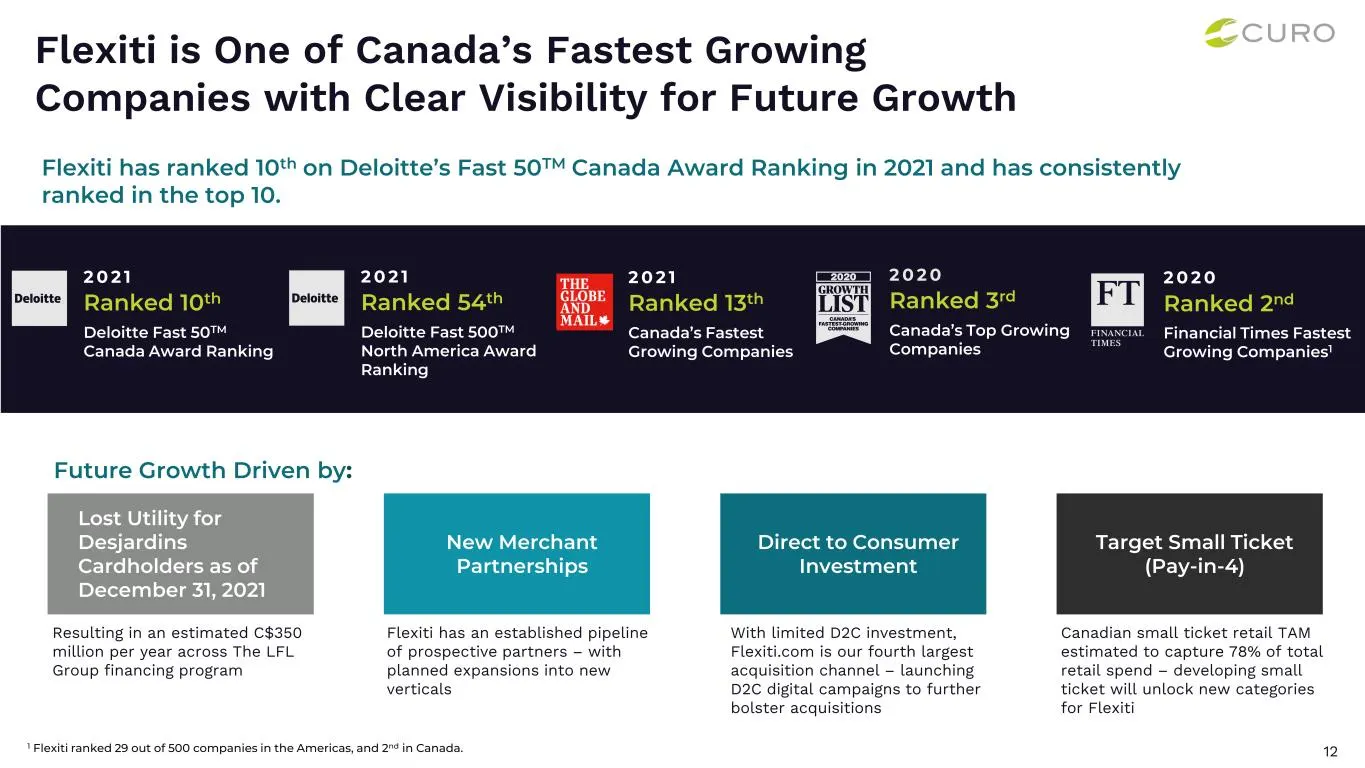
Flexiti is One of Canada’s Fastest Growing Companies with Clear Visibility for Future Growth 12 Existing Customers Growth in acquisitions via Flexiti.com Growth in cross shop amongst Flexiti partners As announced on September 24, 2021, Flexiti ranks 13th on The Globe and Mail’s third-annual ranking

Slide 13: Financial Recap
13 Financial Recap
Slide 14: Consolidated Financial Performance Trends
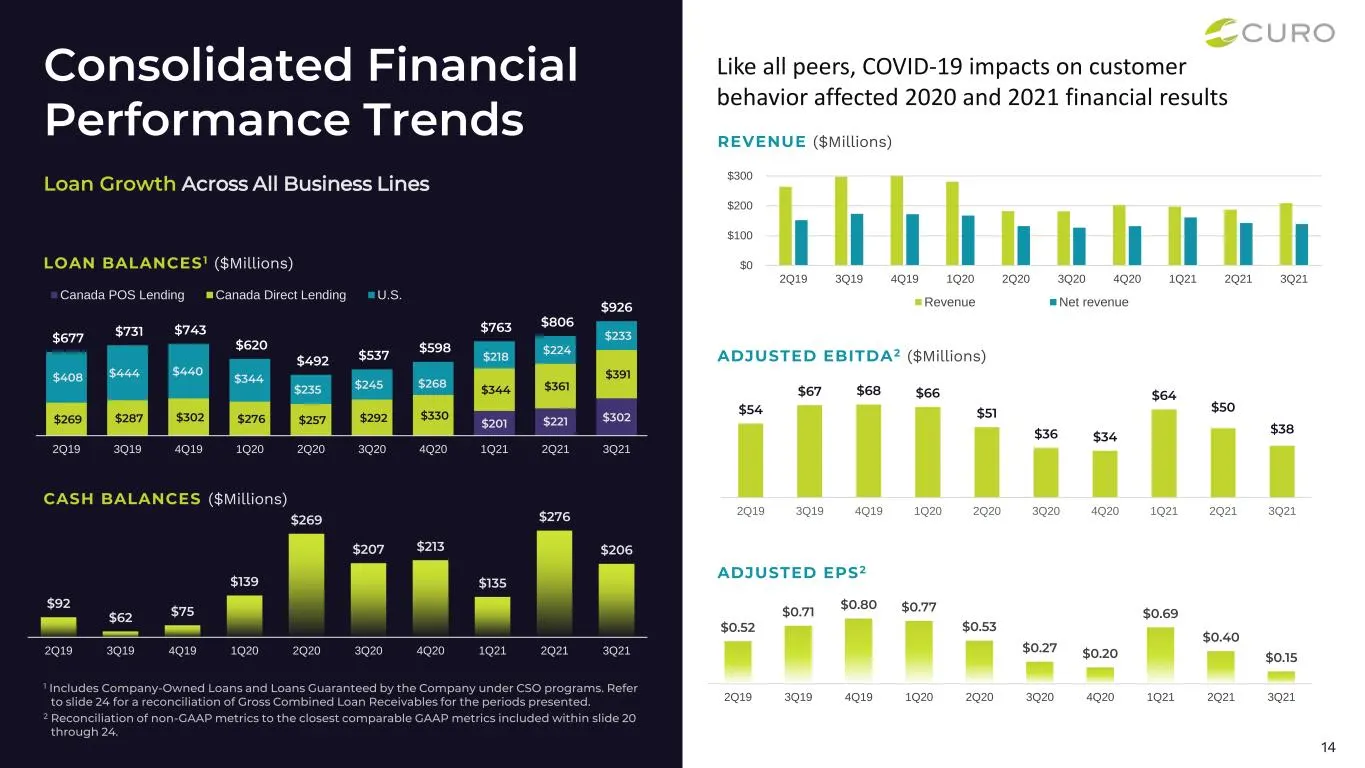
14 Consolidated Financial Performance Trends Loan Growth Across All Business Lines LOAN BALANCES 1 ($Millions) CASH BALANCES ($Millions) $201 $221 $302$269 $287 $302 $276 $257 $292 $330 $344 $361 $391 $408 $444 $440 $344 $235 $245 $268 $218 $224 $233 $677 $731 $743 $620 $492 $537 $598 $763 $806 $926
Slide 15: Canada Direct Lending Credit Quality Remains Strong
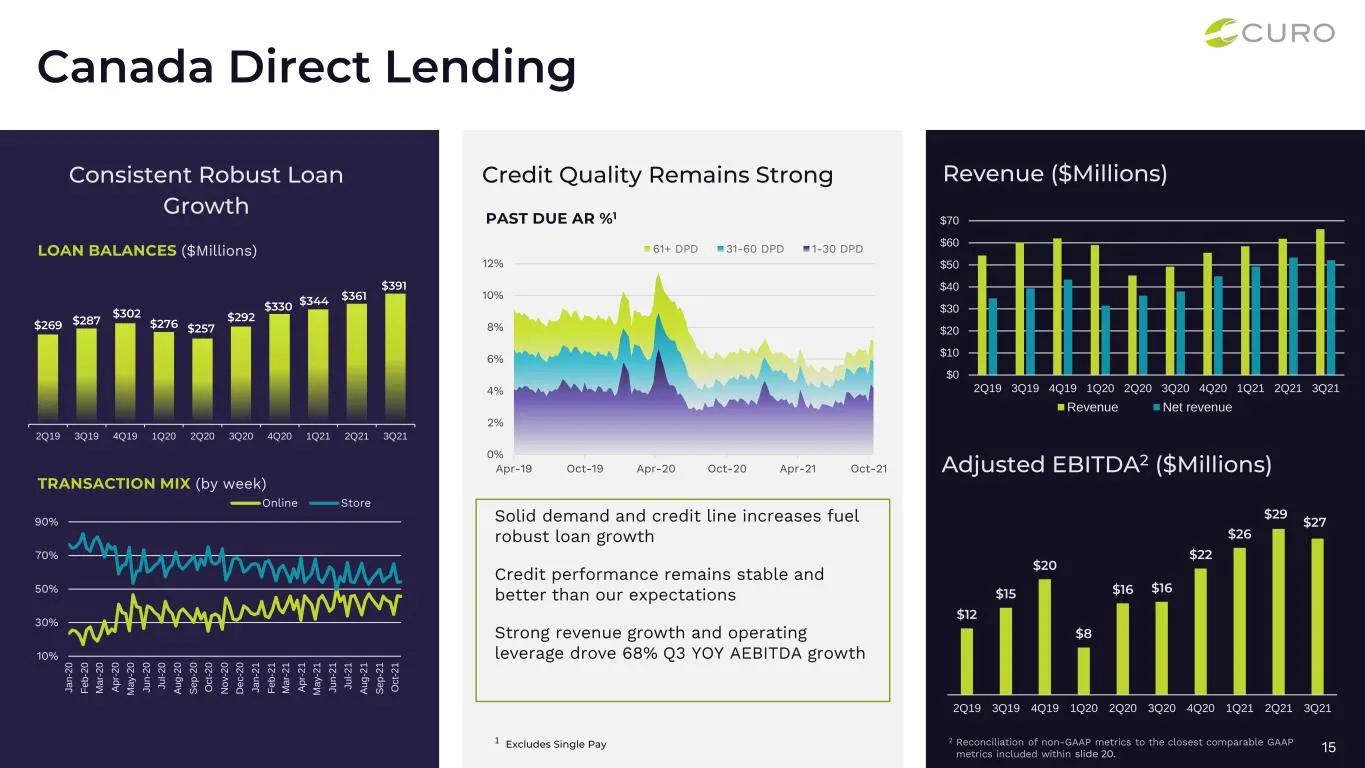
15 Canada Direct Lending Credit Quality Remains StrongConsistent Robust Loan Growth PAST DUE AR %1 LOAN BALANCES ($Millions) TRANSACTION MIX (by week) $269 $287 $302 $276 $257 $292 $330 $344 $361 $391 2Q19 3Q19 4Q19 1Q20 2Q20 3Q20 4Q20 1Q21 2Q21 3Q21 0% 2% 4% 6% 8% 10% 12% Apr-19 Oct-19 Apr-20 Oct-2
Slide 16: Strong Growth Outlook for Canadian Business Segments
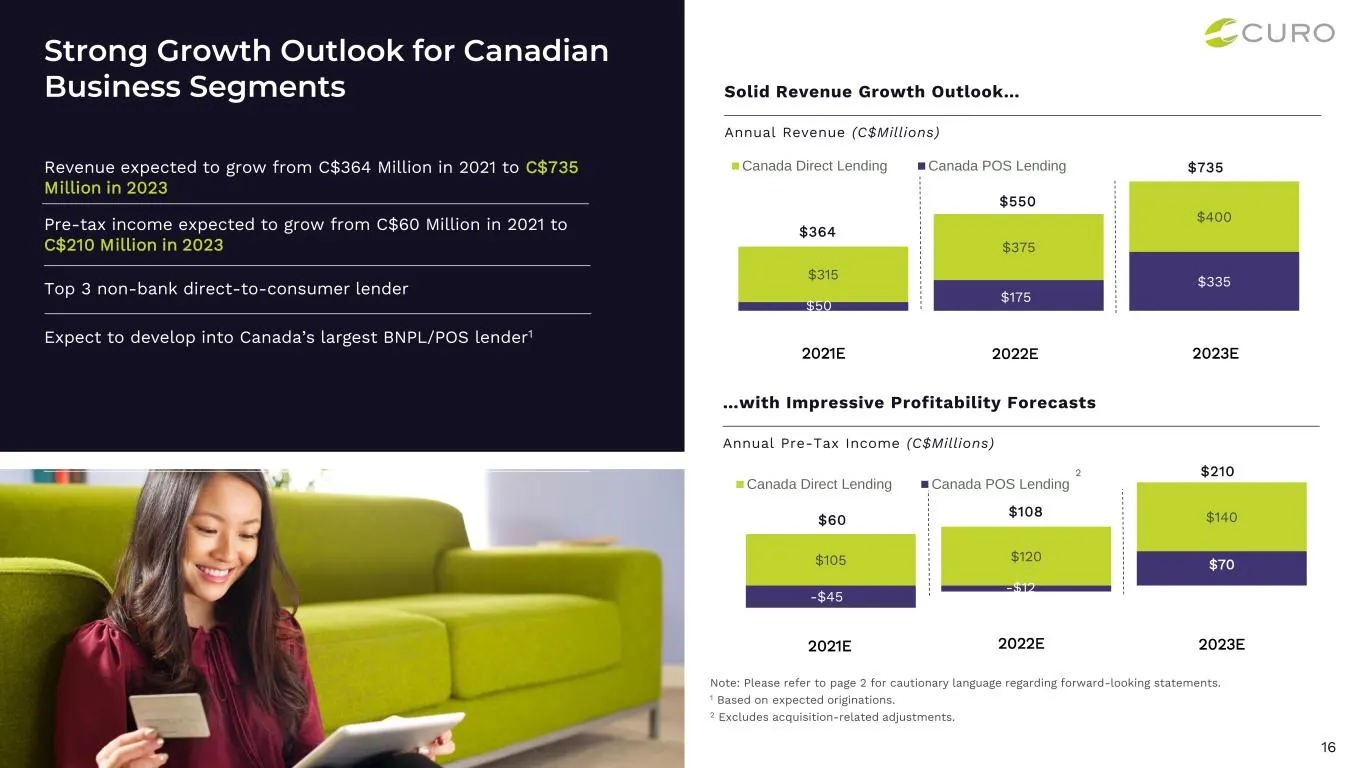
Strong Growth Outlook for Canadian Business Segments 16 Expect to develop into Canada’s largest BNPL/POS lender1 Top 3 non-bank direct-to-consumer lender Revenue expected to grow from C$364 Million in 2021 to C$735 Million in 2023 Pre-tax income expected to grow from C$60 Million in 2021 to C$210 Mi
Slide 17: U.S. Credit Performance Normalizing
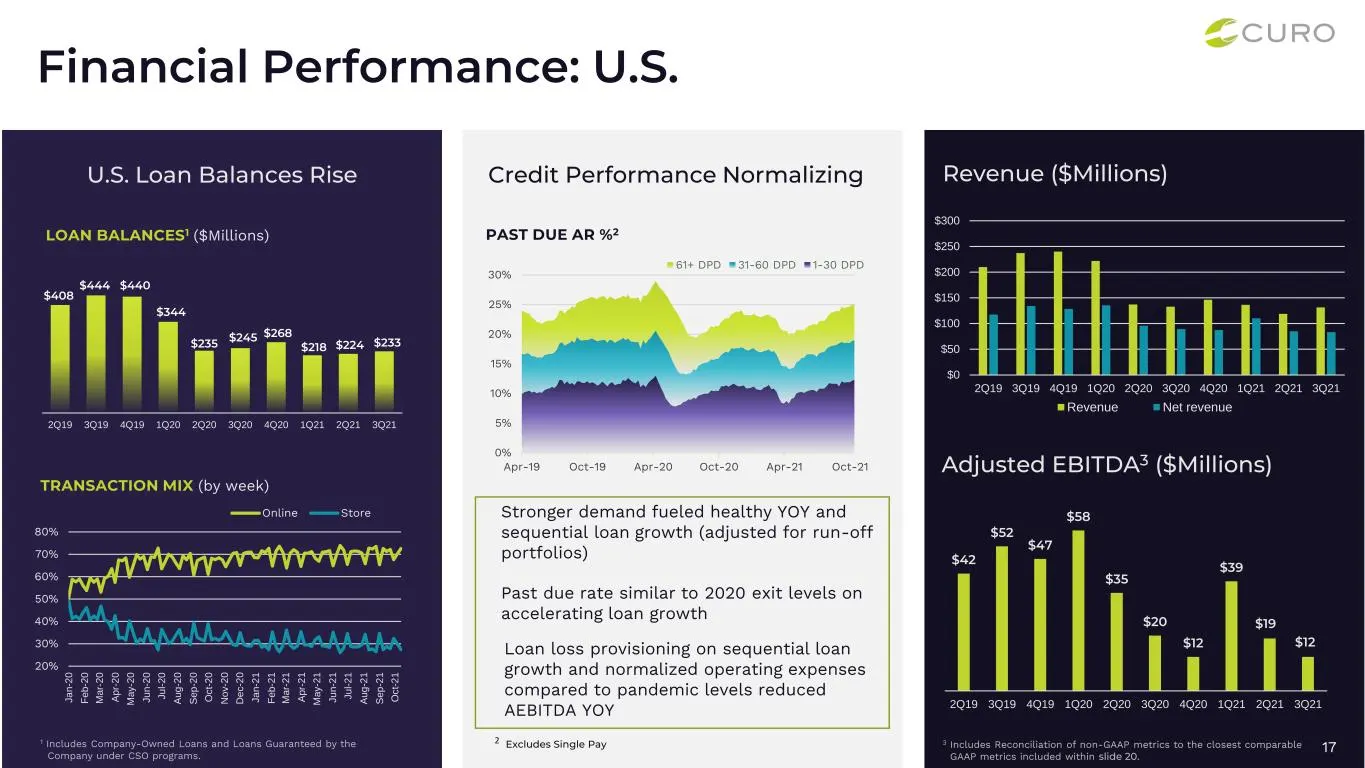
17 Financial Performance: U.S. Credit Performance NormalizingU.S. Loan Balances Rise PAST DUE AR %2LOAN BALANCES1 ($Millions) TRANSACTION MIX (by week) $408 $444 $440 $344 $235 $245 $268 $218 $224 $233 2Q19 3Q19 4Q19 1Q20 2Q20 3Q20 4Q20 1Q21 2Q21 3Q21 1 Includes Company-Owned Loans and Loans Guarant
Slide 18: Expense Run-rates Affected by Strategic Acquisitions
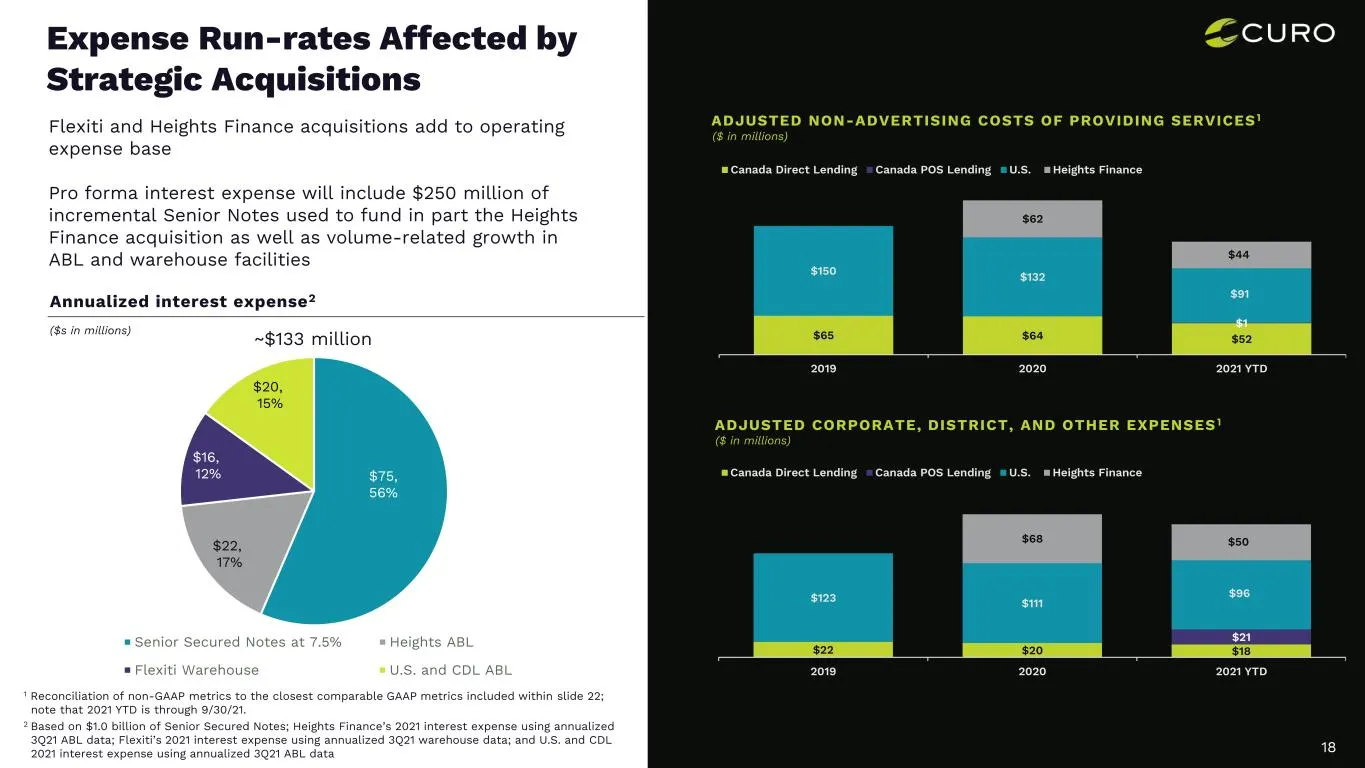
Expense Run-rates Affected by Strategic Acquisitions 18 Flexiti and Heights Finance acquisitions add to operating expense base Pro forma interest expense will include $250 million of incremental Senior Notes used to fund in part the Heights Finance acquisition as well as volume-related growth in ABL

Slide 19: Appendix
19 Appendix
Slide 20: Historical Consolidated Adjusted EBITDA Reconciliation
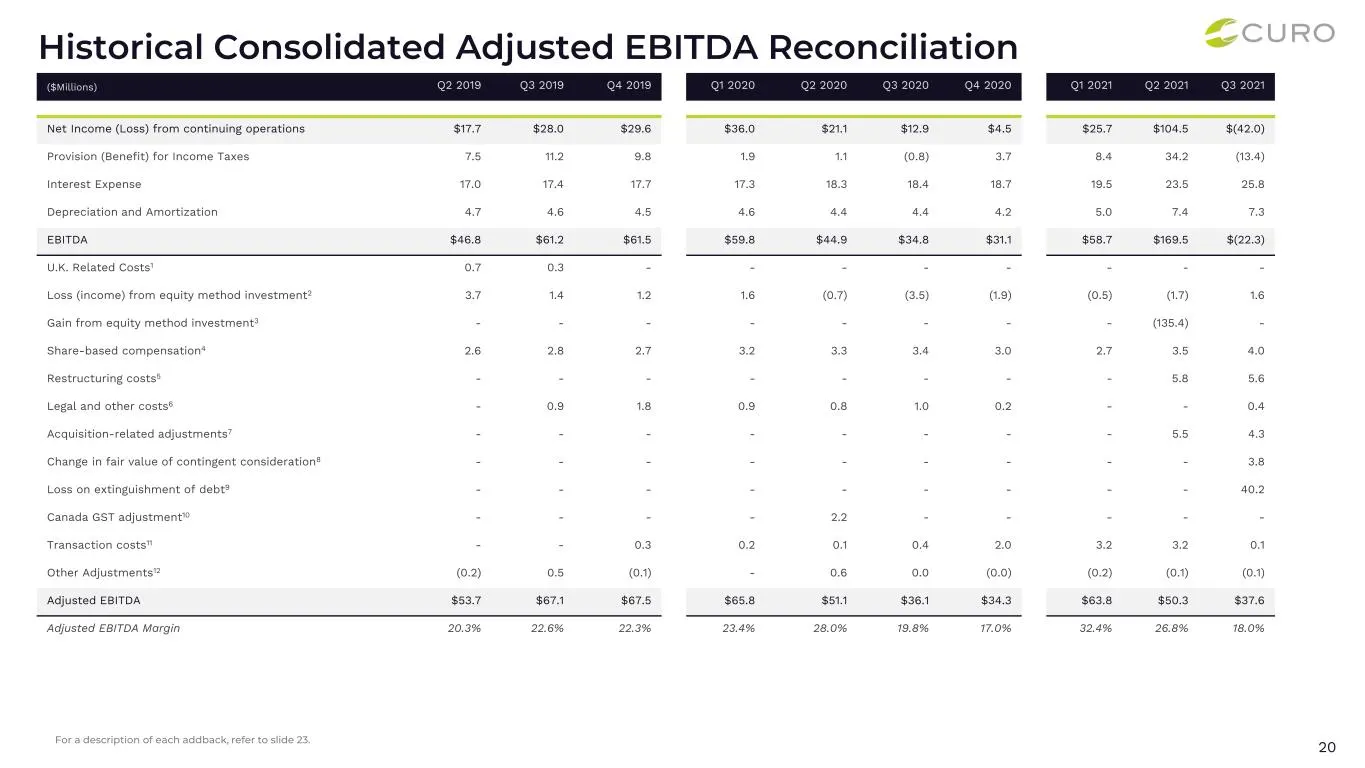
20 Historical Consolidated Adjusted EBITDA Reconciliation ($Millions) Q2 2019 Q3 2019 Q4 2019 Q1 2020 Q2 2020 Q3 2020 Q4 2020 Q1 2021 Q2 2021 Q3 2021 Net Income (Loss) from continuing operations $17.7 $28.0 $29.6 $36.0 $21.1 $12.9 $4.5 $25.7 $104.5 $(42.0) Provision (Benefit) for Income Taxes 7.5 11
Slide 21: Historical Consolidated Adjusted Net Income Reconciliation
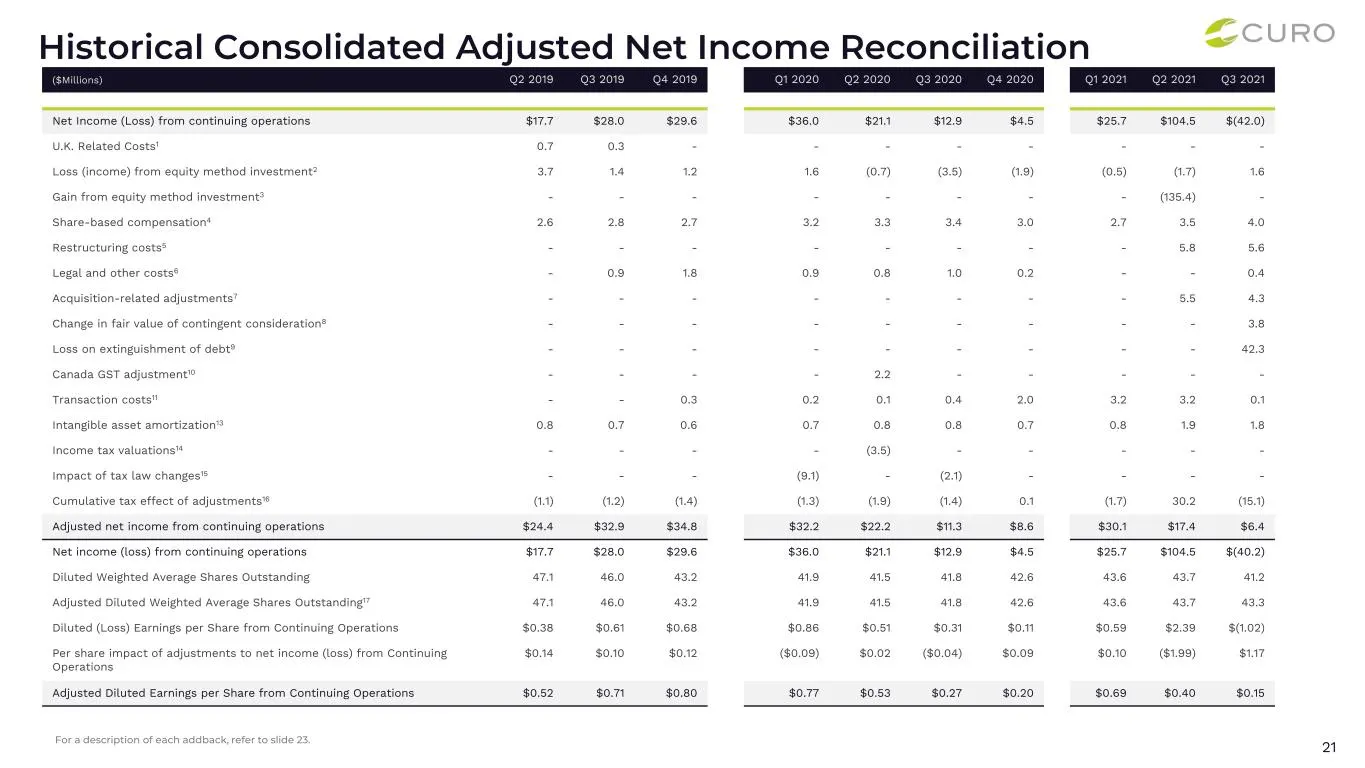
21 Historical Consolidated Adjusted Net Income Reconciliation ($Millions) Q2 2019 Q3 2019 Q4 2019 Q1 2020 Q2 2020 Q3 2020 Q4 2020 Q1 2021 Q2 2021 Q3 2021 Net Income (Loss) from continuing operations $17.7 $28.0 $29.6 $36.0 $21.1 $12.9 $4.5 $25.7 $104.5 $(42.0) U.K. Related Costs1 0.7 0.3 - - - - - -
Slide 22: Adjusted Operating Expense Reconciliation
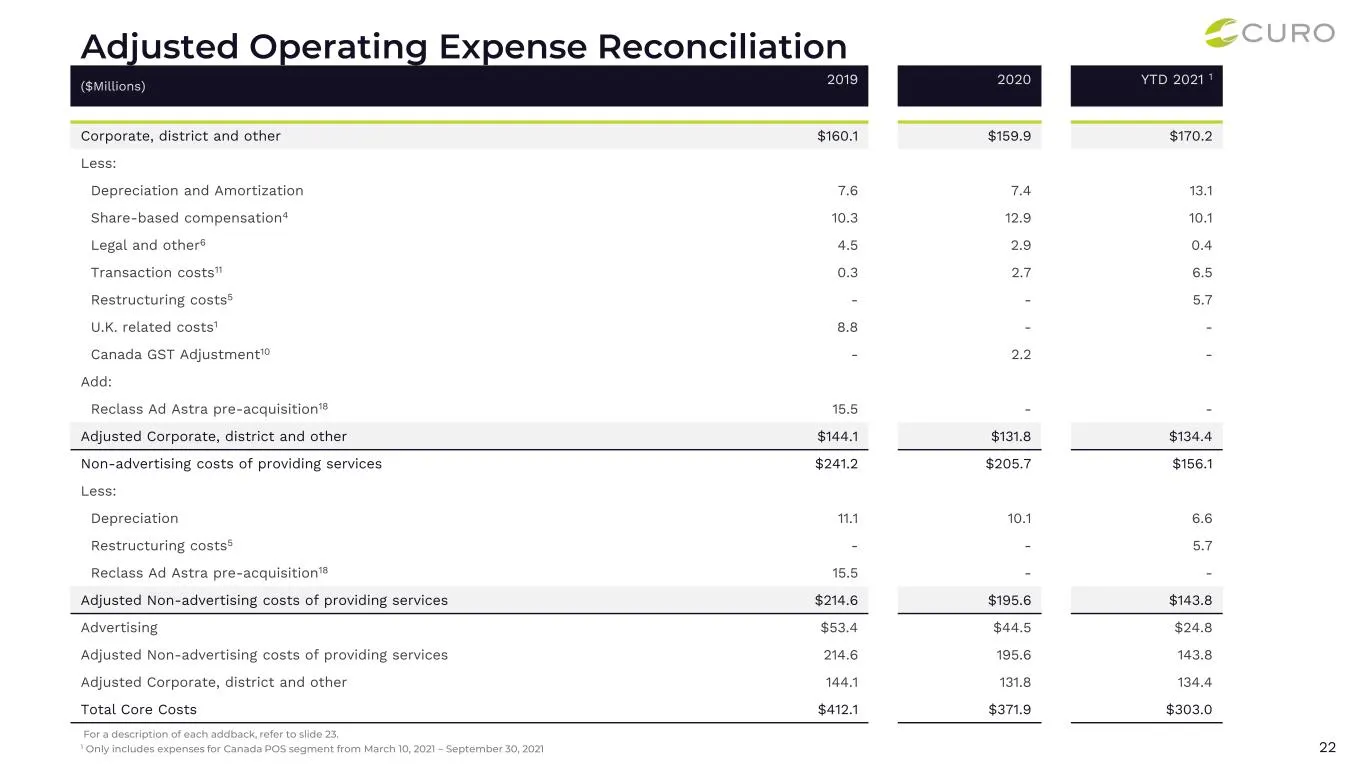
22 Adjusted Operating Expense Reconciliation ($Millions) 2019 2020 YTD 2021 1 Corporate, district and other $160.1 $159.9 $170.2 Less: Depreciation and Amortization 7.6 7.4 13.1 Share-based compensation4 10.3 12.9 10.1 Legal and other6 4.5 2.9 0.4 Transaction costs11 0.3 2.7 6.5 Restructuring costs5
Slide 23: Reconciliation footnotes
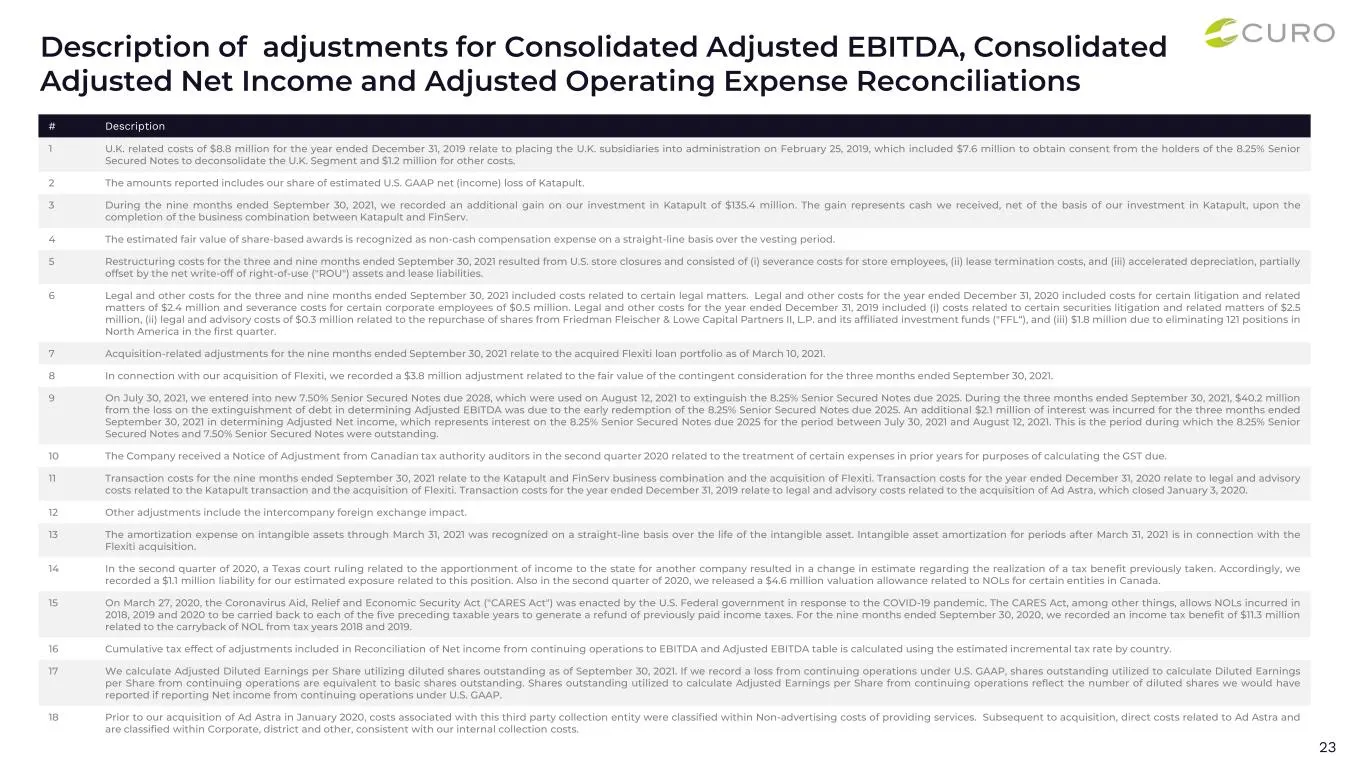
23 # Description 1 U.K. related costs of $8.8 million for the year ended December 31, 2019 relate to placing the U.K. subsidiaries into administration on February 25, 2019, which included $7.6 million to obtain consent from the holders of the 8.25% Senior Secured Notes to deconsolidate the U.K. Segm
Slide 24: Historical Gross Combined Loan Receivables
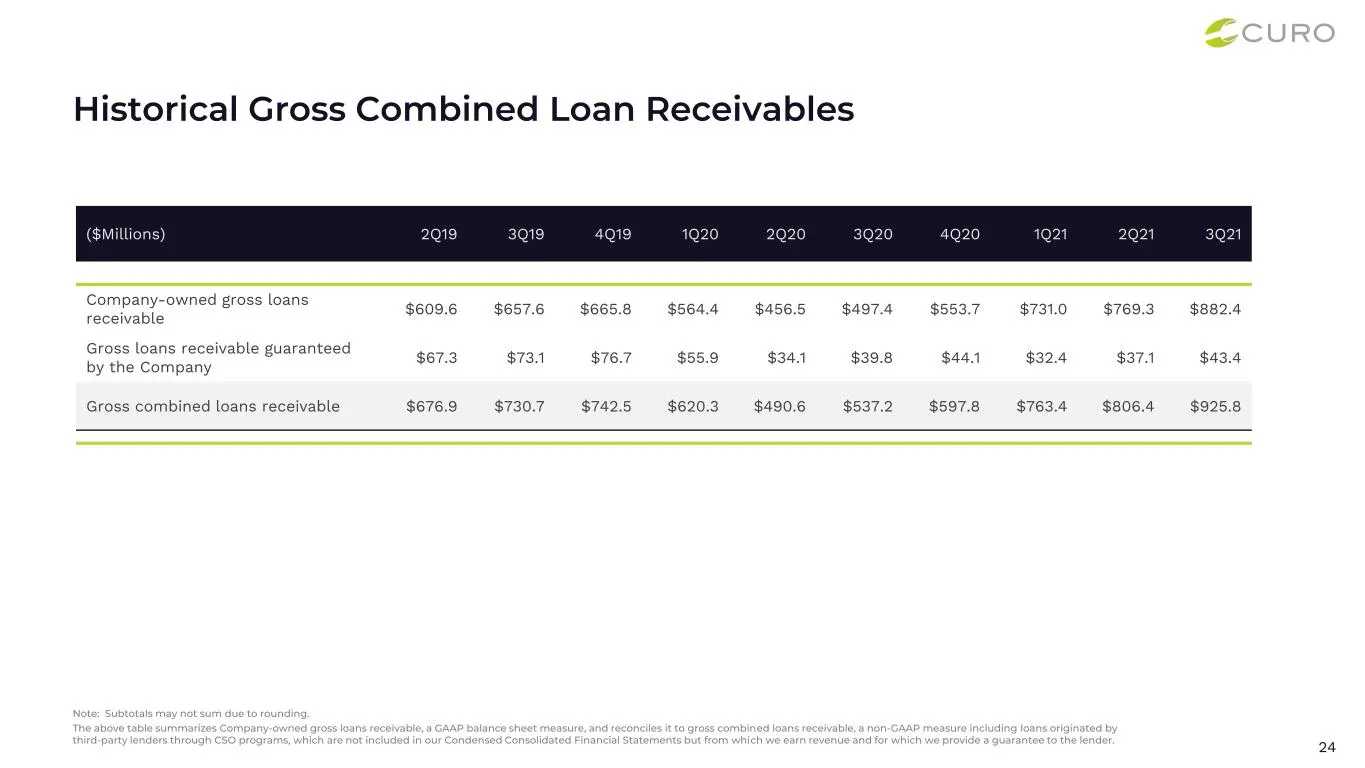
24 Historical Gross Combined Loan Receivables ($Millions) 2Q19 3Q19 4Q19 1Q20 2Q20 3Q20 4Q20 1Q21 2Q21 3Q21 Company-owned gross loans receivable $609.6 $657.6 $665.8 $564.4 $456.5 $497.4 $553.7 $731.0 $769.3 $882.4 Gross loans receivable guaranteed by the Company $67.3 $73.1 $76.7 $55.9 $34.1 $39.8

Slide 25: CURO
42—~CURO
Source: SEC EDGAR · 8-K filed Dec 1, 2021
More decks from Curo Group Holdings Corp
 Q4 2023 Earnings Presentation21 slides · Feb 12, 2024
 Investor Presentation (November 2023)15 slides · Nov 13, 2023
 Q3 2023 Earnings Presentation20 slides · Nov 2, 2023
 Debt Investor Presentation (October 2023)21 slides · Oct 23, 2023
 Investor Presentation (September 2023)15 slides · Sep 25, 2023
 Q2 2023 Earnings Presentation21 slides · Aug 3, 2023