KNBT Bancorp — Ferris, Baker Watts, Inc. Community Bank Conference 2006
32 slides from KNBT Bancorp's conference presentation, Jul 27, 2006
Slide 1: Ferris, Baker Watts Community Bank Conference
Ferris, Baker Watts, Inc. - Community Bank Conference Hershey, Pennsylvania July 27, 2006

Slide 2: Disclaimer
Disclaimer The information contained in this presentation may contain forward-looking statements (as defined in the Securities Exchange Act of 1934 and the regulations thereunder) which are not historical facts or as to KNBT Bancorp, Inc. (“KNBT” or the “Company”) management’s intentions, plans, bel

Slide 3: KNBT's Profile
KNBT’s Profile § Headquartered in Bethlehem, Pennsylvania § Total assets of $3.0 billion § The largest community bank based in the Greater Lehigh Valley and Northeast Pennsylvania Regions with 58 branch locations § Traded on the NASDAQ Global Market under the symbol “KNBT”

Slide 4: Services
Services § KNBT provides a full range of traditional banking services through its branch network and electronic delivery channels § KNBT also offers: – A full menu of investment products and services – Estate, personal trust and financial planning – Insurance services – Benefits management

Slide 5: Strong Business Model
Strong Business Model § KNBT has developed a strong business model for all lines of business – Banking, Insurance, Investments & Trust § Employees are united by a proud tradition of delivering excellent customer service that sets us apart from the competition § KNBT has invested in a state of the ar

Slide 6: KNBT's M&A Activity
KNBT’s M&A Activity Target Year Completed First Colonial Group 2003 Oakwood Financial Corp. 2004 Caruso Benefits Group, Inc. 2005 Northeast Pennsylvania Financial Corp. 2005 Trust Company of Lehigh Valley 2006
Slide 7: Our Locations
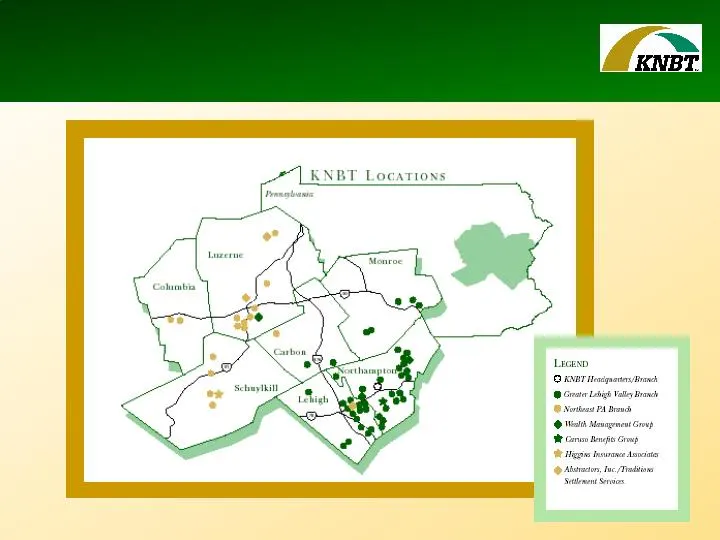
Our Locations

Slide 8: Attractive Region
Attractive Region * Source: Morning Call 7/ 17/ 05, Lehigh Valley Metro Area: Northampton, Lehigh, Carbon Counties in PA and Warren County in NJ, based on 2000 U.S. Census. § The Lehigh Valley metro statistical area is the third largest in population in Pennsylvania* § Lehigh Valley is ranked third
Slide 9: Market Share
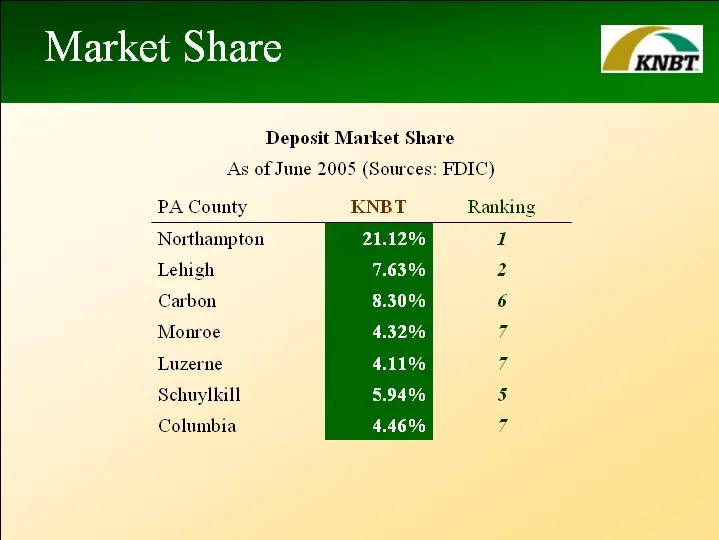
Market Share Deposit Market Share As of June 2005 (Sources: FDIC) PA County KNBT Ranking Northampton 1 Lehigh 2 Carbon 6 Monroe 7 Luzerne 2 Schuylkill 5 Columbia
Slide 10: Dividends
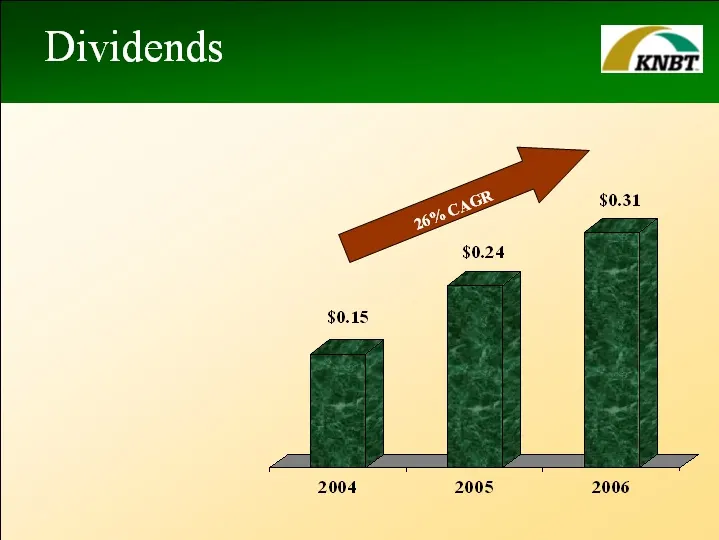
§ Initiated quarterly dividends in 2Q2004 § Approximately $15.8 million has been paid to shareholders

Slide 11: Stock Repurchase Plans
As of 7/19/06 KNBT repurchased a total of 6,222,100 shares at an average price per share of $16.11 Stock Repurchase Plans § Announced repurchase of 3,062,486 shares 10/27/04 – Completed 9/15/04 § Announced repurchase of 3,151,297 shares 7/27/05 – Completed 7/19/06 § Announced repurchase of 2,807,219

Slide 12: Financial Overview
Eugene T. Sobol, Sr. EVP, CFO & Treasurer Financial Overview

Slide 13: Financial Highlights
Financial Highlights For the Quarter Ended June 30, June 30, % (dollars in thousands, except per share data) 2005 2006 Change Net Income $5,238 $5,906 12.75% Diluted Earnings Per Share $0.18 $0.21 16.67% Dividends Paid Per Share $0.06 $0.08 33.33% Book Value $13.54 $12.83 -5.24% Tangible Book Value

Slide 14: Key Ratios
Key Ratios For the Quarter Ended June 30, June 30, (dollars in thousands, except per share data) 2005 2006 Return on Average Assets 0.76% 0.79% Return on Average Equity 5.35% 6.62% Return on Average Tangible Equity 7.26% 10.77% Net Interest Margin T/E 3.00% 2.90% Efficiency Ratio 66.18% 64.95% Equit
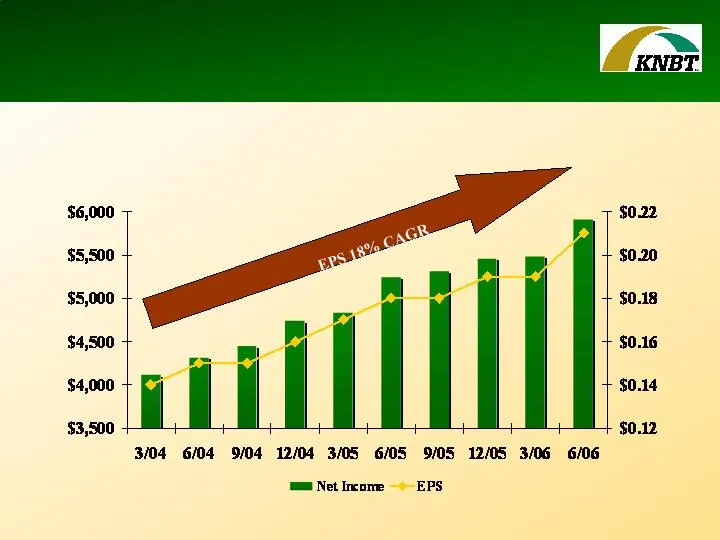
Slide 15: Net Income and EPS
Net Income and EPS $ in thousands, except per share amounts
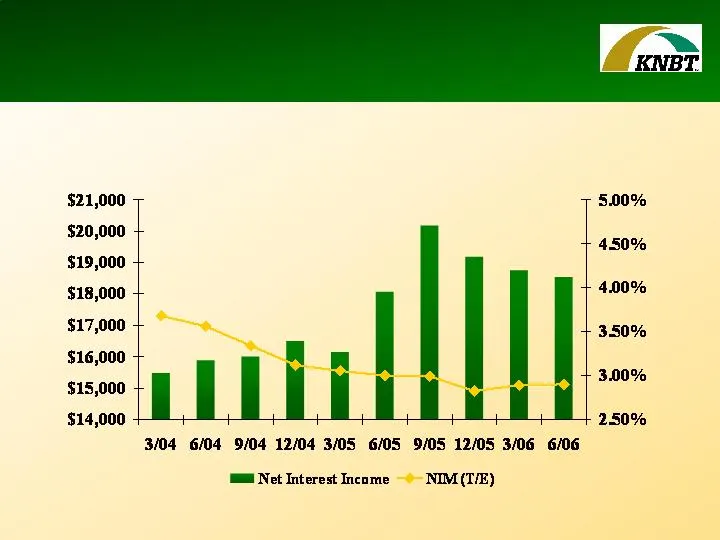
Slide 16: Net Interest Income and Net Interest Margin (T/E)
Net Interest Income and Net Interest Margin (T/E) $ in thousands
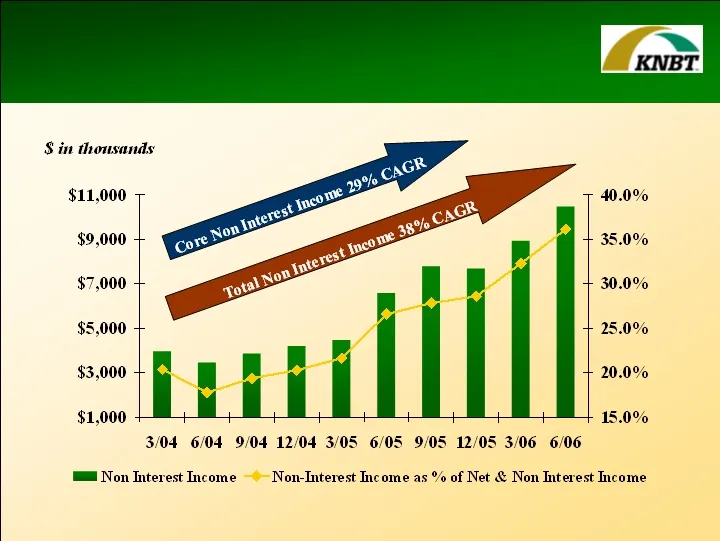
Slide 17: Non-Interest Income
Sin thousands $11,000 $9,000 $7,000 $5,000 x 4] $3,000 | | \ 20.0% $1,000 M | 15.0% 3/04 6/04 9/04 12/04 3/05 6/05 9/05 12/05 3/06 6/06 MH Non Interest Income ~*~ Non-Interest Income as % of Net & Non Interest Income
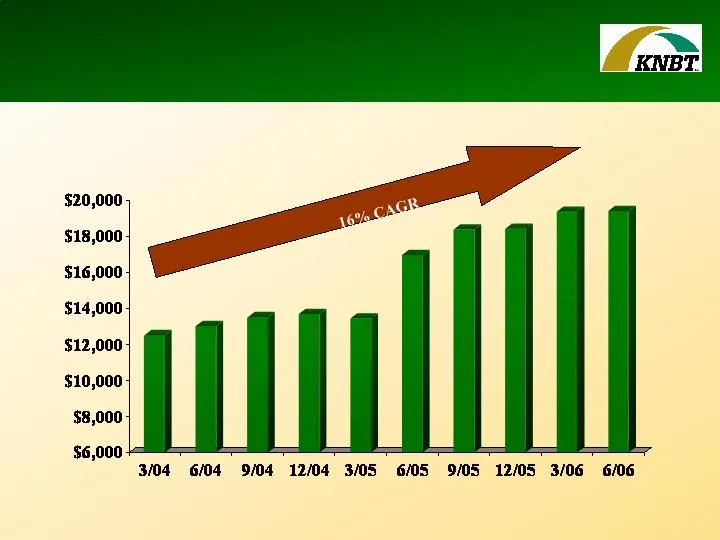
Slide 18: Non-Interest Expense
Non-Interest Expense $ in thousands

Slide 19: Balance Sheet
Balance Sheet At At December 31, June 30, Annualized (dollars in thousands) 2005 2006 % Change Total Assets $3,081,810 $2,994,485 -5.67% Securities 1,206,880 1,022,900 -30.49% Loans 1,481,728 1,540,447 7.93% Deposits 1,852,251 1,912,797 6.54% FHLB Advances 705,125 613,487 -25.99% Shareholders’ Equit
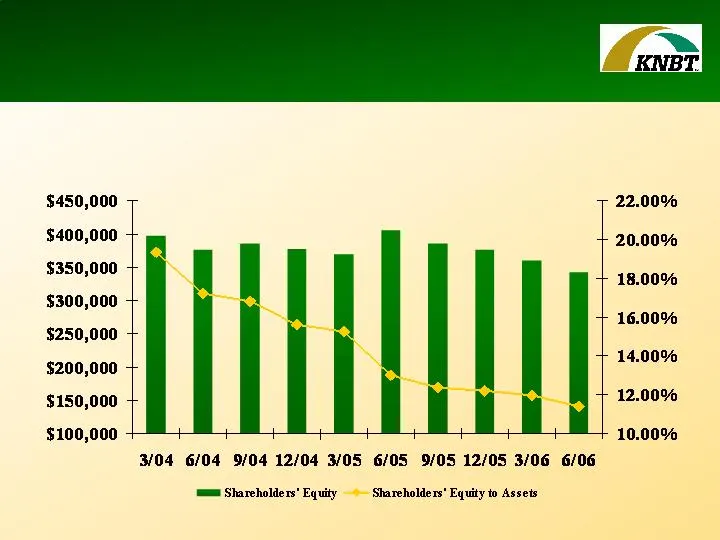
Slide 20: Shareholders' Equity
Shareholders’ Equity $ in thousands
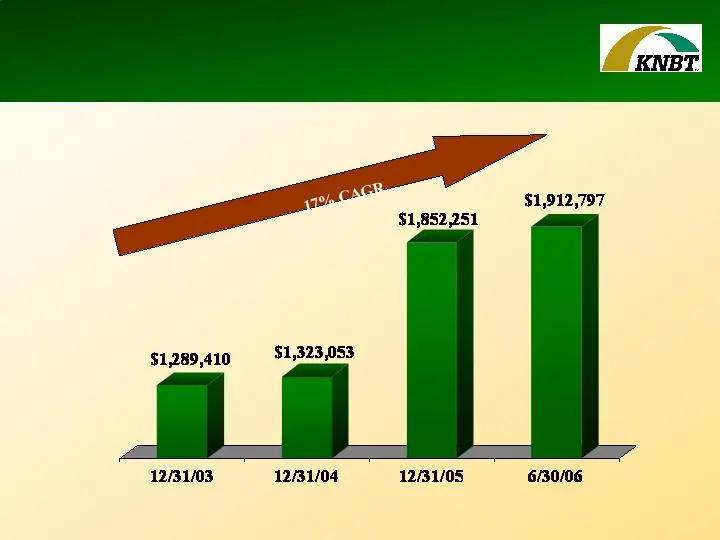
Slide 21: Deposit Growth
Deposit Growth $ in thousands
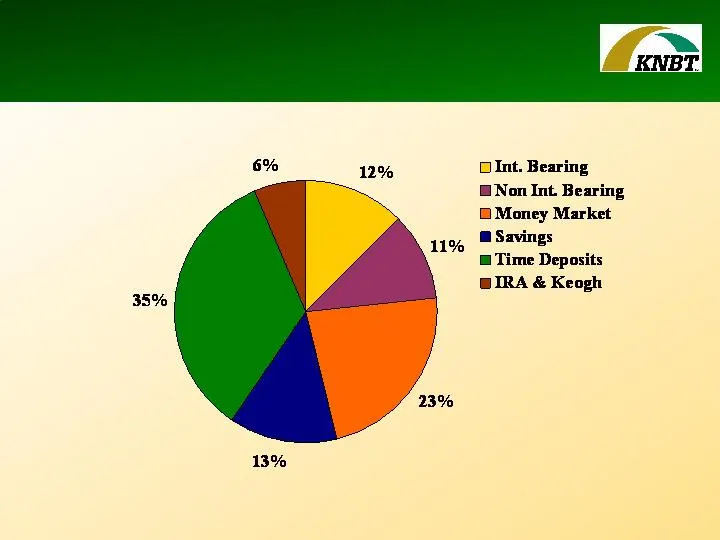
Slide 22: Composition of Deposits At 6/30/06
Composition of Deposits At 6/30/06

Slide 23: Loans & Asset Quality
Sandra L. Bodnyk, Sr. EVP, Chief Risk Officer Loans & Asset Quality
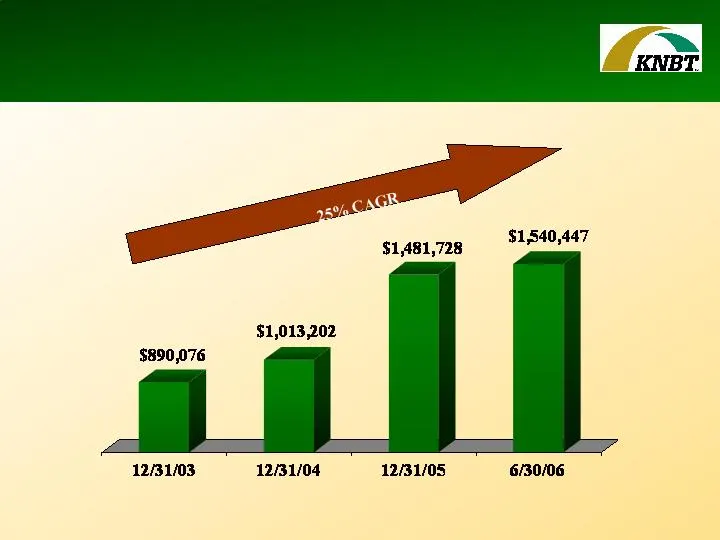
Slide 24: Loan Growth
siasi72g S1S40447 $1,013,202 $890,076 g = a 12/31/03 12/31/04 12/31/05 6/30/06
Slide 25: Loan Composition
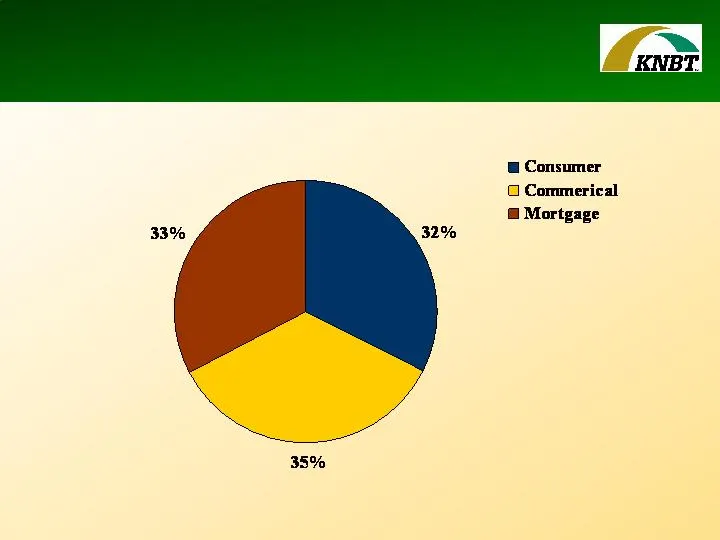
@ Consumer G Commerical @ Mortgage 33% 32% 35%
Slide 26: Strong Underwriting Standards
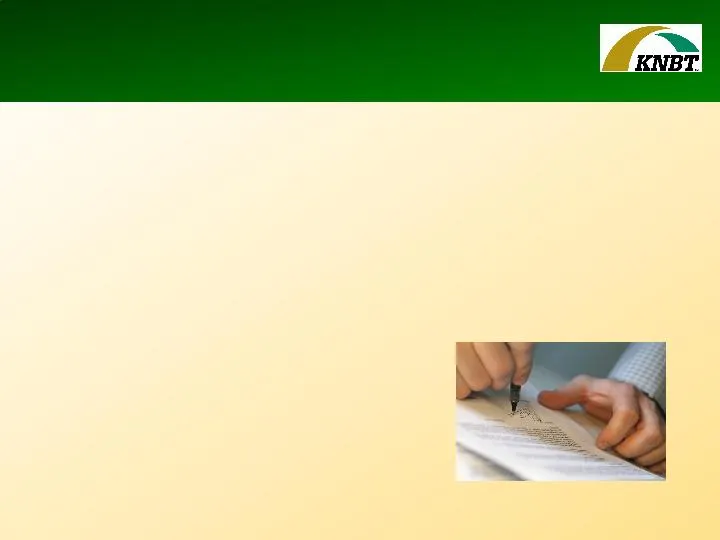
Strong Underwriting Standards § Strong credit risk management § Seasoned lenders § Comprehensive approval process § Knowledge of market § Strong borrower relationships
Slide 27: Total Non-Performing Loans
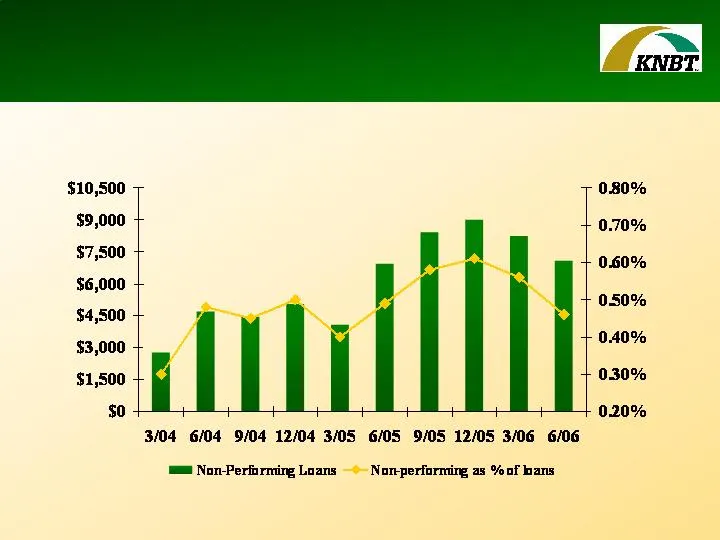
Total Non-Performing Loans $ in thousands
Slide 28: Allowance for Loan Losses
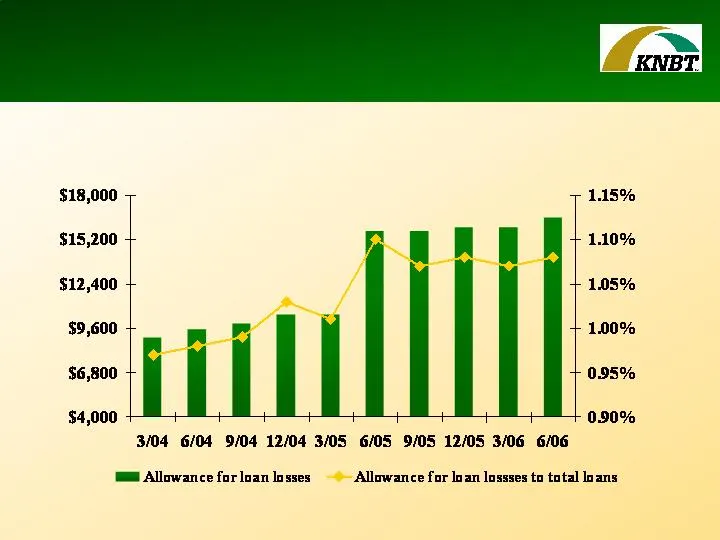
Allowance for Loan Losses $ in thousands

Slide 29: Closing Comments
Scott V. Fainor, President & CEO Closing Comments
Slide 30: Our Team
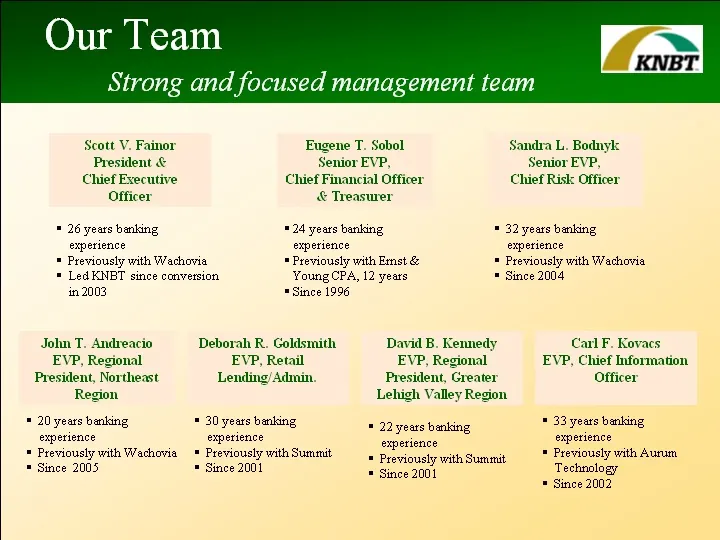
Our TeamStrong and focused management teamScott V. FainorPresident & Chief Executive Officer26 years banking experience Previously with Wachovia Led KNBT since conversion in 2003 Eugene T. SobolSenior EVP, Chief Financial Officer & Treasurer24 years banking experiencePreviously with Ernst & Young CP
Slide 31: Goals for Success
Goals for Success § Grow core deposit relationships § Grow and diversify loan portfolio § Grow and diversify fee income § Manage expenses and improve efficiency § Franchise expansion through organic growth, de novo acquisitions
Slide 32: KNBT Banking Insurance Investments
BANKING INSURANCE INVESTMENTS KNBT. sus:
Source: SEC EDGAR · 8-K filed Jul 27, 2006
More decks from KNBT Bancorp Inc
 Bank Director Magazine "Acquire or Be Acquired" Conference 200810 slides · Jan 28, 2008
 Q4 2007 Earnings Presentation7 slides · Jan 22, 2008
 Sandler O'Neill & Partners East Coast Financial Services Conference (November 2007)32 slides · Nov 13, 2007
 Q3 2007 Earnings Presentation9 slides · Oct 16, 2007
 Investor Presentation (August 2007)25 slides · Aug 8, 2007
 Shareholder Meeting (May 2007)20 slides · May 3, 2007