Mr. Cooper — Nationstar Mortgage Holdings — Q1 2018 Earnings Presentation
13 slides from Mr. Cooper's earnings presentation, May 4, 2018
Slide 1: First Quarter 2018 Results Investor Supplement
FIRST QUARTER 2018 RESULTS MAY 3, 2018 INVESTOR SUPPLEMENT Exhibit 99.1
Slide 2: Important Information
IMPORTANT INFORMATION This presentation contains summarized information concerning Nationstar Mortgage Holdings Inc. (the “Company”) and the Company’s business, operations, financial performance and trends. No representation is made that the information in this presentation is complete. For addition
Slide 3: Proposed merger transaction legal notice
This communication is being made in respect of the proposed merger transaction involving WMIH Corp. (“WMIH”) and Nationstar Mortgage Holdings Inc. (“Nationstar”). WMIH has filed a registration statement on Form S-4 with the SEC on March 22, 2018, which includes a preliminary joint proxy statement of
Slide 4: Nationstar at a Glance
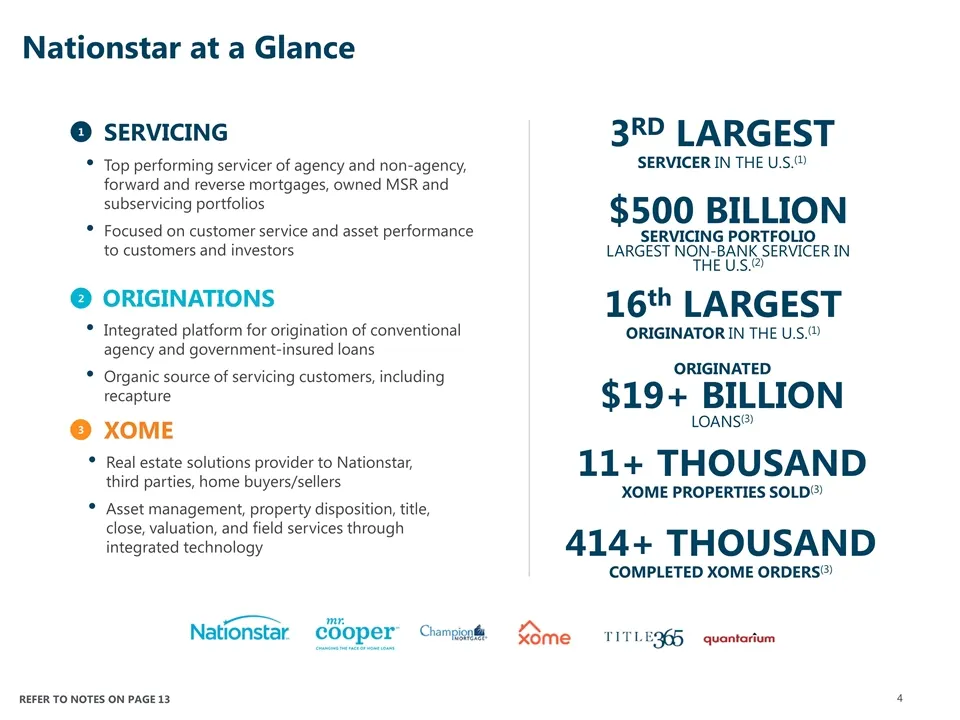
SERVICING ORIGINATIONS XOME Top performing servicer of agency and non-agency, forward and reverse mortgages, owned MSR and subservicing portfolios Focused on customer service and asset performance to customers and investors Integrated platform for origination of conventional agency and government-in
Slide 5: WMIH Transaction Overview
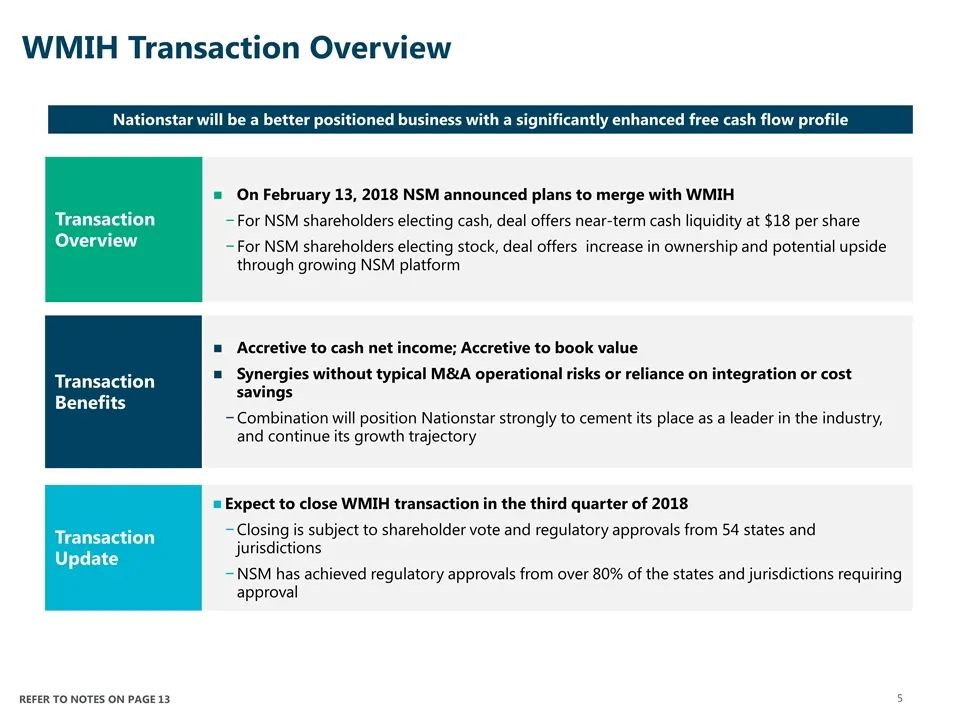
REFER TO NOTES ON PAGE 13 WMIH Transaction Overview Nationstar will be a better positioned business with a significantly enhanced free cash flow profile Transaction Benefits Accretive to cash net income; Accretive to book value Synergies without typical M&A operational risks or reliance on integrati
Slide 6: Financial Overview
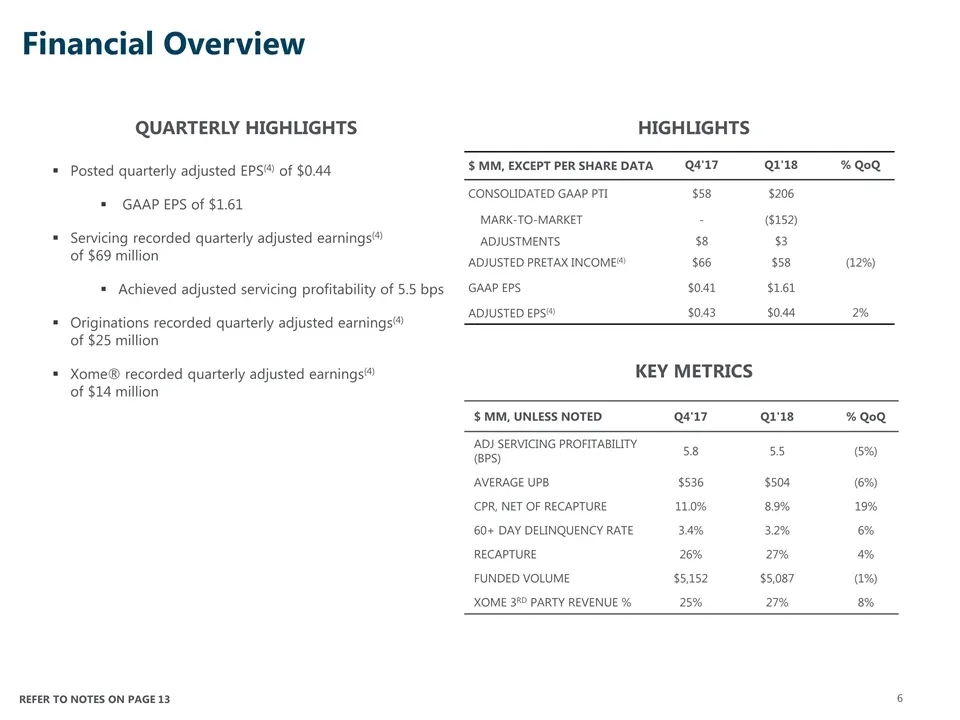
$ MM, EXCEPT PER SHARE DATA Q4'17 Q1'18 % QoQ CONSOLIDATED GAAP PTI $58 $206 MARK-TO-MARKET - ($152) ADJUSTMENTS $8 $3 ADJUSTED PRETAX INCOME(4) $66 $58 (12%) GAAP EPS $0.41 $1.61 ADJUSTED EPS(4) $0.43 $0.44 2% Posted quarterly adjusted EPS(4) of $0.44 GAAP EPS of $1.61 Servicing recorded quarterly
Slide 7: Servicing – the Foundation of our Business
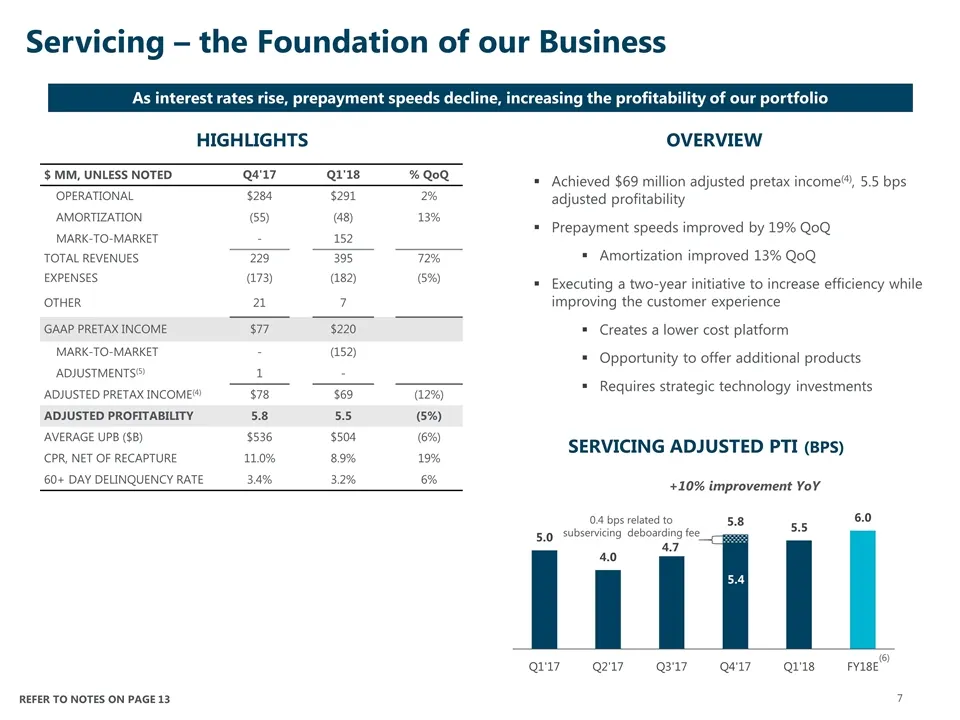
Servicing – the Foundation of our Business HIGHLIGHTS $ MM, UNLESS NOTED Q4'17 Q1'18 % QoQ OPERATIONAL $284 $291 2% AMORTIZATION (55) (48) 13% MARK-TO-MARKET - 152 TOTAL REVENUES 229 395 72% EXPENSES (173) (182) (5%) OTHER 21 7 GAAP PRETAX INCOME $77 $220 MARK-TO-MARKET - (152) ADJUSTMENTS(5) 1 - AD
Slide 8: Originations - Organic Creation of Servicing Assets at Attractive Margins
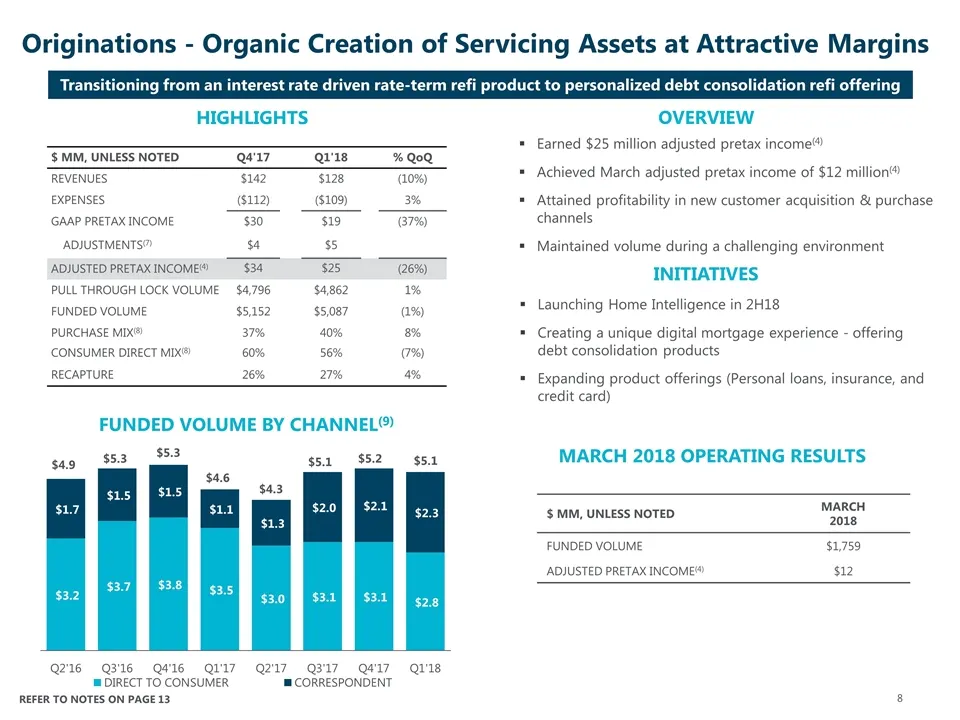
$ MM, UNLESS NOTED Q4'17 Q1'18 % QoQ REVENUES $142 $128 (10%) EXPENSES ($112) ($109) 3% GAAP PRETAX INCOME $30 $19 (37%) ADJUSTMENTS(7) $4 $5 ADJUSTED PRETAX INCOME(4) $34 $25 (26%) PULL THROUGH LOCK VOLUME $4,796 $4,862 1% FUNDED VOLUME $5,152 $5,087 (1%) PURCHASE MIX(8) 37% 40% 8% CONSUMER DIRECT
Slide 9: Building a customer acquisition machine for the next wave of consumer finance
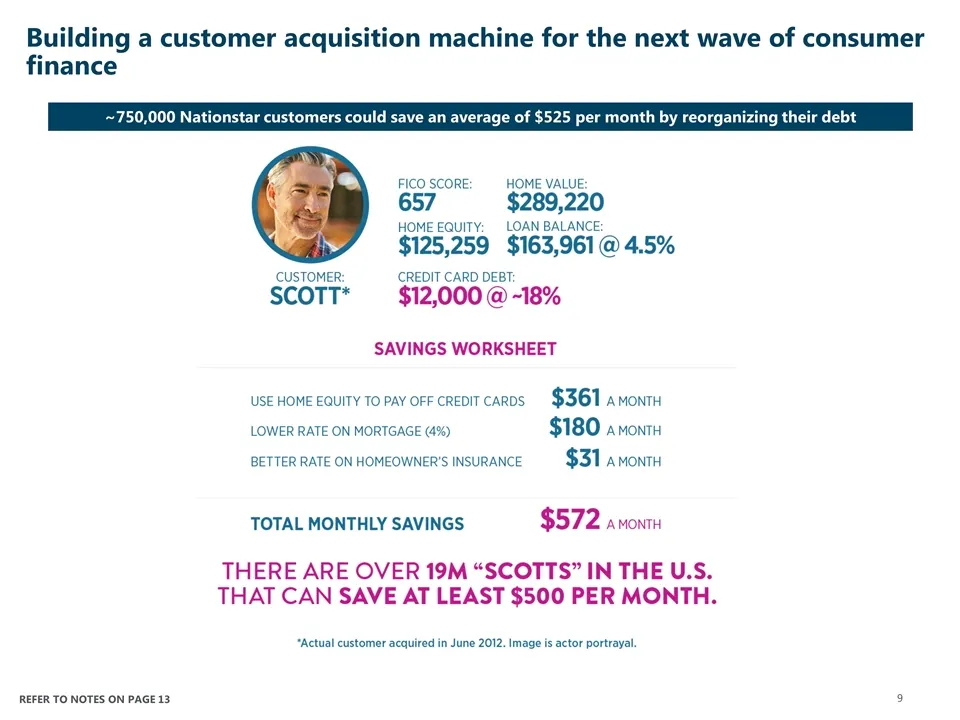
Building a customer acquisition machine for the next wave of consumer finance ~750,000 Nationstar customers could save an average of $525 per month by reorganizing their debt REFER TO NOTES ON PAGE 13
Slide 10: Xome results overview
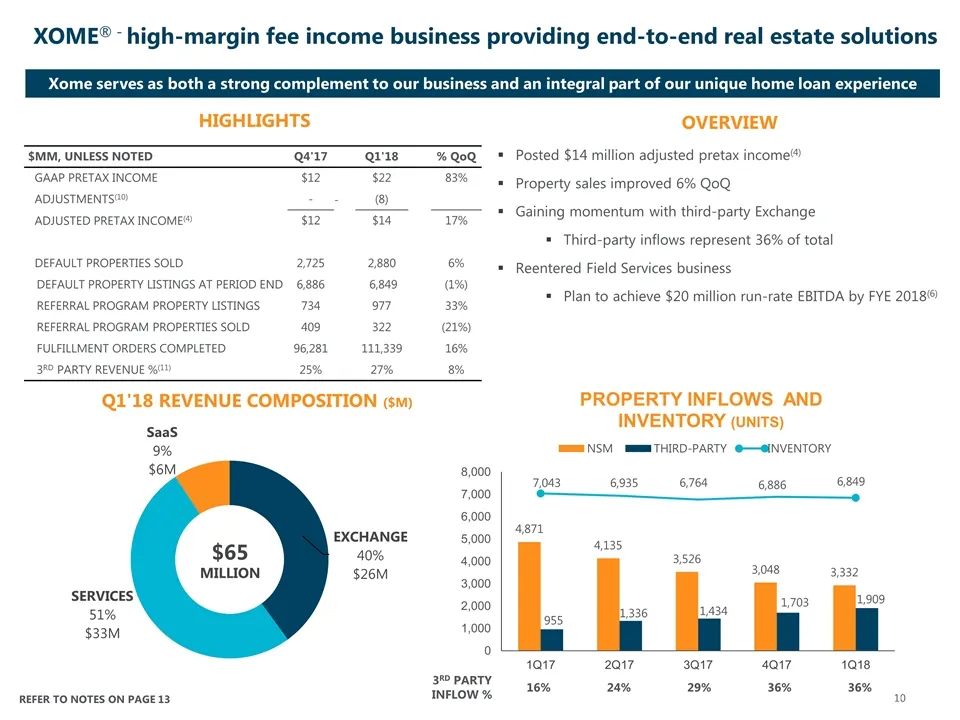
Posted $14 million adjusted pretax income(4) Property sales improved 6% QoQ Gaining momentum with third-party Exchange Third-party inflows represent 36% of total Reentered Field Services business Plan to achieve $20 million run-rate EBITDA by FYE 2018(6) OVERVIEW HIGHLIGHTS XOME® - high-margin fee i
Slide 11: 2018 Goals & Progress
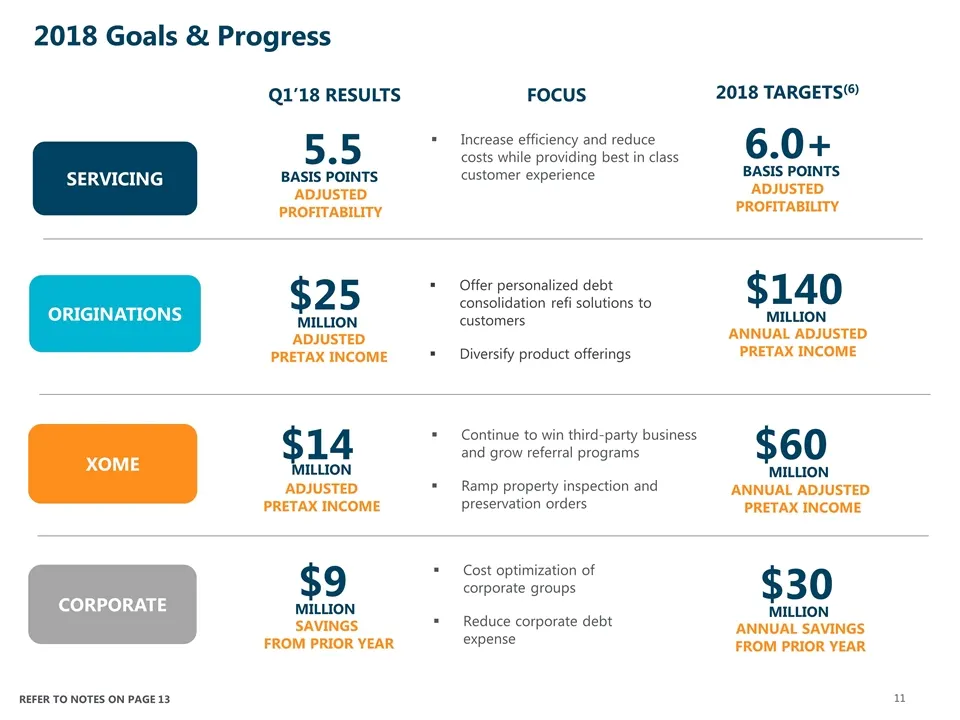
2018 Goals & Progress 2018 TARGETS(6) XOME ORIGINATIONS SERVICING 6.0+ ADJUSTED PROFITABILITY BASIS POINTS $140 ANNUAL ADJUSTED PRETAX INCOME MILLION $60 ANNUAL ADJUSTED PRETAX INCOME MILLION CORPORATE $30 ANNUAL SAVINGS FROM PRIOR YEAR MILLION 5.5 ADJUSTED PROFITABILITY BASIS POINTS $25 ADJUSTED PR
Slide 12: Servicing profitability in basis points
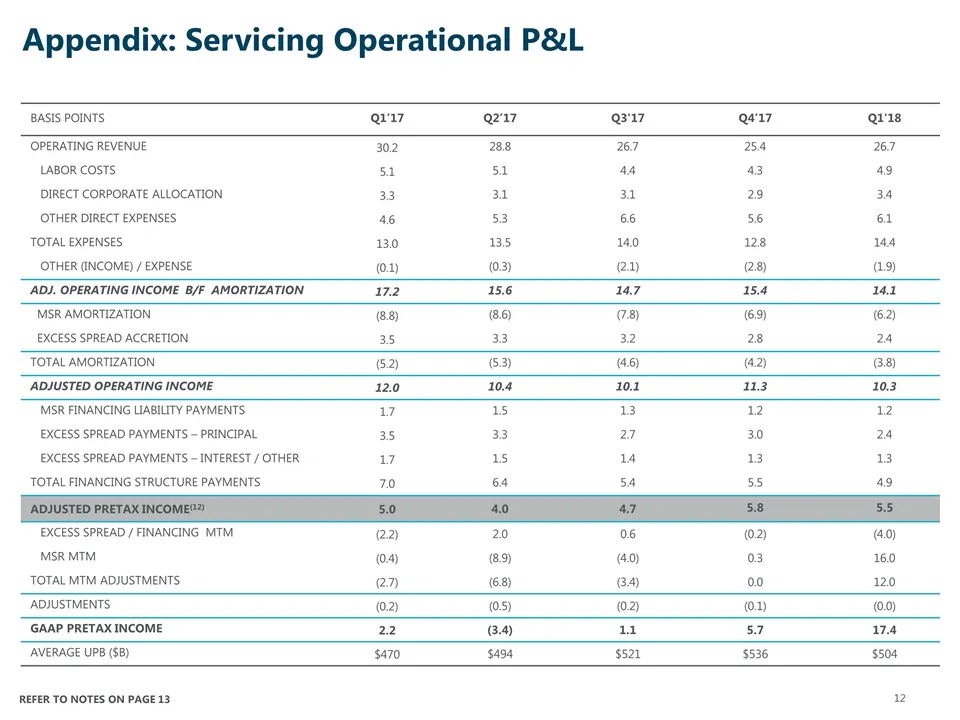
Basis points Q1’17 Q2’17 Q3'17 Q4’17 Q1'18 Operating Revenue 30.2 28.8 26.7 25.4 26.7 Labor costs 5.1 5.1 4.4 4.3 4.9 Direct corporate allocation 3.3 3.1 3.1 2.9 3.4 Other direct expenses 4.6 5.3 6.6 5.6 6.1 Total Expenses 13.0 13.5 14.0 12.8 14.4 Other (income) / expense (0.1) (0.3) (2.1) (2.8) (1.
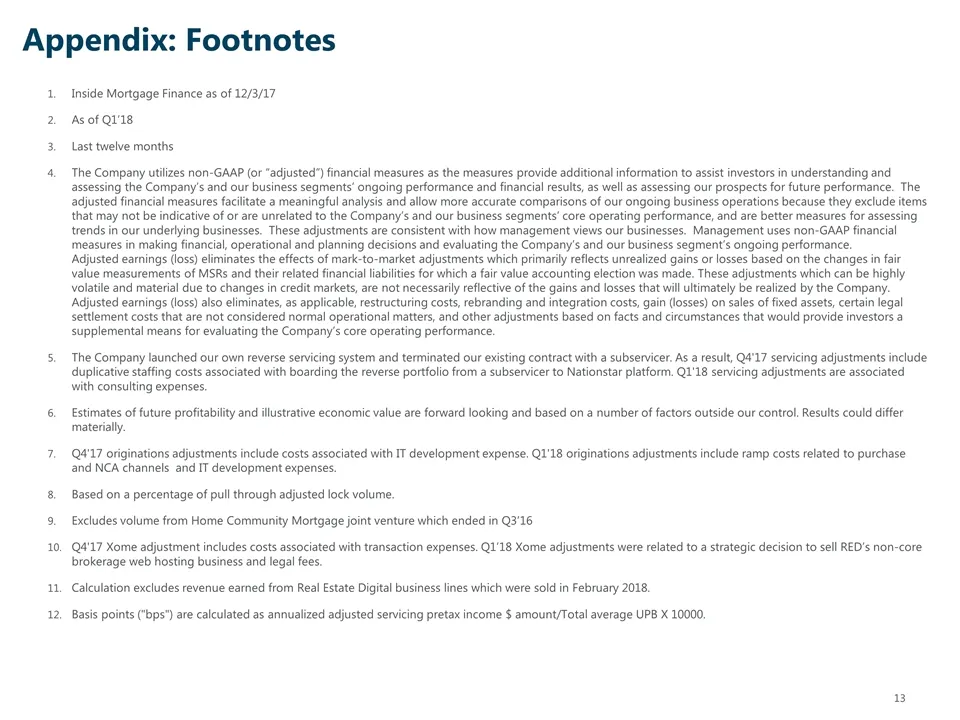
Slide 13: Appendix: Footnotes
Appendix: Footnotes Inside Mortgage Finance as of 12/3/17 As of Q1’18 Last twelve months The Company utilizes non-GAAP (or “adjusted”) financial measures as the measures provide additional information to assist investors in understanding and assessing the Company’s and our business segments’ ongoing
Source: SEC EDGAR · 425 filed May 4, 2018
More decks from Mr. Cooper Group Inc
 Q2 2025 Earnings Presentation25 slides · Jul 23, 2025
 Q1 2025 Earnings Presentation24 slides · Apr 23, 2025
 Merger or Acquisition (March 2025)23 slides · Mar 31, 2025
 Q4 2024 Earnings Presentation29 slides · Feb 12, 2025
 Q3 2024 Earnings Presentation29 slides · Oct 23, 2024
 Q2 2024 Earnings Presentation26 slides · Jul 25, 2024