LL Flooring — Lumber Liquidators Holdings — Credit Suisse Hardline Retail Roundup 2013
34 slides from LL Flooring's conference presentation, Dec 10, 2013
Slide 1: Credit Suisse Hardline Retail Roundup December 10, 2013
1 Credit Suisse Hardline Retail Roundup December 10, 2013
Slide 2: Safe Harbor Statement
2 Safe Harbor Statement The following information contains forward - looking statements . These forward looking statements are based on management’s expectations and beliefs concerning future events, and are subject to uncertainties, risks and factors relating to management’s operations and business
Slide 3: Lumber Liquidators Overview
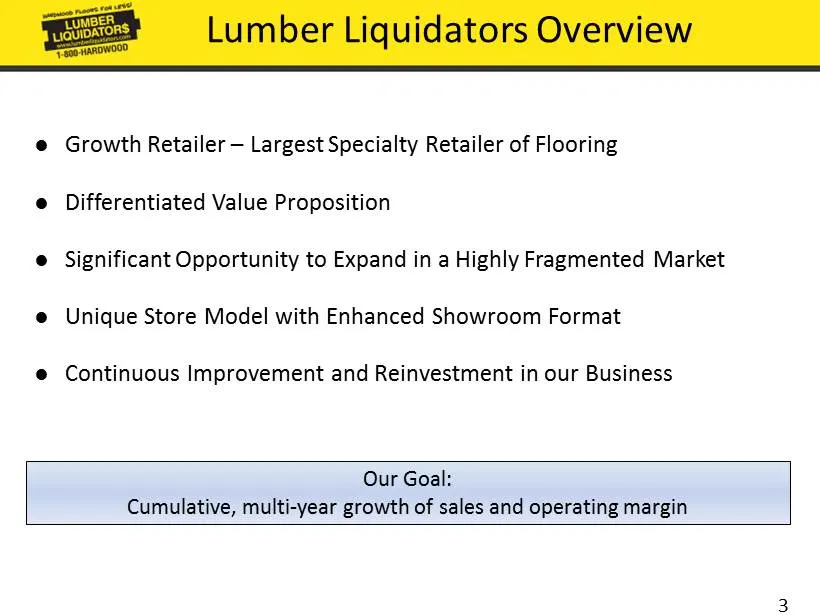
3 Lumber Liquidators Overview ● Growth Retailer – Largest Specialty Retailer of Flooring ● Differentiated Value Proposition ● Significant Opportunity to Expand in a Highly Fragmented Market ● Unique Store Model with Enhanced Showroom Format ● Continuous Improvement and Reinvestment in our Business O

Slide 4: Guidance & 2014 Initiatives
4 Guidance & 2014 Initiatives
Slide 5: Updated 2013 Guidance
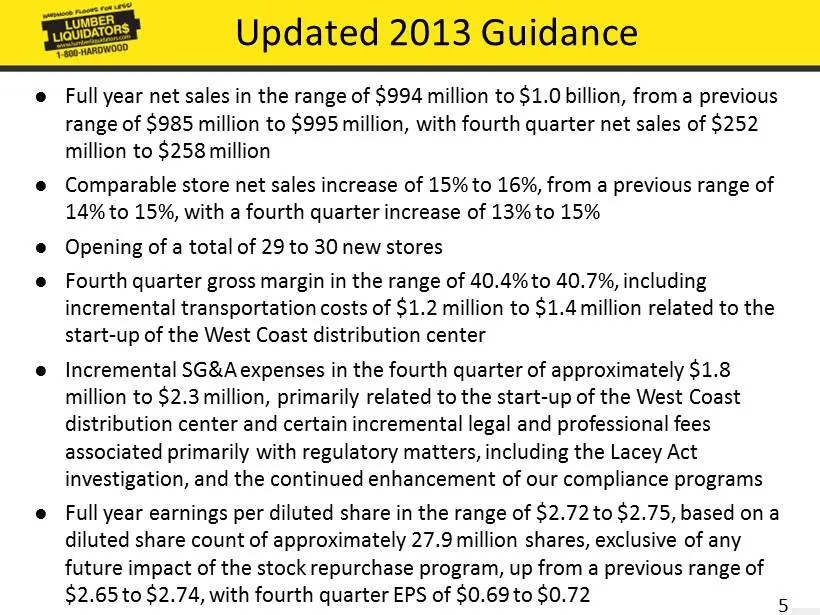
5 Updated 2013 Guidance ● Full year net sales in the range of $ 994 million to $1.0 billion, from a previous range of $985 million to $995 million, with fourth quarter net sales of $ 252 million to $258 million ● Comparable store net sales increase of 15% to 16%, from a previous range of 14% to 15%,
Slide 6: 2014 Key Initiatives
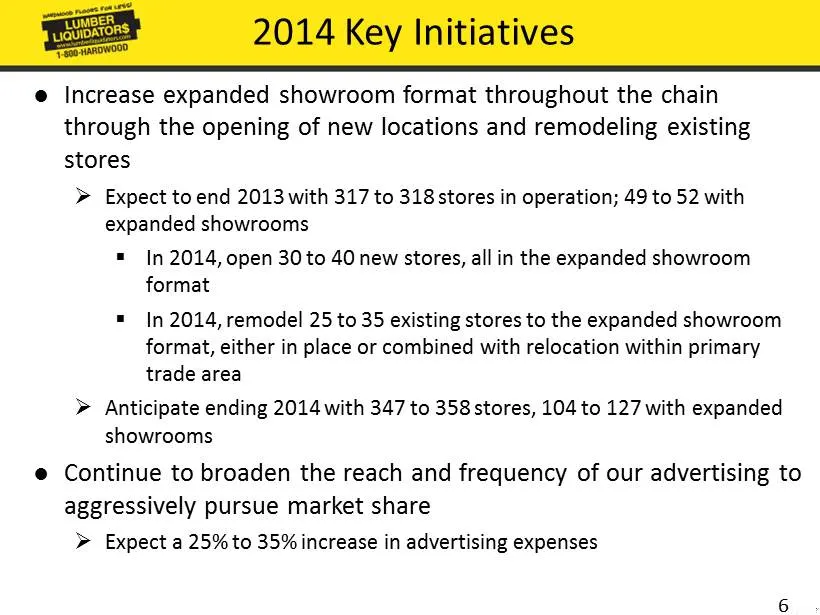
6 2014 Key Initiatives ● Increase expanded showroom format throughout the chain through the opening of new locations and remodeling existing stores » Expect to end 2013 with 317 to 318 stores in operation; 49 to 52 with expanded showrooms ▪ In 2014, open 30 to 40 new stores, all in the expanded show
Slide 7: 2014 Key Initiatives cont'd
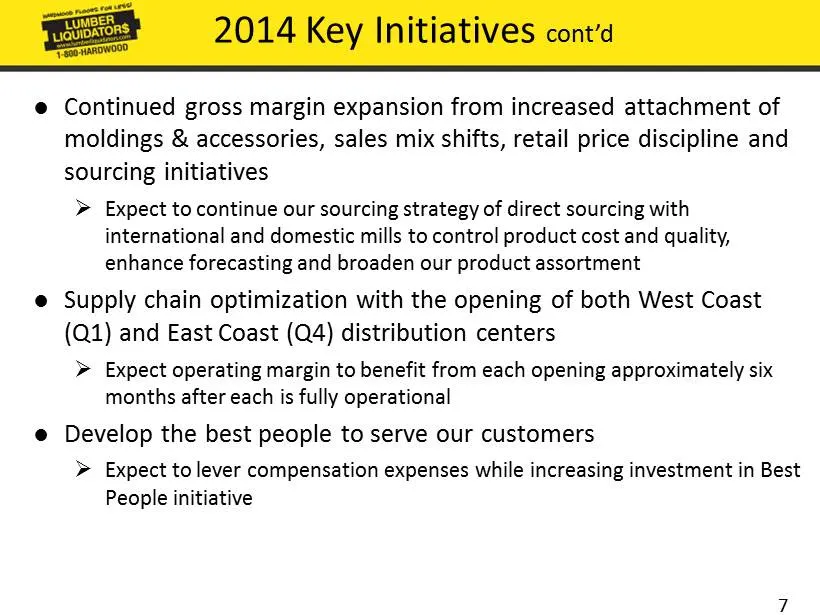
7 2014 Key Initiatives cont’d ● Continued gross margin expansion from increased attachment of moldings & accessories, sales mix shifts, retail price discipline and sourcing initiatives » Expect to continue our sourcing strategy of direct sourcing with international and domestic mills to control prod
Slide 8: Initial 2014 Guidance
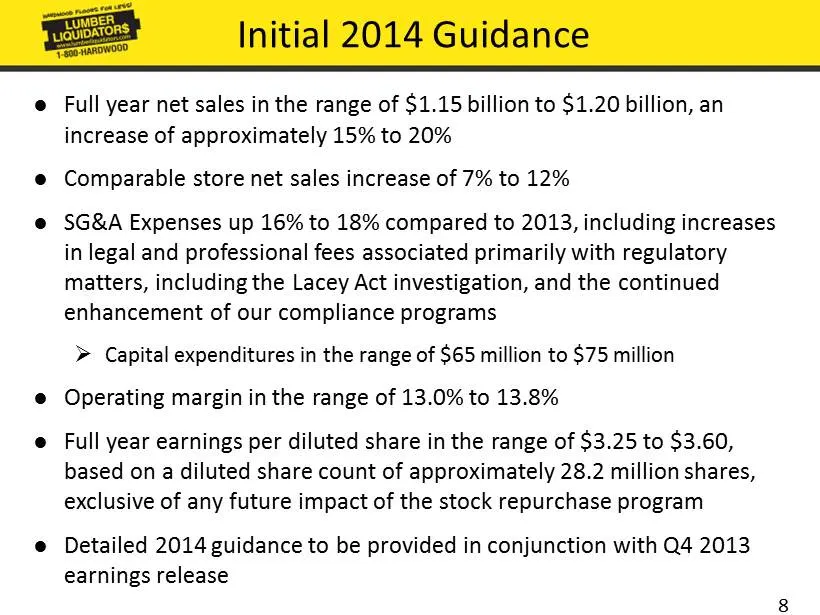
8 Initial 2014 Guidance ● Full year net sales in the range of $1.15 billion to $ 1.20 billion, an increase of approximately 15% to 20% ● Comparable store net sales increase of 7% to 12% ● SG&A Expenses up 16% to 18% compared to 2013, including increases in legal and professional fees associated prim
Slide 9: Strategic Initiatives
pagpwooD FLOORS FOR Less! 1-800-HARDWOOD Strategic Initiatives
Slide 10: Driving Continuous Improvement in Everything We Do
10 Driving Continuous Improvement in Everything We Do ● Grow revenue ● Drive traffic through advertising reach and frequency ● Enhance margin through sourcing initiatives ● Optimize our supply chain – operationally then structurally ● Develop the best people to serve our customers Strategy: Generate
Slide 11: Growth Retailer – Largest Specialty Retailer of Flooring
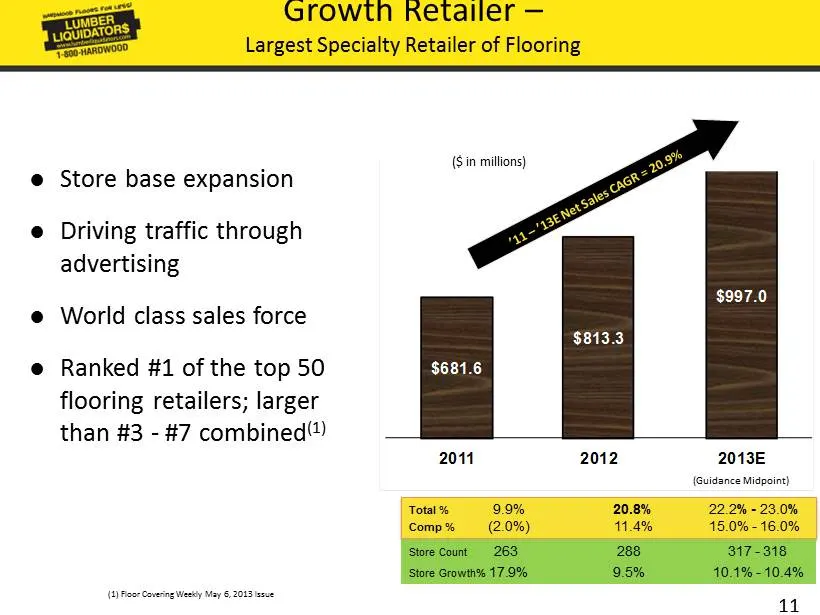
11 Growth Retailer – Largest Specialty Retailer of Flooring $681.6 $813.3 $997.0 2011 2012 2013E ($ in millions) (Guidance Midpoint) Total % 9.9% 20.8% 22.2 % - 23.0 % Comp % (2.0%) 11.4% 15.0% - 16.0% Store Count 263 288 317 - 318 Store Growth% 17.9% 9.5% 10.1% - 10.4% ● Store base expansion ● Driv
Slide 12: Differentiated Value Proposition
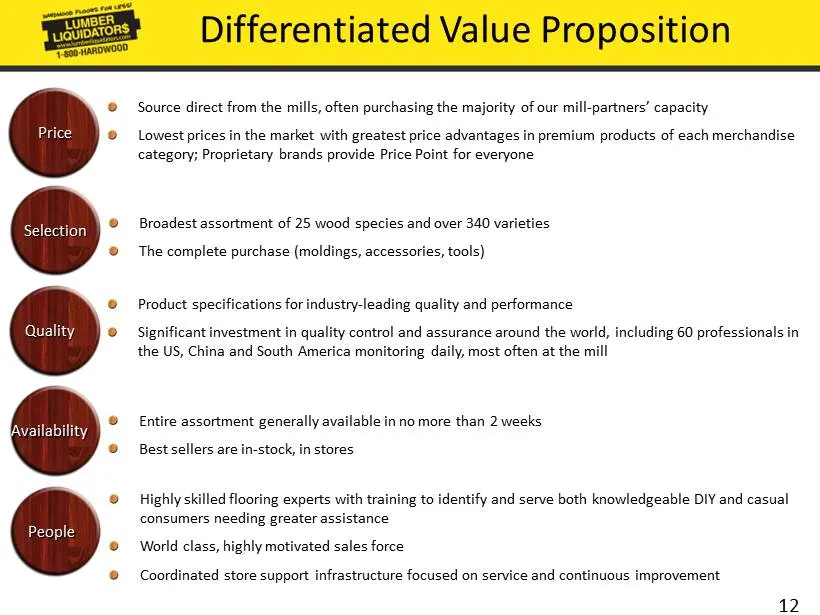
12 Highly skilled flooring experts with training to identify and serve both knowledgeable DIY and casual consumers needing greater assistance World class, highly motivated sales force Coordinated store support infrastructure focused on service and continuous improvement Availability Product specific
Slide 13: Significant Opportunity to Expand in a Highly Fragmented Market
13 Significant Opportunity to Expand in a Highly Fragmented Market ● 133 million housing units in the US with 75 million owner - occupied homes ● Since our IPO in 2007, we believe we have penetrated less than 3% of those owner - occupied homes ● Annual flooring sales of both hard and soft surfaces e
Slide 14: Store Base Expansion
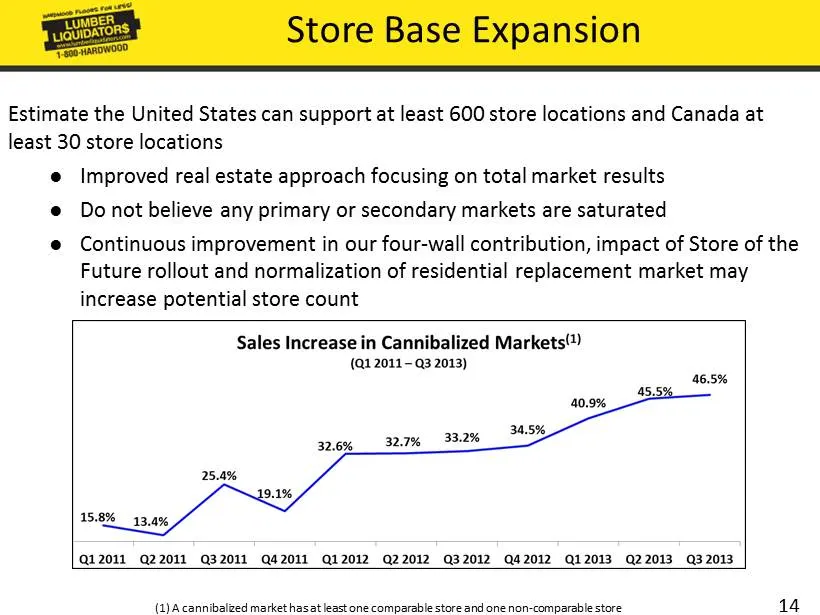
14 Store Base Expansion Estimate the United States can support at least 600 store locations and Canada at least 30 store locations ● Improved real estate approach focusing on total market results ● Do not believe any primary or secondary markets are saturated ● Continuous improvement in our four - w
Slide 15: Portfolio of Initiatives Driving Store Performance
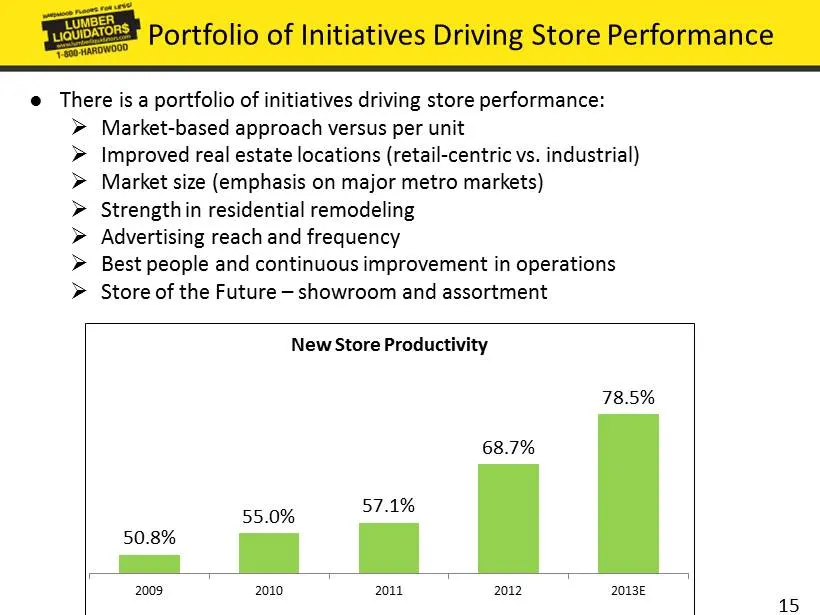
15 Portfolio of Initiatives Driving Store Performance ● There is a portfolio of initiatives driving store performance: » Market - based approach versus per unit » Improved real estate locations (retail - centric vs. industrial) » Market size (emphasis on major metro markets) » Strength in residentia
Slide 16: Store of the Future
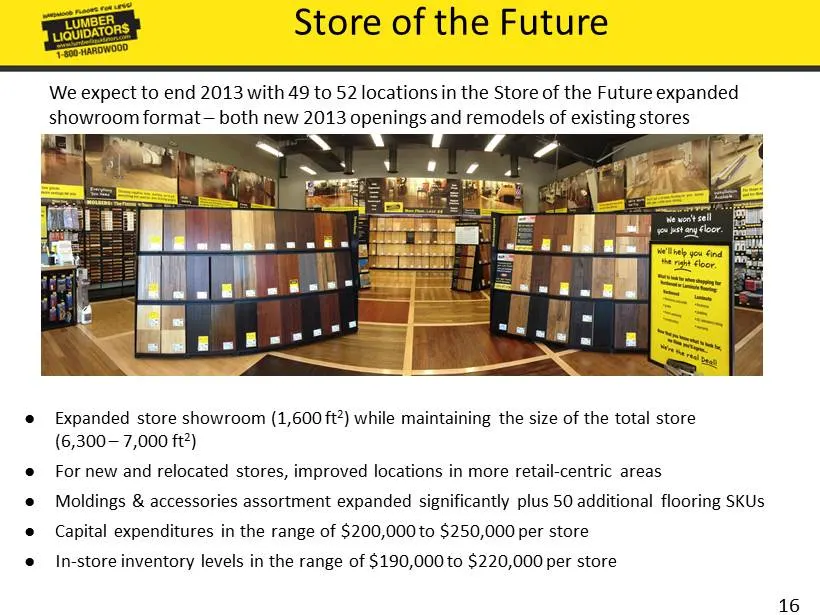
16 Store of the Future ● Expanded store showroom (1,600 ft 2 ) while maintaining the size of the total store ( 6,300 – 7,000 ft 2 ) ● For new and relocated stores, improved locations in more retail - centric areas ● Moldings & accessories assortment expanded significantly plus 50 additional flooring
Slide 17: Net Sales % Increase for Mature and Remodeled Stores
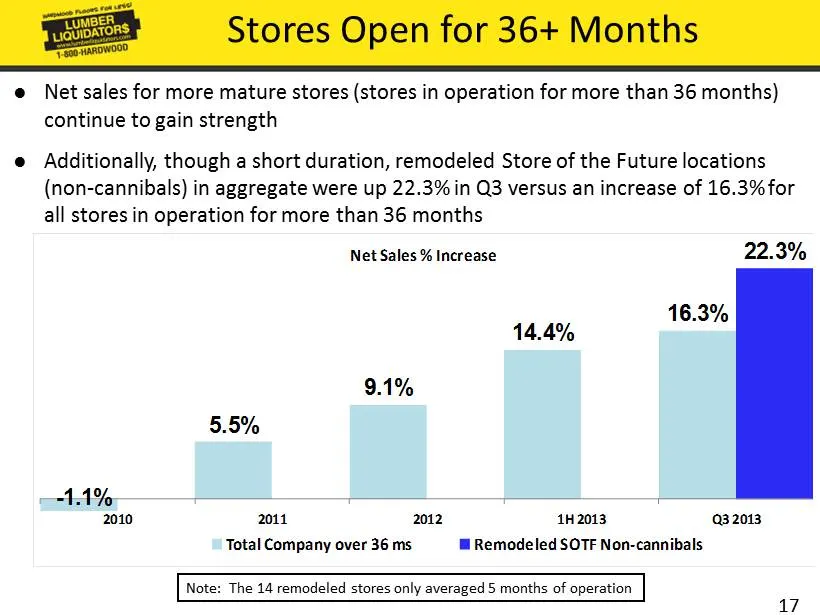
17 - 1.1% 5.5% 9.1% 14.4% 16.3% 22.3% 2010 2011 2012 1H 2013 Q3 2013 Net Sales % Increase Total Company over 36 ms Remodeled SOTF Non - cannibals Stores Open for 36+ Months ● Net sales for more mature stores (stores in operation for more than 36 months) continue to gain strength ● Additionally, thou
Slide 18: Broaden Advertising Reach & Frequency
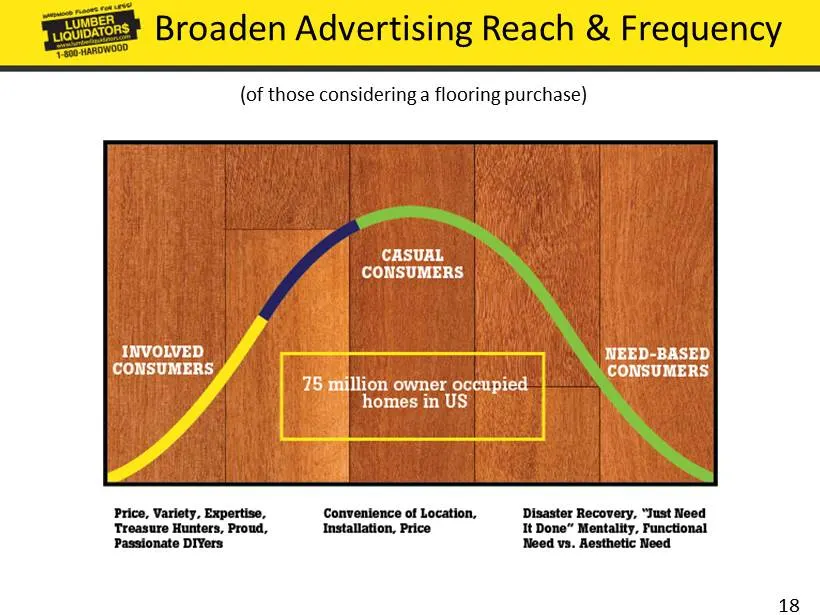
18 Broaden Advertising Reach & Frequency (of those considering a flooring purchase)
Slide 19: Advertising Spend % of net sales
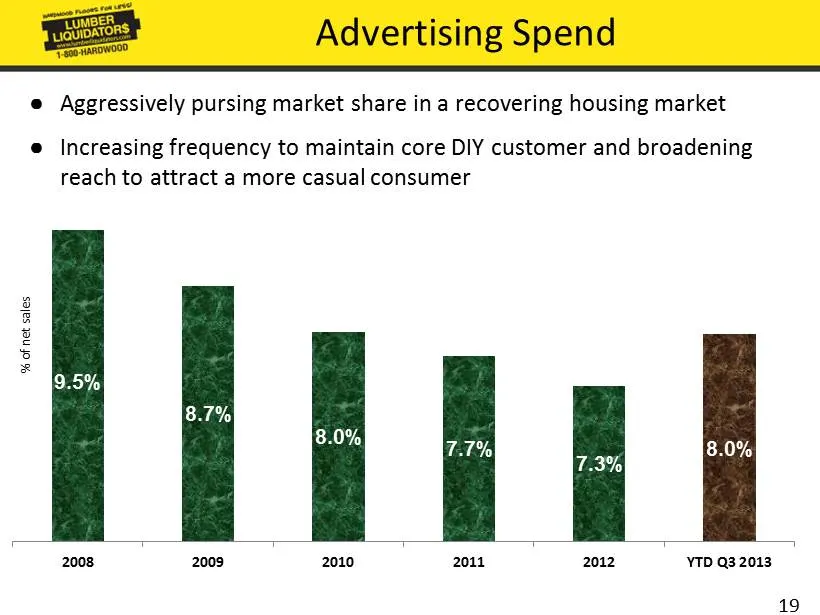
19 Advertising Spend % of net sales 9.5% 8.7% 8.0% 7.7% 7.3% 8.0% 2008 2009 2010 2011 2012 YTD Q3 2013 ● Aggressively pursing market share in a recovering housing market ● Increasing frequency to maintain core DIY customer and broadening reach to attract a more casual consumer
Slide 20: Portfolio of Gross Margin Drivers
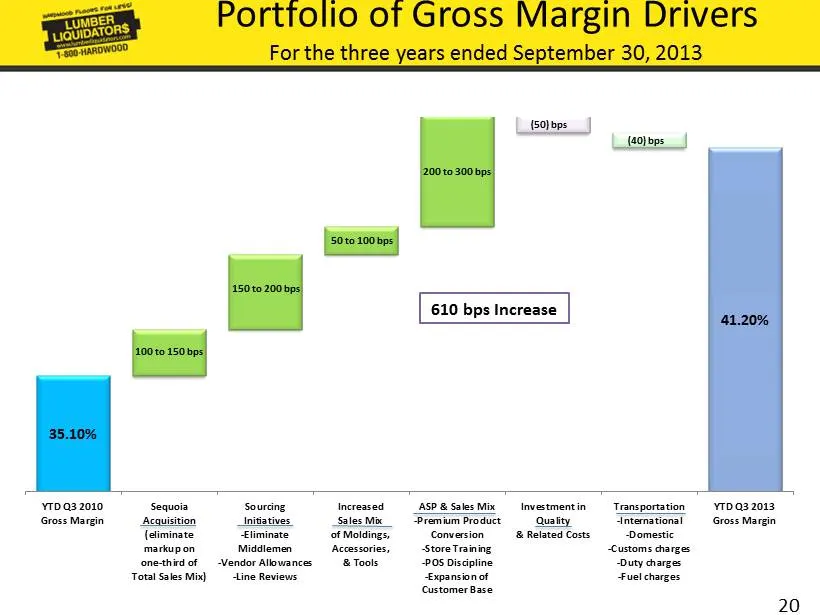
20 35.10% 41.20% YTD Q3 2010 Gross Margin Sequoia Acquisition (eliminate markup on one-third of Total Sales Mix) Sourcing Initiatives -Eliminate Middlemen -Vendor Allowances -Line Reviews Increased Sales Mix of Moldings, Accessories, & Tools ASP & Sales Mix -Premium Product Conversion -Store Trainin
Slide 21: Our Sourcing
21 ● Direct sourcing is key to our value proposition ● Strong relationships with more than 150 domestic and international vendors, primarily mill s ● Top 20 suppliers account for 65% of supply purchases » No single supplier provides more than 4% of our hardwood purchases » No single hardwood product
Slide 22: Sales Mix – 2008 vs. 2013
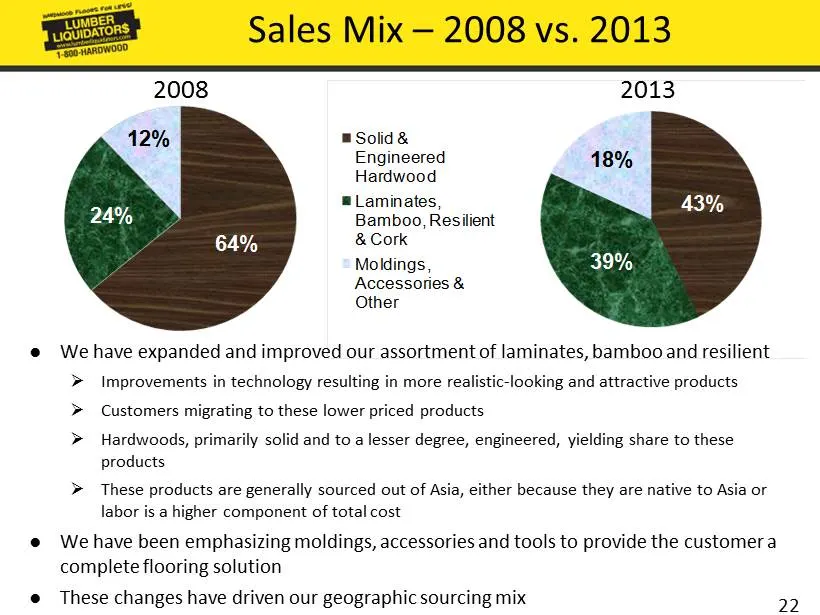
22 43% 39% 18% Solid & Engineered Hardwood Laminates, Bamboo, Resilient & Cork Moldings, Accessories & Other 64% 24% 12% Sales Mix – 2008 vs. 2013 2008 2013 ● We have expanded and improved our assortment of laminates, bamboo and resilient » Improvements in technology resulting in more realistic - lo
Slide 23: Sourcing Mix – 2008 vs. 2013
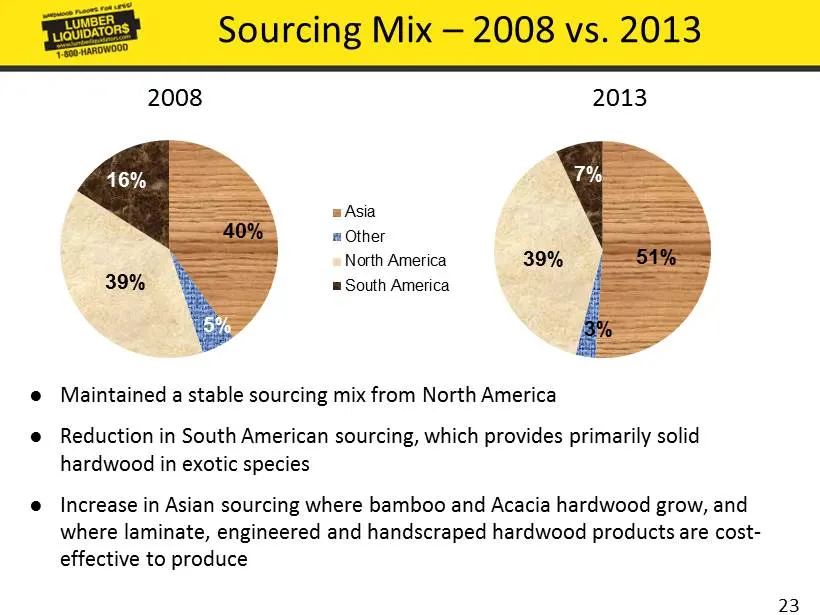
23 51% 3% 39% 7% Asia Other North America South America Sourcing Mix – 2008 vs. 2013 2008 2013 40% 5% 39% 16% ● Maintained a stable sourcing mix from North America ● Reduction in South American sourcing, which provides primarily solid hardwood in exotic species ● Increase in Asian sourcing where bam
Slide 24: Our Global Sourcing Strategy
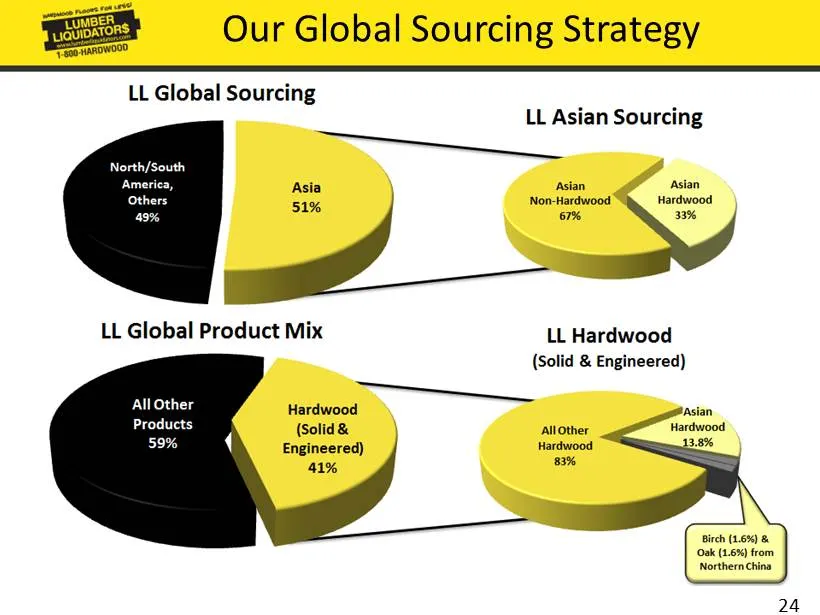
24 Our Global Sourcing Strategy
Slide 25: CARB Formaldehyde Emissions Compliance
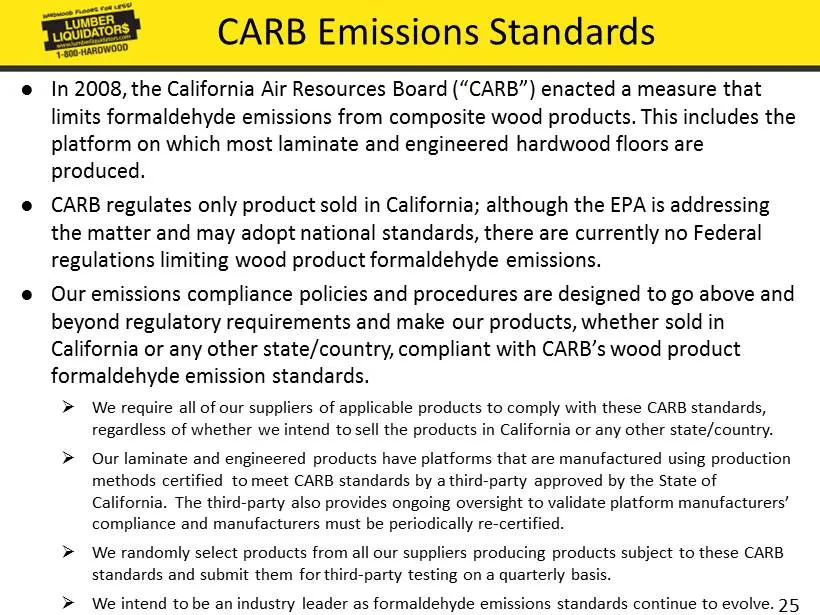
25 ● In 2008, the California Air Resources Board (“CARB”) enacted a measure that limits formaldehyde emissions from composite wood products. This includes the platform on which most laminate and engineered hardwood floors are produced. ● CARB regulates only product sold in California; although the E
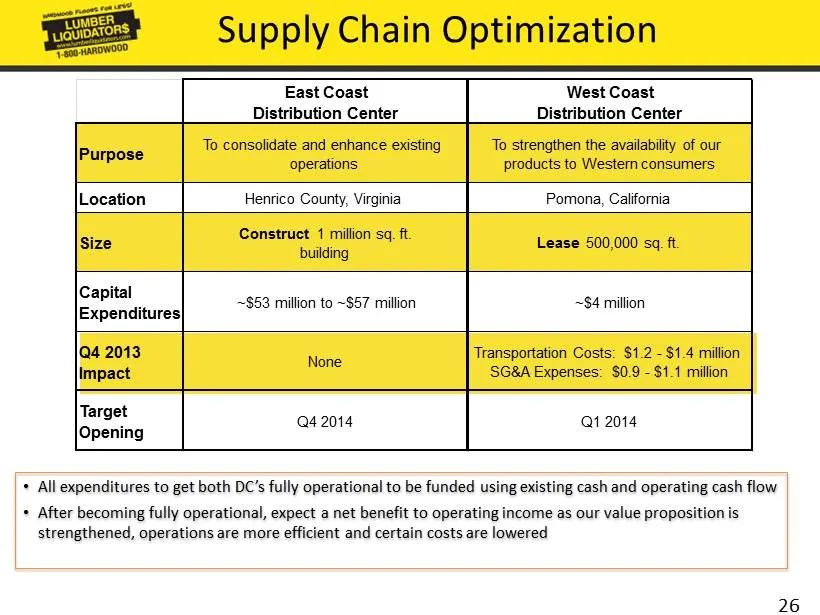
Slide 26: Supply Chain Optimization
26 Supply Chain Optimization • All expenditures to get both DC’s fully operational to be funded using existing cash and operating cash flow • After becoming fully operational, expect a net benefit to operating income as our value proposition is strengthened, operations are more efficient and certain

Slide 27: Financial Details
1-800-HARDWOOD Financial Details
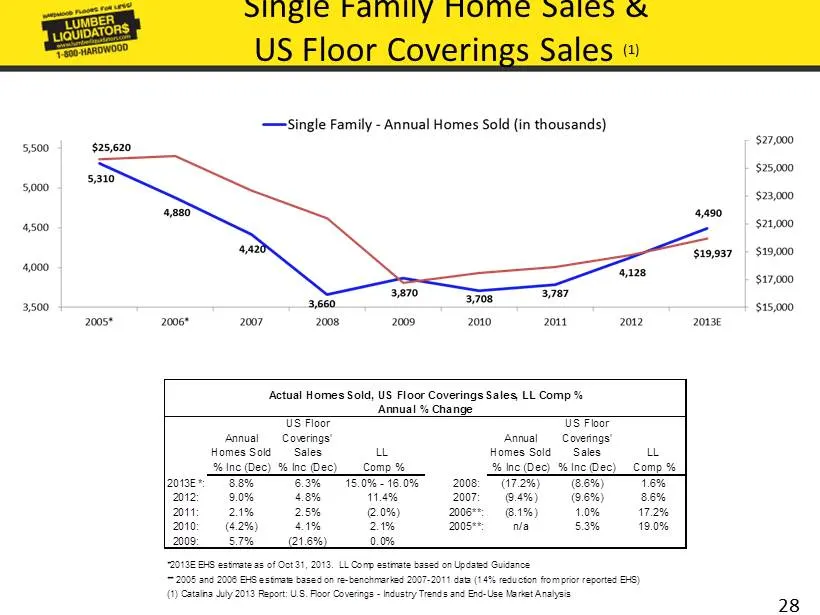
Slide 28: Single Family Home Sales & US Floor Coverings Sales
28 Single Family Home Sales & US Floor Coverings Sales (1) Annual Homes Sold % Inc (Dec) US Floor Coverings' Sales % Inc (Dec) LL Comp % Annual Homes Sold % Inc (Dec) US Floor Coverings' Sales % Inc (Dec) LL Comp % 2013E*: 8.8% 6.3% 15.0% - 16.0% 2008: (17.2%) (8.6%) 1.6% 2012: 9.0% 4.8% 11.4% 2007:
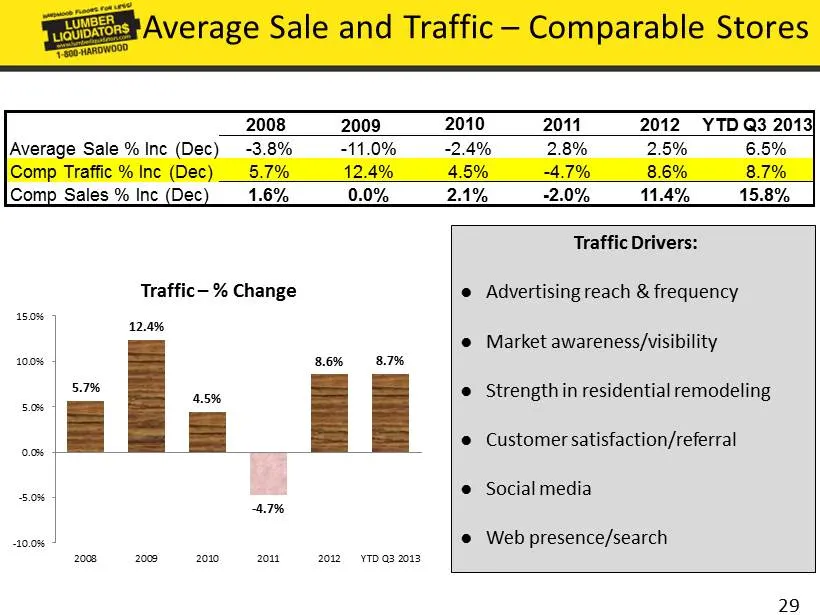
Slide 29: Average Sale and Traffic – Comparable Stores
29 Average Sale and Traffic – Comparable Stores 5.7% 12.4% 4.5% - 4.7% 8.6% 8.7% -10.0% -5.0% 0.0% 5.0% 10.0% 15.0% 2008 2009 2010 2011 2012 YTD Q3 2013 Traffic – % Change Traffic Drivers: ● Advertising reach & frequency ● Market awareness/visibility ● Strength in residential remodeling ● Customer s
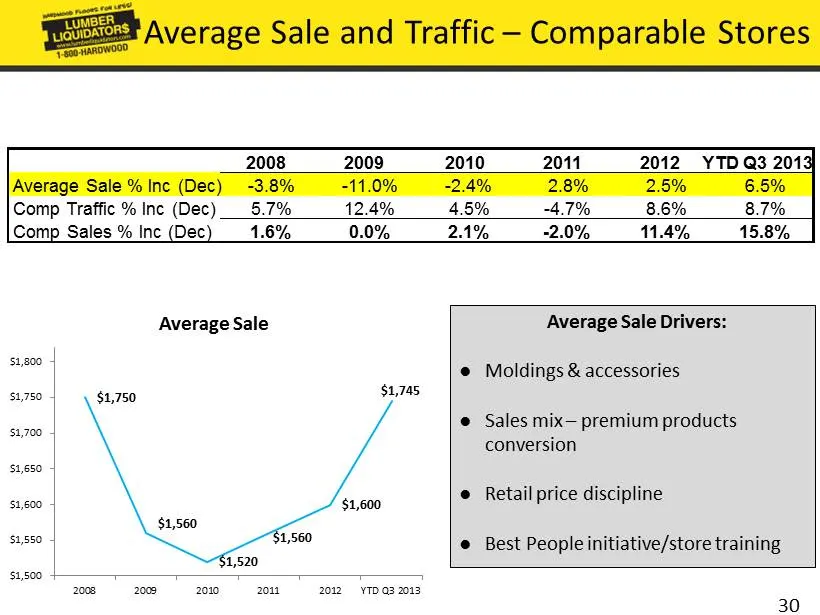
Slide 30: Average Sale and Traffic – Comparable Stores
30 Average Sale and Traffic – Comparable Stores $1,750 $1,560 $1,520 $1,560 $1,600 $1,745 $1,500 $1,550 $1,600 $1,650 $1,700 $1,750 $1,800 2008 2009 2010 2011 2012 YTD Q3 2013 Average Sale Average Sale Drivers: ● Moldings & accessories ● Sales mix – premium products conversion ● Retail price discipl
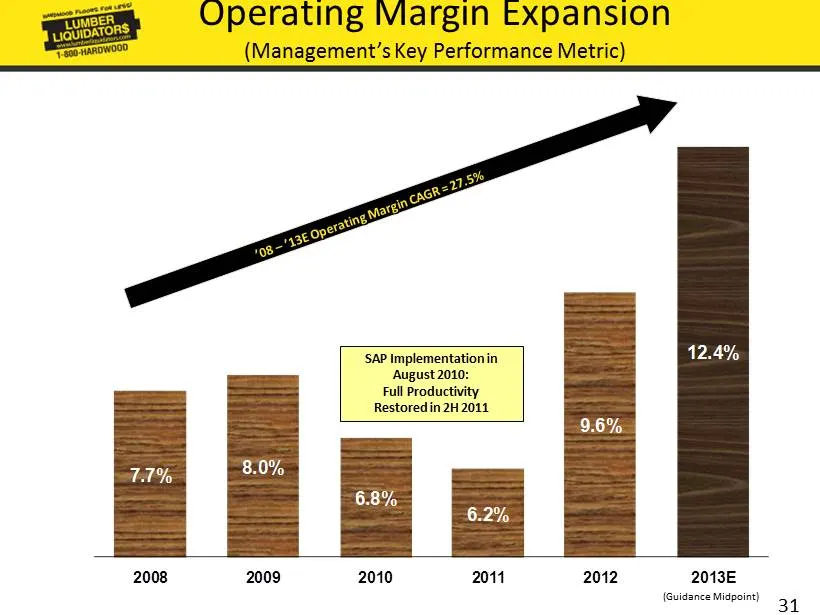
Slide 31: Operating Margin Expansion
31 Operating Margin Expansion (Management’s Key Performance Metric) 7.7% 8.0% 6.8% 6.2% 9.6% 12.4% 2008 2009 2010 2011 2012 2013E SAP Implementation in August 2010: Full Productivity Restored in 2H 2011 (Guidance Midpoint)
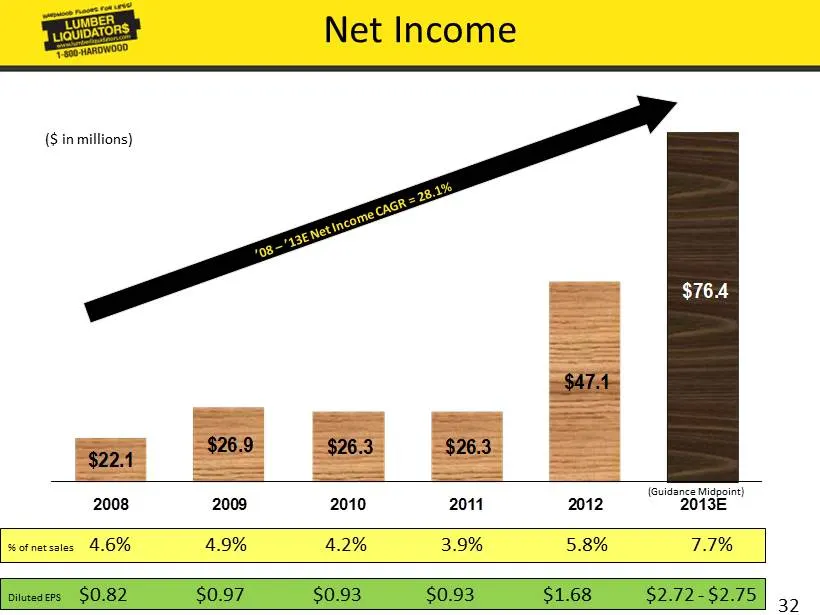
Slide 32: Net Income
32 Net Income ($ in millions) $22.1 $26.9 $26.3 $26.3 $47.1 $76.4 2008 2009 2010 2011 2012 2013E (Guidance Midpoint) % of net sales 4.6 % 4.9 % 4.2% 3.9 % 5.8% 7.7% Diluted EPS $ 0.82 $0.97 $0.93 $0.93 $1.68 $2.72 - $ 2.75
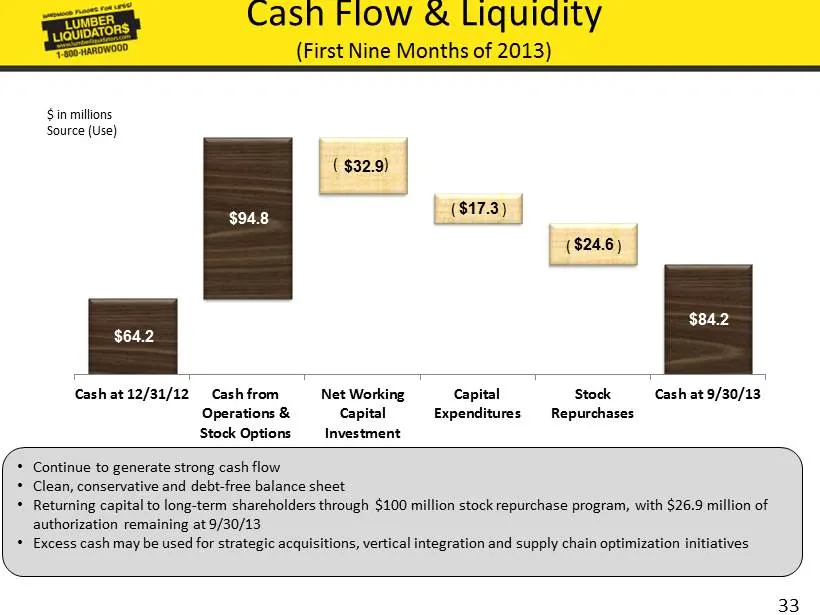
Slide 33: Cash Flow & Liquidity (First Nine Months of 2013)
33 $64.2 $94.8 $32.9 $17.3 $24.6 $84.2 Cash at 12/31/12 Cash from Operations & Stock Options Net Working Capital Investment Capital Expenditures Stock Repurchases Cash at 9/30/13 Cash Flow & Liquidity (First Nine Months of 2013) • Continue to generate strong cash flow • Clean, conservative and debt
Slide 34: 34
34
Source: SEC EDGAR · 8-K filed Dec 10, 2013
More decks from LL Flooring Holdings Inc
 Proxy Contest (June 2024)37 slides · Jun 17, 2024
 Proxy Contest (June 2024)56 slides · Jun 13, 2024
 Investor Presentation (December 2022)27 slides · Dec 13, 2022
 Investor Presentation (November 2022)26 slides · Nov 29, 2022
 Investor Presentation (June 2022)9 slides · Jun 7, 2022
 Investor Presentation (May 2022)33 slides · May 4, 2022