RTW Retailwinds — New York & Company — Q1 2018 Earnings Presentation
14 slides from RTW Retailwinds's earnings presentation, May 24, 2018

Slide 1: Cautionary Statement Regarding Forward Looking Statements
Cautionary Statement Regarding Forward Looking Statements This presentation contains forward-looking statements, including statements made within the meaning of the safe harbor provisions of the United States Private Securities Litigation Reform Act of 1995. Some of these statements can be identifie
Slide 2: The “New”
The “New” • One of the largest women’s specialty retail apparel brands, nearly $1 billion in annual net sales • Celebrity Partnerships and Sub brands competitive points of assortment differentiation – – Eva Mendes and Gabrielle Union Partnerships represent nearly 10% of volume, growing at a double d
Slide 3: The “New”
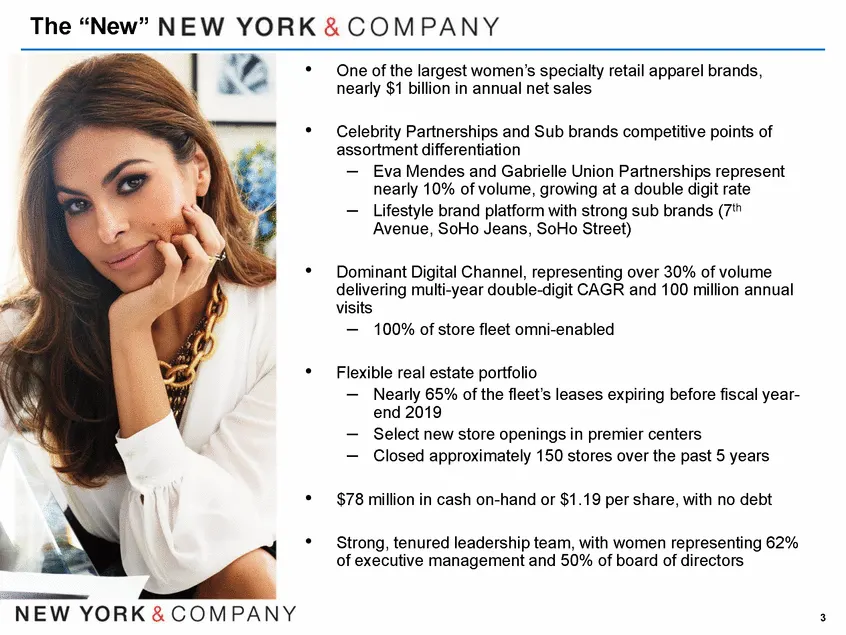
The “New” NEW YORK & COMPANY One of the largest women’s specialty retail apparel brands, nearly $1 billion in annual net sales Celebrity Partnerships and Sub brands competitive points of assortment differentiation — Eva Mendes and Gabrielle Union Partnerships represent nearly 10% of volume, growing

Slide 4: Q1 2018 Financial Performance
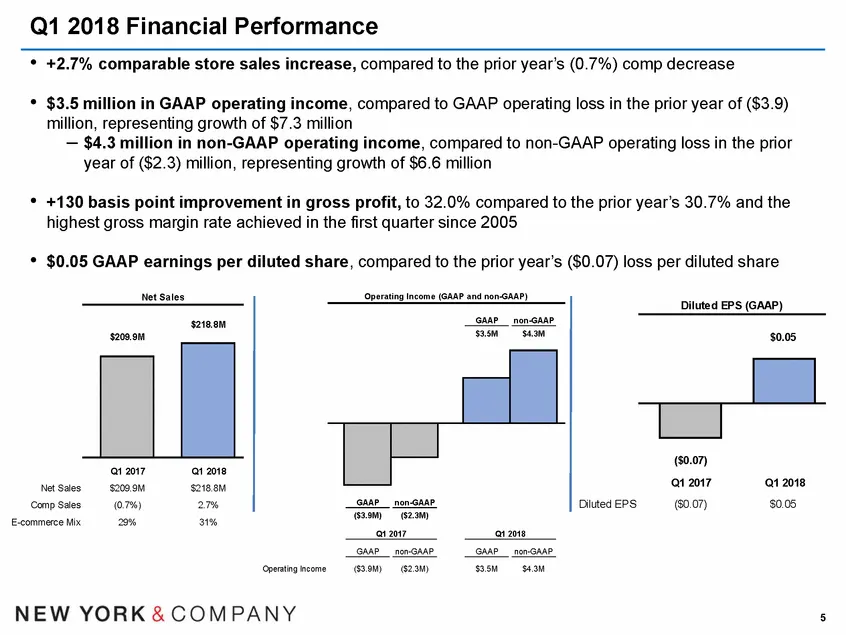
Q1 2018 Financial Performance • • +2.7% comparable store sales increase, compared to the prior year’s (0.7%) comp decrease $3.5 million in GAAP operating income, compared to GAAP operating loss in the prior year of ($3.9) million, representing growth of $7.3 million – $4.3 million in non-GAAP operat
Slide 5: Q1 2018 Financial Performance Summary
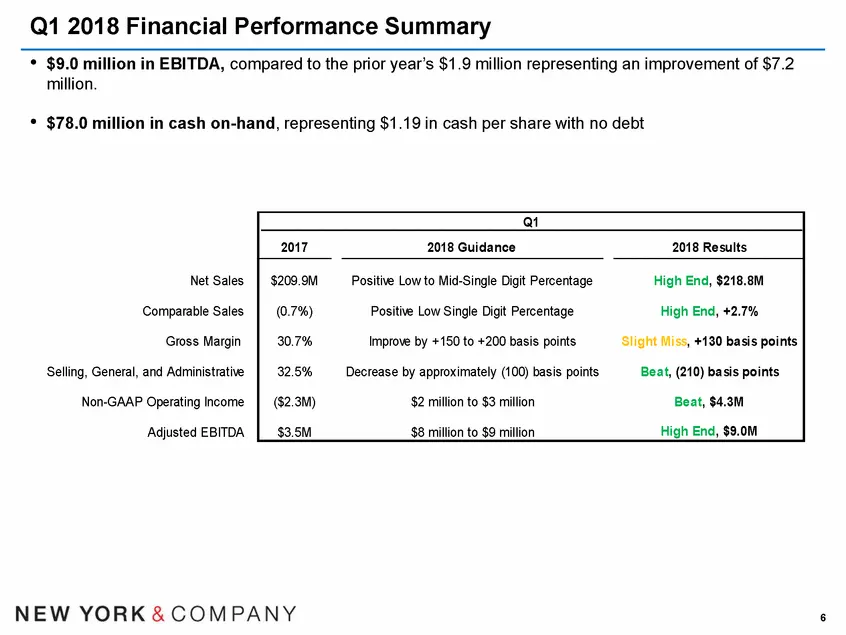
Q1 2018 Financial Performance Summary • $9.0 million in EBITDA, compared to the prior year’s $1.9 million representing an improvement of $7.2 million. • $78.0 million in cash on-hand, representing $1.19 in cash per share with no debt Q1 2018 Guidance Net Sales Positive Low to Mid-Single Digit Percen
Slide 6: Q1 Key Achievements
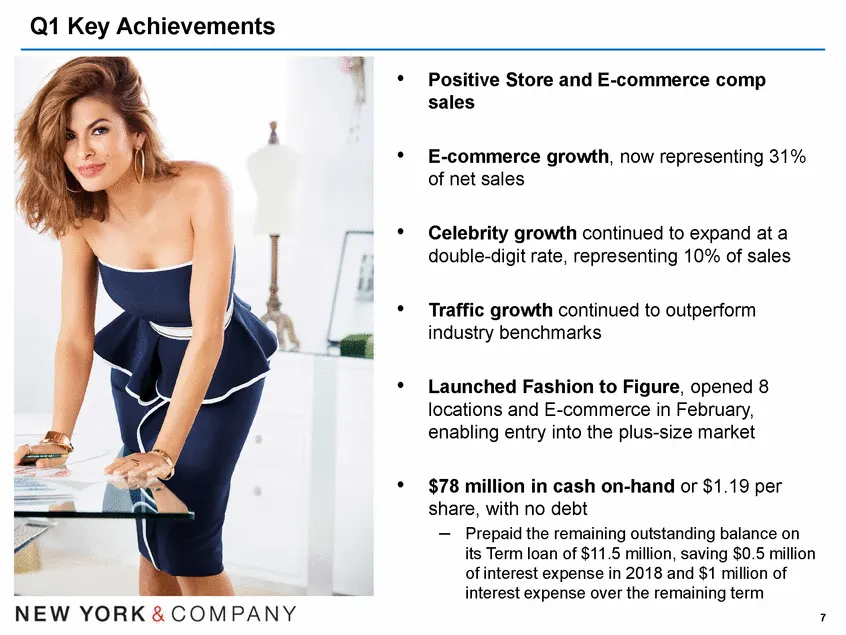
Q1 Key Achievements • Positive Store and E-commerce comp sales • E-commerce growth, now representing 31% of net sales • Celebrity growth continued to expand at a double-digit rate, representing 10% of sales • Traffic growth continued to outperform industry benchmarks • Launched Fashion to Figure, op
Slide 7: Q1 Key Achievements
Q1 Key Achievements NEW YORK & COMPANY Positive Store and E-commerce comp sales E-commerce growth, now representing 31% of net sales Celebrity growth continued to expand at a double-digit rate, representing 10% of sales Traffic growth continued to outperform industry benchmarks Launched Fashion to F

Slide 8: Q2 2018 Strategic Initiatives
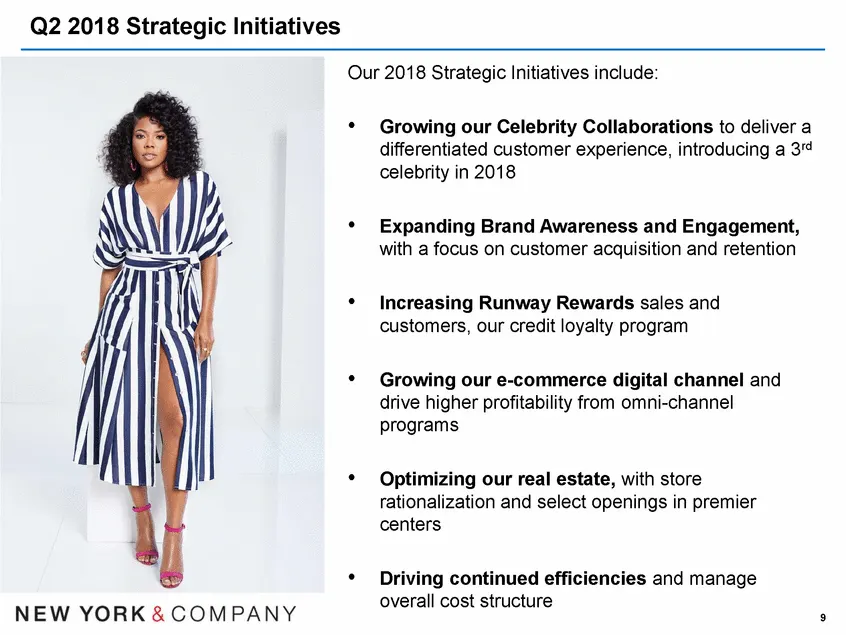
Q2 2018 Strategic Initiatives Our 2018 Strategic Initiatives include: • Growing our Celebrity Collaborations to deliver a differentiated customer experience, introducing a 3rd celebrity in 2018 • Expanding Brand Awareness and Engagement, with a focus on customer acquisition and retention • Increasin
Slide 9: Spring Season 2018 Guidance
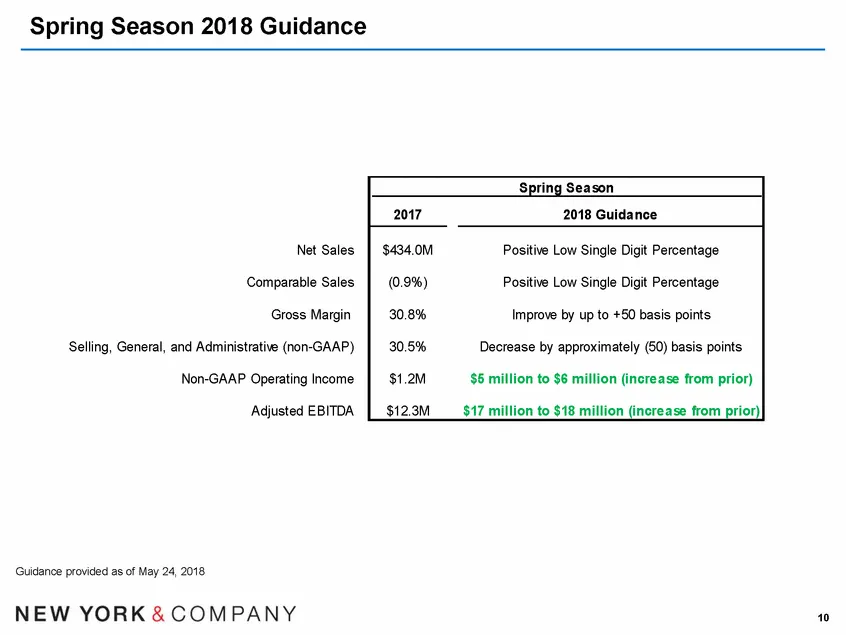
Spring Season 2018 Guidance Spring Season Net Sales Comparable Sales Gross Margin Selling, General, and Administrative (non-GAAP) Non-GAAP Operating Income Adjusted EBITDA Guidance provided as of May 24, 2018 10 2017 2018 Guidance $434.0M (0.9%) 30.8% 30.5% $1.2M $12.3M Positive Low Single Digit Per
Slide 10: Spring Season 2018 Guidance
Spring Season 2018 Guidance Net Sales Comparable Sales Gross Margin Selling, General, and Administrative (non-GAAP) Non-GAAP Operating Income ‘Adjusted EBITDA Guidance provided as of May 24, 2018 NEW YORK & COMPANY Spring Season 2017 2018 Guidance $434.0M Positive Low Single Digit Percentage (0.9%)

Slide 11: Q1 2018 P&L Summary
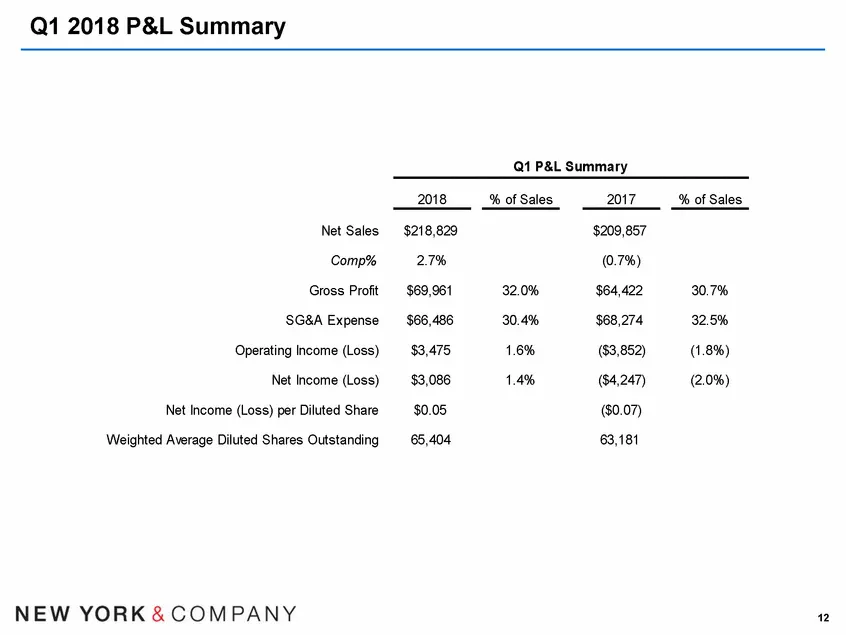
Q1 2018 P&L Summary Q1 P&L Summary 2018 % of Sales 2017 % of Sales Net Sales $218,829 $209,857 Comp% 2.7% (0.7%) Gross Profit $69,961 32.0% $64,422 30.7% SG&A Expense $66,486 30.4% $68,274 32.5% Operating Income (Loss) $3,475 1.6% ($3,852) (1.8%) Net Income (Loss) $3,086 1.4% ($4,247) (2.0%) Net Inc
Slide 12: Comp Sales Trend
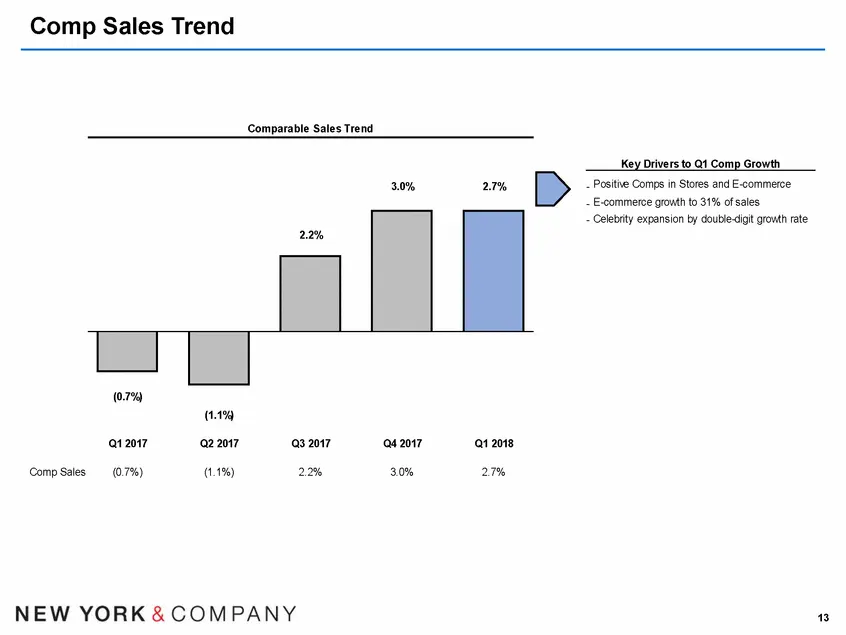
Comp Sales Trend Comparable Sales Trend Key Drivers to Q1 Comp Growth - Positive Comps in Stores and E-commerce - E-commerce growth to 31% of sales 3.0% 2.7% - Celebrity expansion by double-digit growth rate (0.7%) (1.1%) Q1 2017 Q2 2017 Q3 2017 Q4 2017 Q1 2018 Comp Sales (0.7%) (1.1%) 2.2% 3.0% 2.7
Slide 13: Comp Sales Trend
Comp Sales Trend Comparable Sales Trend Key Drivers to Qt Comp Growth 30% 21% > Pesite Comps in Stores and E-commerce E-commerce grouth to 31% of sales Celery expansion by double iit growth rate 22% ora ara 1 2017 02.2017 3 2017 a4 2017 4 2018 Comp Sales (0.7%) (11%) 2% 30% 2% NEW YORK & COMPANY ®

Slide 14: nyandcompany.com
nyandcompany.com
Source: SEC EDGAR · 8-K filed May 24, 2018
More decks from RTW Retailwinds Inc
 Q3 2019 Earnings Presentation16 slides · Dec 5, 2019
 Q2 2019 Earnings Presentation15 slides · Aug 22, 2019
 Q1 2019 Earnings Presentation16 slides · May 30, 2019
 Q4 2018 Earnings Presentation21 slides · Mar 21, 2019
 Q3 2018 Earnings Presentation19 slides · Nov 30, 2018
 New York & Company — Q2 2018 Earnings Presentation16 slides · Aug 23, 2018