Newalliance Bancshares — Investor Day (August 2005)
89 slides from Newalliance Bancshares's investor day presentation, Aug 5, 2005
Slide 1: Analyst Day Presentation
Analyst Day Presentation August 5, 2005
Slide 2: Disclaimer & Forward-Looking Statements
Disclaimer & Forward-Looking Statements This presentation contains forward-looking statements which involve risks and uncertainties. The Company's actual results may differ significantly from the results discussed in the forward-looking statements. Factors that might cause such a difference include,
Slide 3: Agenda
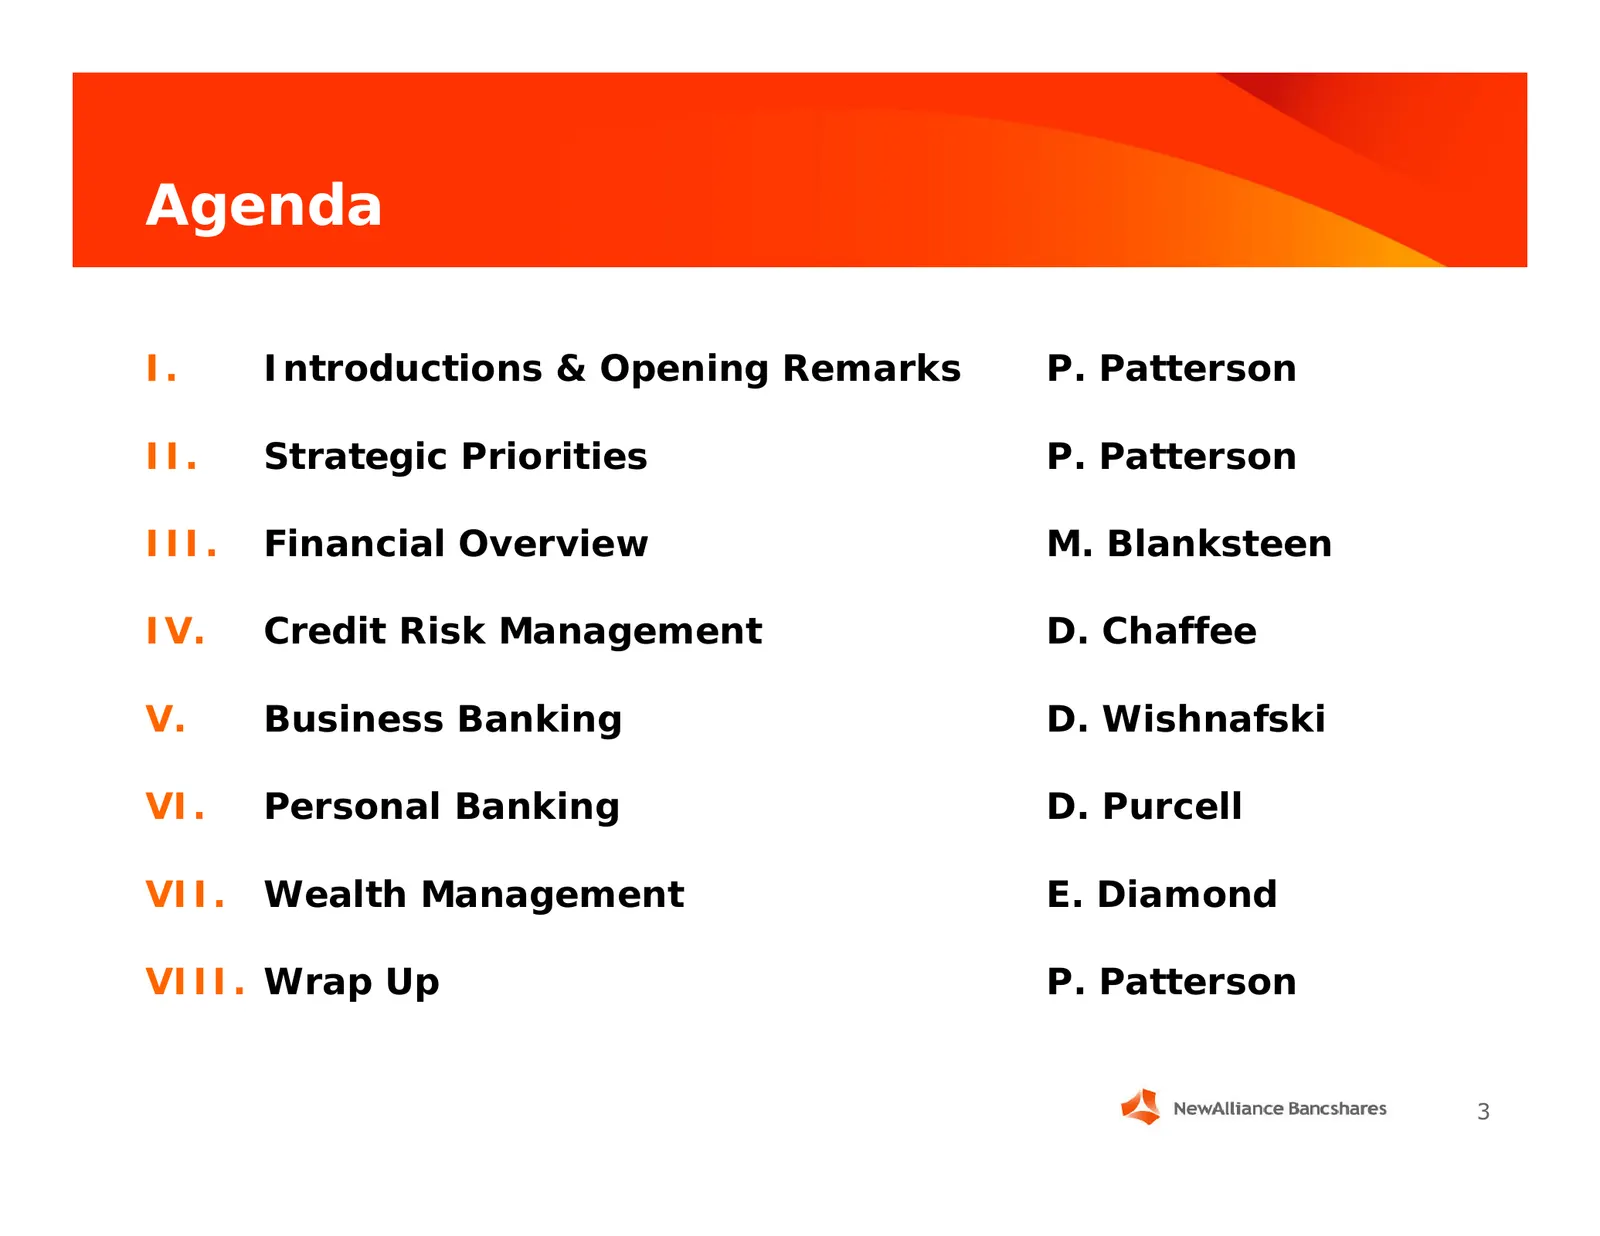
Agenda I. Introductions & Opening Remarks P. Patterson II. Strategic Priorities P. Patterson III. Financial Overview M. Blanksteen IV. Credit Risk Management D. Chaffee V. Business Banking D. Wishnafski VI. Personal Banking D. Purcell VII. Wealth Management E. Diamond VIII. Wrap Up P. Patterson 3
Slide 4: NewAlliance Bank Organization
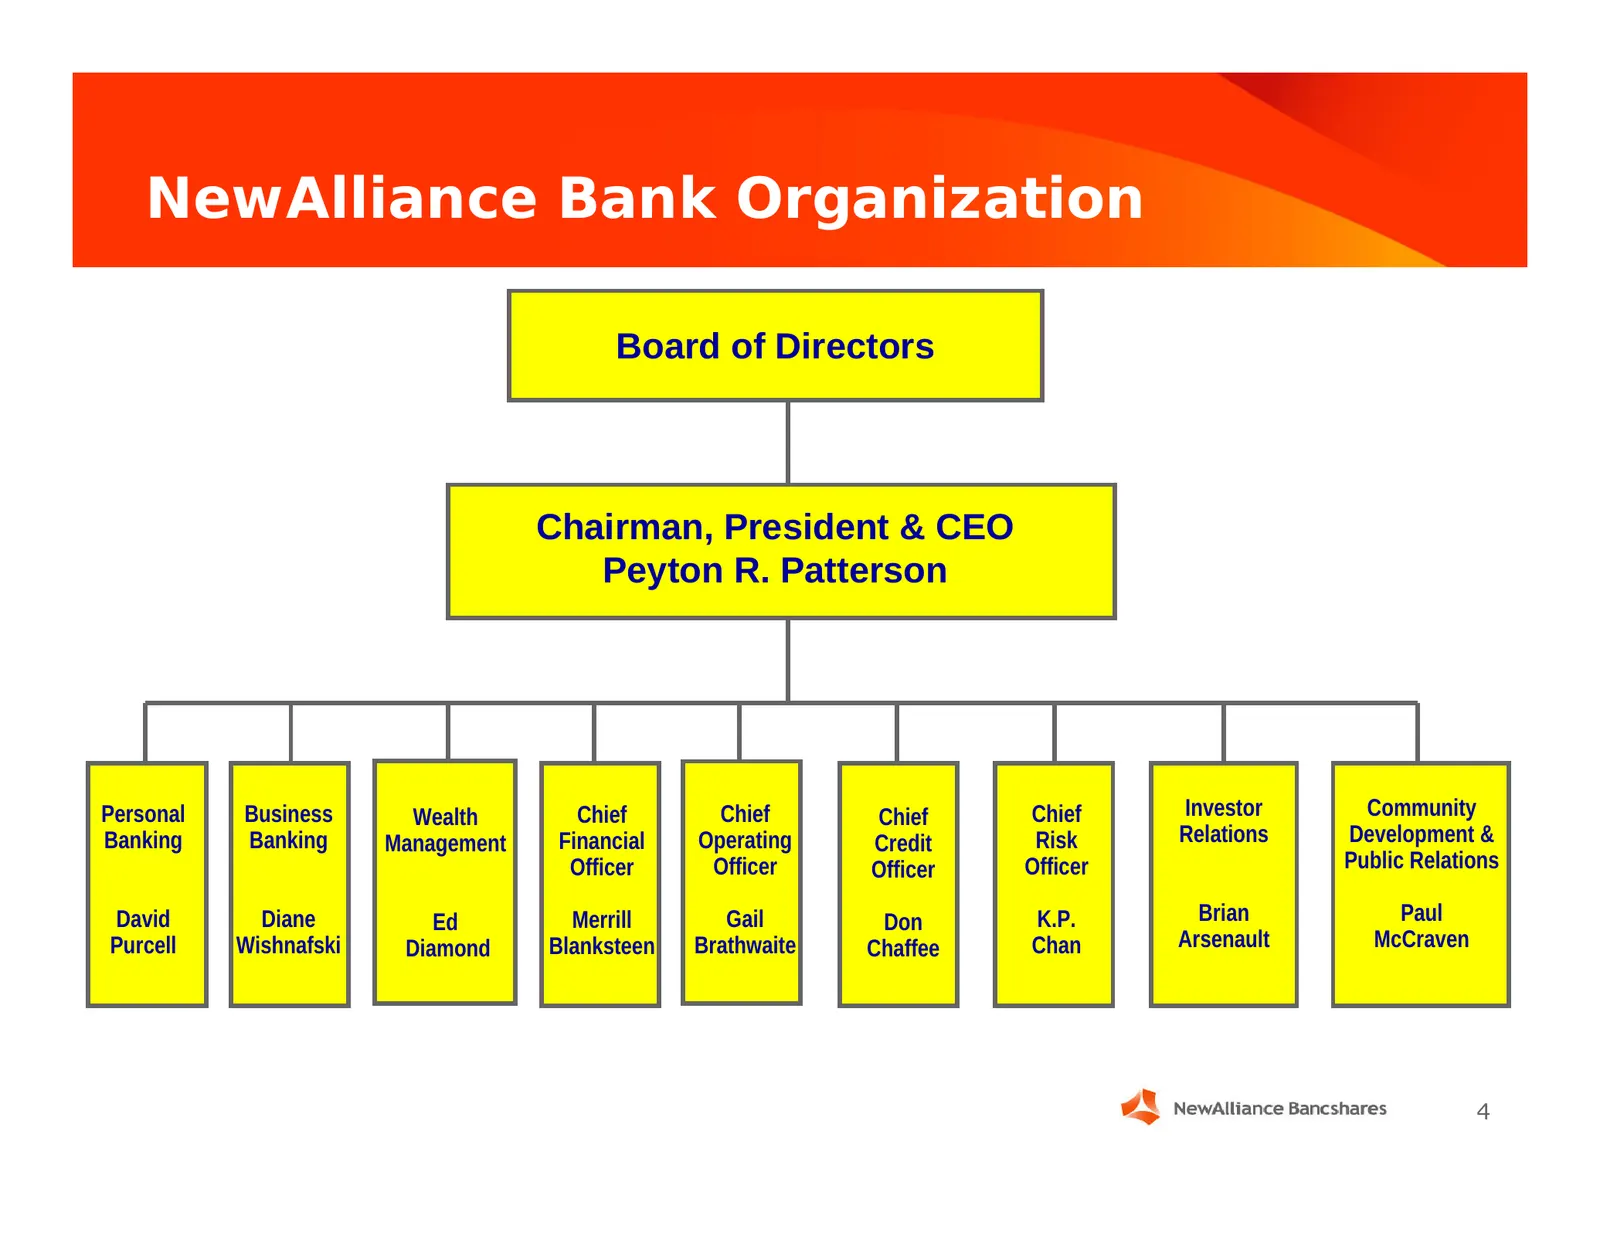
NewAlliance Bank Organization Board of Directors Chairman, President & CEO Peyton R. Patterson Personal Business Wealth Chief Chief Chief Chief Investor Community Banking Banking Management Financial Operating Credit Risk Relations Development & Officer Officer Officer Officer Public Relations David
Slide 5: Experienced Management Team
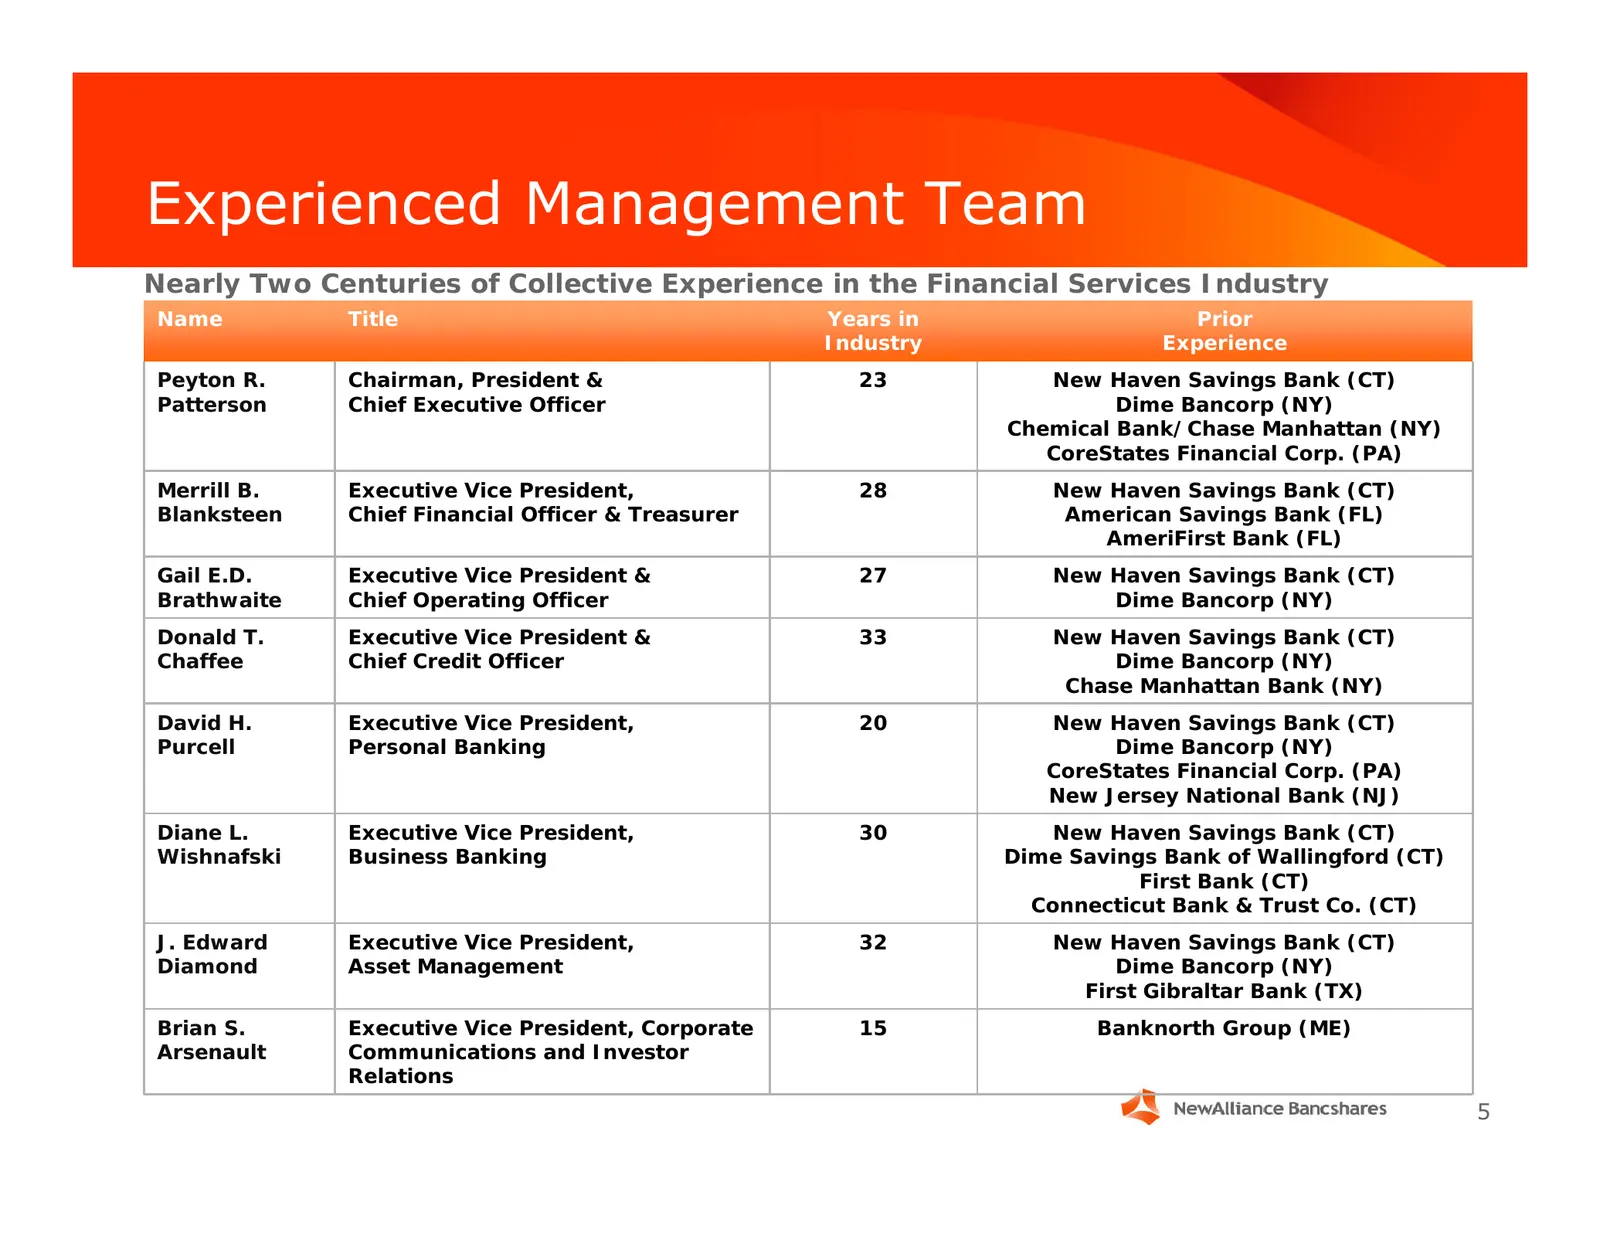
Experienced Management Team Nearly Two Centuries of Collective Experience in the Financial Services Industry Name Title Years in Prior Industry Experience Peyton R. Chairman, President & 23 New Haven Savings Bank (CT) Patterson Chief Executive Officer Dime Bancorp (NY) Chemical Bank/Chase Manhattan
Slide 6: The Vision Statement
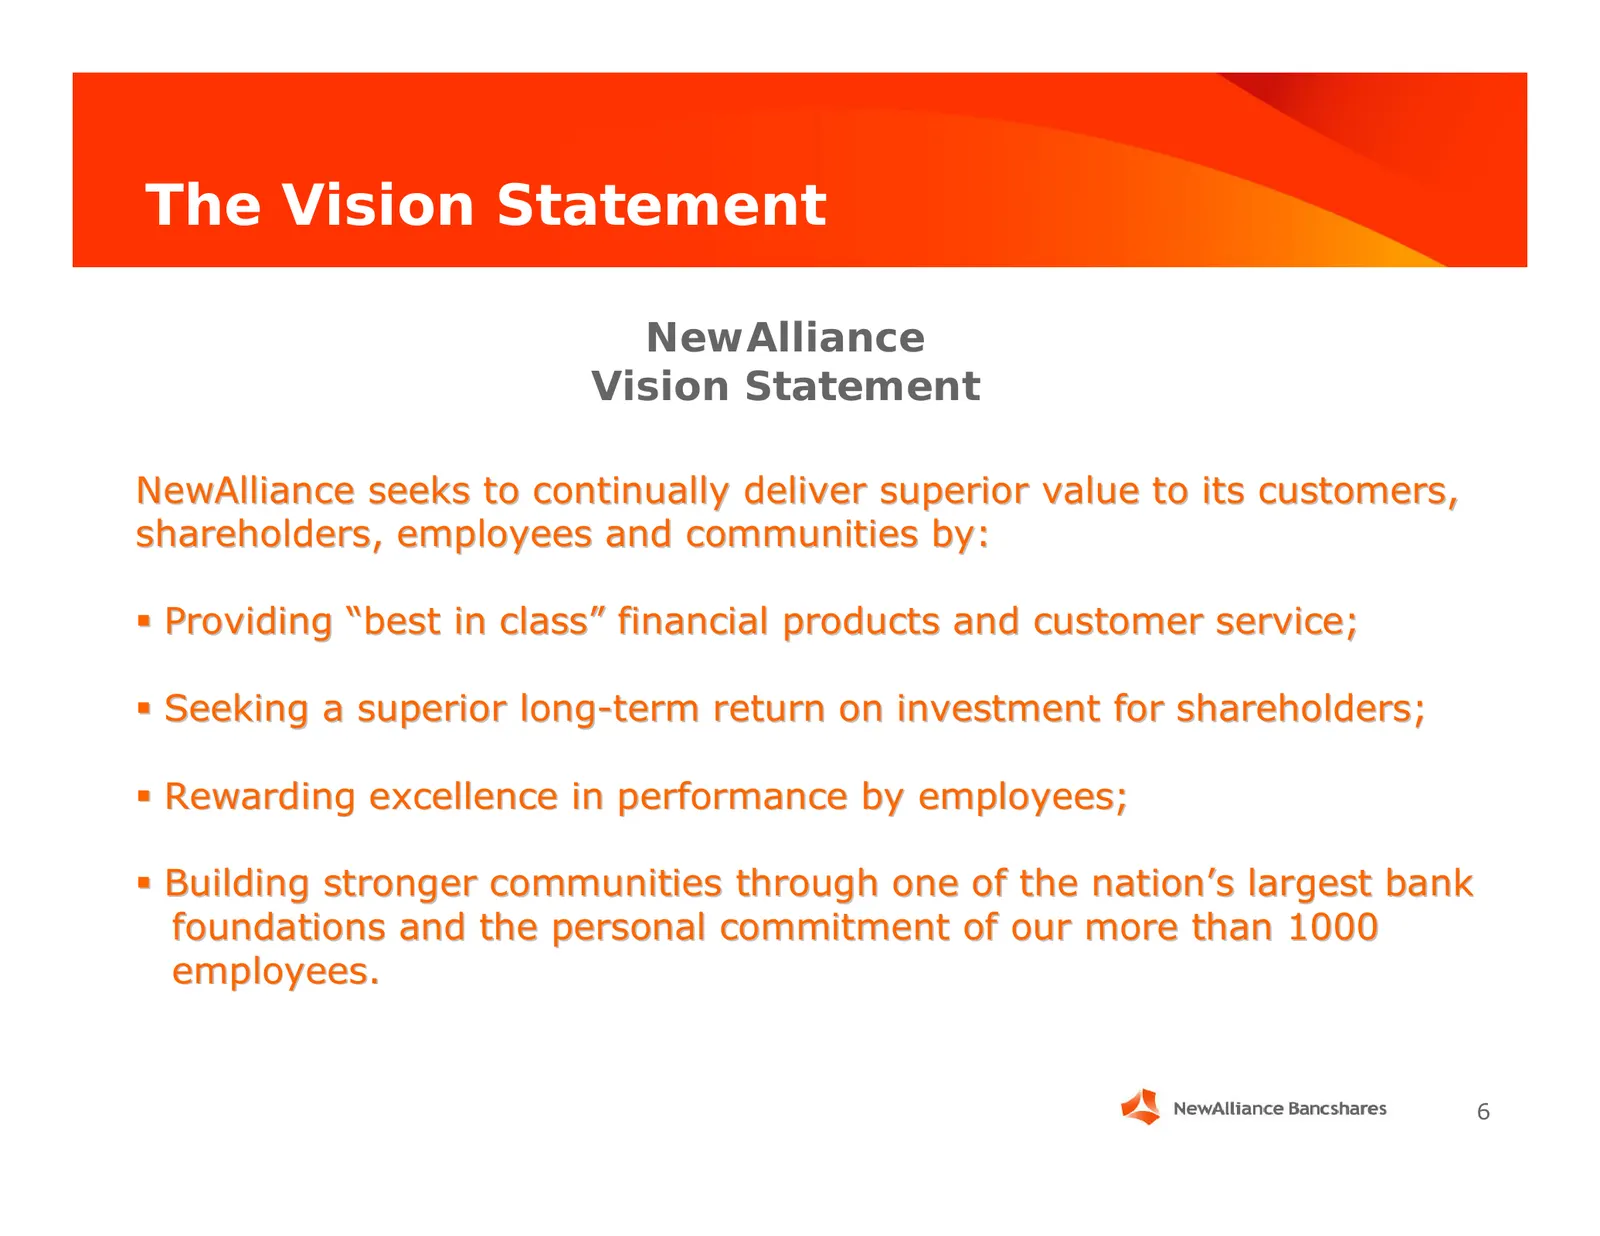
The Vision Statement NewAlliance Vision Statement NewAlliance seeks to continually deliver superior value to its customers, shareholders, employees and communities by: Providing “best in class” financial products and customer service; Seeking a superior long-term return on investment for shareho
Slide 7: NewAlliance Mission Statement
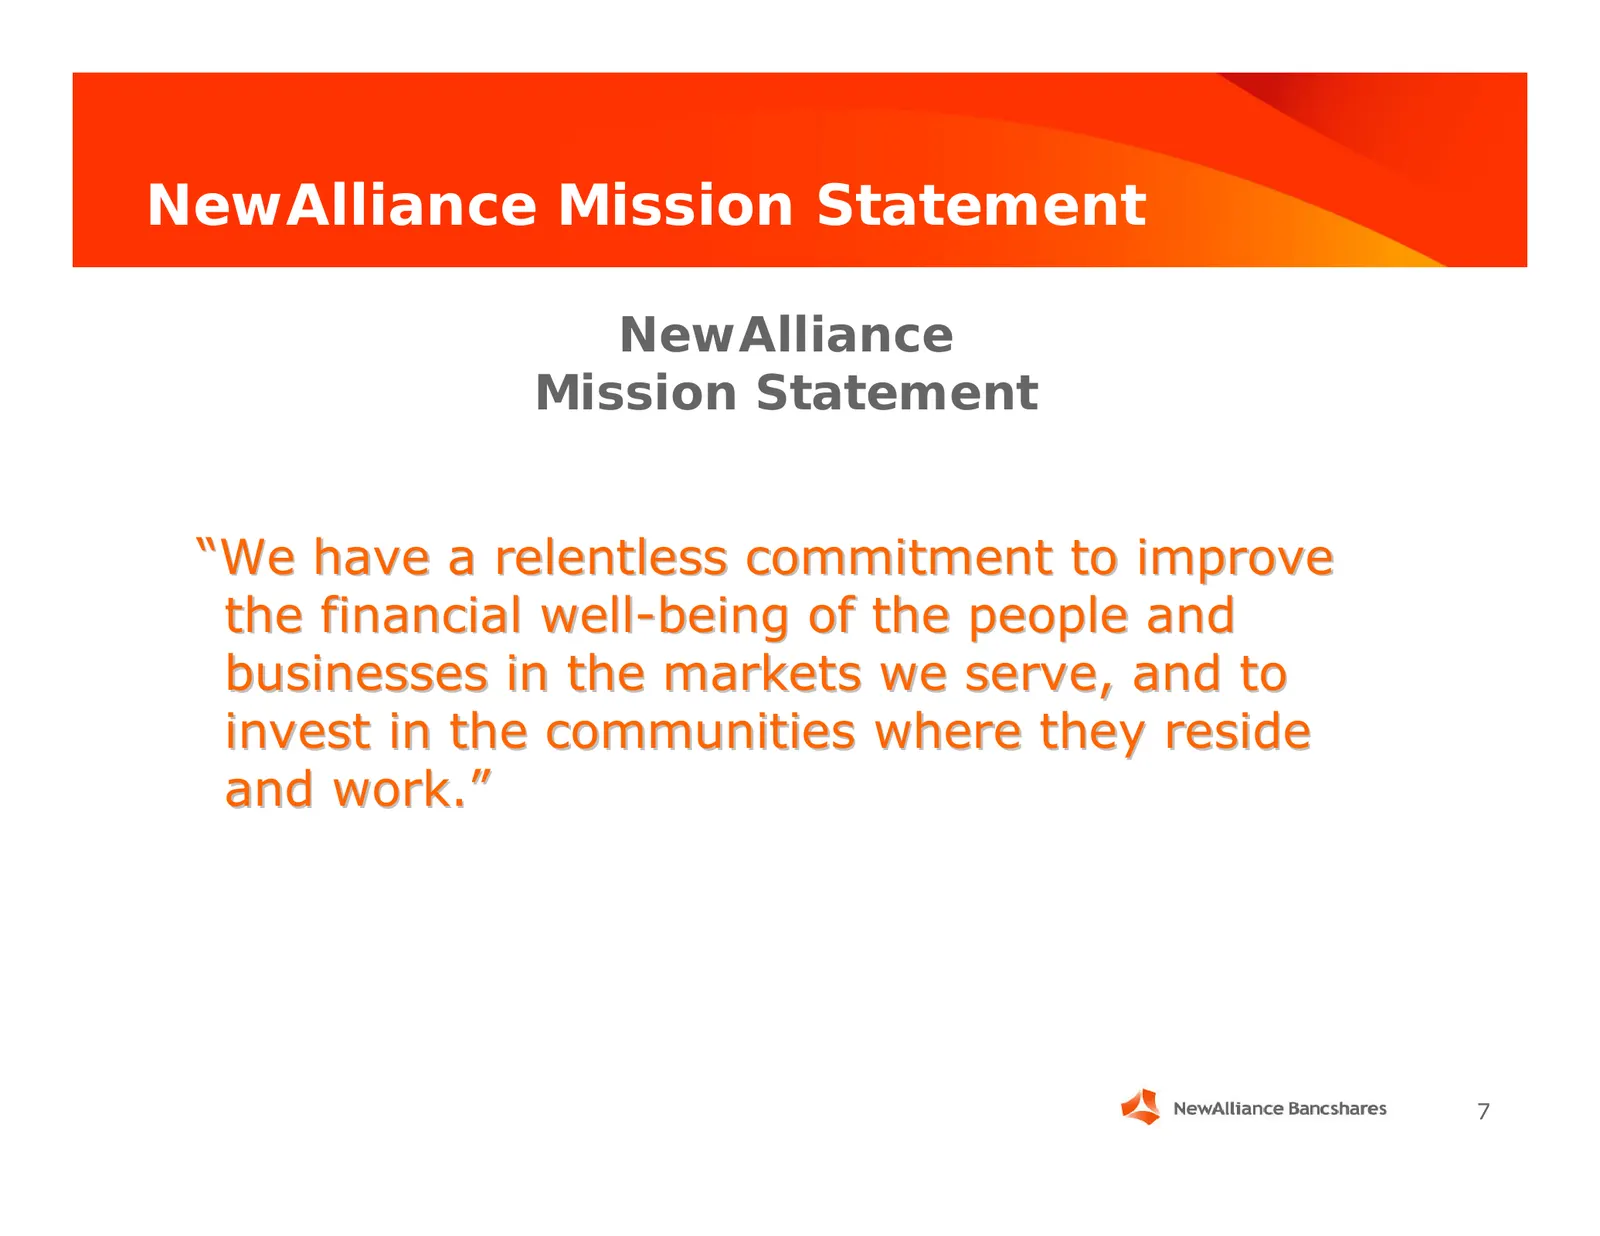
NewAlliance Mission Statement NewAlliance Mission Statement “We have a relentless commitment to improve the financial well-being of the people and businesses in the markets we serve, and to invest in the communities where they reside and work.” 7
Slide 8: Strategic Focus Areas
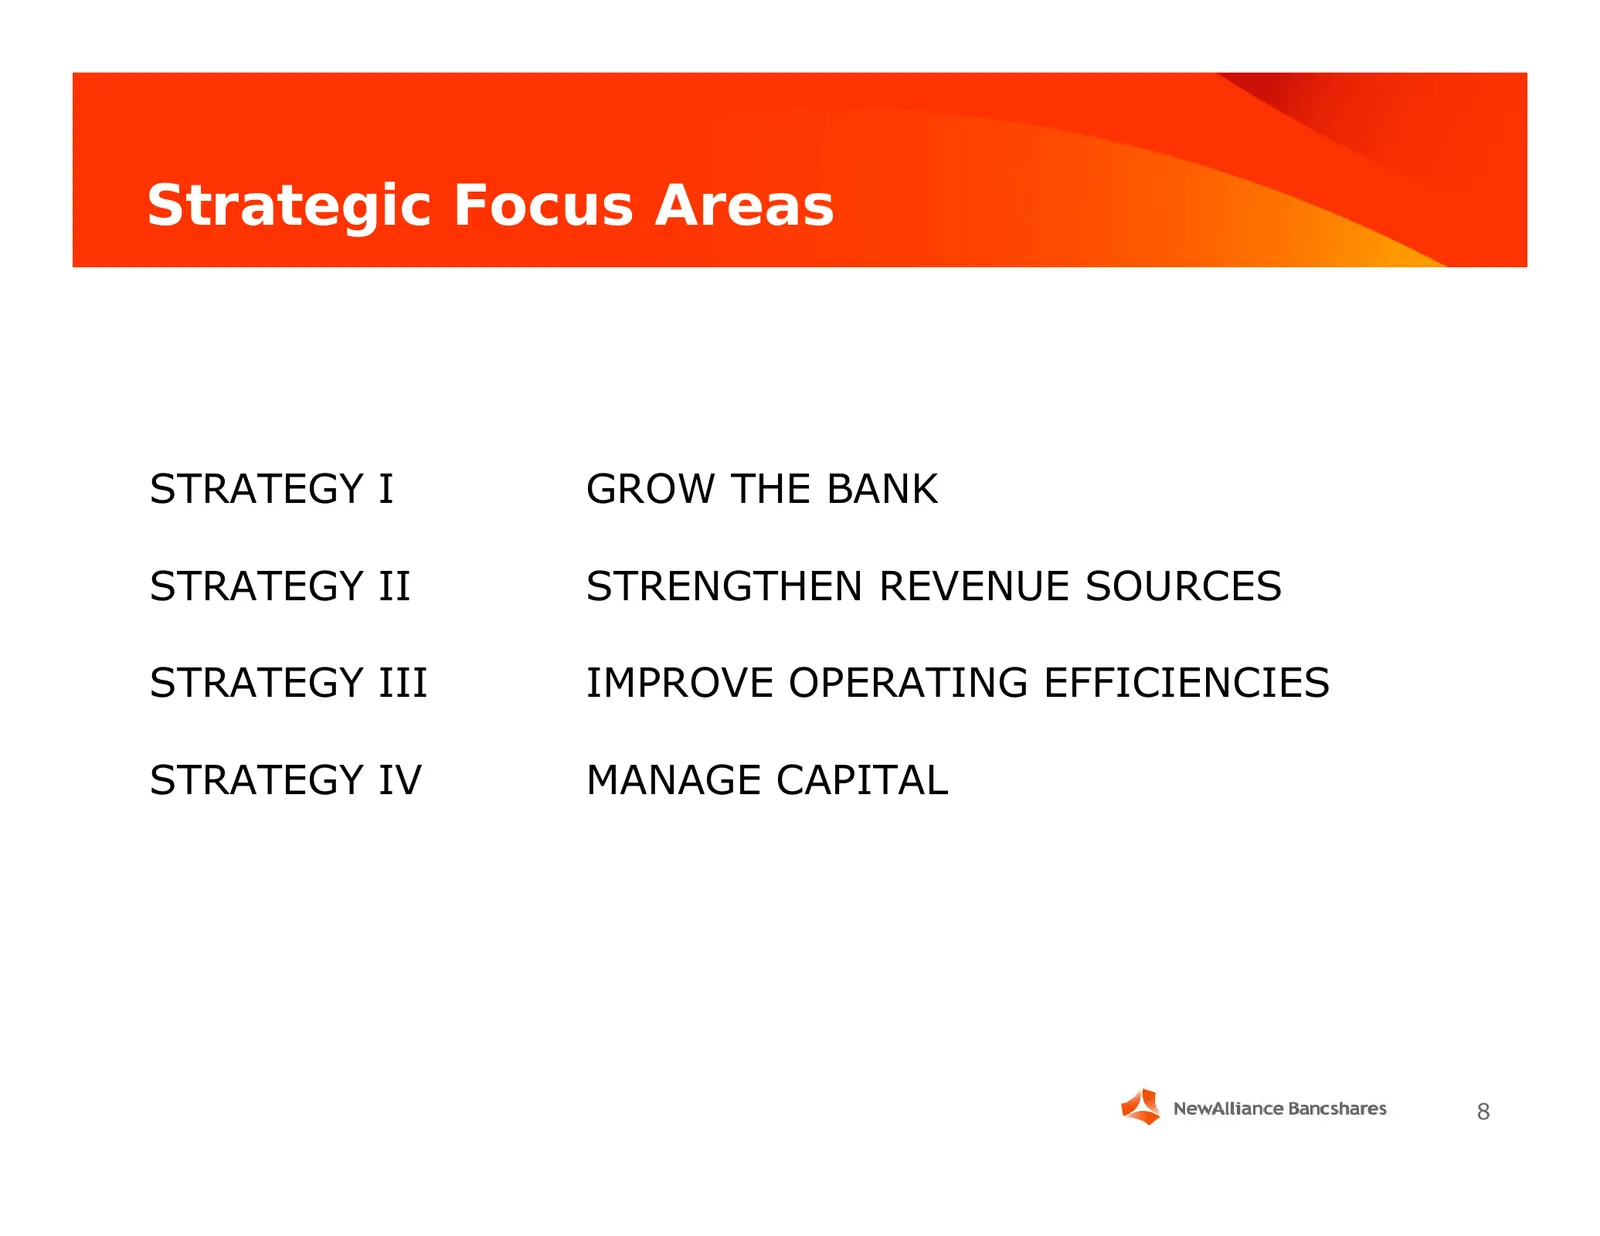
Strategic Focus Areas STRATEGY I GROW THE BANK STRATEGY II STRENGTHEN REVENUE SOURCES STRATEGY III IMPROVE OPERATING EFFICIENCIES STRATEGY IV MANAGE CAPITAL 8
Slide 9: Strategy I: Grow the Bank
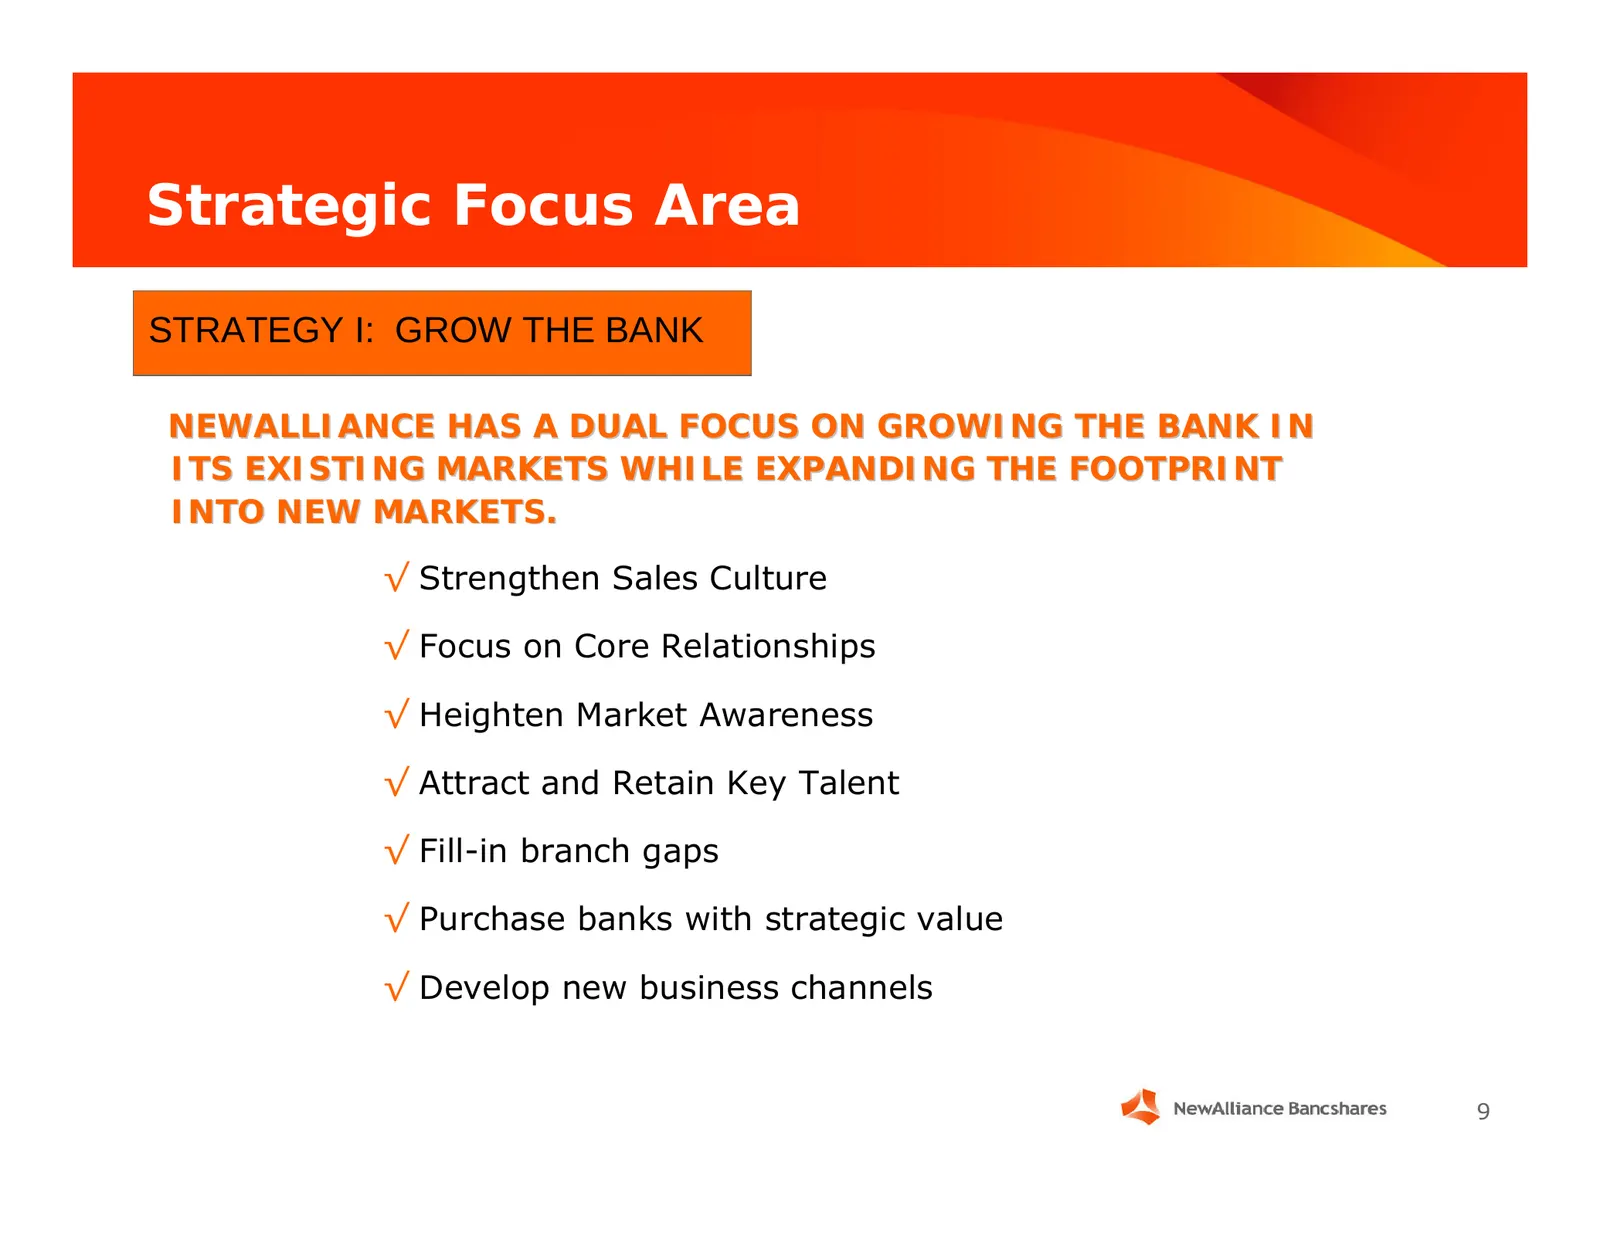
Strategic Focus Area STRATEGY I: GROW THE BANK NEWALLIANCE HAS A DUAL FOCUS ON GROWING THE BANK IN ITS EXISTING MARKETS WHILE EXPANDING THE FOOTPRINT INTO NEW MARKETS. √ Strengthen Sales Culture √ Focus on Core Relationships √ Heighten Market Awareness √ Attract and Retain Key Talent √ Fill-in branc
Slide 10: Expanded Market Area
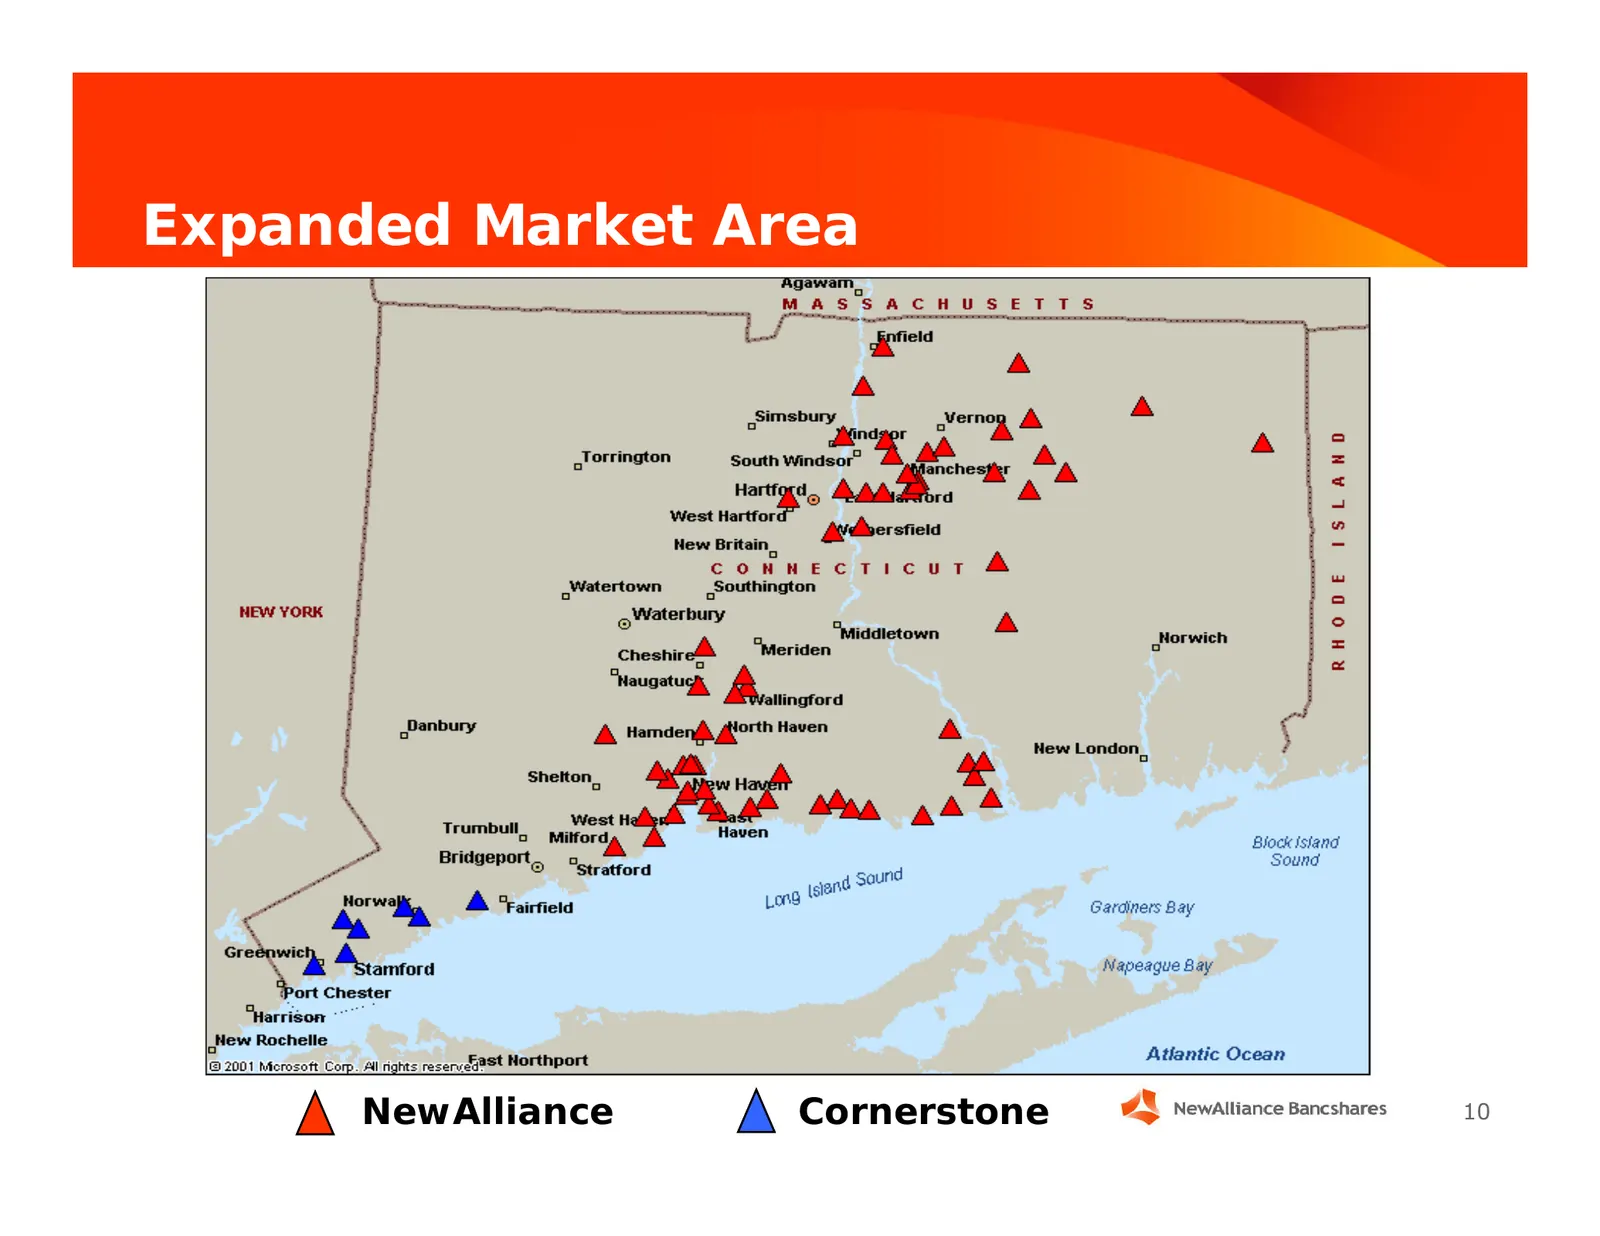
Expanded Market Area NewAlliance Cornerstone 10
Slide 11: Strategy II: Strengthen Revenue Sources
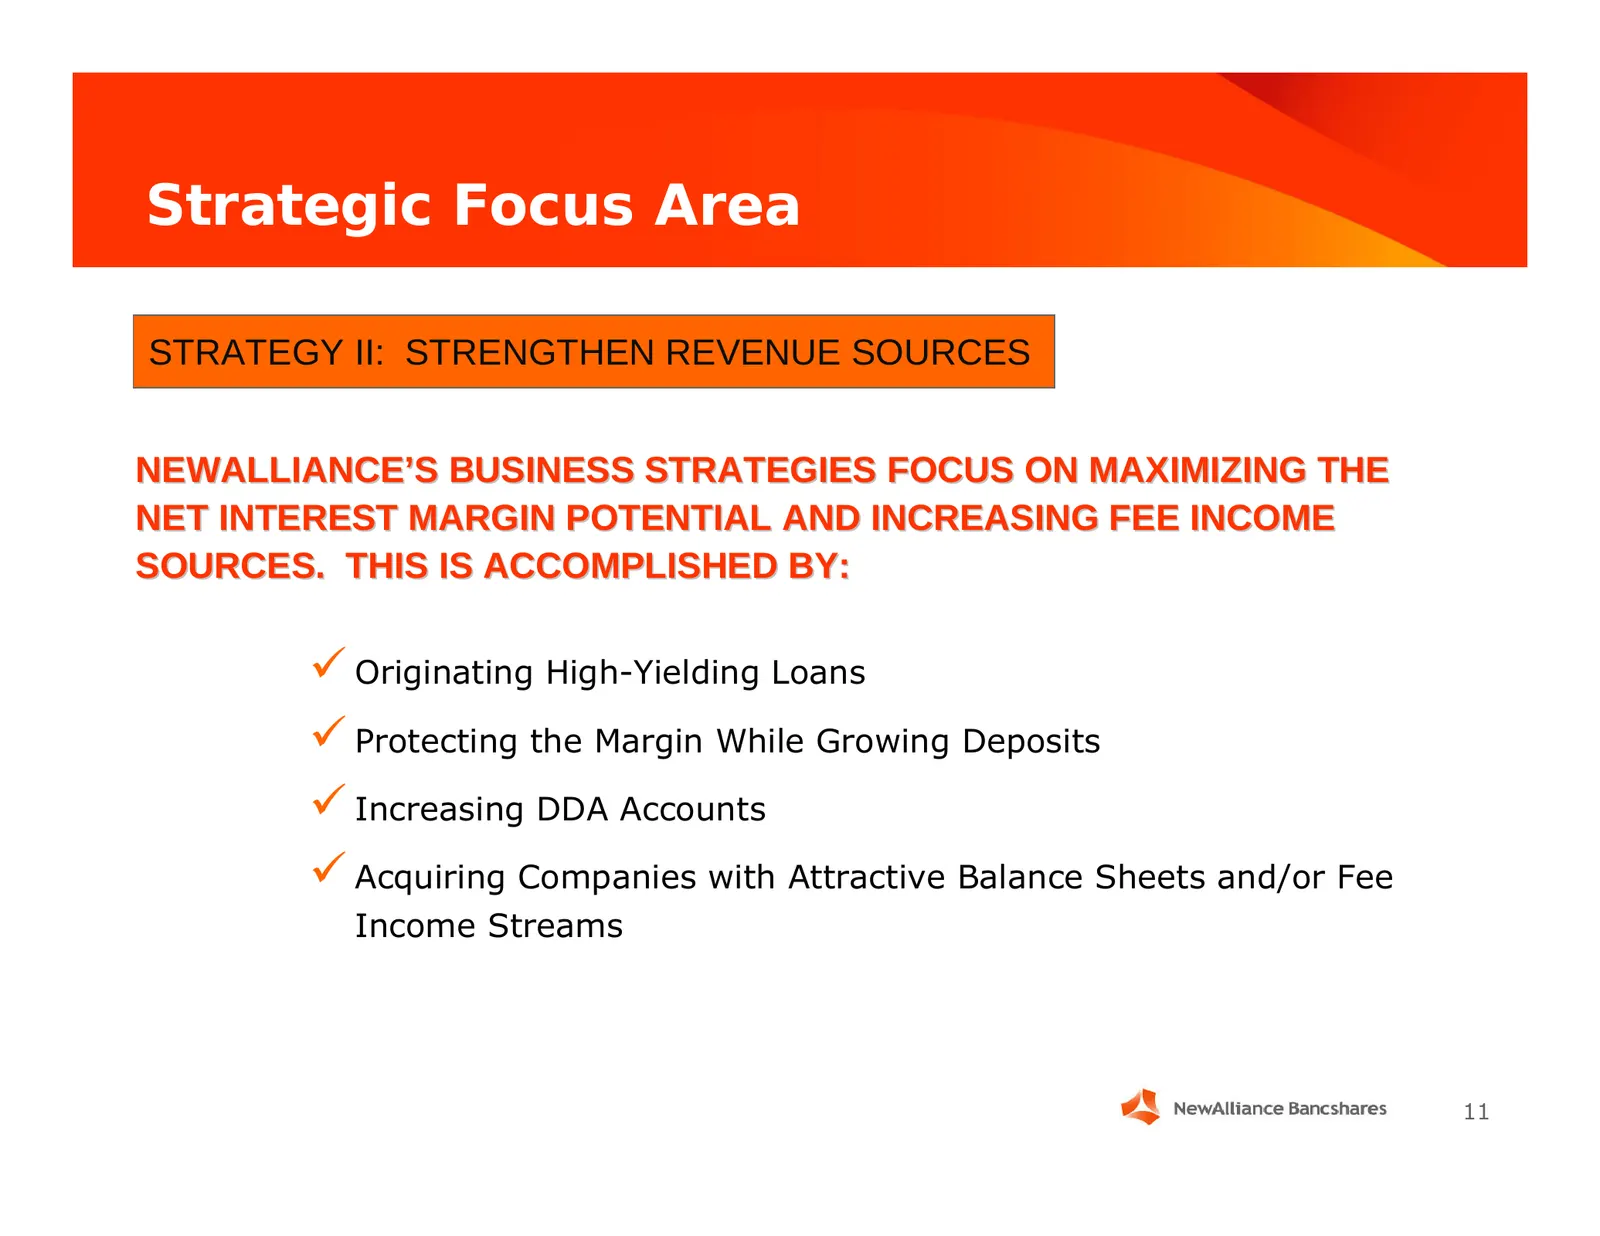
Strategic Focus Area STRATEGY II: STRENGTHEN REVENUE SOURCES NEWALLIANCE’S BUSINESS STRATEGIES FOCUS ON MAXIMIZING THE NET INTEREST MARGIN POTENTIAL AND INCREASING FEE INCOME SOURCES. THIS IS ACCOMPLISHED BY: 9 Originating High-Yielding Loans 9 Protecting the Margin While Growing Deposits 9 Increasi
Slide 12: Deposits 6/30/05
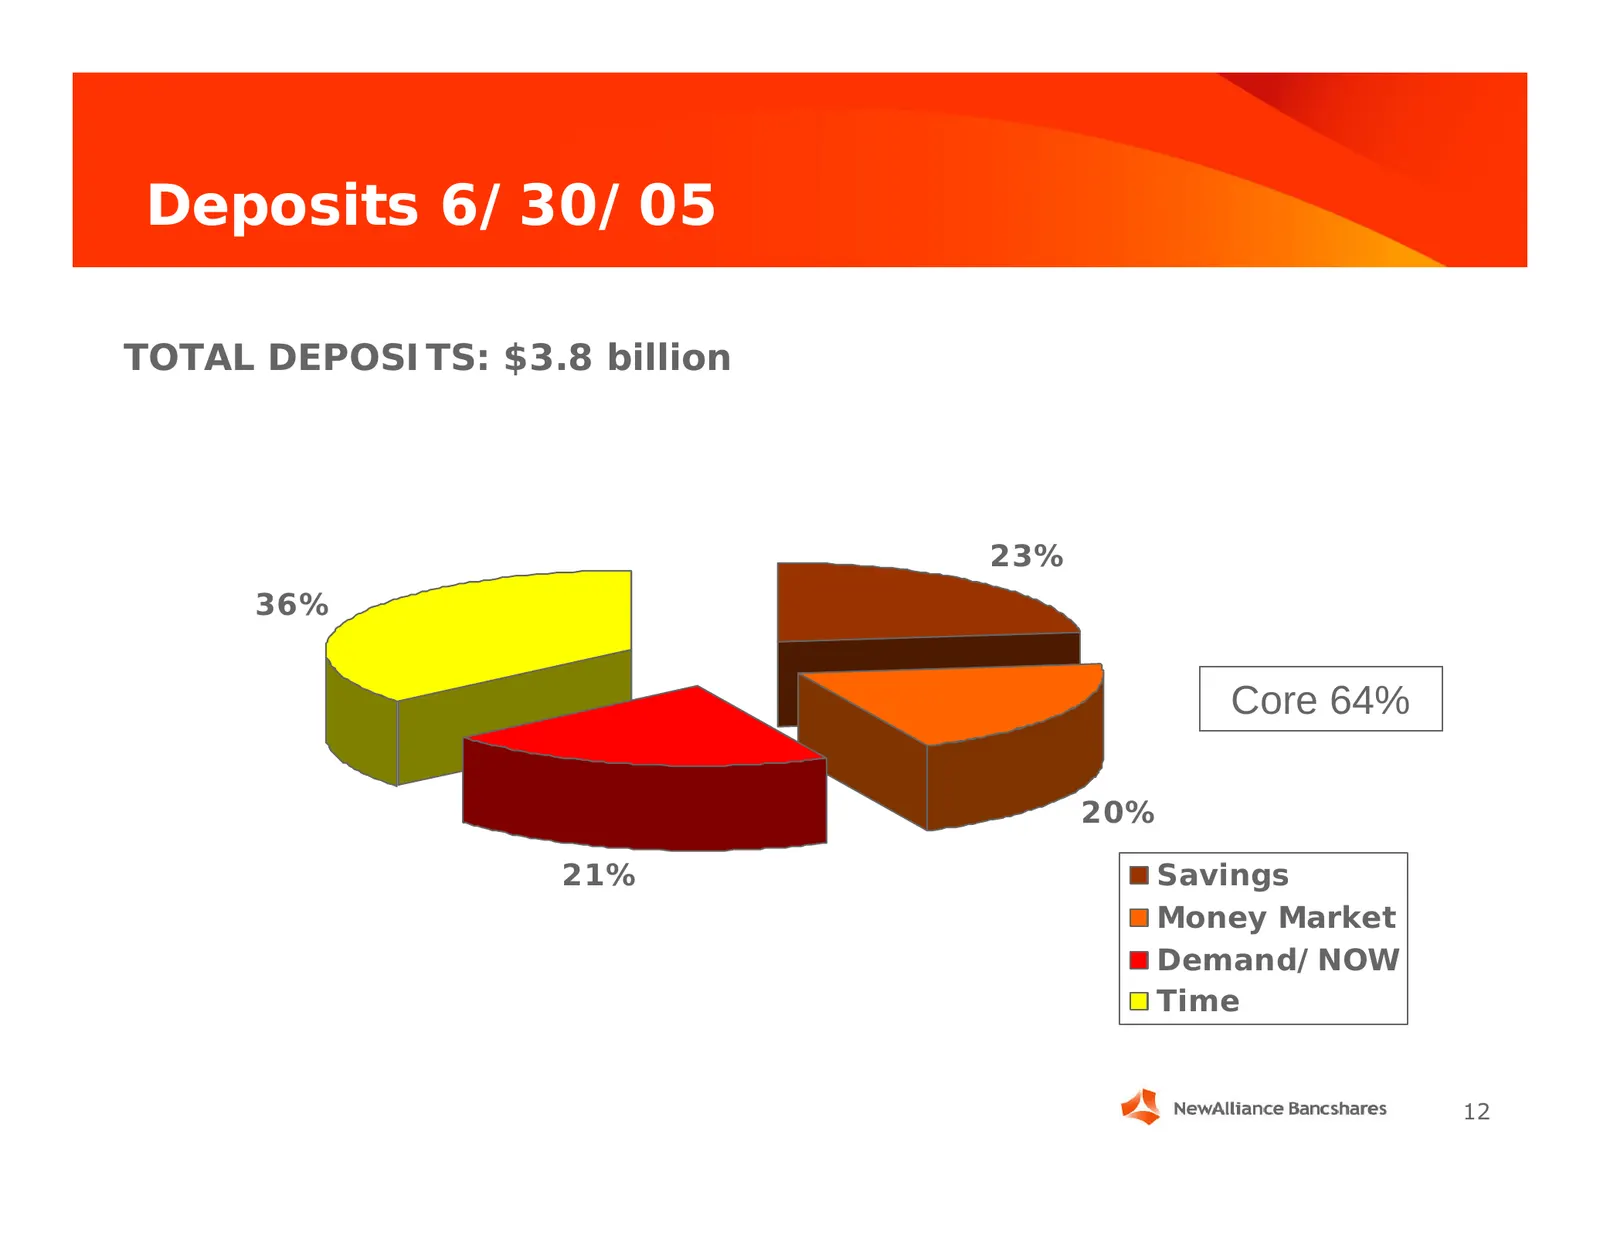
Deposits 6/30/05 TOTAL DEPOSITS: $3.8 billion 23% 36% Core 64% 20% 21% Savings Money Market Demand/NOW Time 12
Slide 13: Loans 6/30/05
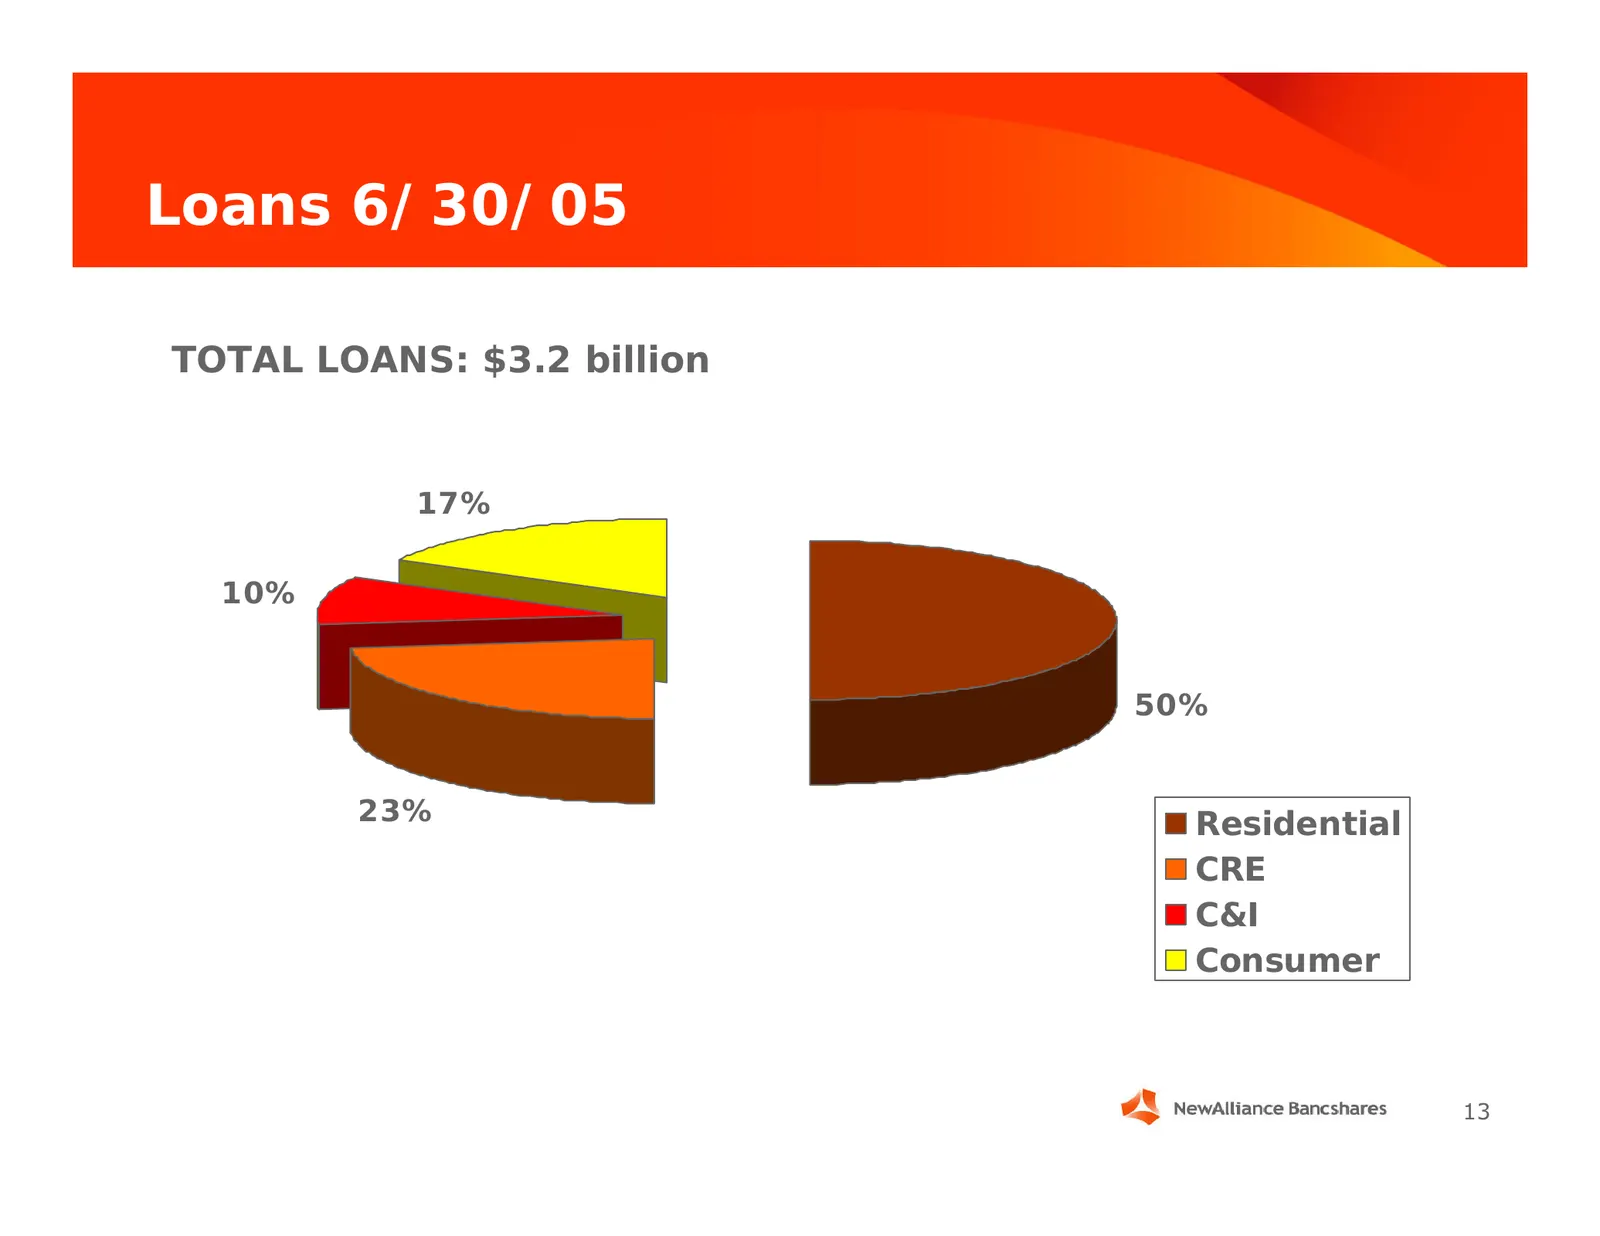
Loans 6/30/05 TOTAL LOANS: $3.2 billion 17% 10% 50% 23% Residential CRE C&I Consumer 13
Slide 14: Strategy III: Improve Operating Efficiencies
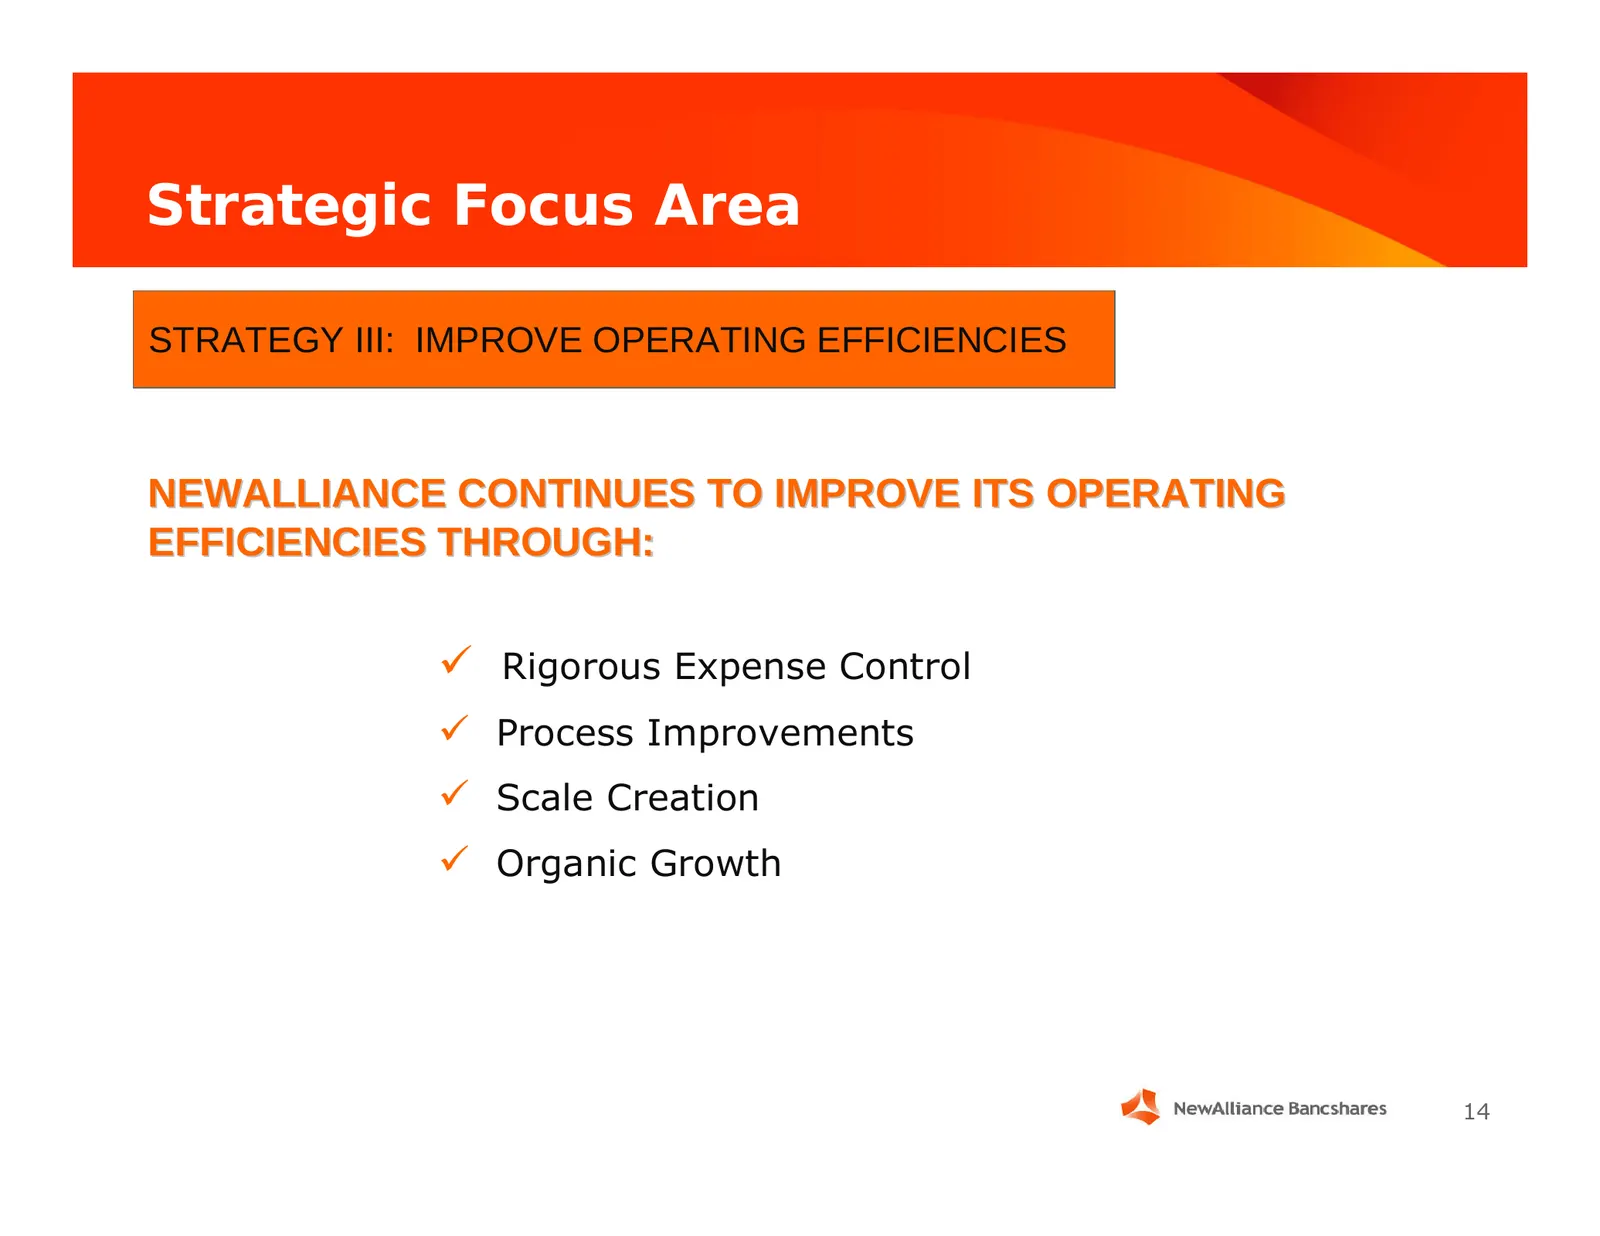
Strategic Focus Area STRATEGY III: IMPROVE OPERATING EFFICIENCIES NEWALLIANCE CONTINUES TO IMPROVE ITS OPERATING EFFICIENCIES THROUGH: 9 Rigorous Expense Control 9 Process Improvements 9 Scale Creation 9 Organic Growth 14
Slide 15: Strategy IV: Manage Capital
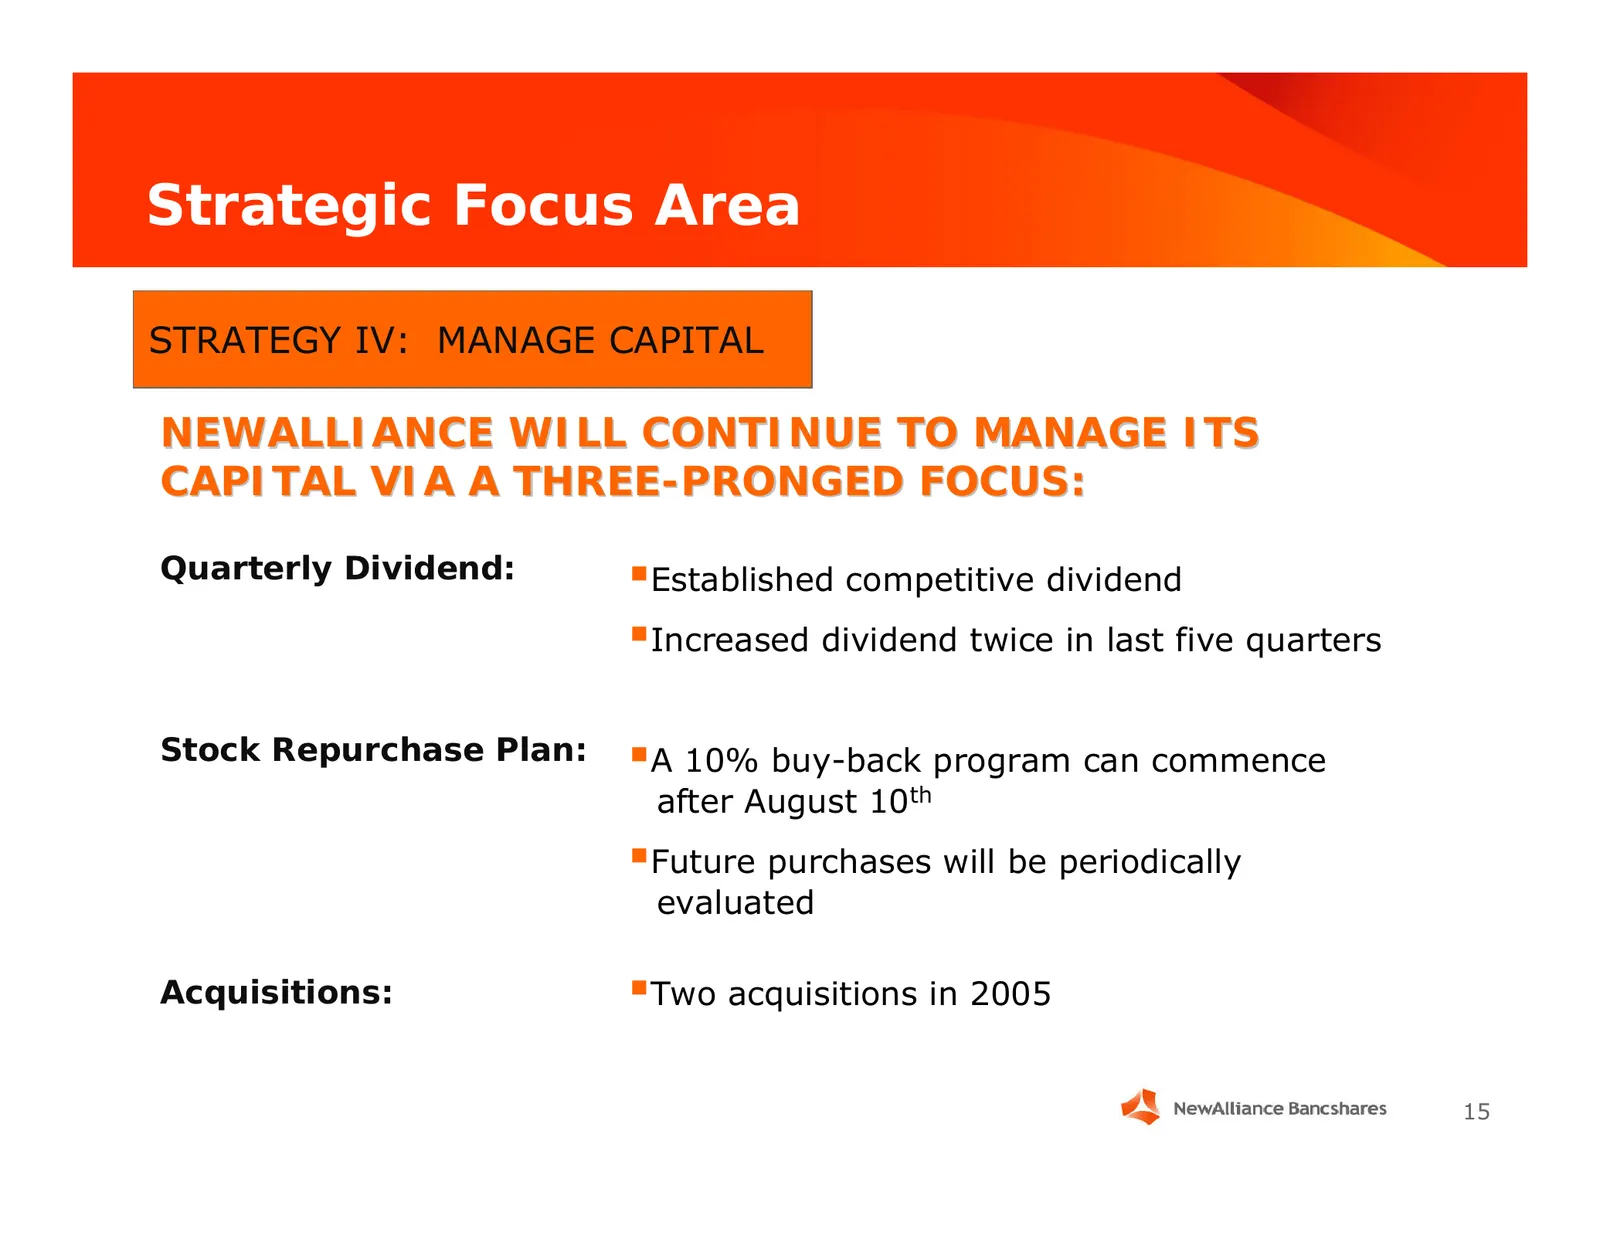
Strategic Focus Area STRATEGY IV: MANAGE CAPITAL NEWALLIANCE WILL CONTINUE TO MANAGE ITS CAPITAL VIA A THREE-PRONGED FOCUS: Quarterly Dividend: Established competitive dividend Increased dividend twice in last five quarters Stock Repurchase Plan: A 10% buy-back program can commence after August 1

Slide 16: Financial Overview
Financial Overview Financials Merrill B. Blanksteen Chief Financial Officer August 5, 2005
Slide 17: Balance Sheet Performance
Balance Sheet Performance Numbers have continued to improve in five quarters as a public company Earnings, ROA and Efficiency Ratio have benefited from merger-related cost saves and growth Asset quality has improved further 17
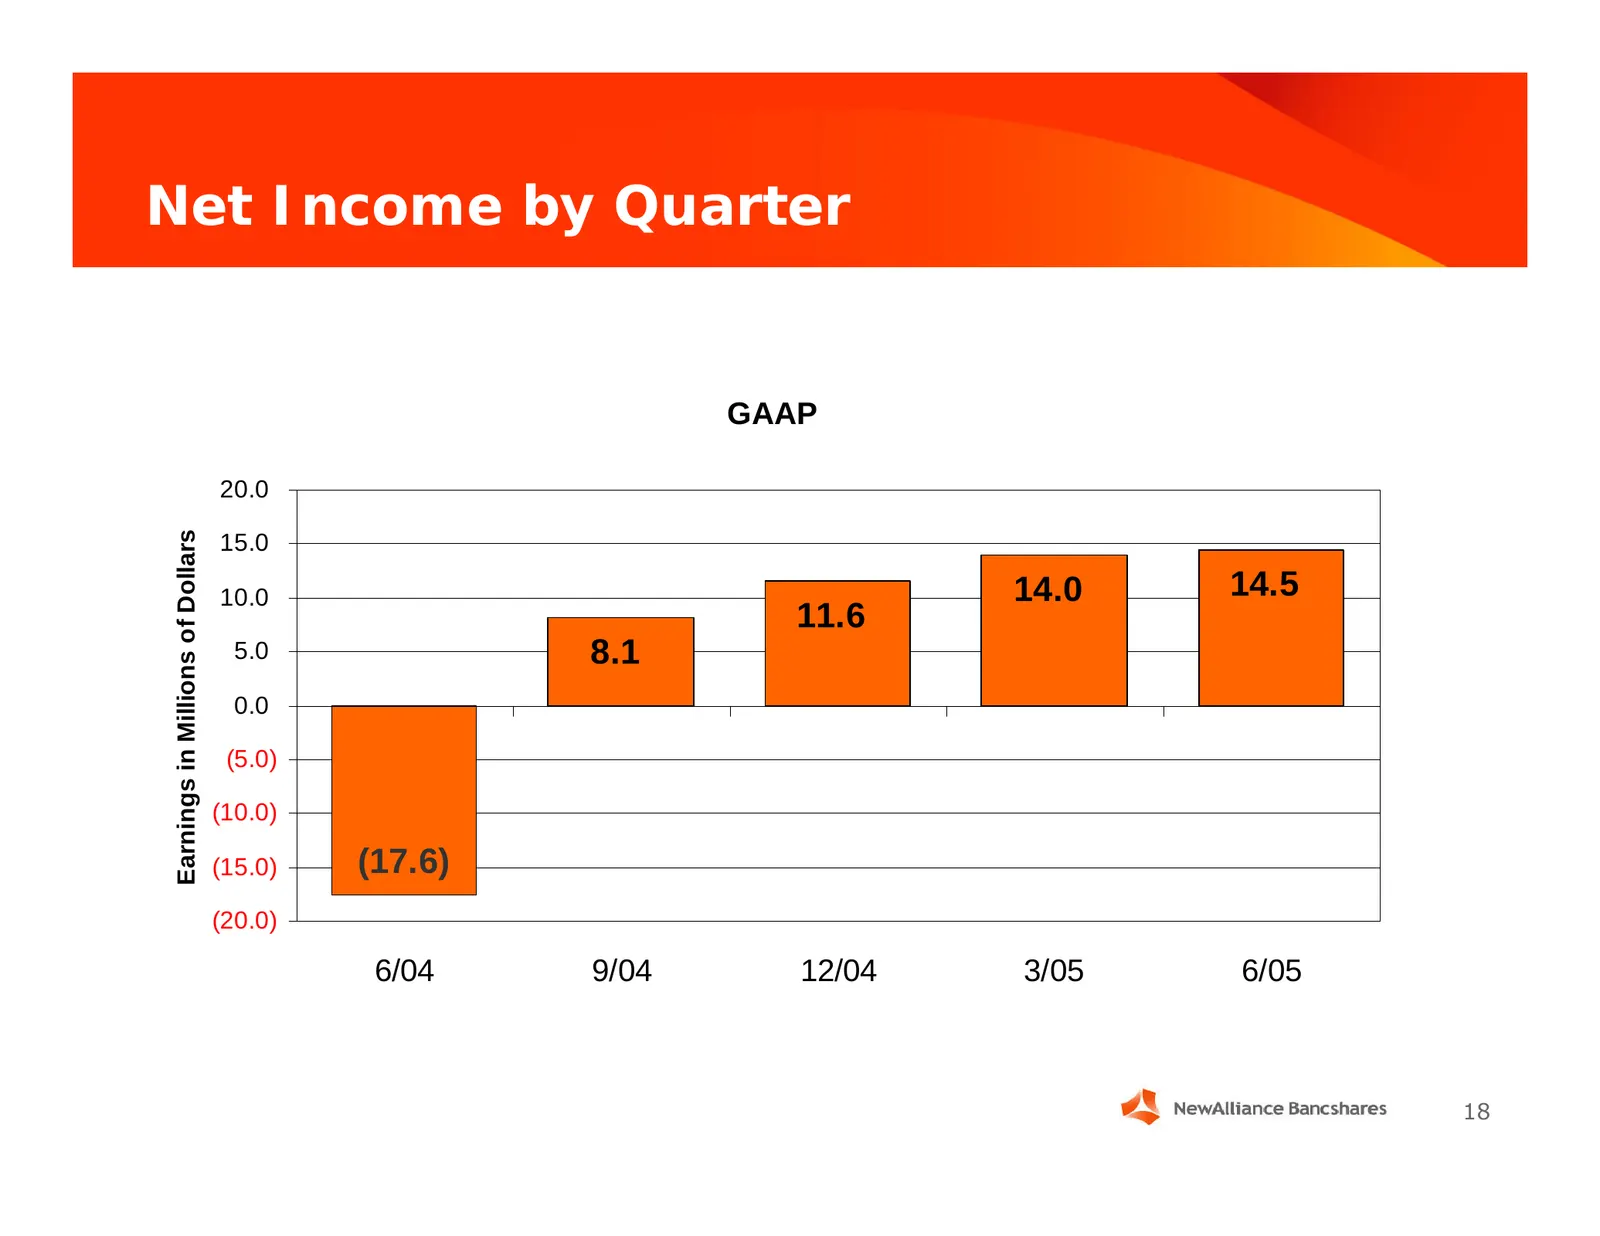
Slide 18: Net Income by Quarter (GAAP)
Net Income by Quarter GAAP 20.0 Earnings in Millions of Dollars 15.0 10.0 14.0 14.5 11.6 5.0 8.1 0.0 (5.0) (10.0) (15.0) (17.6) (20.0) 6/04 9/04 12/04 3/05 6/05 18
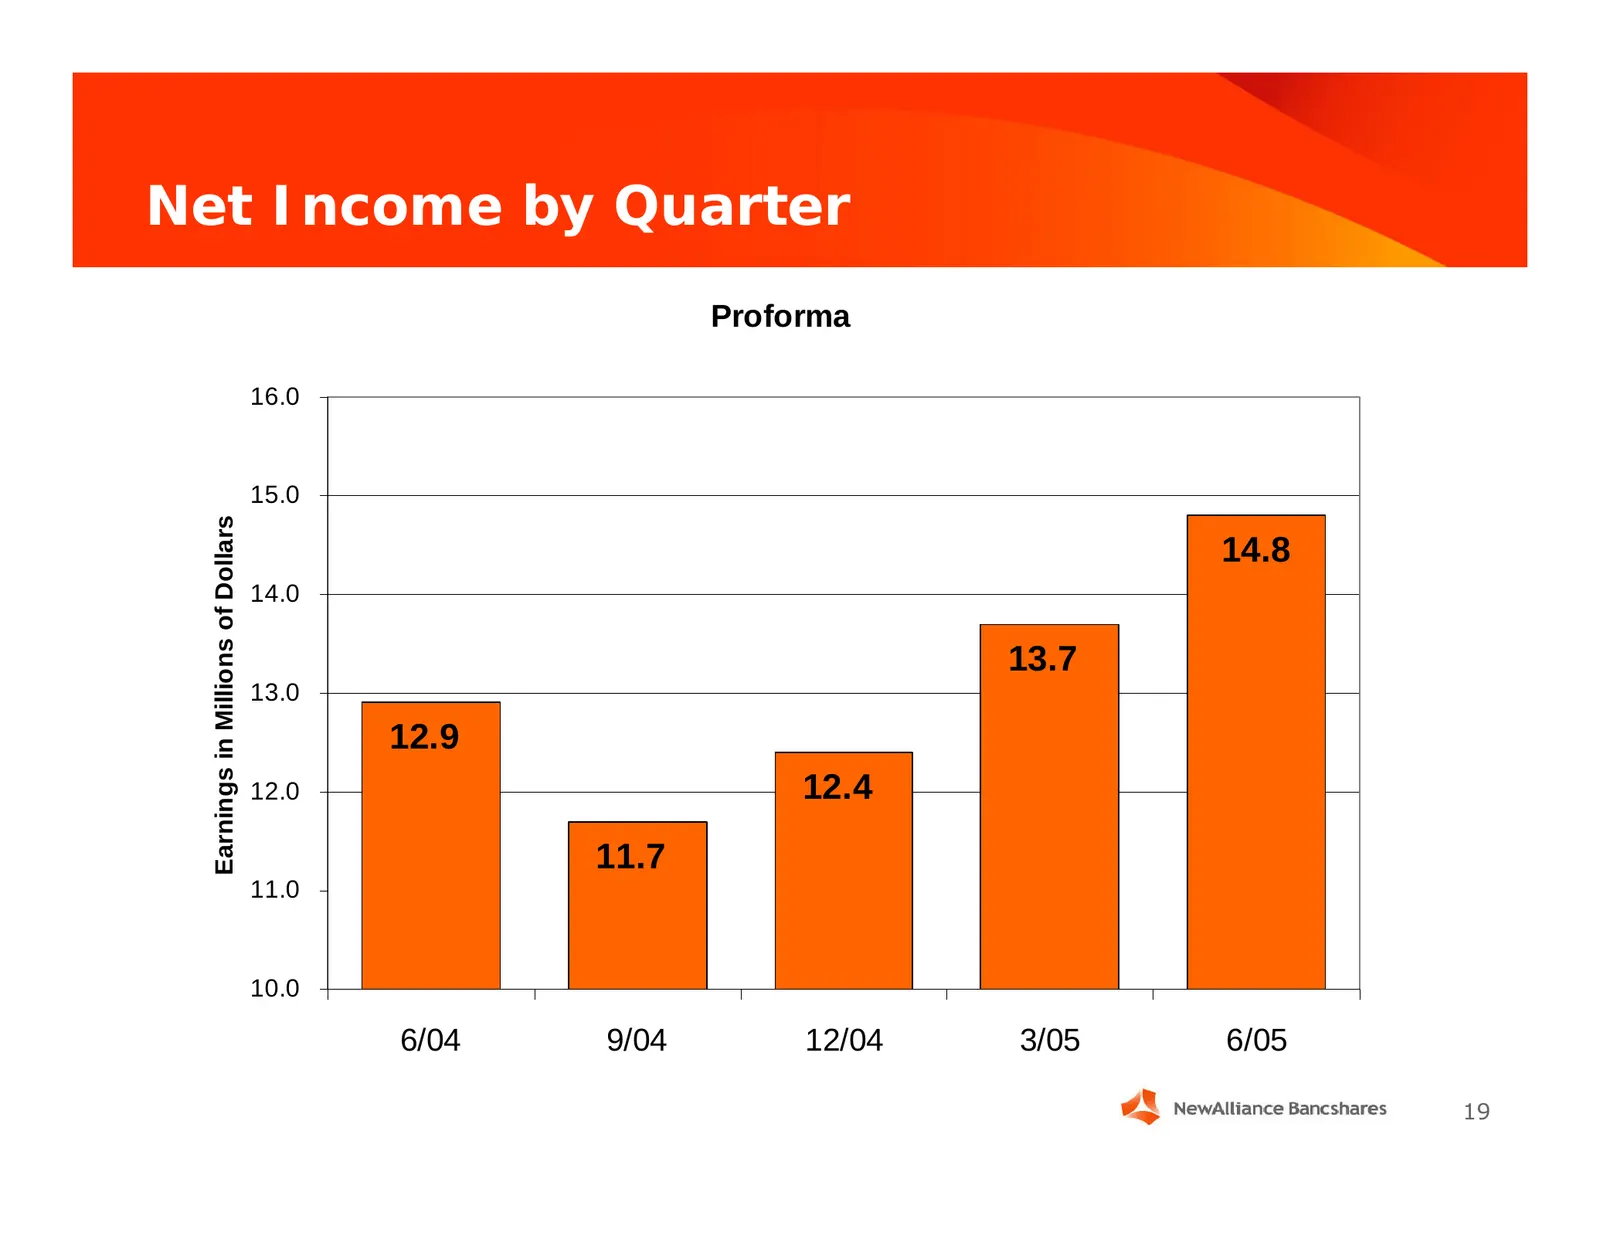
Slide 19: Net Income by Quarter (Proforma)
Net Income by Quarter Proforma 16.0 15.0 Earnings in Millions of Dollars 14.8 14.0 13.7 13.0 12.9 12.0 12.4 11.7 11.0 10.0 6/04 9/04 12/04 3/05 6/05 19
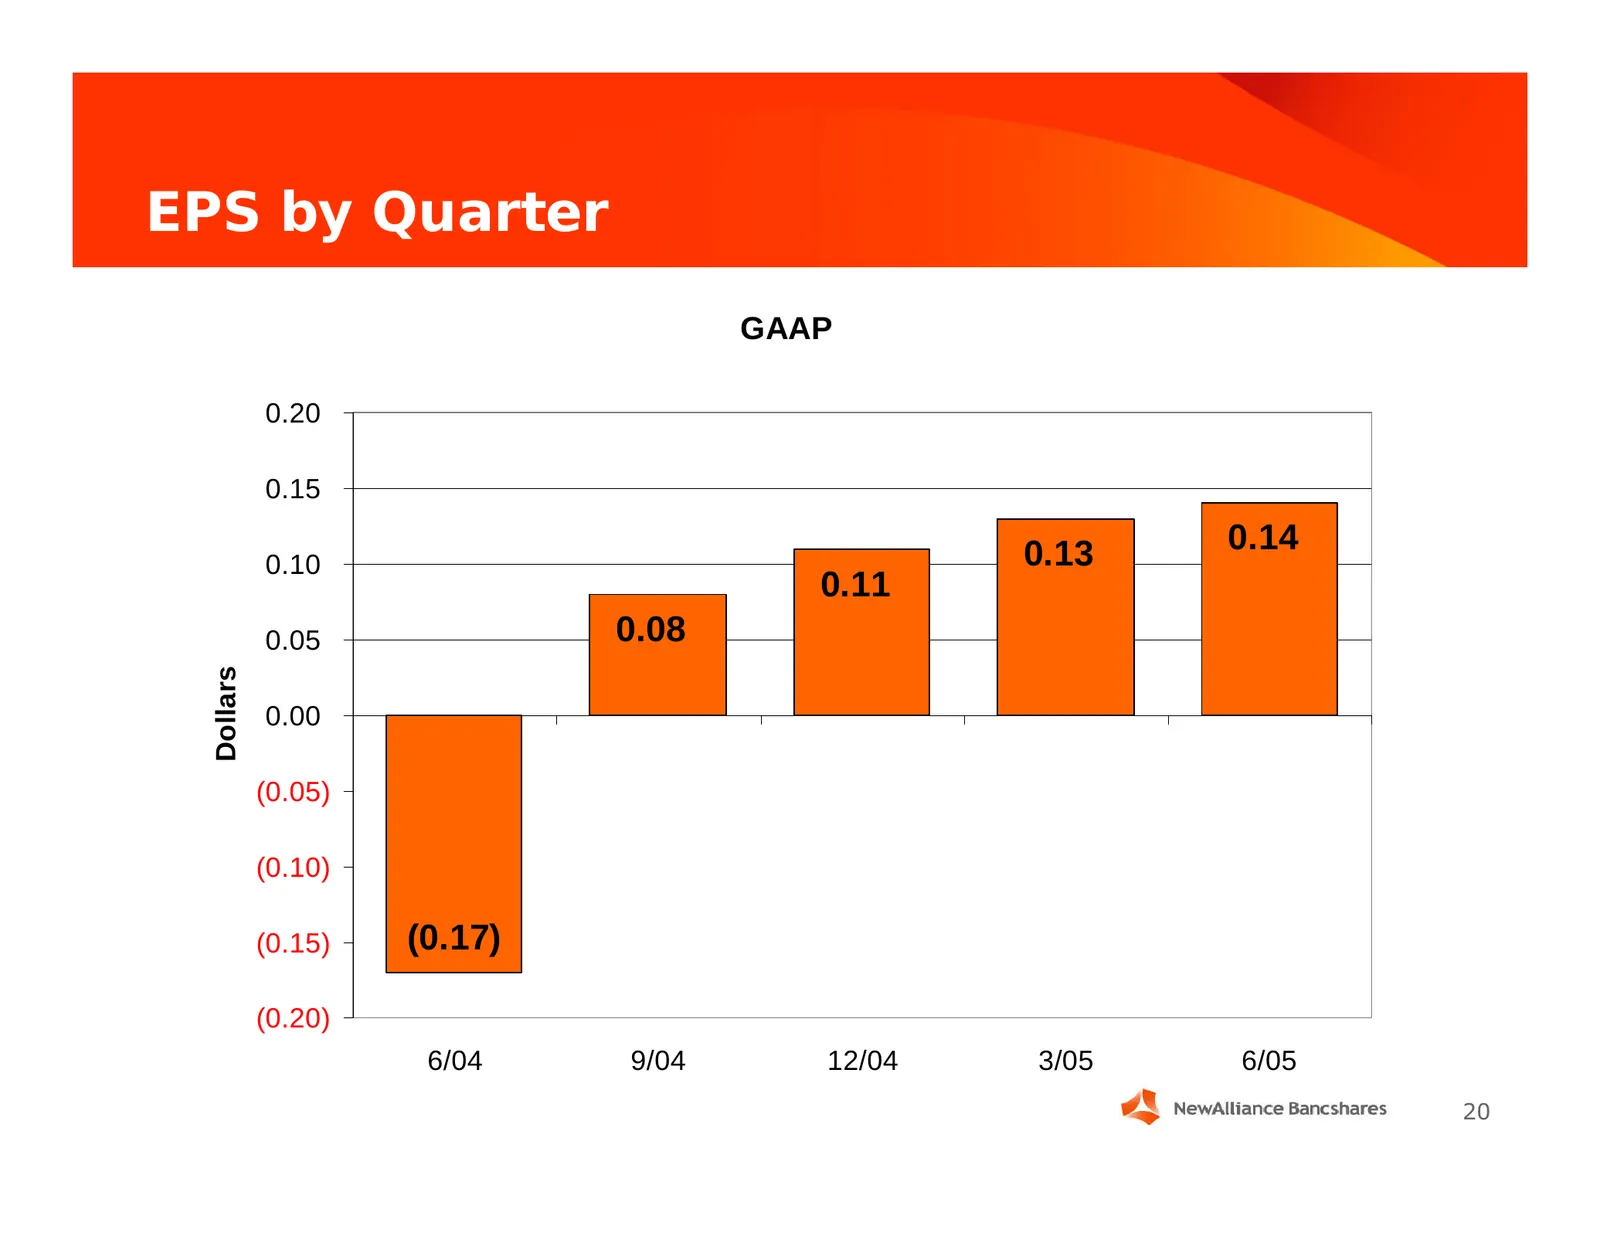
Slide 20: EPS by Quarter (GAAP)
EPS by Quarter GAAP 0.20 0.15 0.13 0.14 0.10 0.11 0.05 0.08 Dollars 0.00 (0.05) (0.10) (0.15) (0.17) (0.20) 6/04 9/04 12/04 3/05 6/05 20
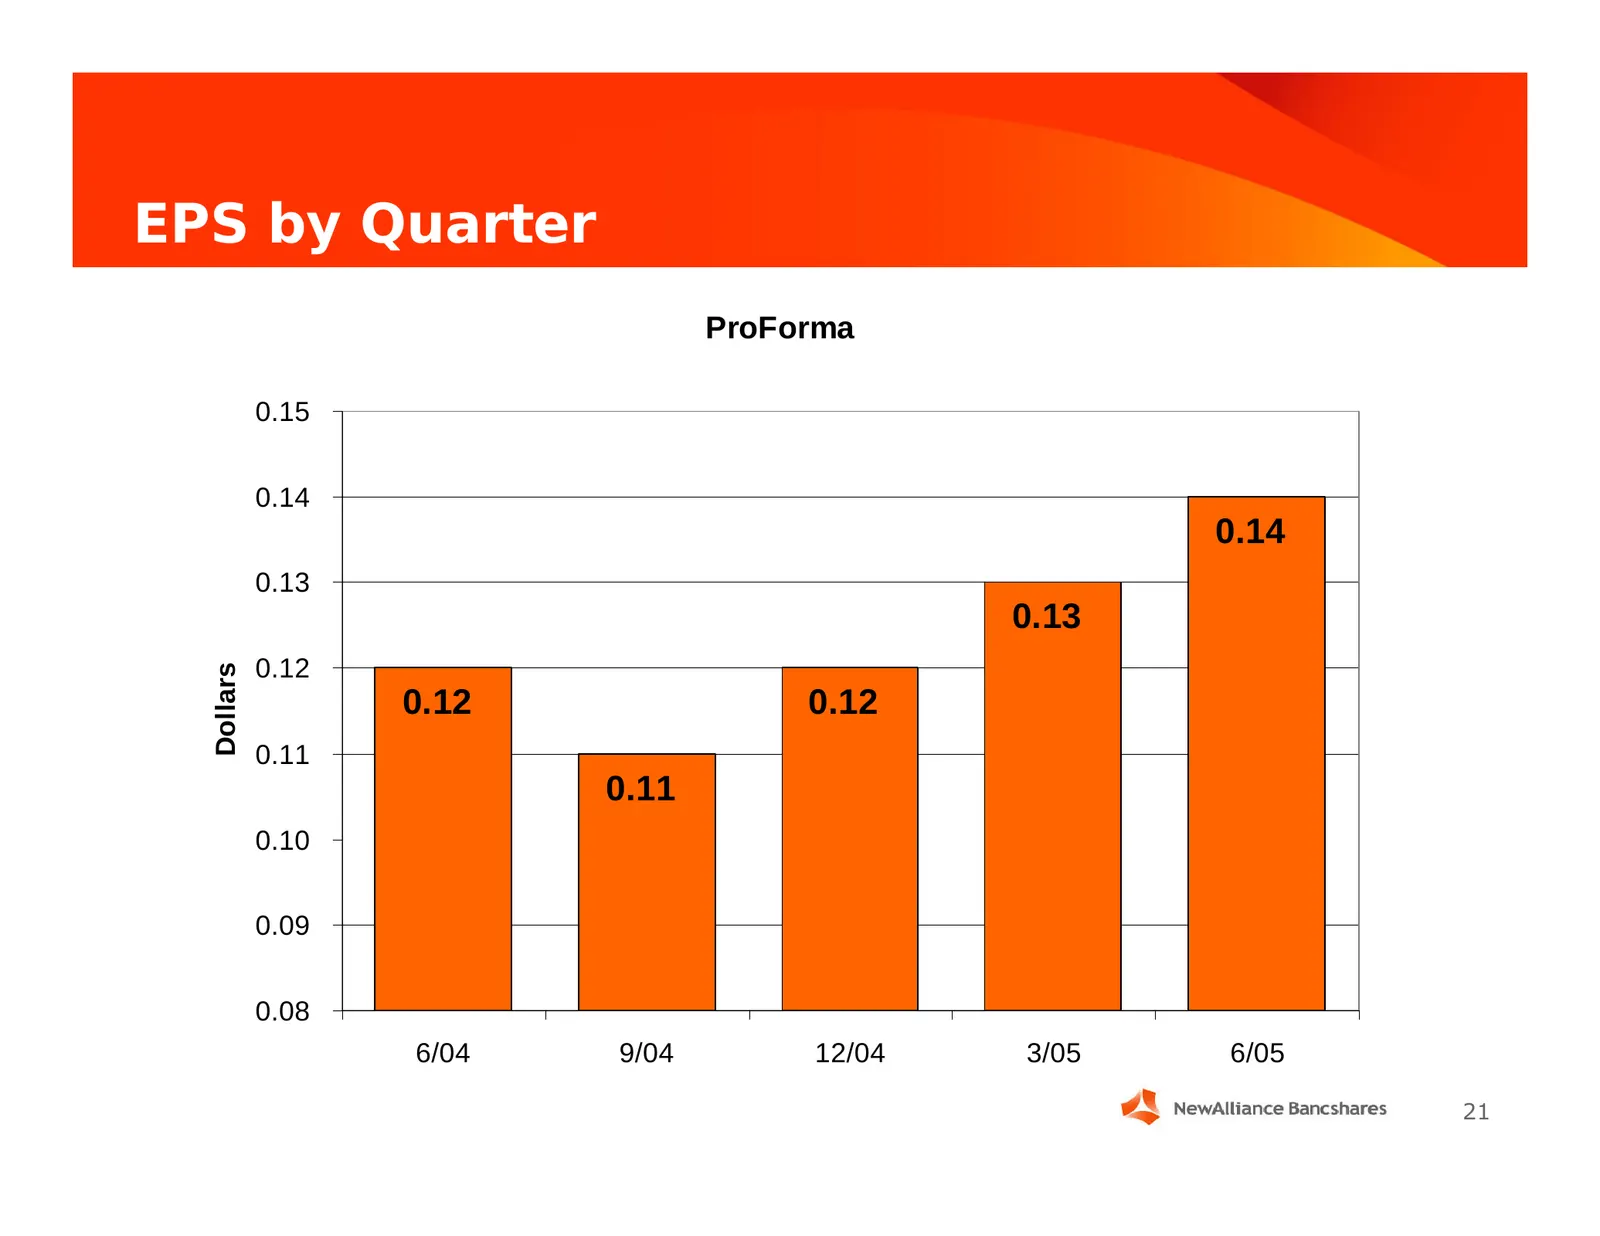
Slide 21: EPS by Quarter (ProForma)
EPS by Quarter ProForma 0.15 0.14 0.14 0.13 0.13 0.12 Dollars 0.12 0.12 0.11 0.11 0.10 0.09 0.08 6/04 9/04 12/04 3/05 6/05 21
Slide 22: Quarterly ROA (GAAP)
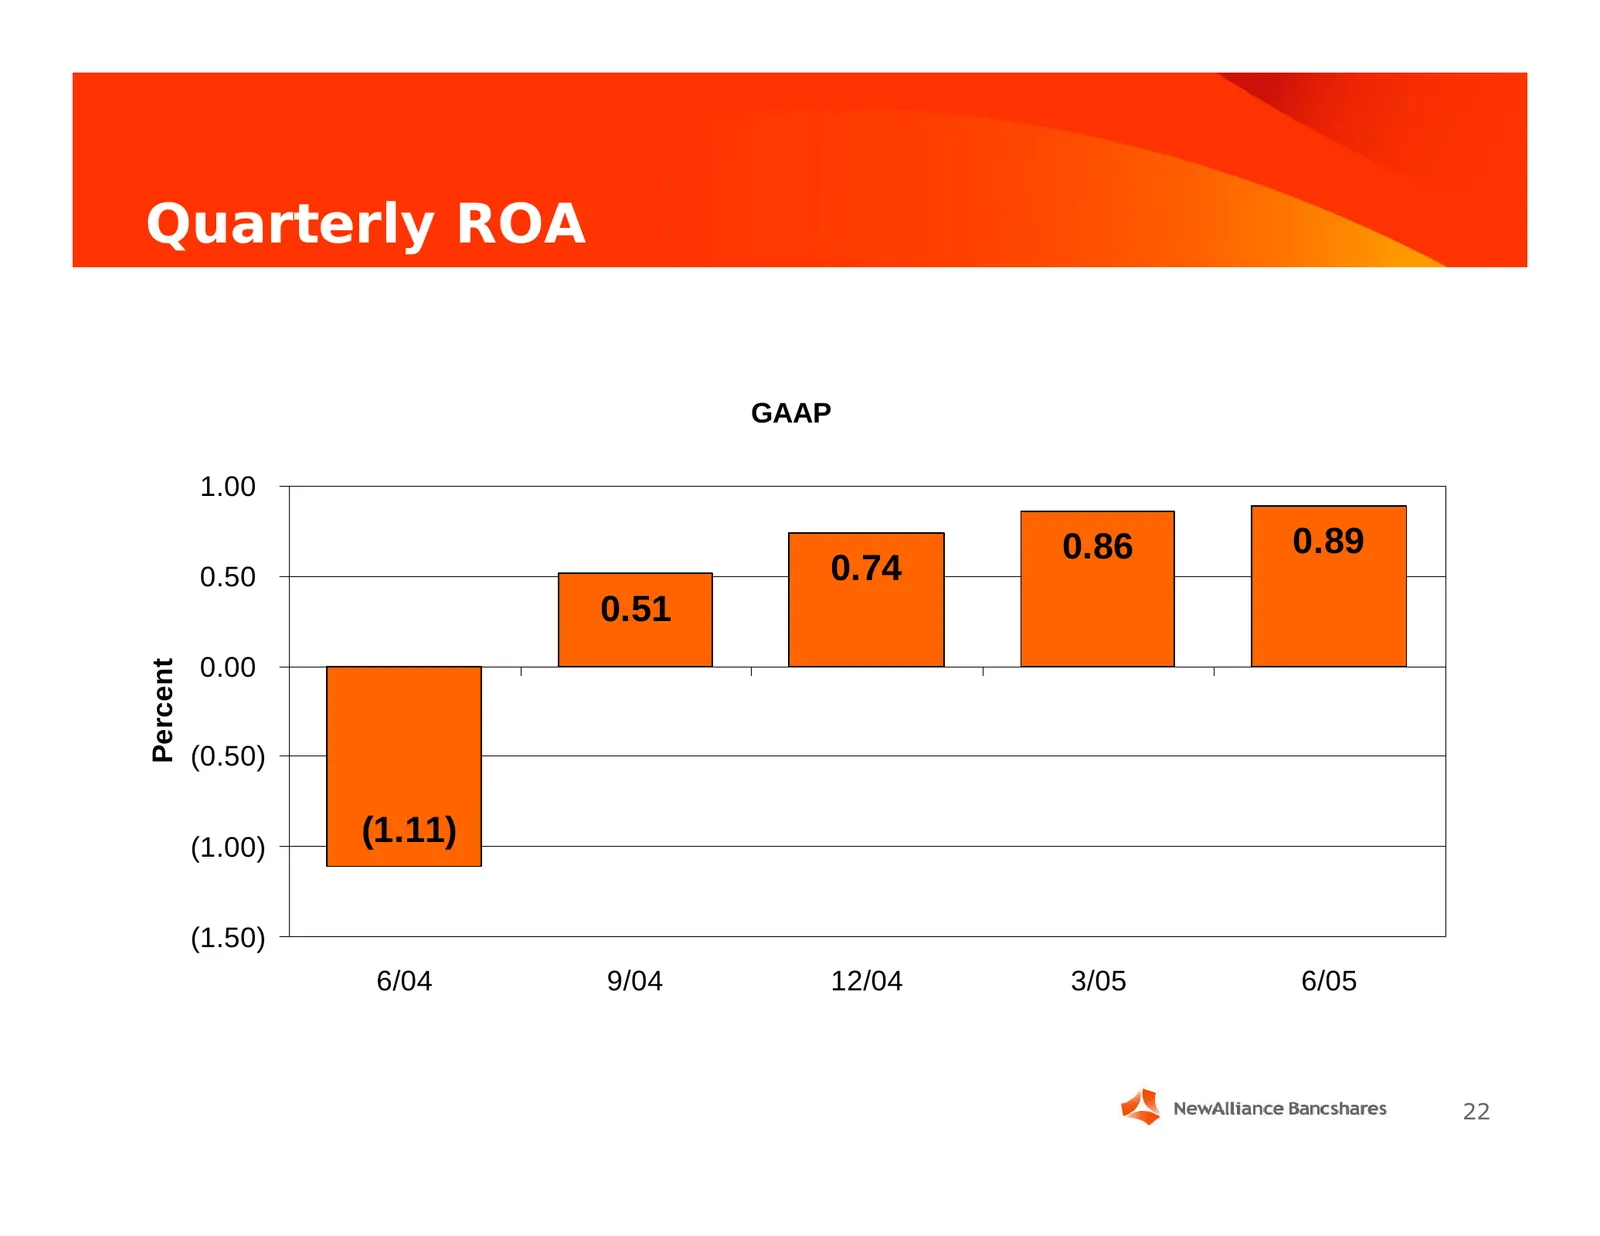
Quarterly ROA GAAP 1.00 0.86 0.89 0.50 0.74 0.51 0.00 Percent (0.50) (1.00) (1.11) (1.50) 6/04 9/04 12/04 3/05 6/05 22
Slide 23: Quarterly ROA (Proforma)
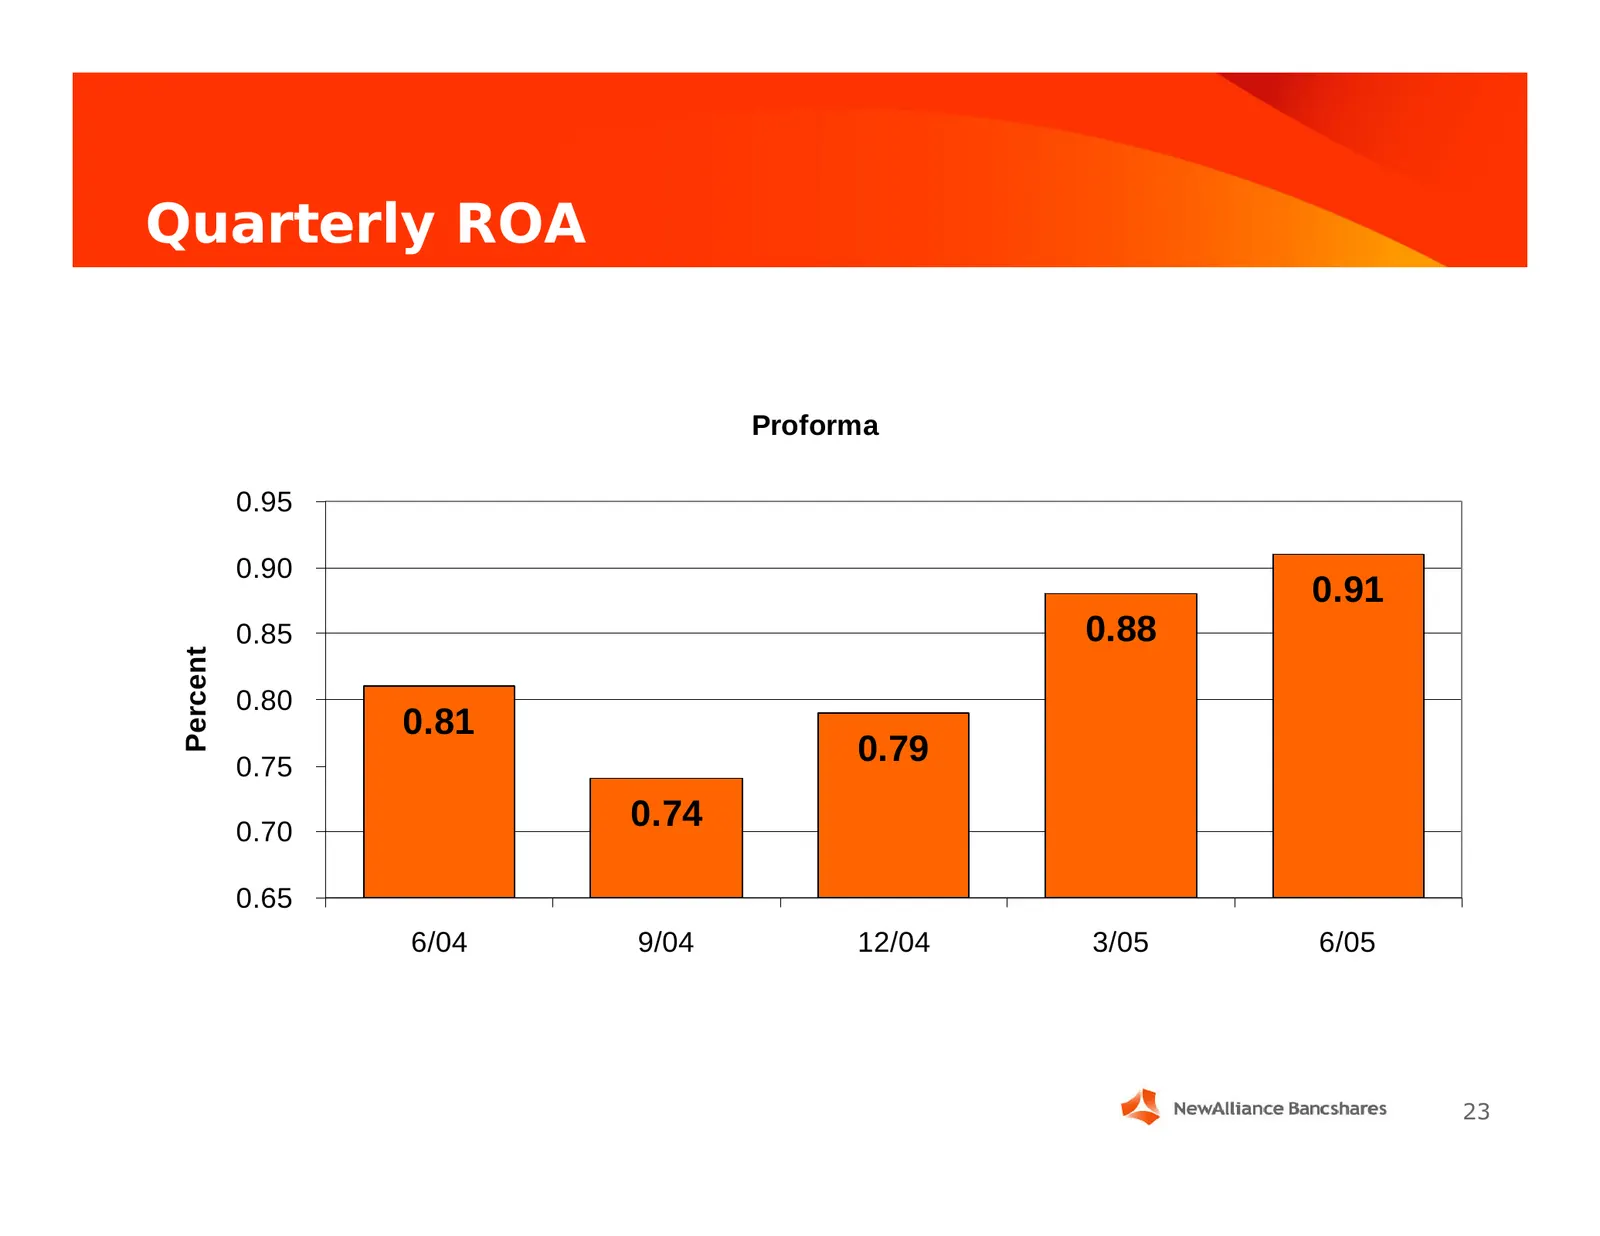
Quarterly ROA Proforma 0.95 0.90 0.91 0.85 0.88 Percent 0.80 0.81 0.75 0.79 0.70 0.74 0.65 6/04 9/04 12/04 3/05 6/05 23
Slide 24: Quarterly Efficiency Ratio (GAAP)
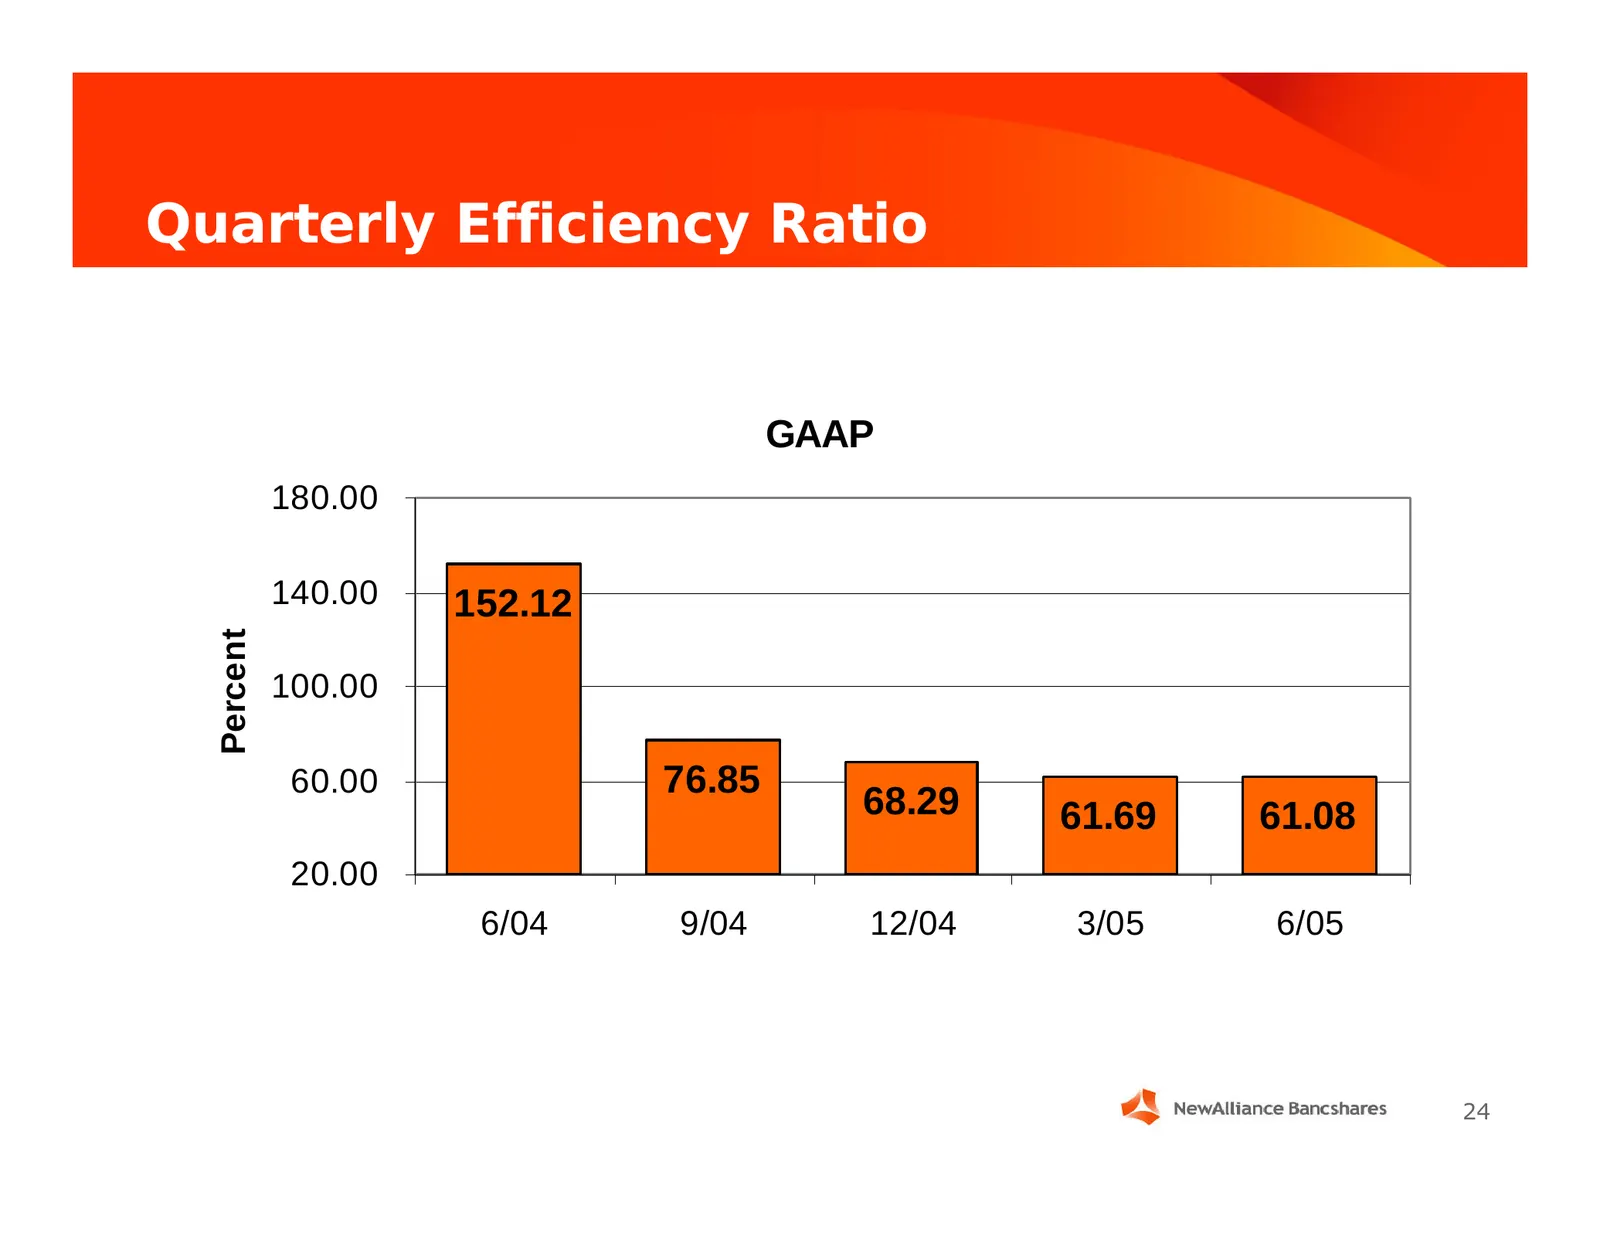
Quarterly Efficiency Ratio GAAP 180.00 140.00 152.12 Percent 100.00 60.00 76.85 68.29 61.69 61.08 20.00 6/04 9/04 12/04 3/05 6/05 24
Slide 25: Quarterly Efficiency Ratio (Proforma)
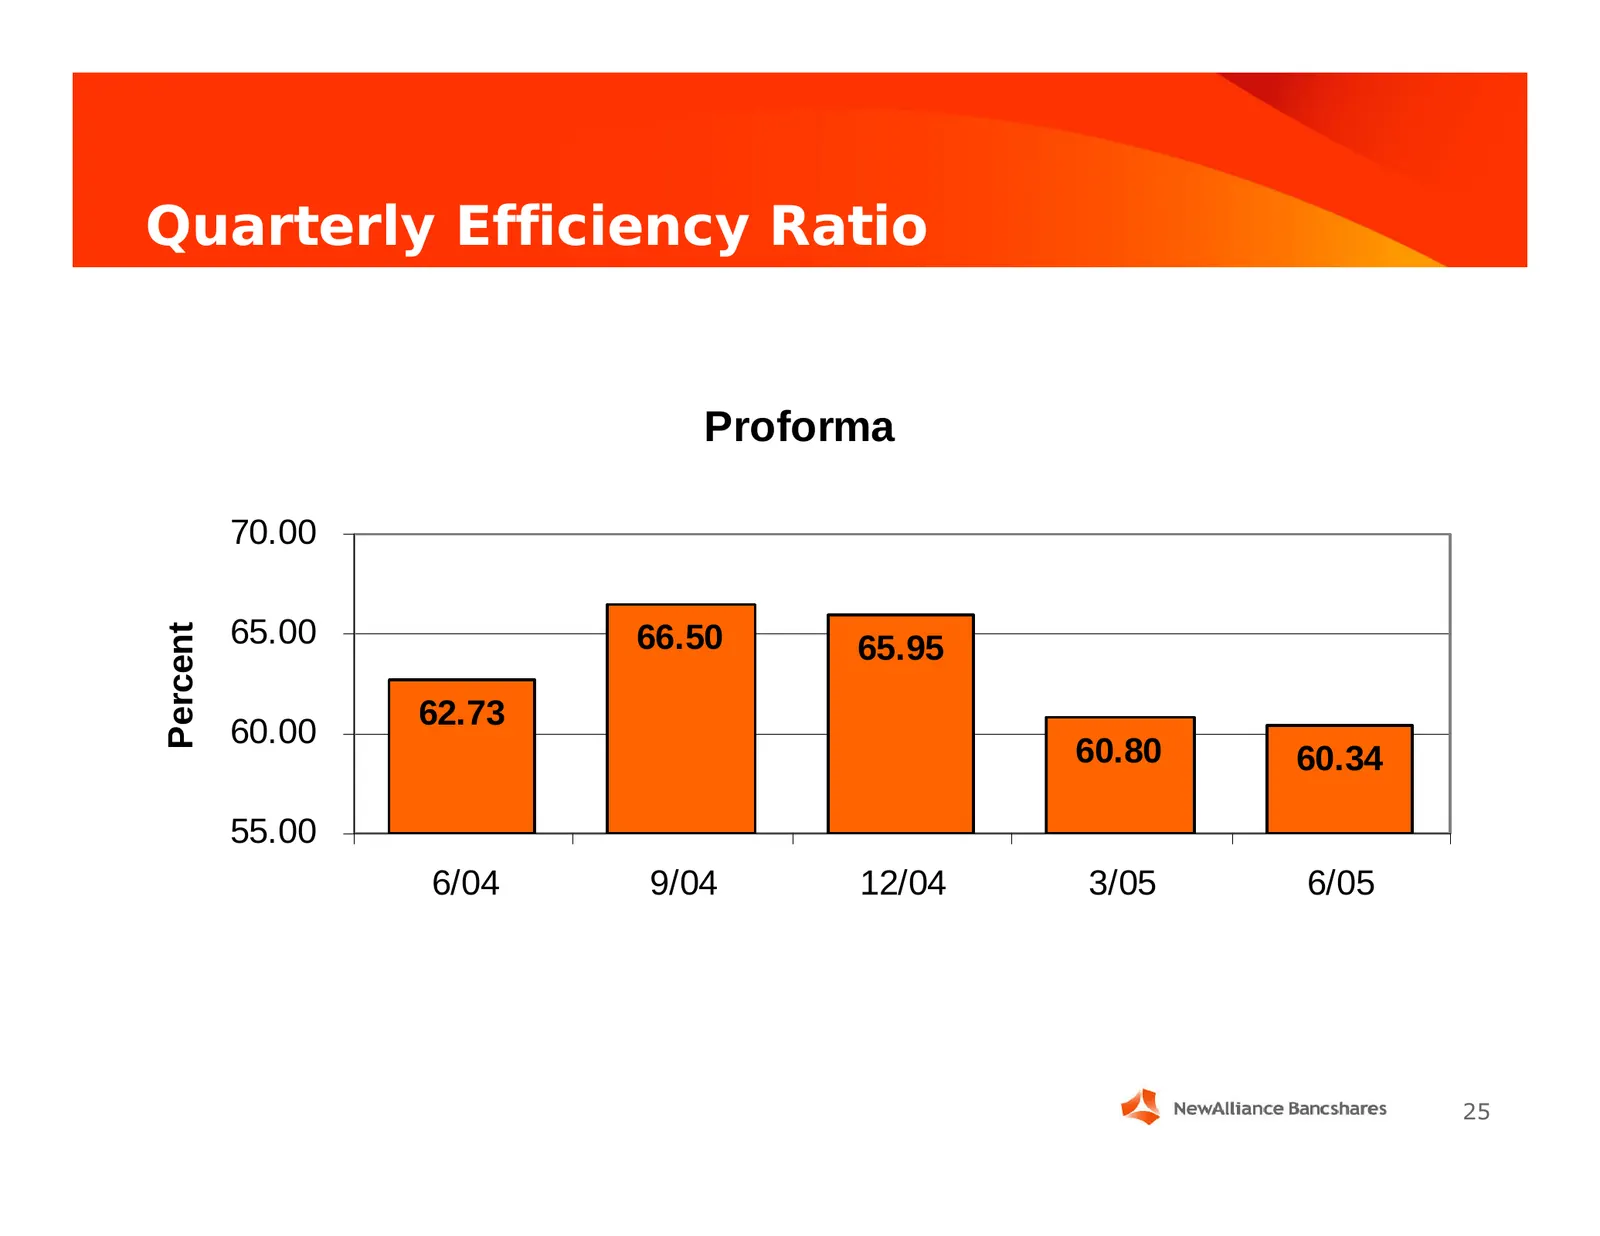
Quarterly Efficiency Ratio Proforma 70.00 65.00 Percent 66.50 65.95 62.73 60.00 60.80 60.34 55.00 6/04 9/04 12/04 3/05 6/05 25
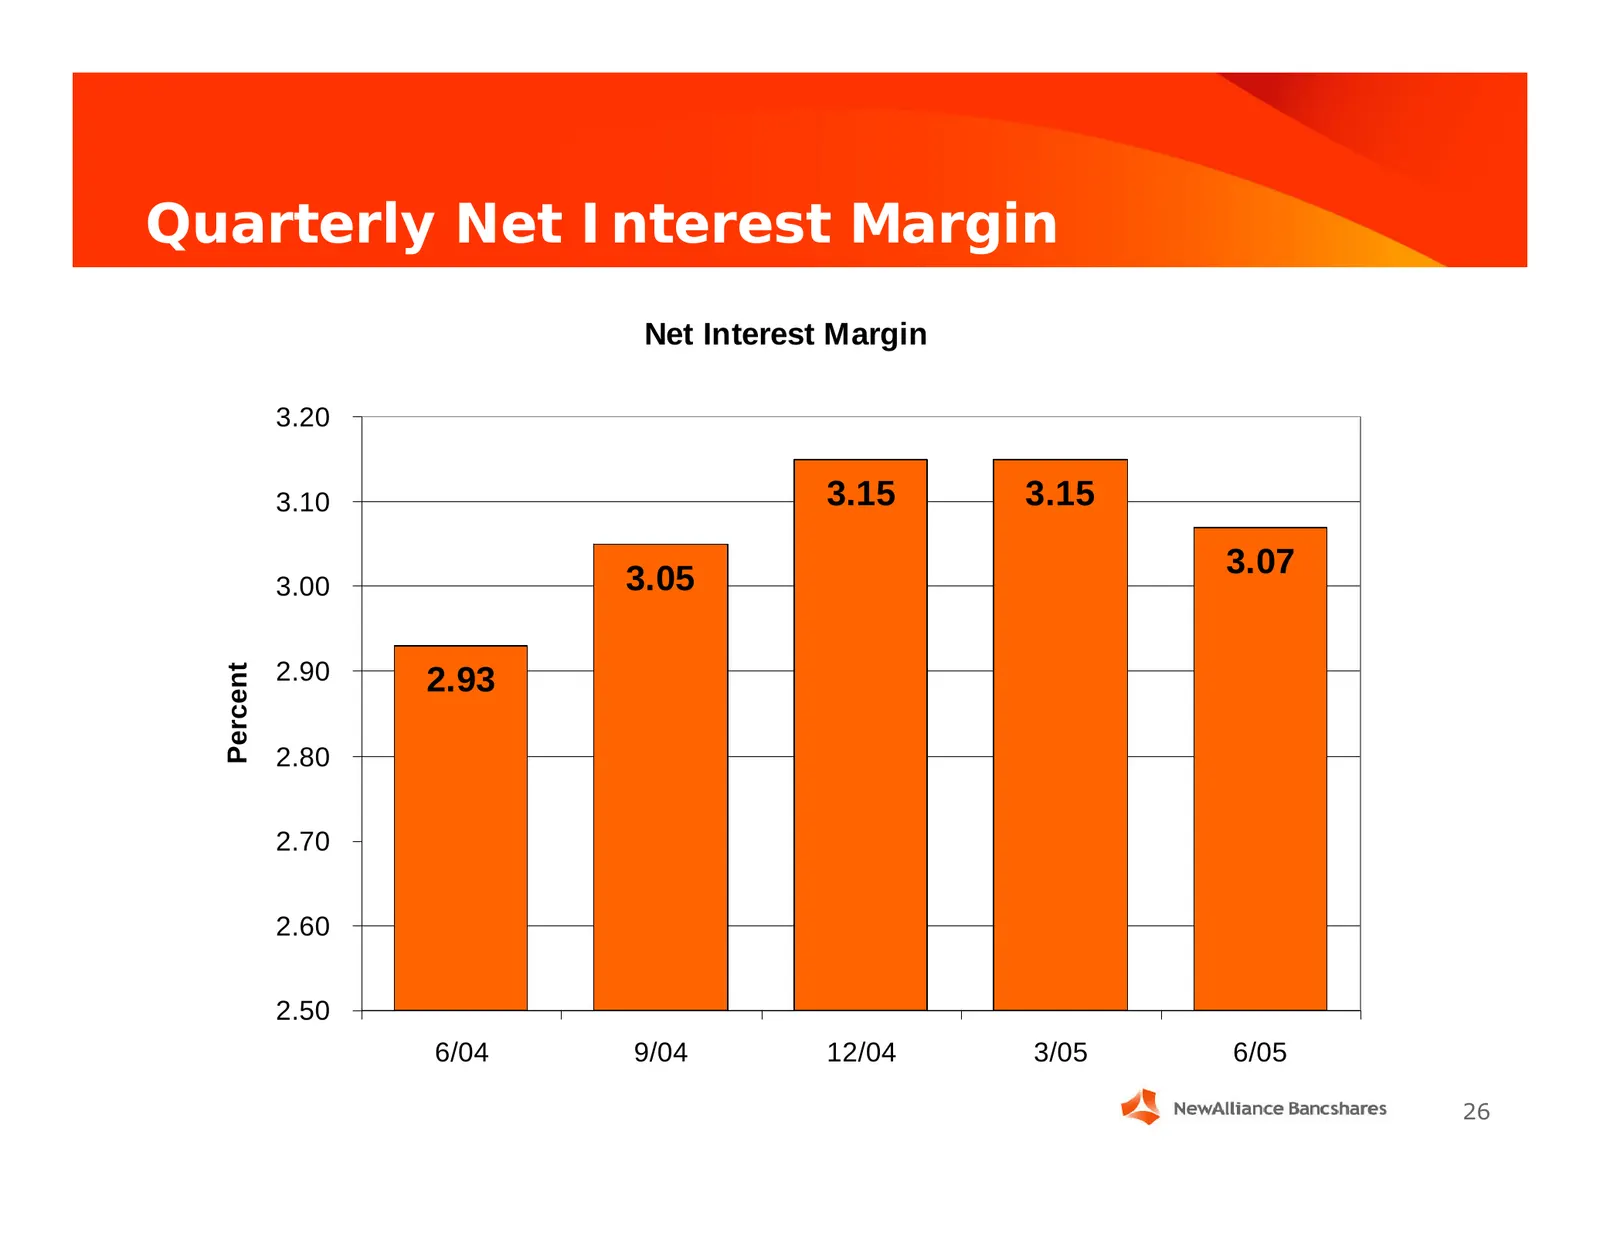
Slide 26: Quarterly Net Interest Margin
Quarterly Net Interest Margin Net Interest Margin 3.20 3.10 3.15 3.15 3.05 3.07 3.00 2.90 Percent 2.93 2.80 2.70 2.60 2.50 6/04 9/04 12/04 3/05 6/05 26
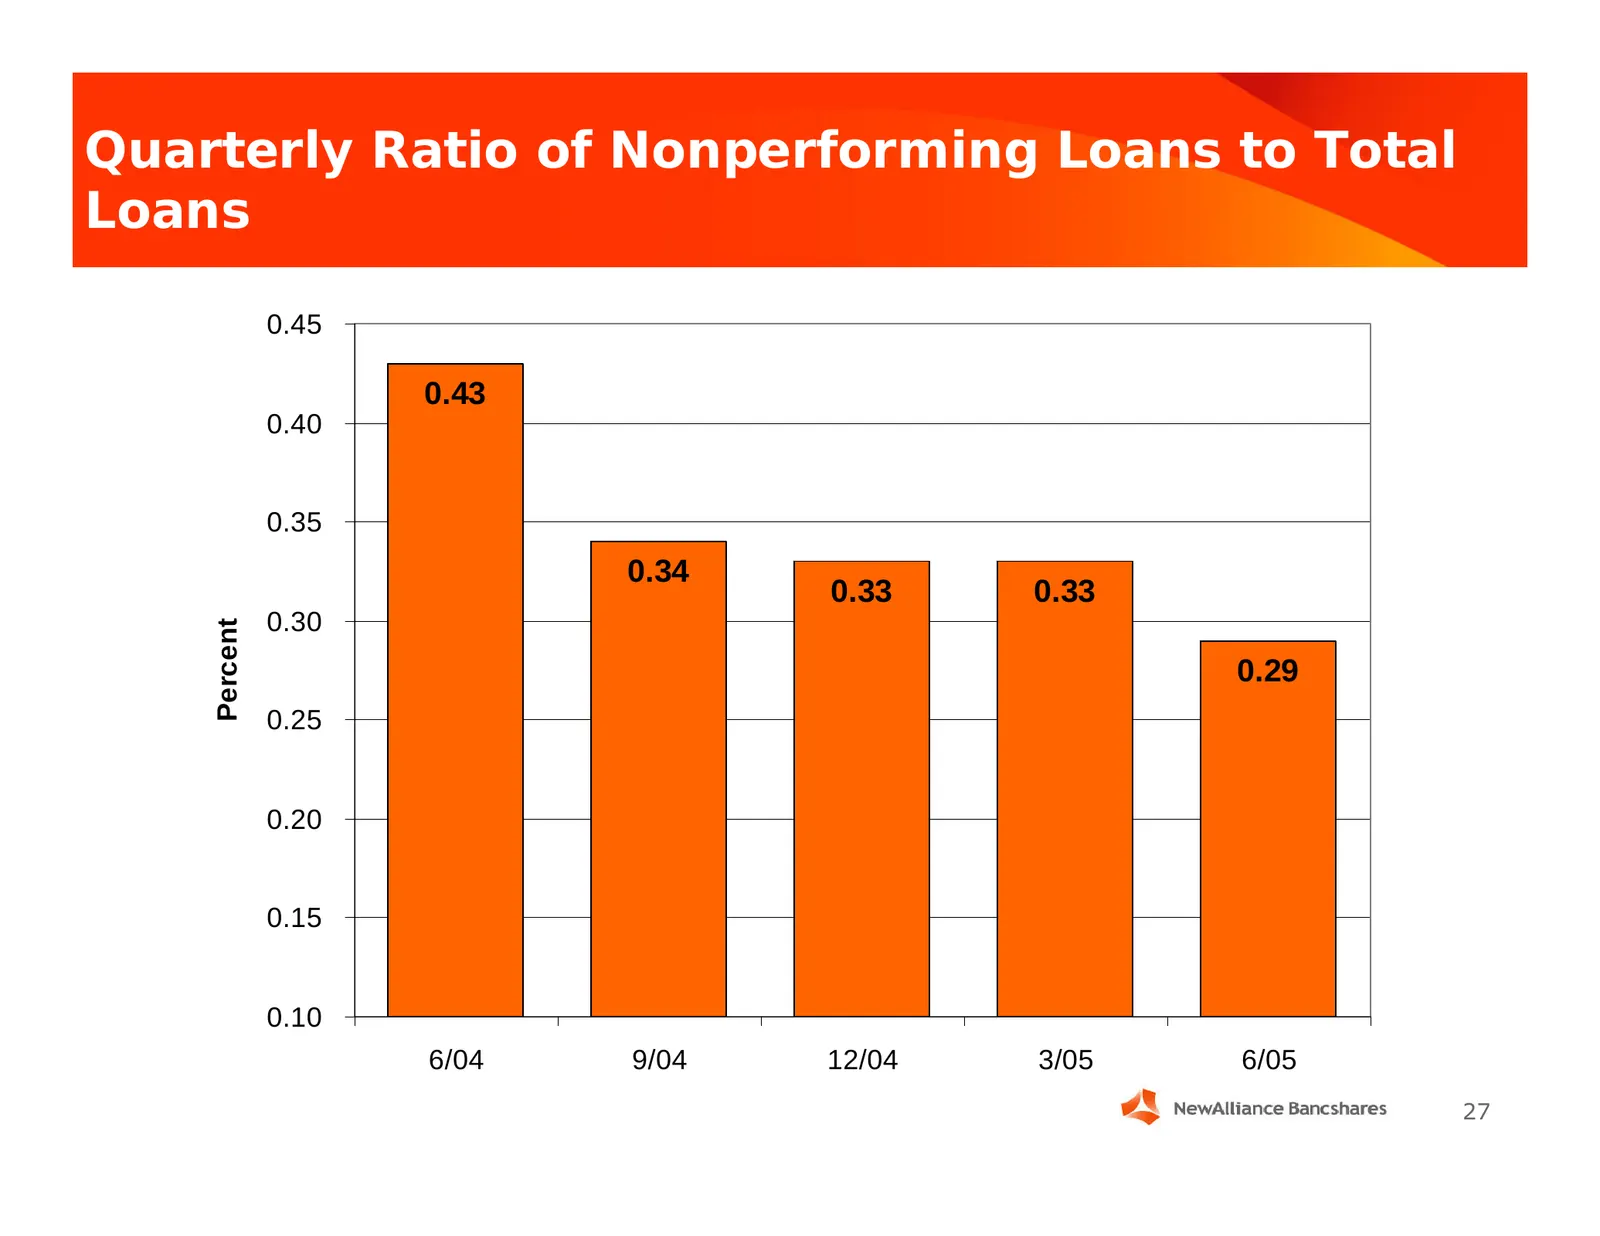
Slide 27: Quarterly Ratio of Nonperforming Loans to Total Loans
Quarterly Ratio of Nonperforming Loans to Total Loans 0.45 0.43 0.40 0.35 0.34 0.33 0.33 0.30 Percent 0.29 0.25 0.20 0.15 0.10 6/04 9/04 12/04 3/05 6/05 27
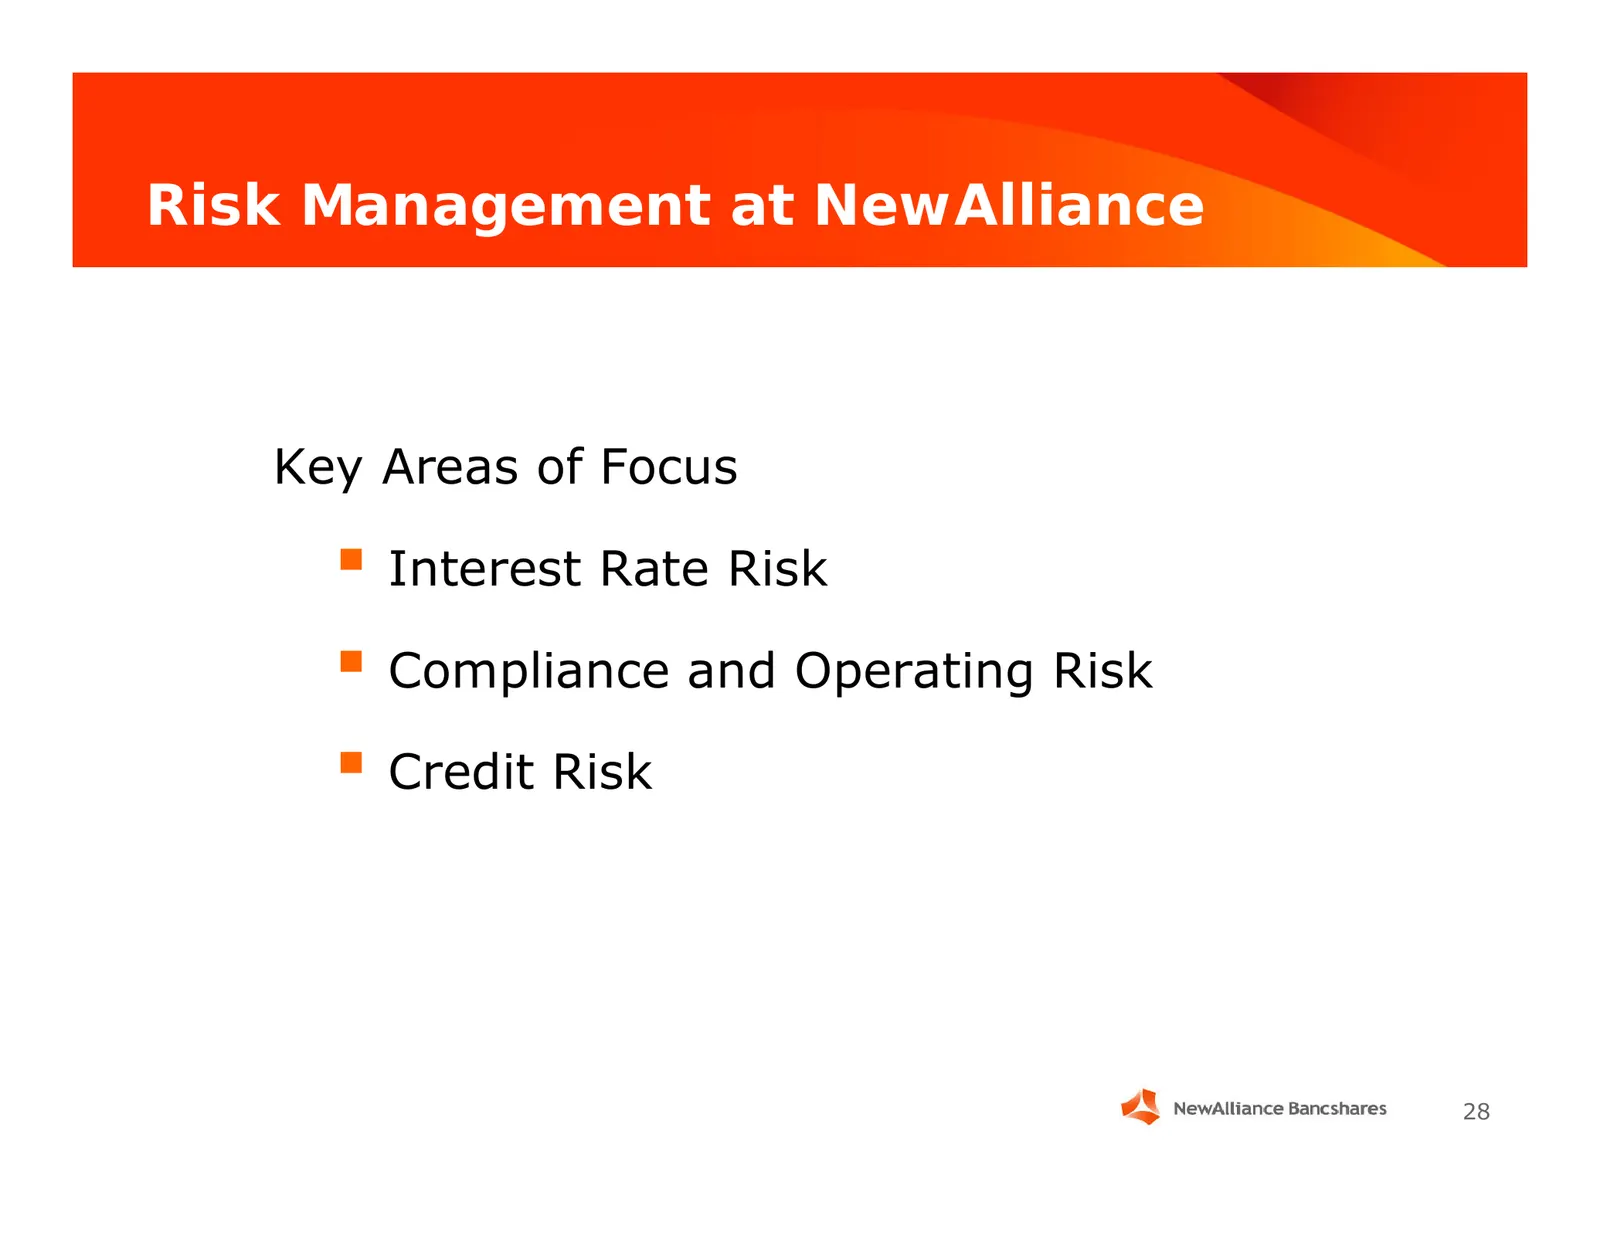
Slide 28: Risk Management at NewAlliance
Risk Management at NewAlliance Key Areas of Focus Interest Rate Risk Compliance and Operating Risk Credit Risk 28
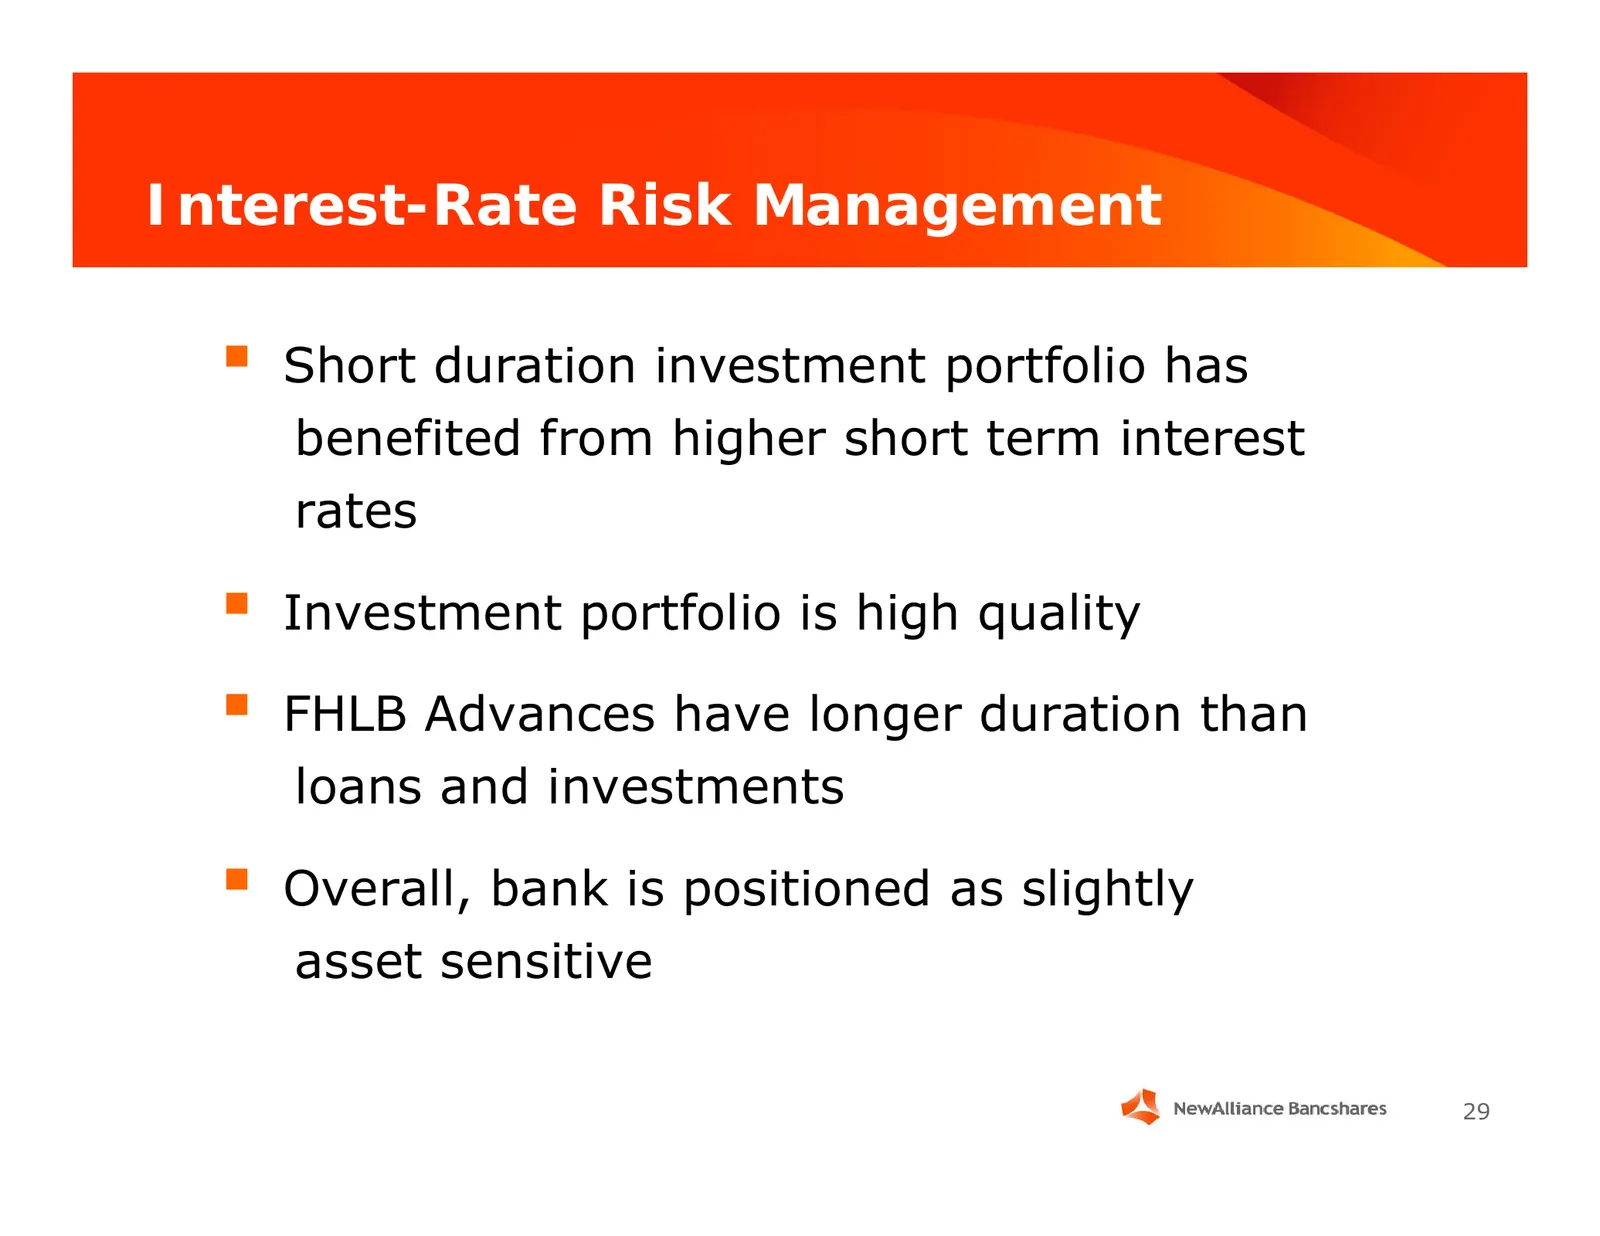
Slide 29: Interest-Rate Risk Management
Interest-Rate Risk Management Short duration investment portfolio has benefited from higher short term interest rates Investment portfolio is high quality FHLB Advances have longer duration than loans and investments Overall, bank is positioned as slightly asset sensitive 29
Slide 30: Investment Portfolio Composition
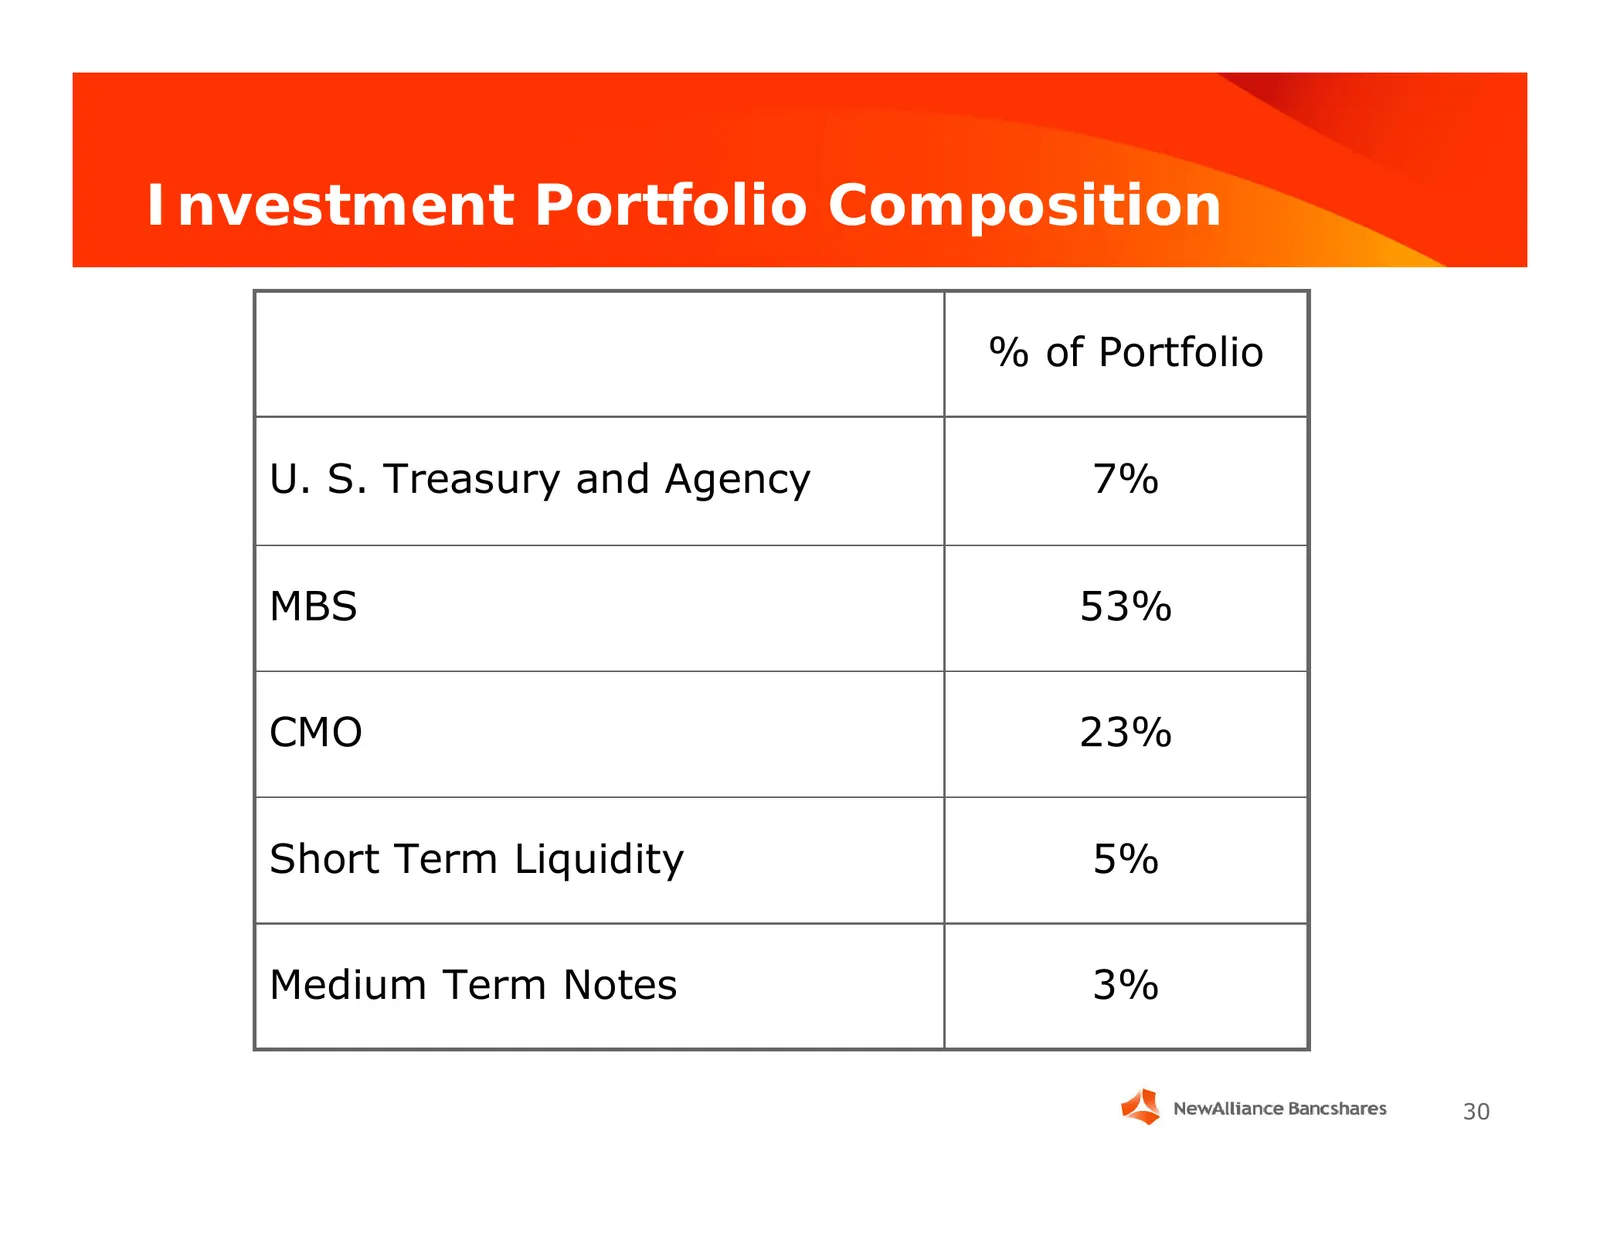
Investment Portfolio Composition % of Portfolio U. S. Treasury and Agency 7% MBS 53% CMO 23% Short Term Liquidity 5% Medium Term Notes 3% 30
Slide 31: Fixed Income Portfolio Composition
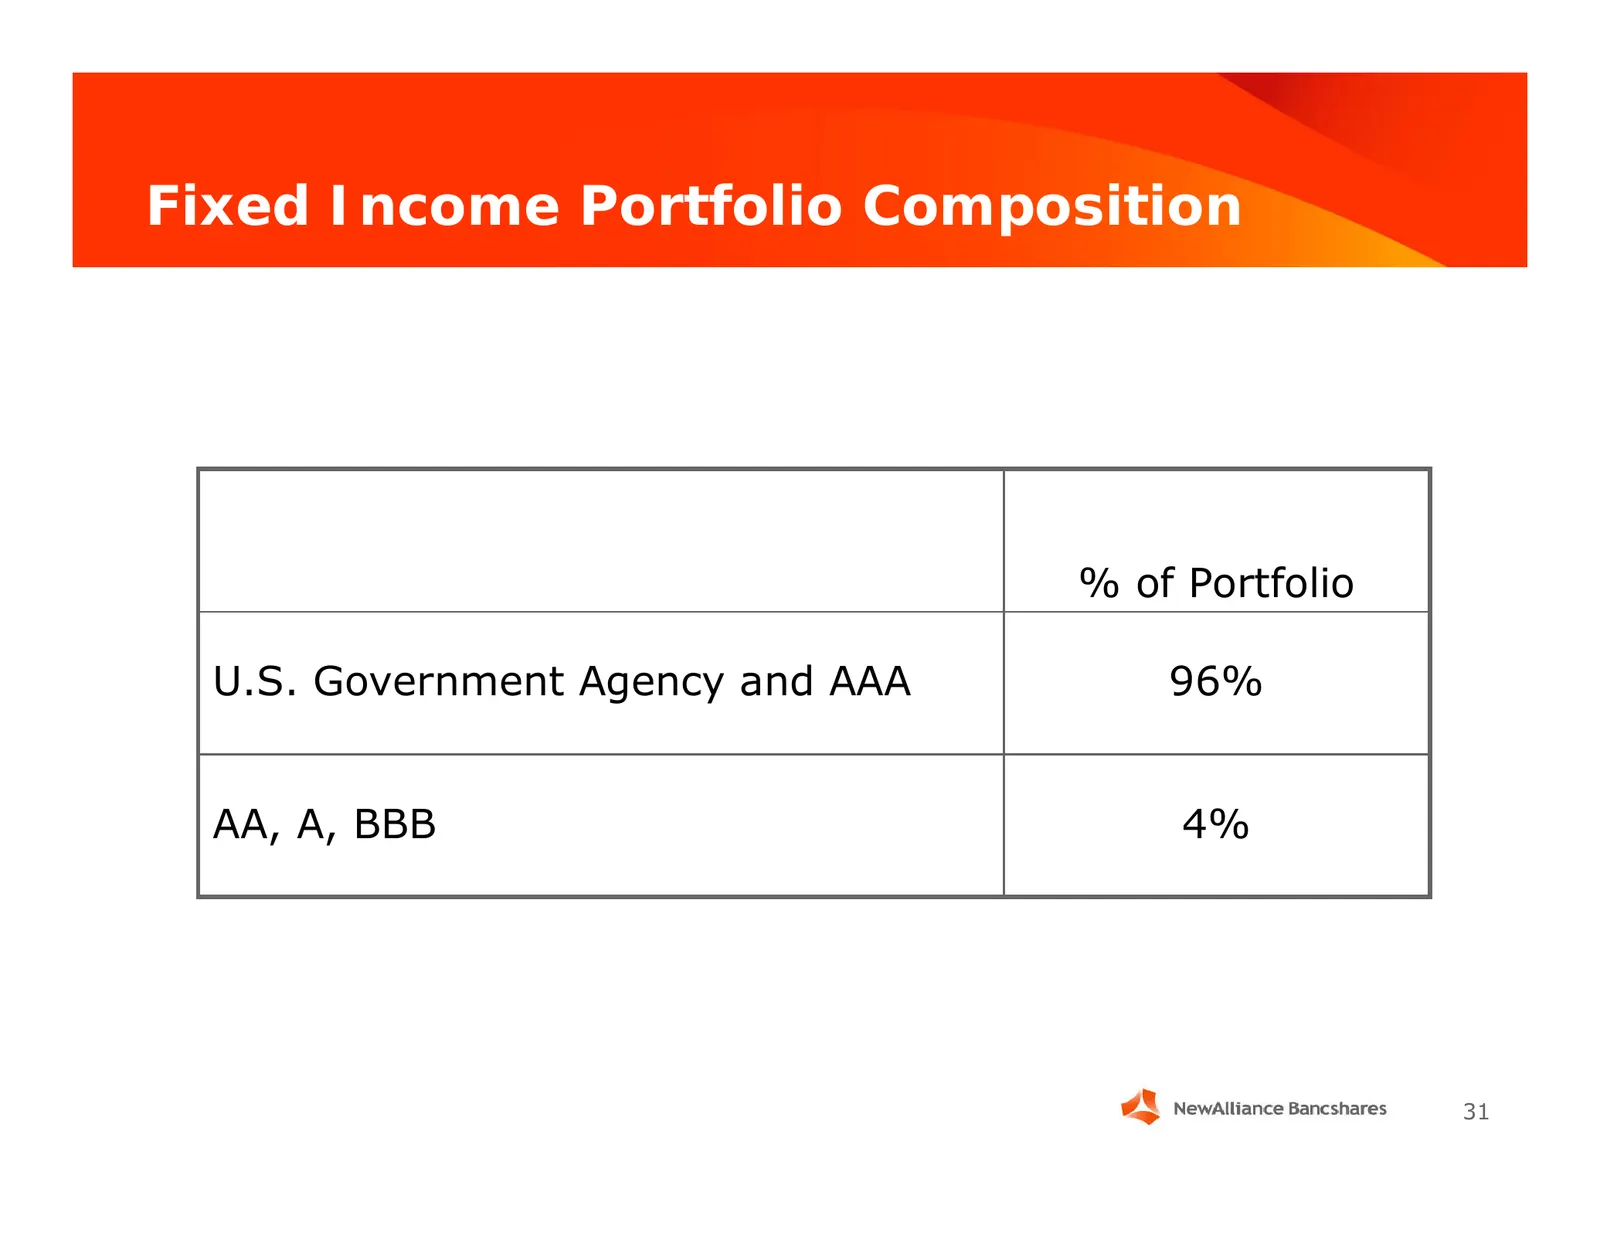
Fixed Income Portfolio Composition % of Portfolio U.S. Government Agency and AAA 96% AA, A, BBB 4% 31
Slide 32: Fixed Income Portfolio
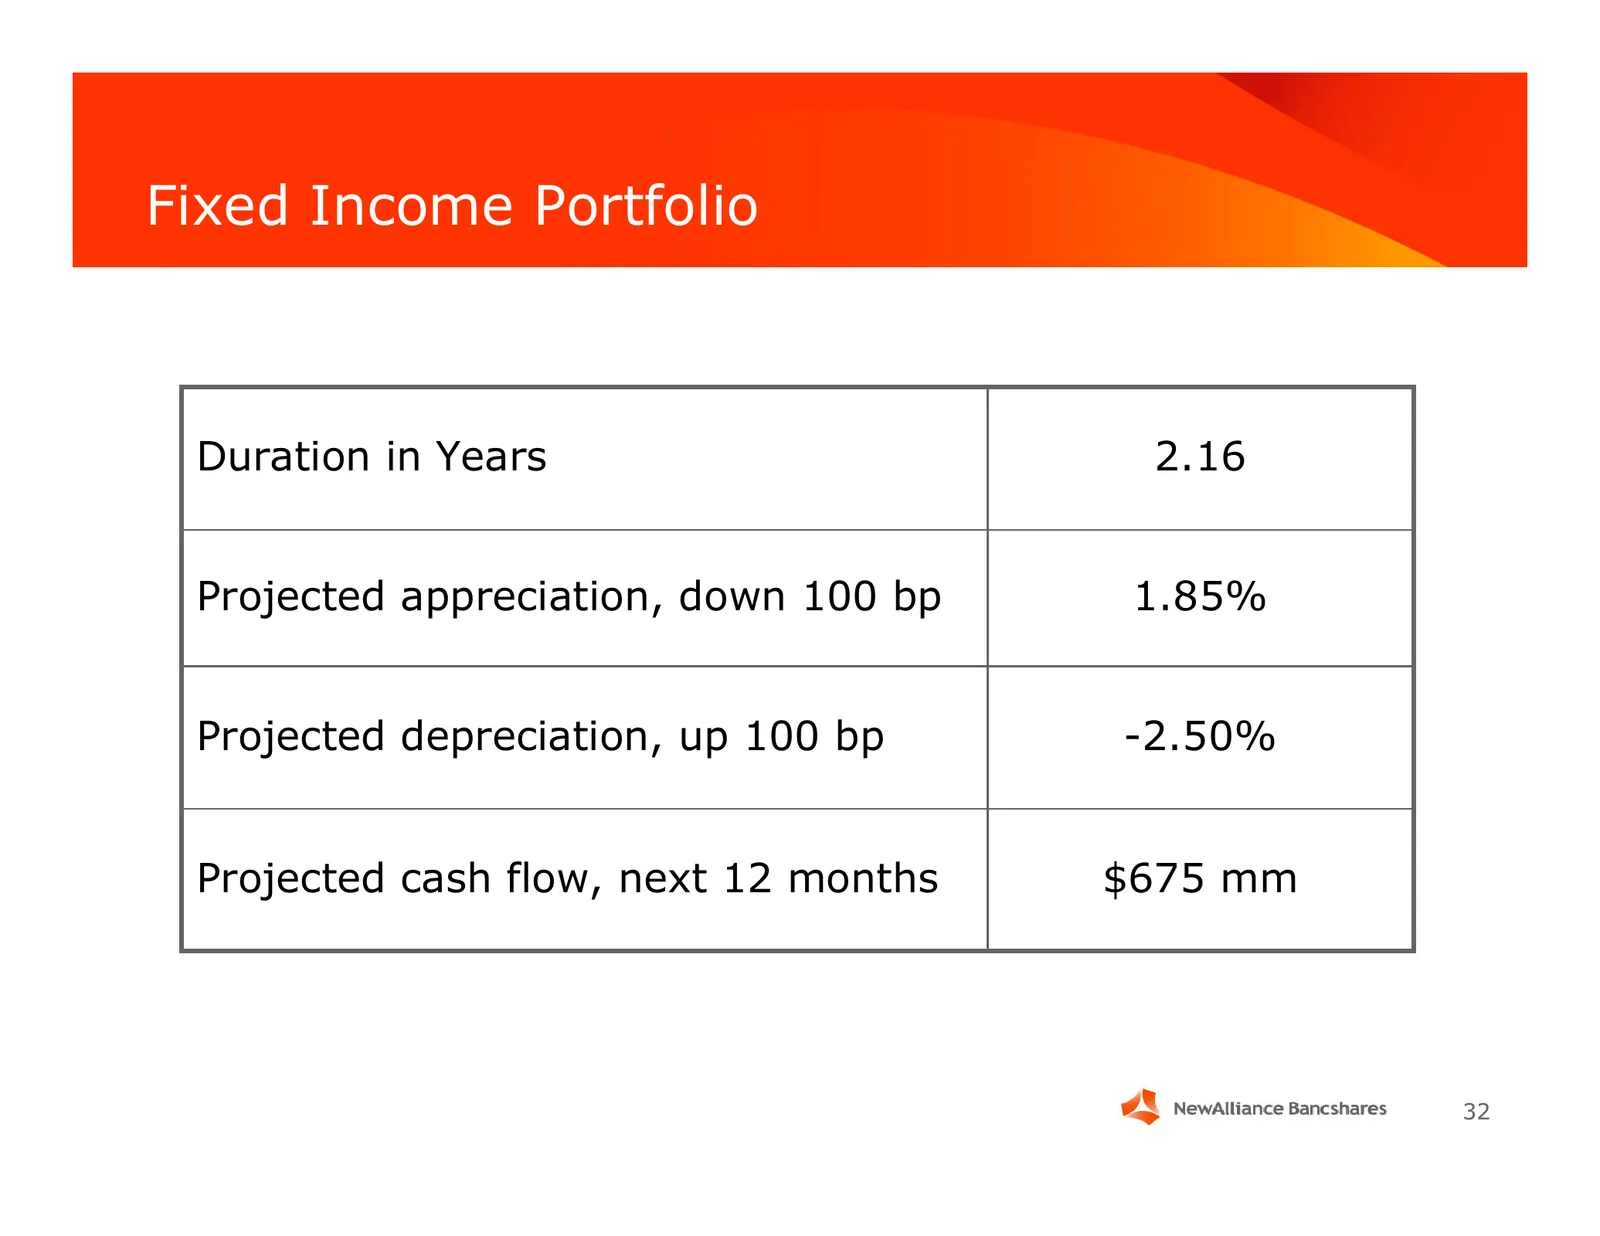
Fixed Income Portfolio Duration in Years 2.16 Projected appreciation, down 100 bp 1.85% Projected depreciation, up 100 bp -2.50% Projected cash flow, next 12 months $675 mm 32
Slide 33: Interest Rate Sensitivity
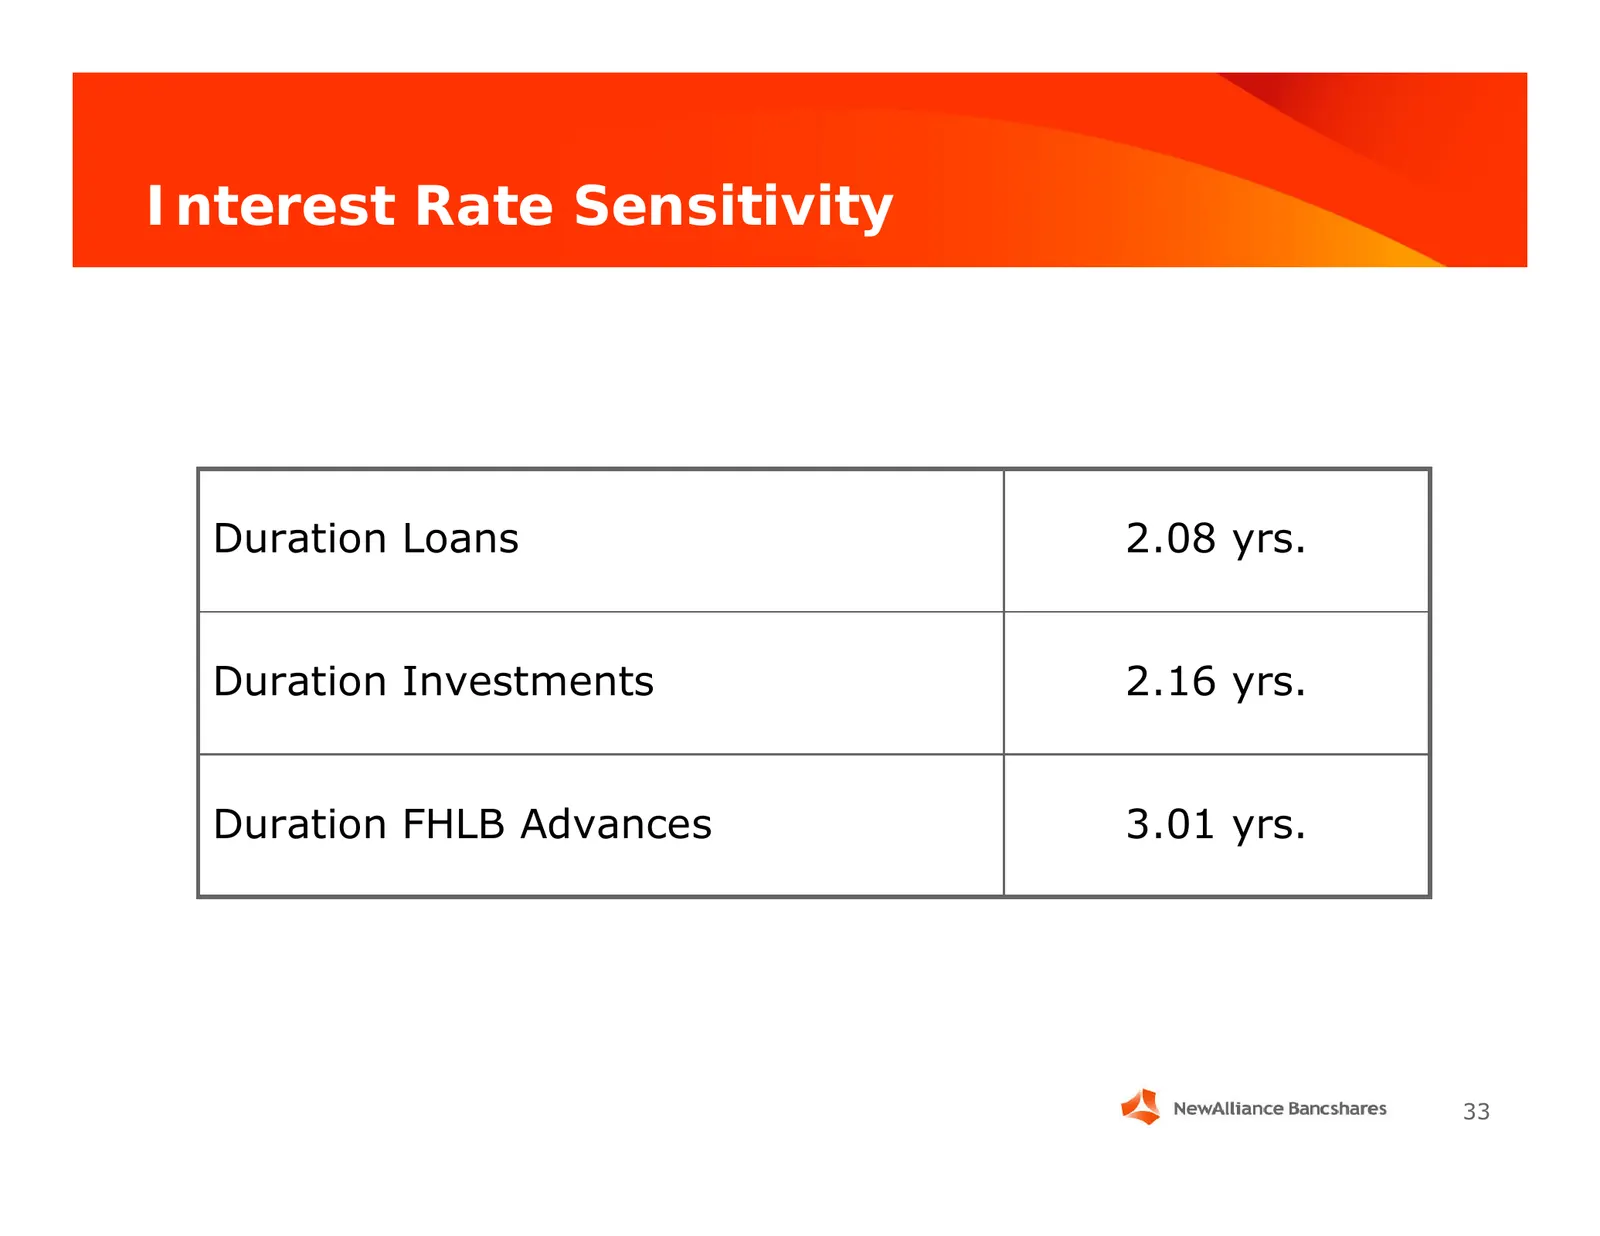
Interest Rate Sensitivity Duration Loans 2.08 yrs. Duration Investments 2.16 yrs. Duration FHLB Advances 3.01 yrs. 33
Slide 34: Interest Rate Sensitivity
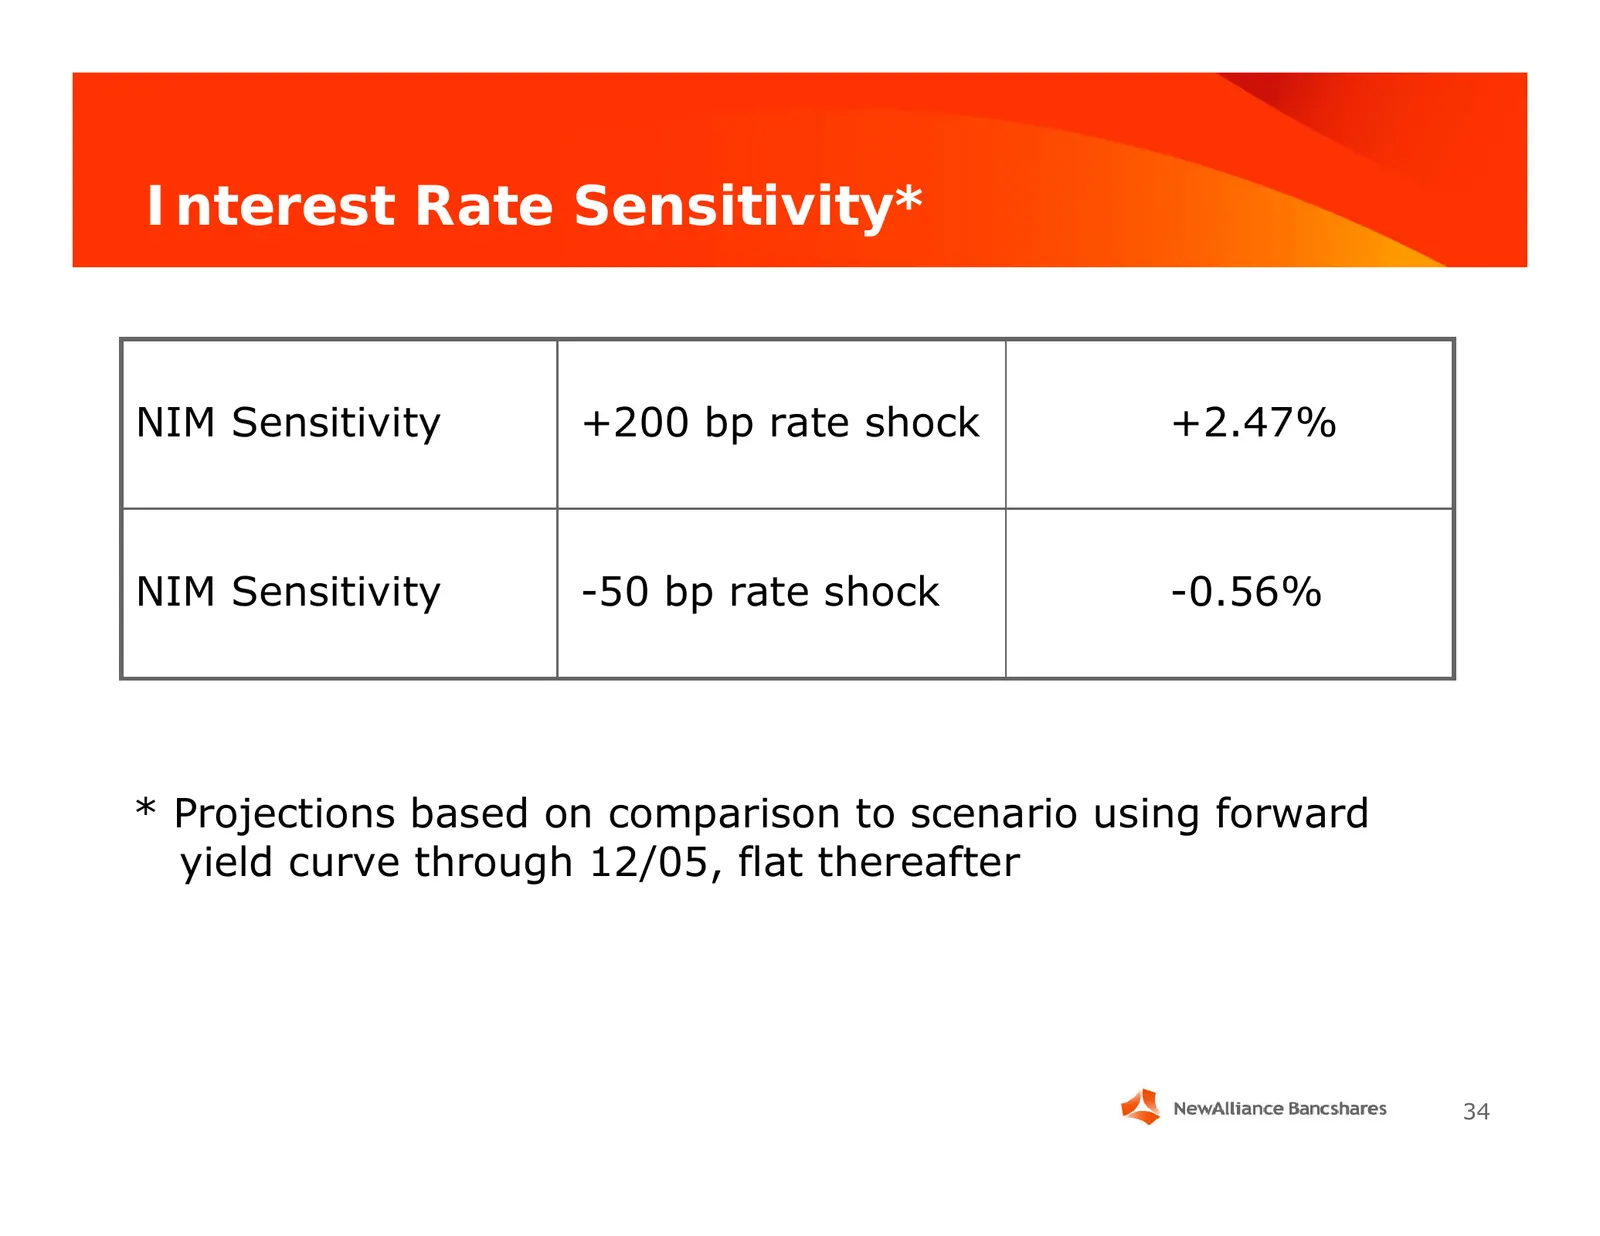
Interest Rate Sensitivity* NIM Sensitivity +200 bp rate shock +2.47% NIM Sensitivity -50 bp rate shock -0.56% * Projections based on comparison to scenario using forward yield curve through 12/05, flat thereafter 34
Slide 35: Yield Curves
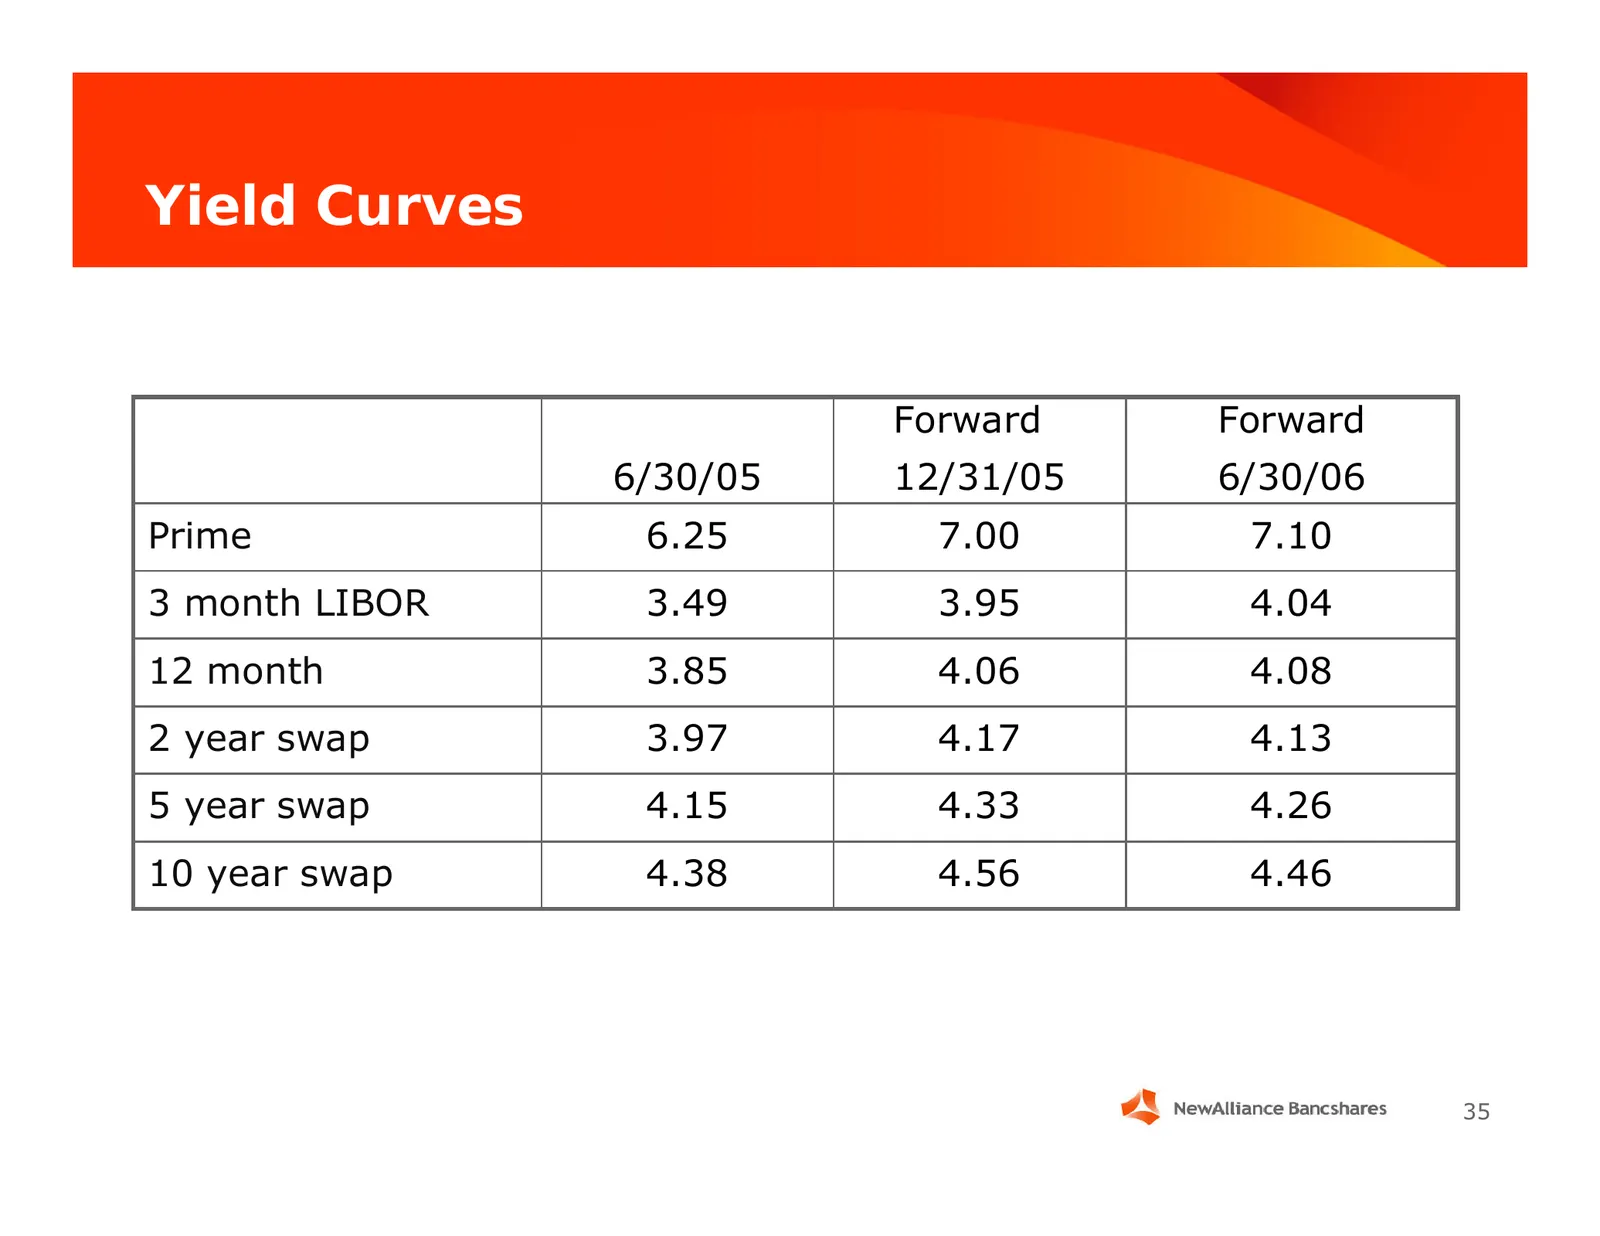
Yield Curves Forward Forward 6/30/05 12/31/05 6/30/06 Prime 6.25 7.00 7.10 3 month LIBOR 3.49 3.95 4.04 12 month 3.85 4.06 4.08 2 year swap 3.97 4.17 4.13 5 year swap 4.15 4.33 4.26 10 year swap 4.38 4.56 4.46 35
Slide 36: Risk Management Focus
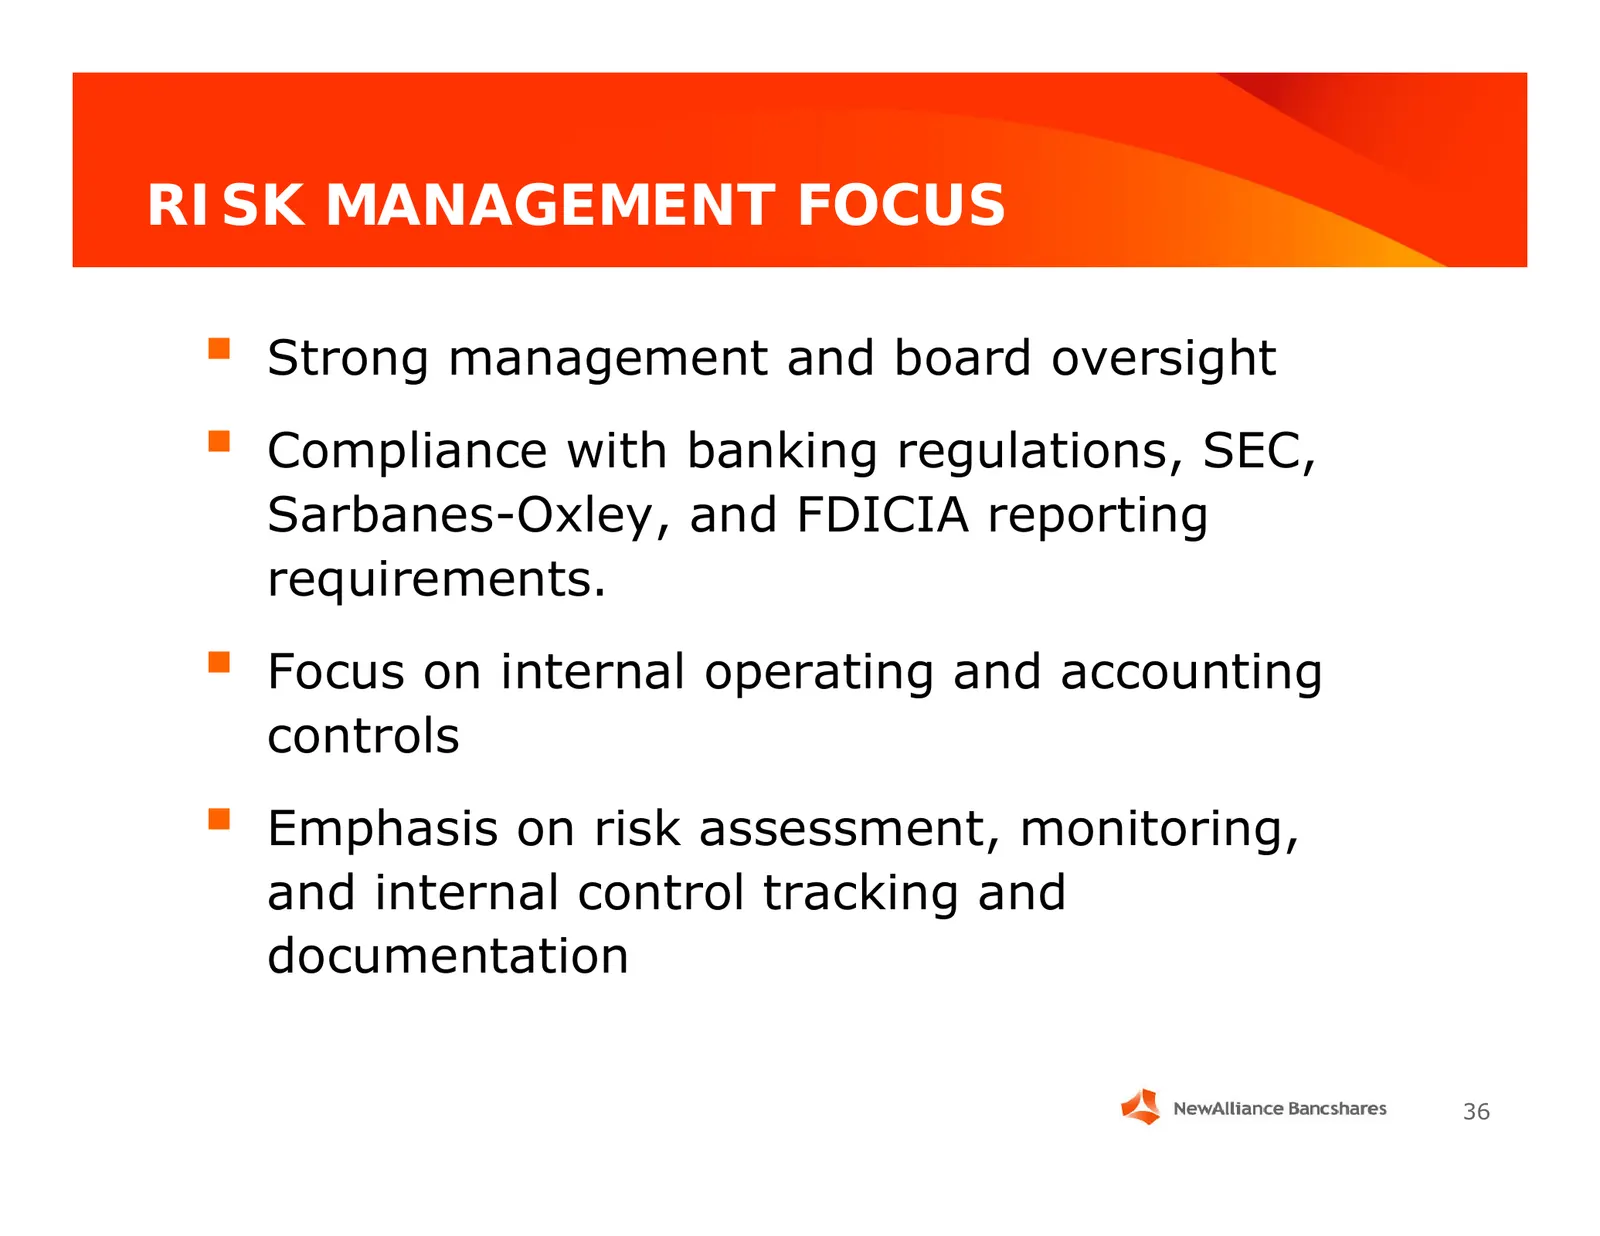
RISK MANAGEMENT FOCUS Strong management and board oversight Compliance with banking regulations, SEC, Sarbanes-Oxley, and FDICIA reporting requirements. Focus on internal operating and accounting controls Emphasis on risk assessment, monitoring, and internal control tracking and documentatio

Slide 37: Credit Risk Management
Credit Risk Management Don T. Chaffee Chief Credit Officer 37
Slide 38: Credit Risk Management Is Critical at This Point in the Cycle
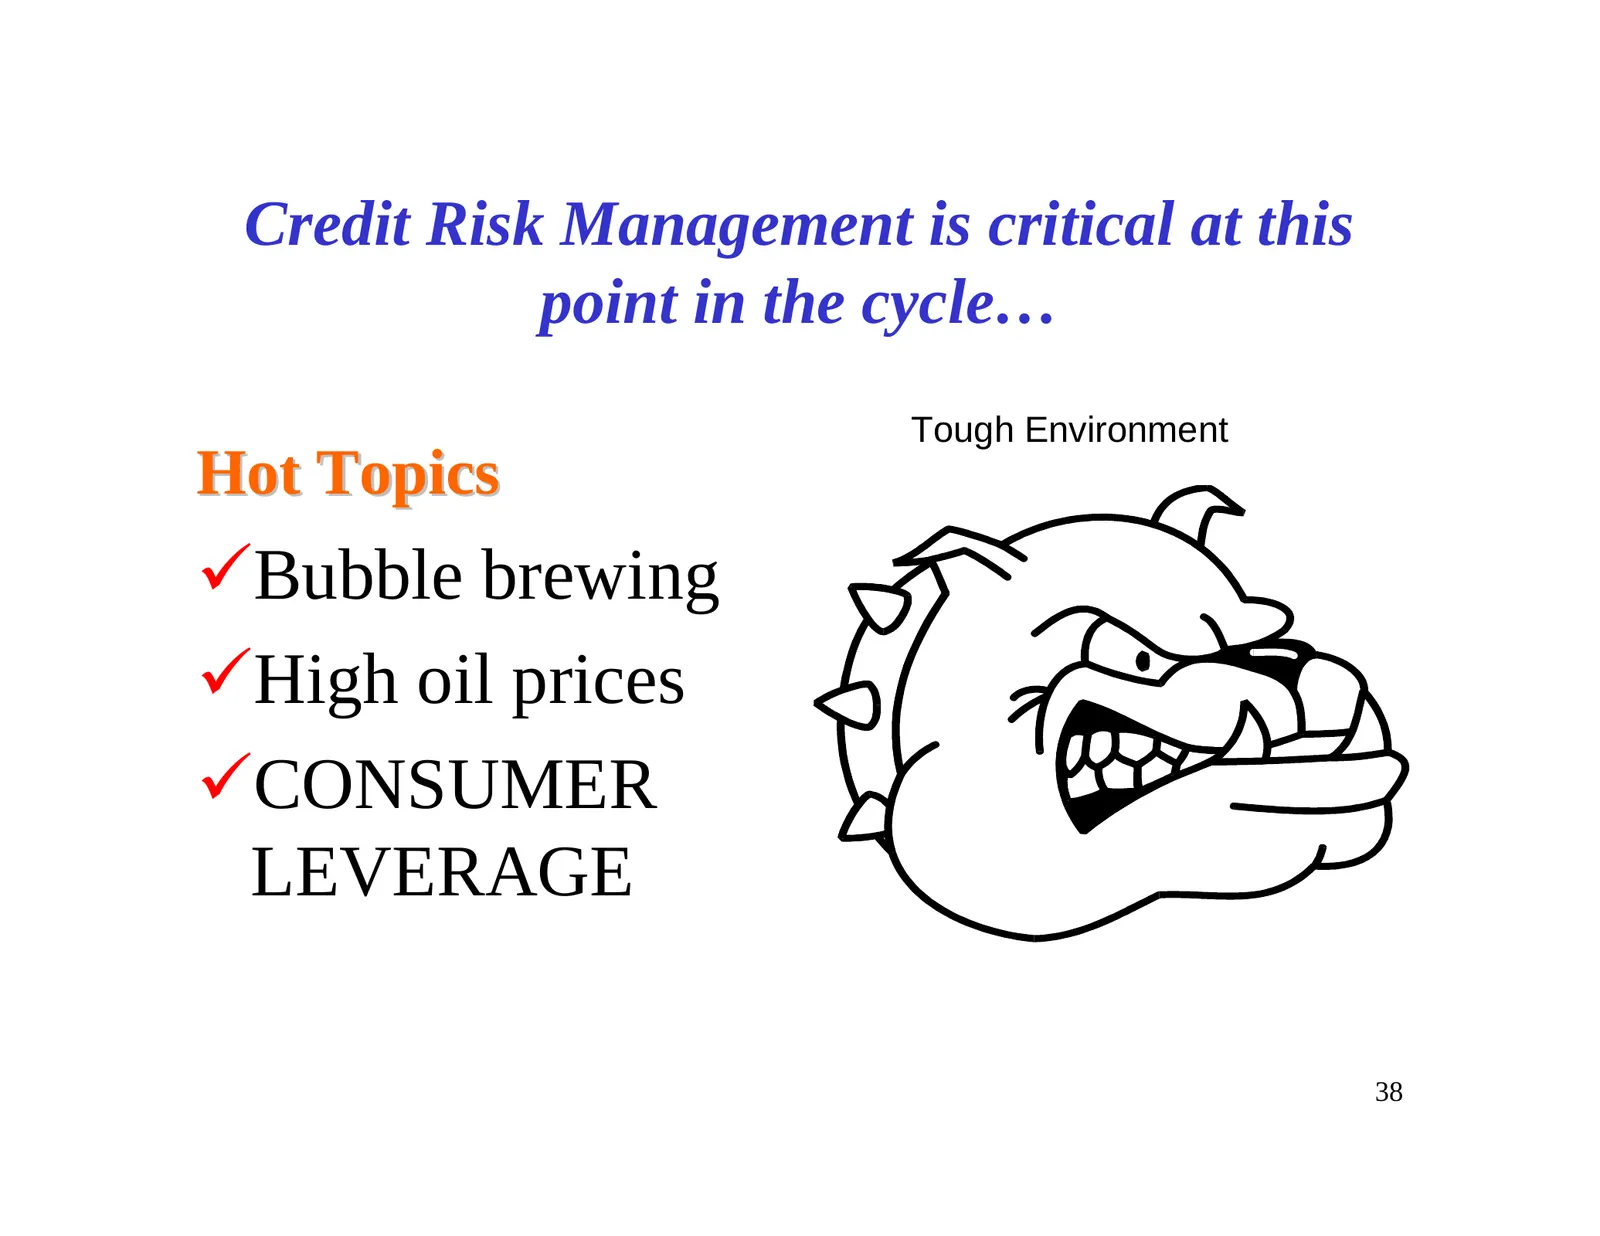
Credit Risk Management is critical at this point in the cycle… Tough Environment Hot Topics 9Bubble brewing 9High oil prices 9CONSUMER LEVERAGE 38

Slide 39: Need a Balanced View
N e e d a B a la n c e d V ie w • In te re s t ra te s a re lo w • T h e e c o n o m y is g ro w in g • U n e m p lo y m e n t is d o w n a n d jo b s a re g ro w in g . S o m e w o u ld s a y th is is a “ G o ld ilo c k s” e c o n o m y . 7 39 39
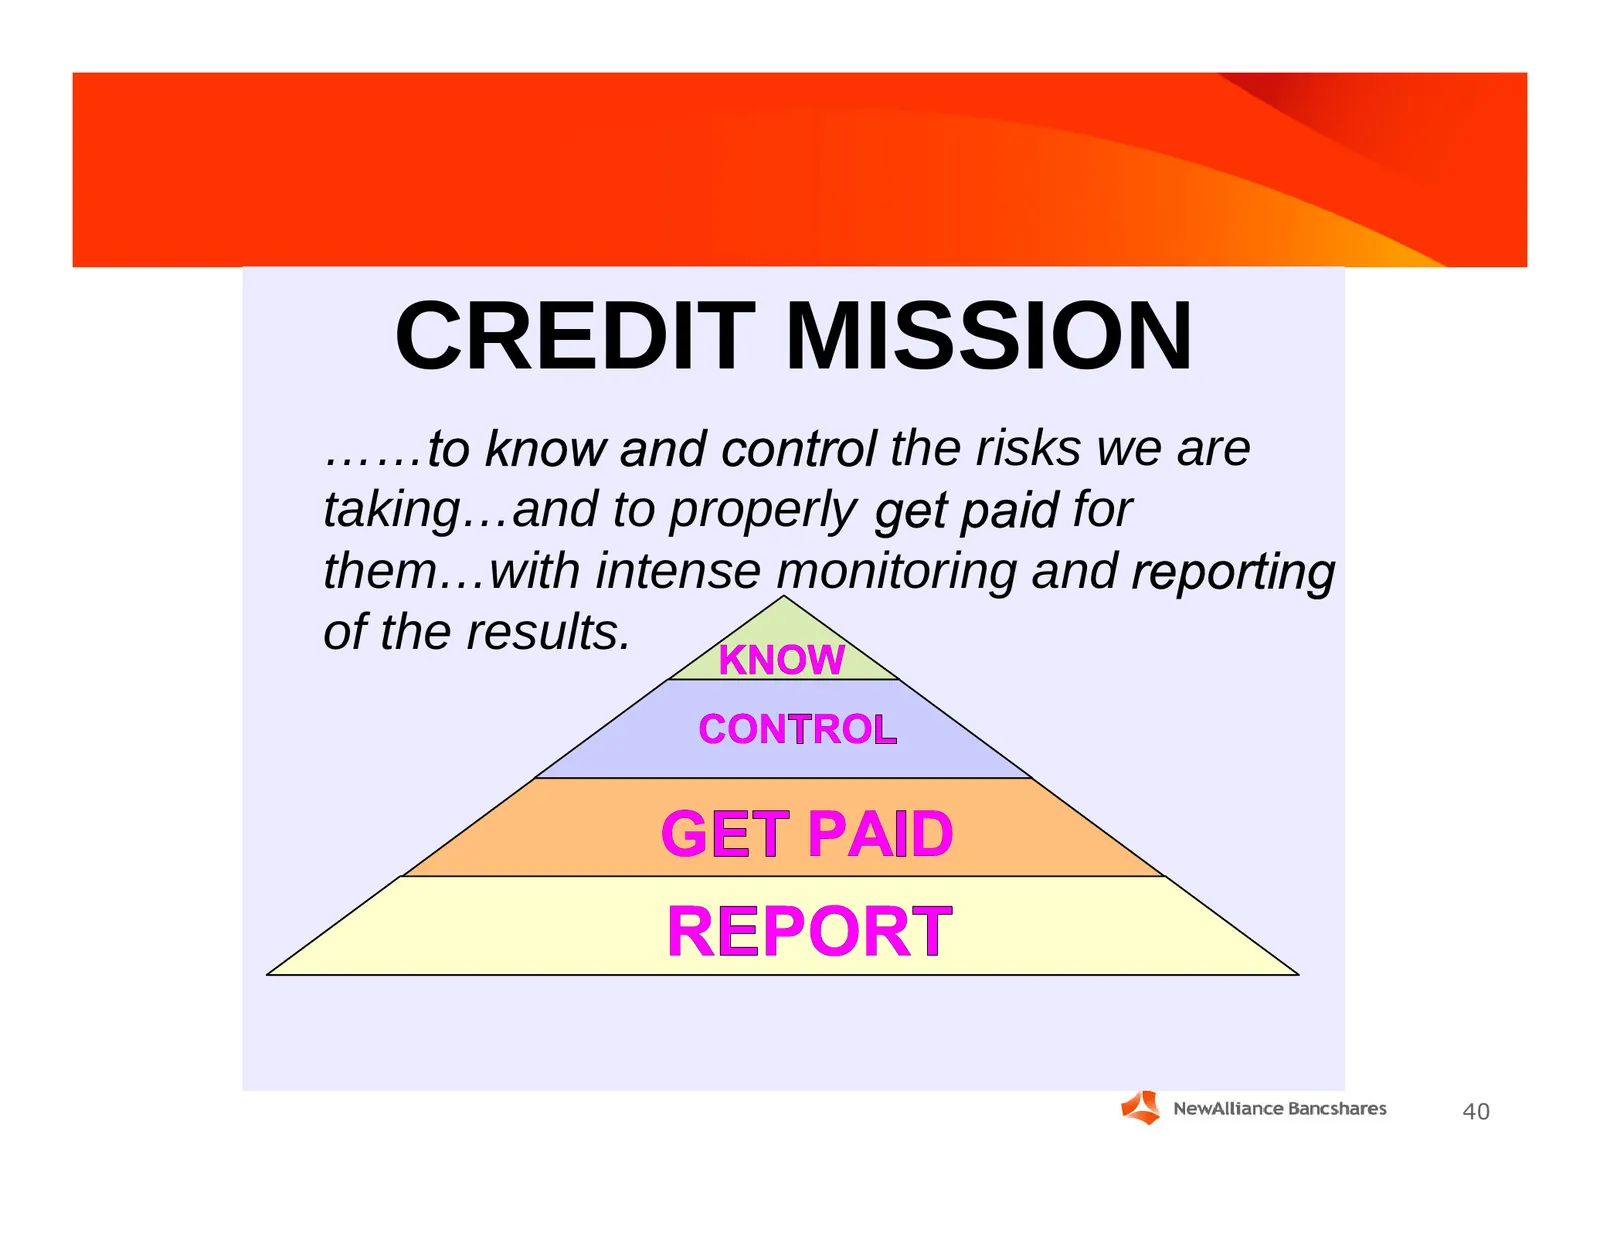
Slide 40: Credit Mission
CREDIT MISSION …… the risks we are taking…and to properly for them…with intense monitoring and of the results. 40
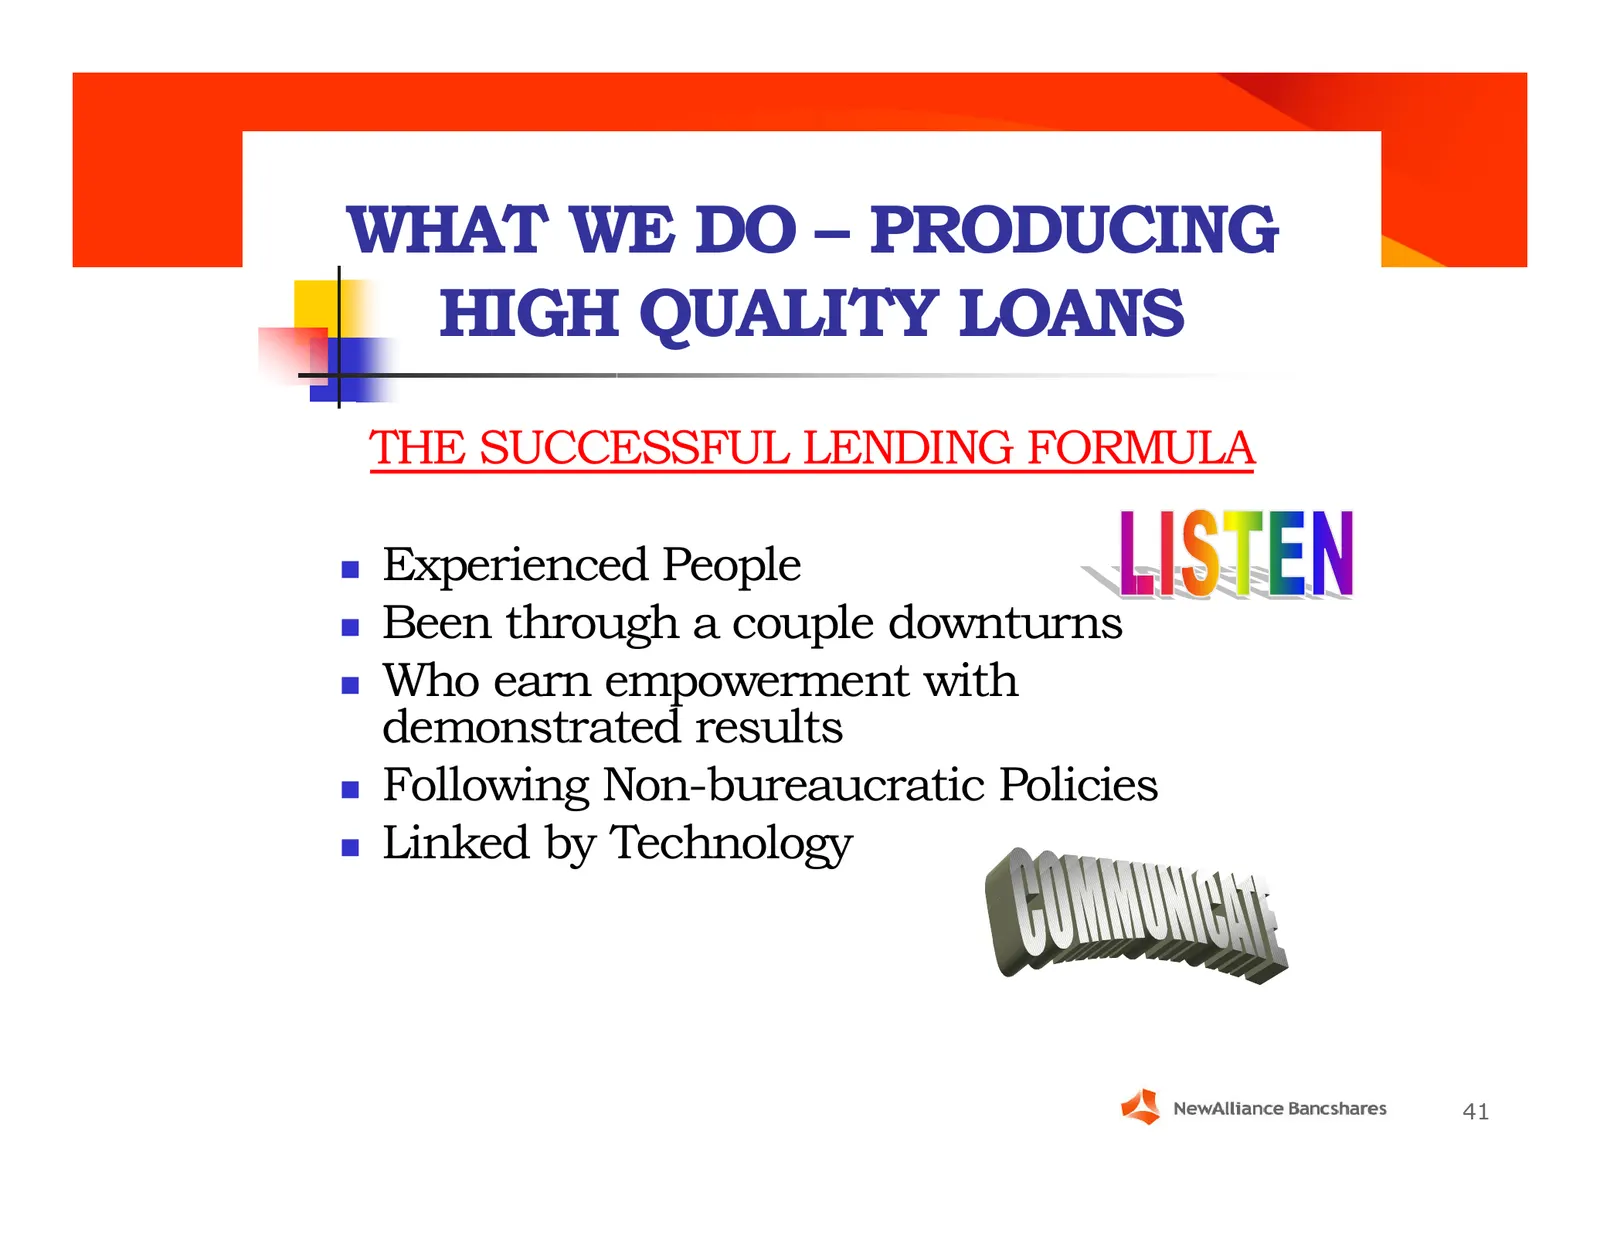
Slide 41: What We Do – Producing High Quality Loans
WHAT WE DO – PRODUCING HIGH QUALITY LOANS THE SUCCESSFUL LENDING FORMULA Experienced People Been through a couple downturns Who earn empowerment with demonstrated results Following Non-bureaucratic Policies Linked by Technology 41
Slide 42: The Philosophy
THE PHILOSOPHY Strong Capital Base Experienced People in Key Jobs Asset Quality key in Compensation Portfolio Diversification Limit Setting Intense MIS Monitoring Maintaining Adequate Reserves 42
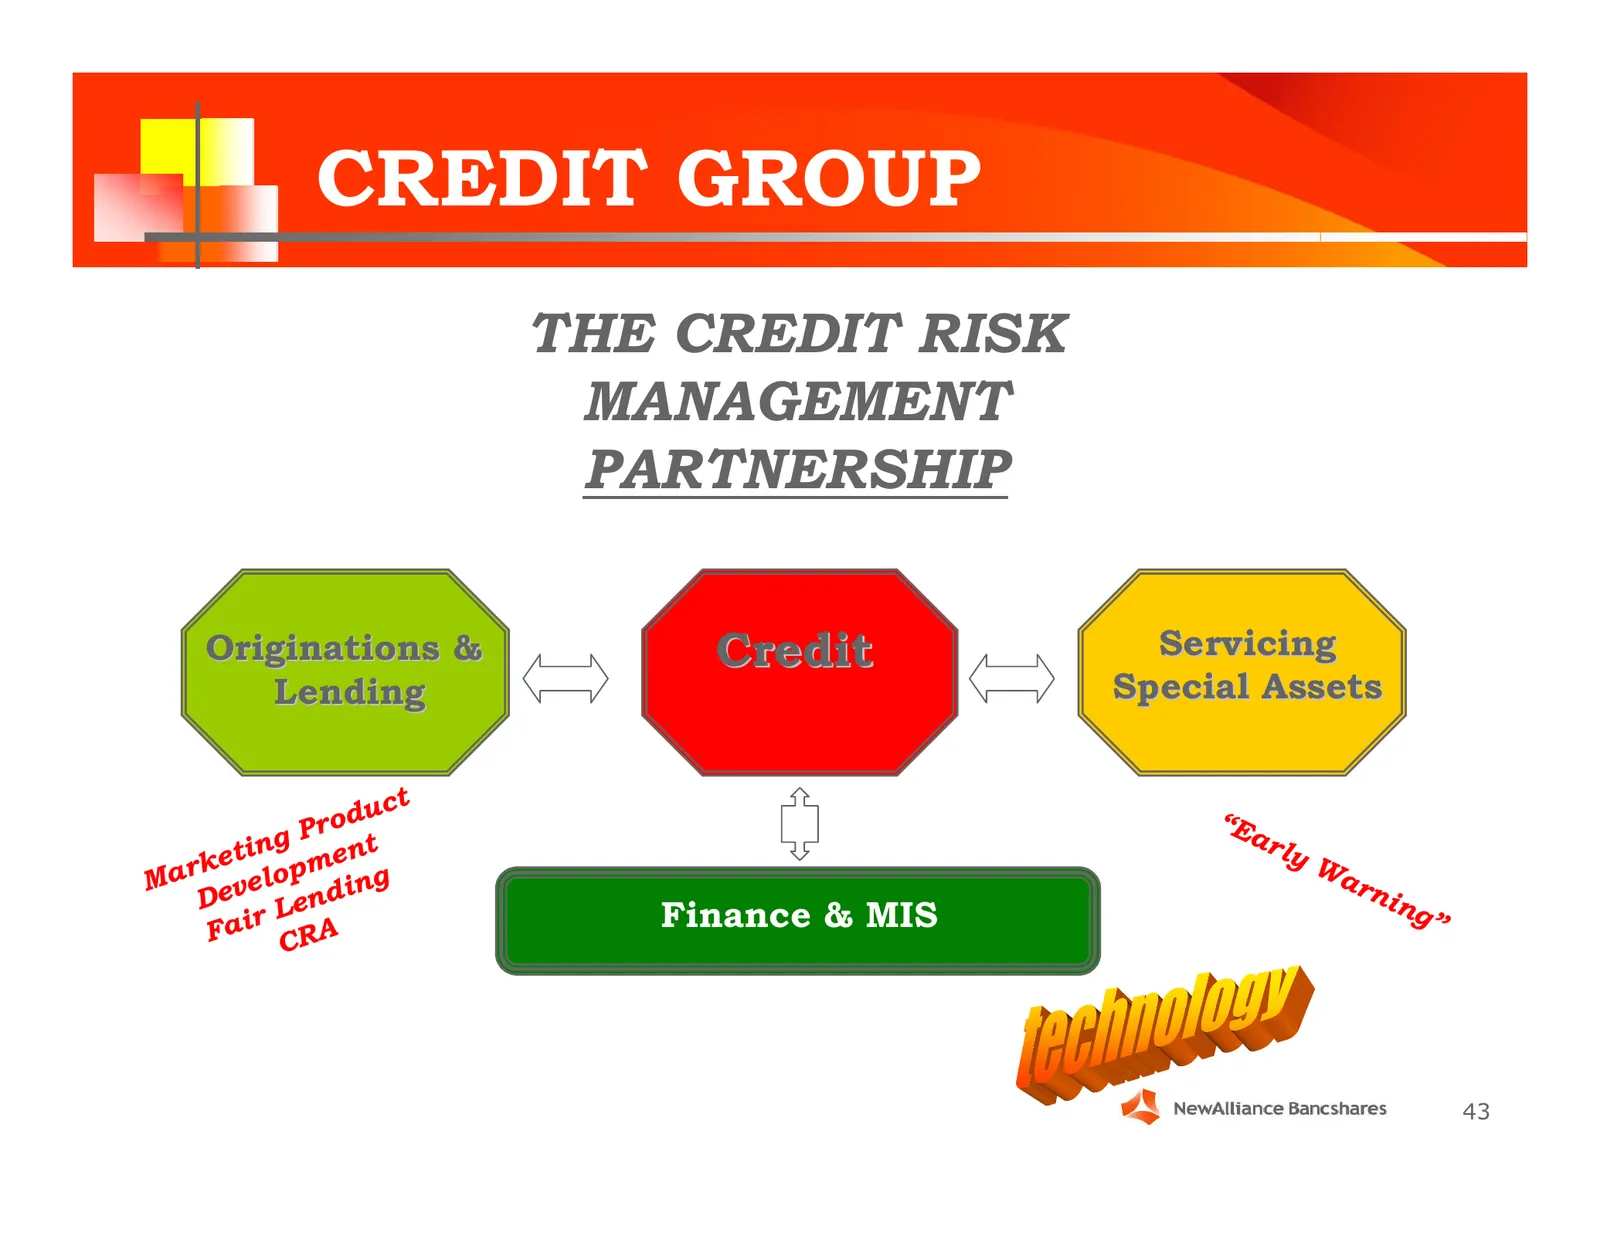
Slide 43: Credit Group
CREDIT GROUP THE CREDIT RISK MANAGEMENT PARTNERSHIP Originations & Credit Servicing Lending Special Assets t r o duc “E P ar e ting ent ly r k p m Wa Ma evelo ding rn D n i ng a i r Le A Finance & MIS ” F CR 43
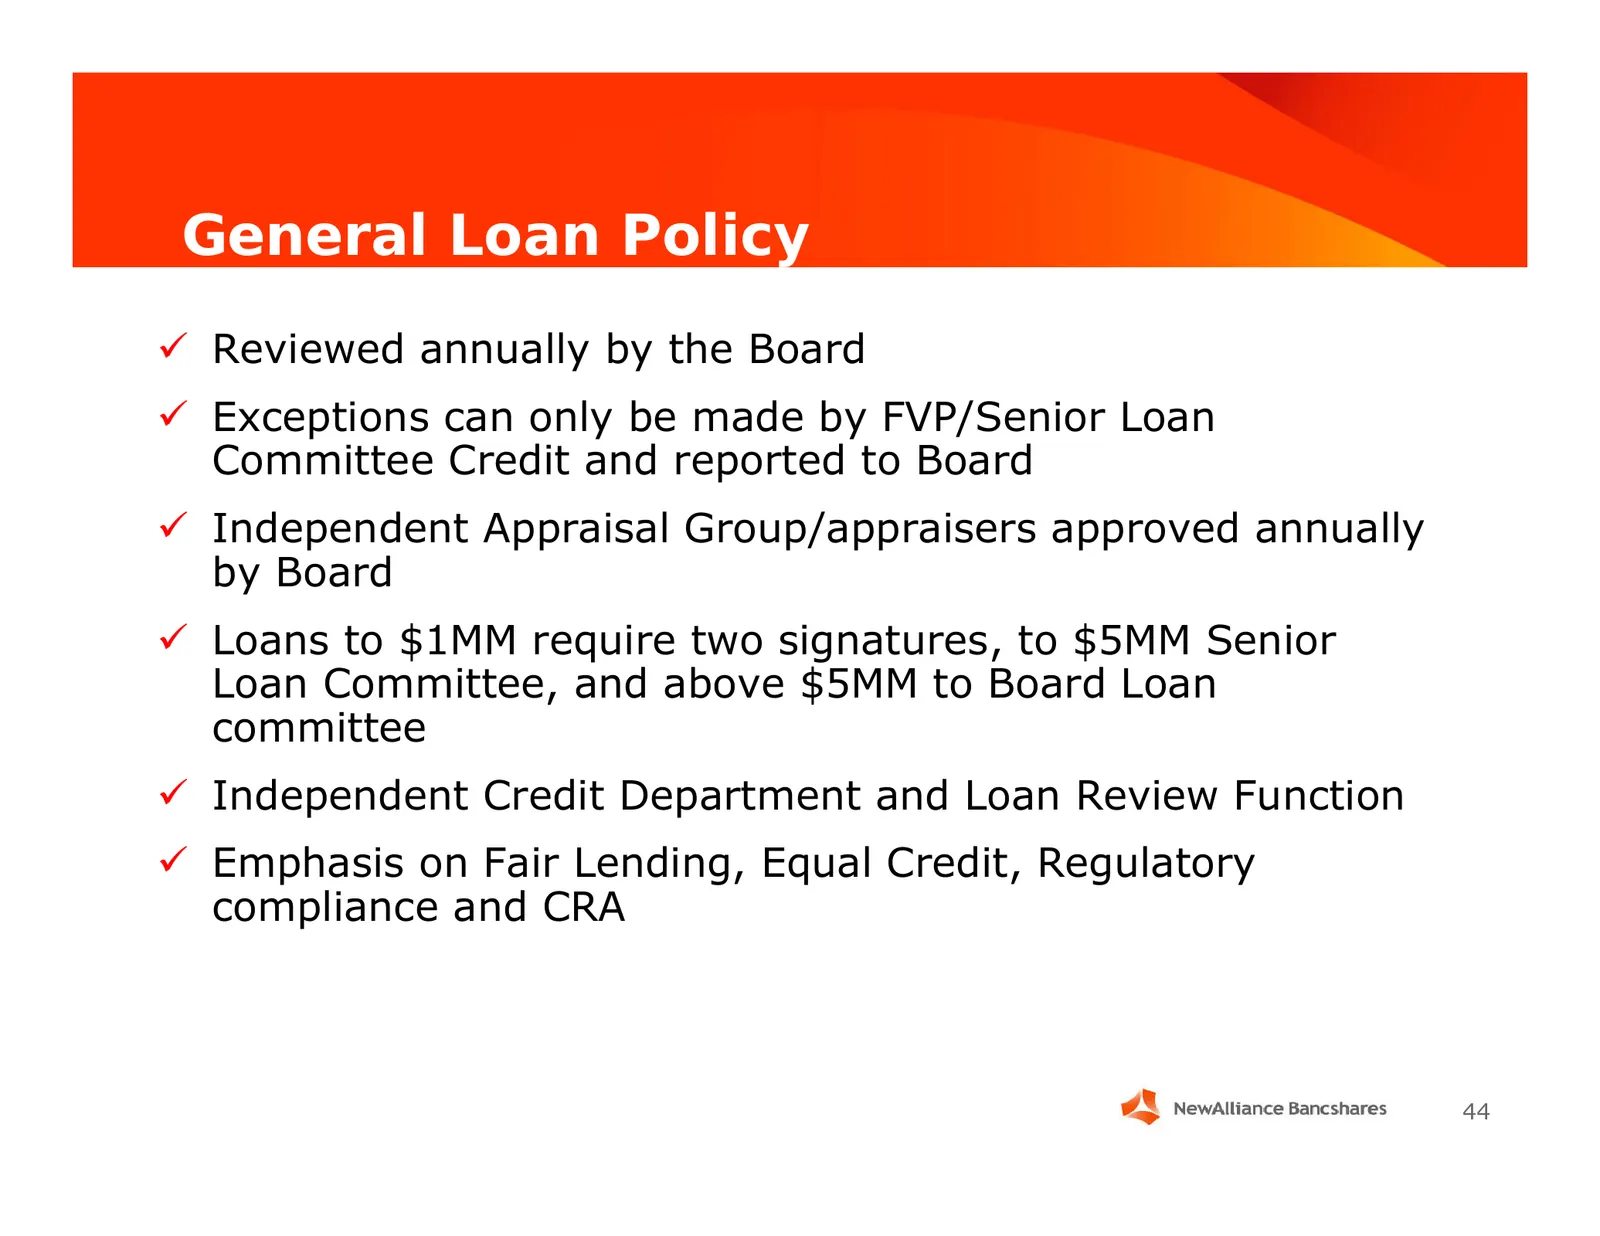
Slide 44: General Loan Policy
General Loan Policy 9 Reviewed annually by the Board 9 Exceptions can only be made by FVP/Senior Loan Committee Credit and reported to Board 9 Independent Appraisal Group/appraisers approved annually by Board 9 Loans to $1MM require two signatures, to $5MM Senior Loan Committee, and above $5MM to Bo
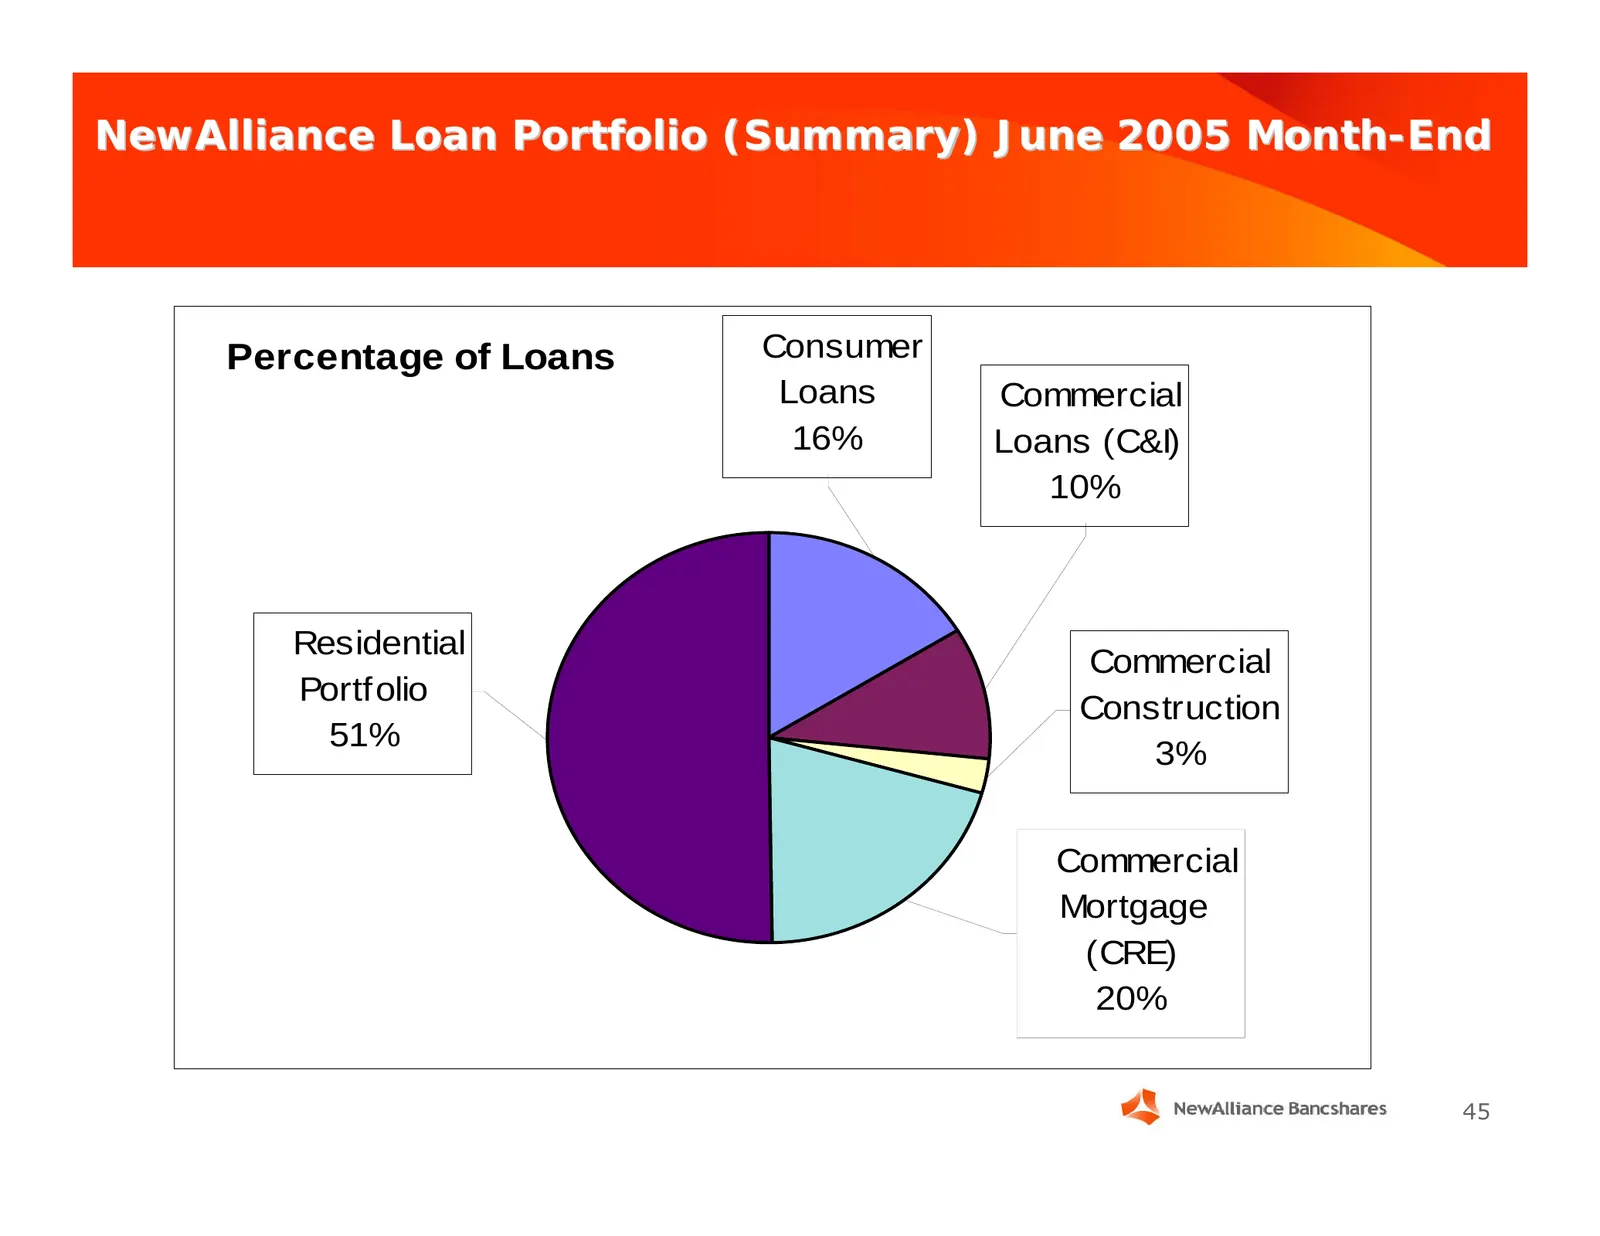
Slide 45: NewAlliance Loan Portfolio (Summary) June 2005
NewAlliance Loan Portfolio (Summary) June 2005 Month-End Percentage of Loans Consumer Loans Commercial 16% Loans (C&I) 10% Residential Commercial Portfolio Construction 51% 3% Commercial Mortgage (CRE) 20% 45
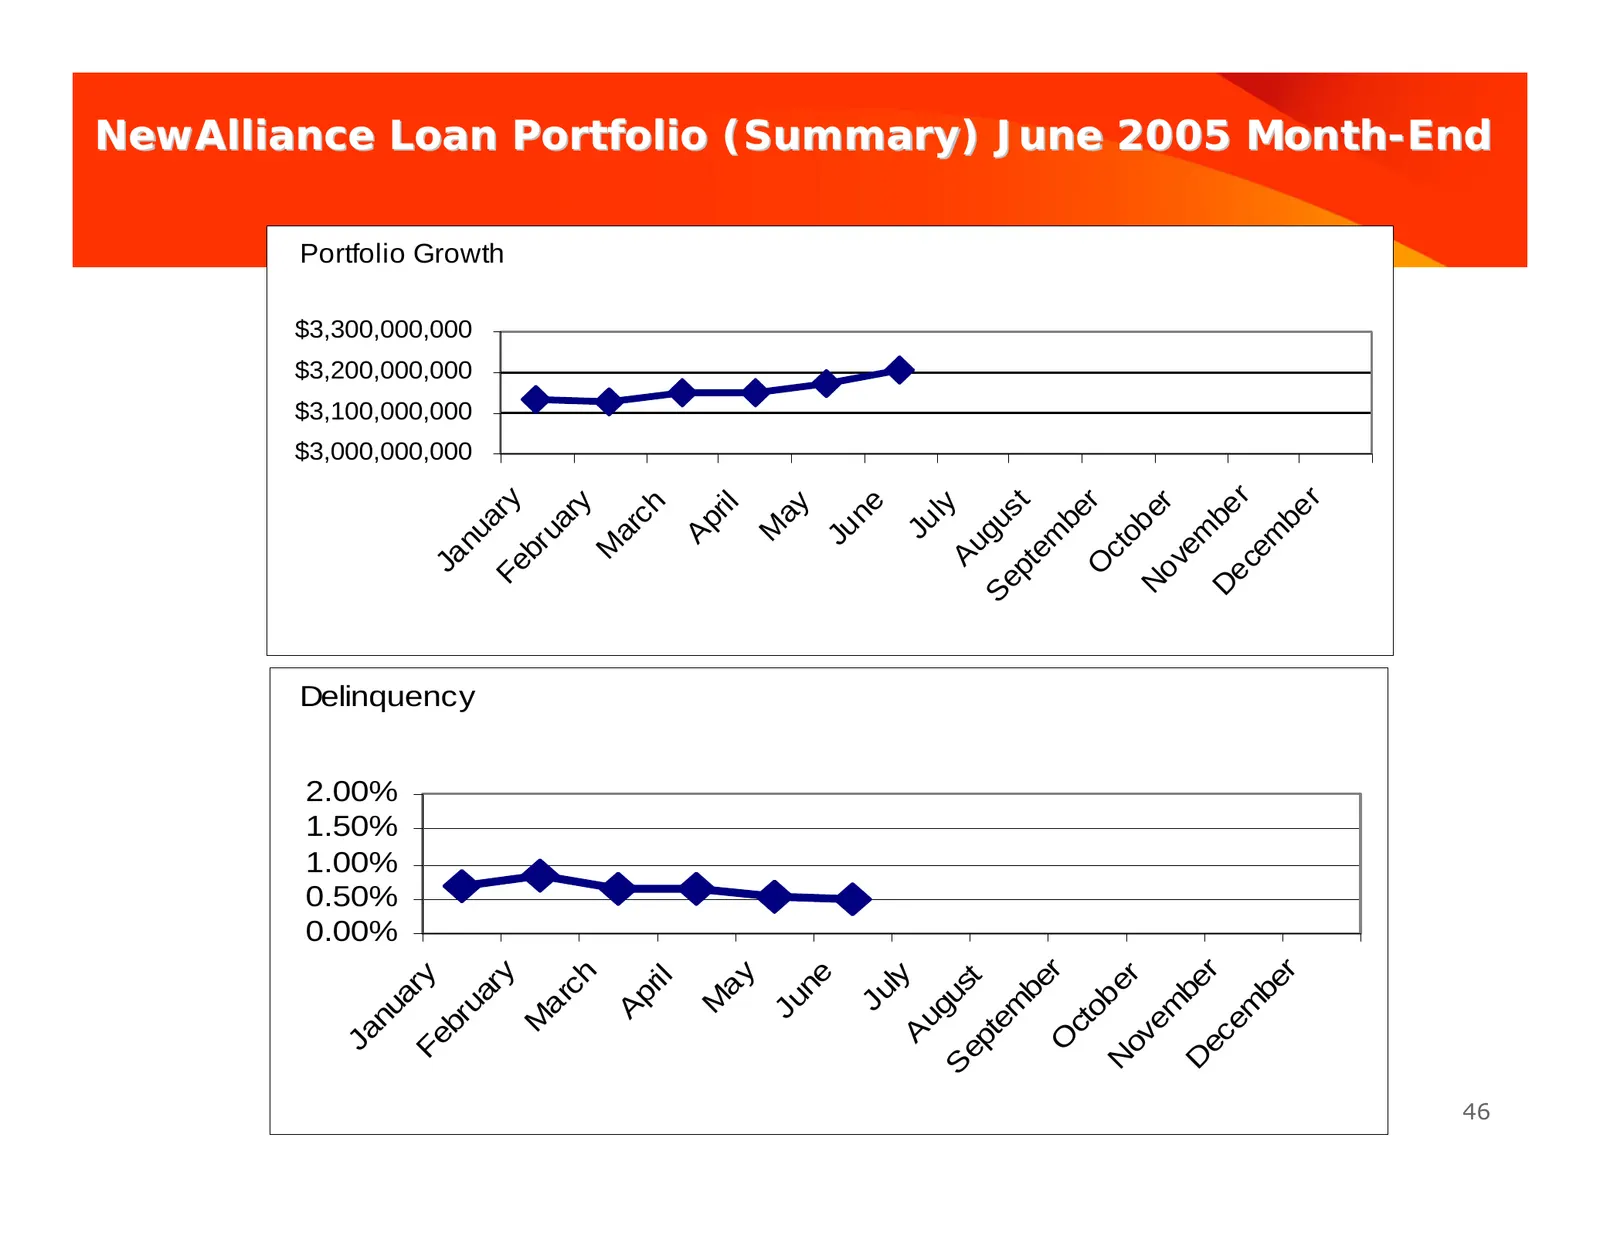
Slide 46: Loan Portfolio Growth and Delinquency
NewAlliance Loan Portfolio (Summary) June 2005 Month-End Portfolio Growth $3,300,000,000 $3,200,000,000 $3,100,000,000 $3,000,000,000 r Fe r y r r o v er ne ep ust ry ch y ay ril De be be be l a ua Ap Ju ob ar M Ju em nu g m m Au br M ct ce te Ja O N S Delinquency 2.00% 1.50% 1.00% 0.50% 0.00% r ec
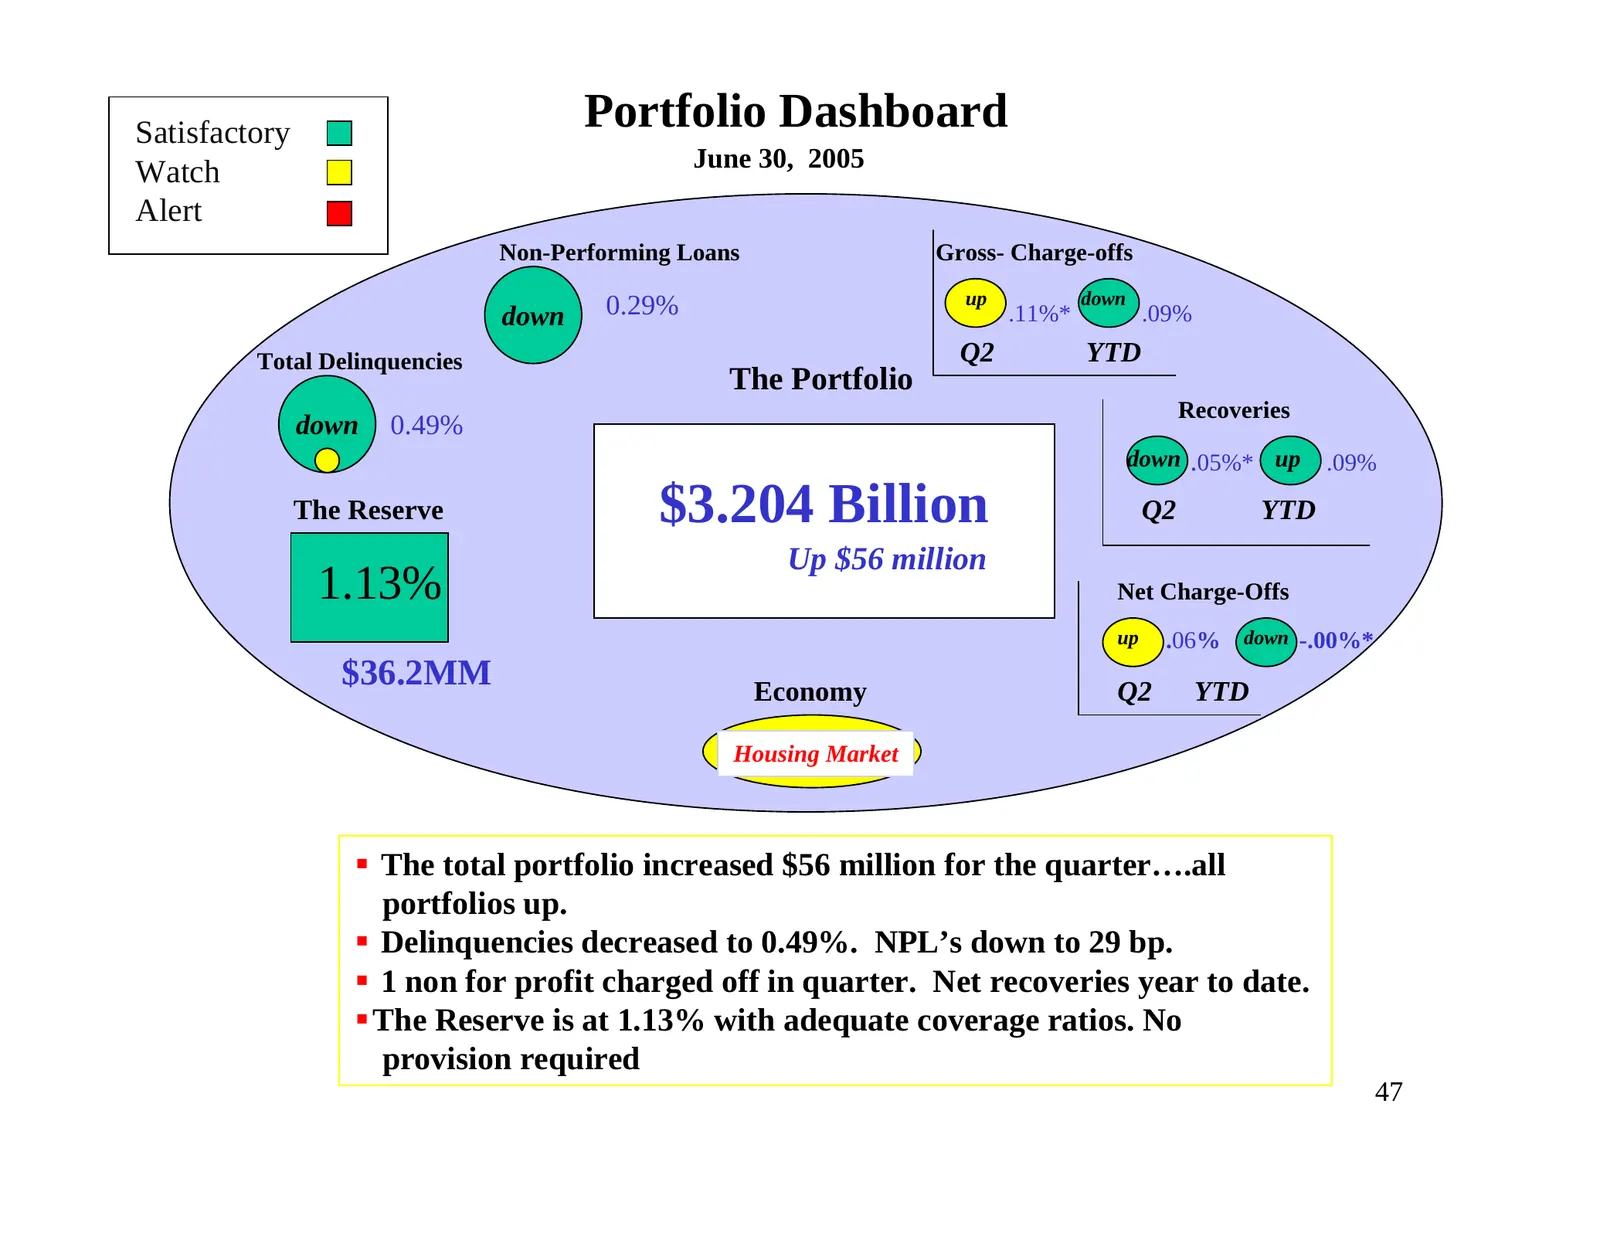
Slide 47: Portfolio Dashboard June 30, 2005
Satisfactory Portfolio Dashboard June 30, 2005 Watch Alert Non-Performing Loans Gross- Charge-offs 0.29% up down down .11%* .09% Total Delinquencies Q2 YTD The Portfolio Recoveries down 0.49% down .05%* up .09% 0.54% The Reserve $3.204 Billion Q2 YTD Up $56 million 1.13% Net Charge-Offs up .06% down
Slide 48: NAL Positioned Well for Housing Slowdown
NAL Positioned Well for Housing Slowdown 9 Fundamentally conservative underwriting by very experienced people---learned from 90’s 9 Branch Channel 9 Maximum CLTV for Home Equity 80% 9 Minimal Interest Only Loans 9 Debt Ratio Maximum 38% unless strong compensating factors (i.e.. low LTV) 48
Slide 49: NAL Positioned Well for Housing Slowdown (Continued)
Continued… NAL Positioned Well for Housing Slowdown 9 Low investor lending (3%) 9 Construction policy limits spec houses 9 Monitor sub-markets for economic fundamentals 9 Groton base closing should have minimal impact. 9 Total delinquencies consistently 65 to 75bp. 49bp in June 9 Most housing bubble

Slide 50: Banks with Strong Capital Bases
Banks with strong capital bases Will be considered very wise over The next 18 months …old credit dog circa 2005 50
Slide 51: Business Banking
Business Banking Diane L. Wishnafski Executive Vice President, Business Banking
Slide 52: Business Banking Mission
Business Banking Mission To develop a competent, experienced, productive business banking team that provides premier service to external and internal customers and that achieves growth targets in business products and services at optimum profitability. 52
Slide 53: Business Banking Corporate Strategy
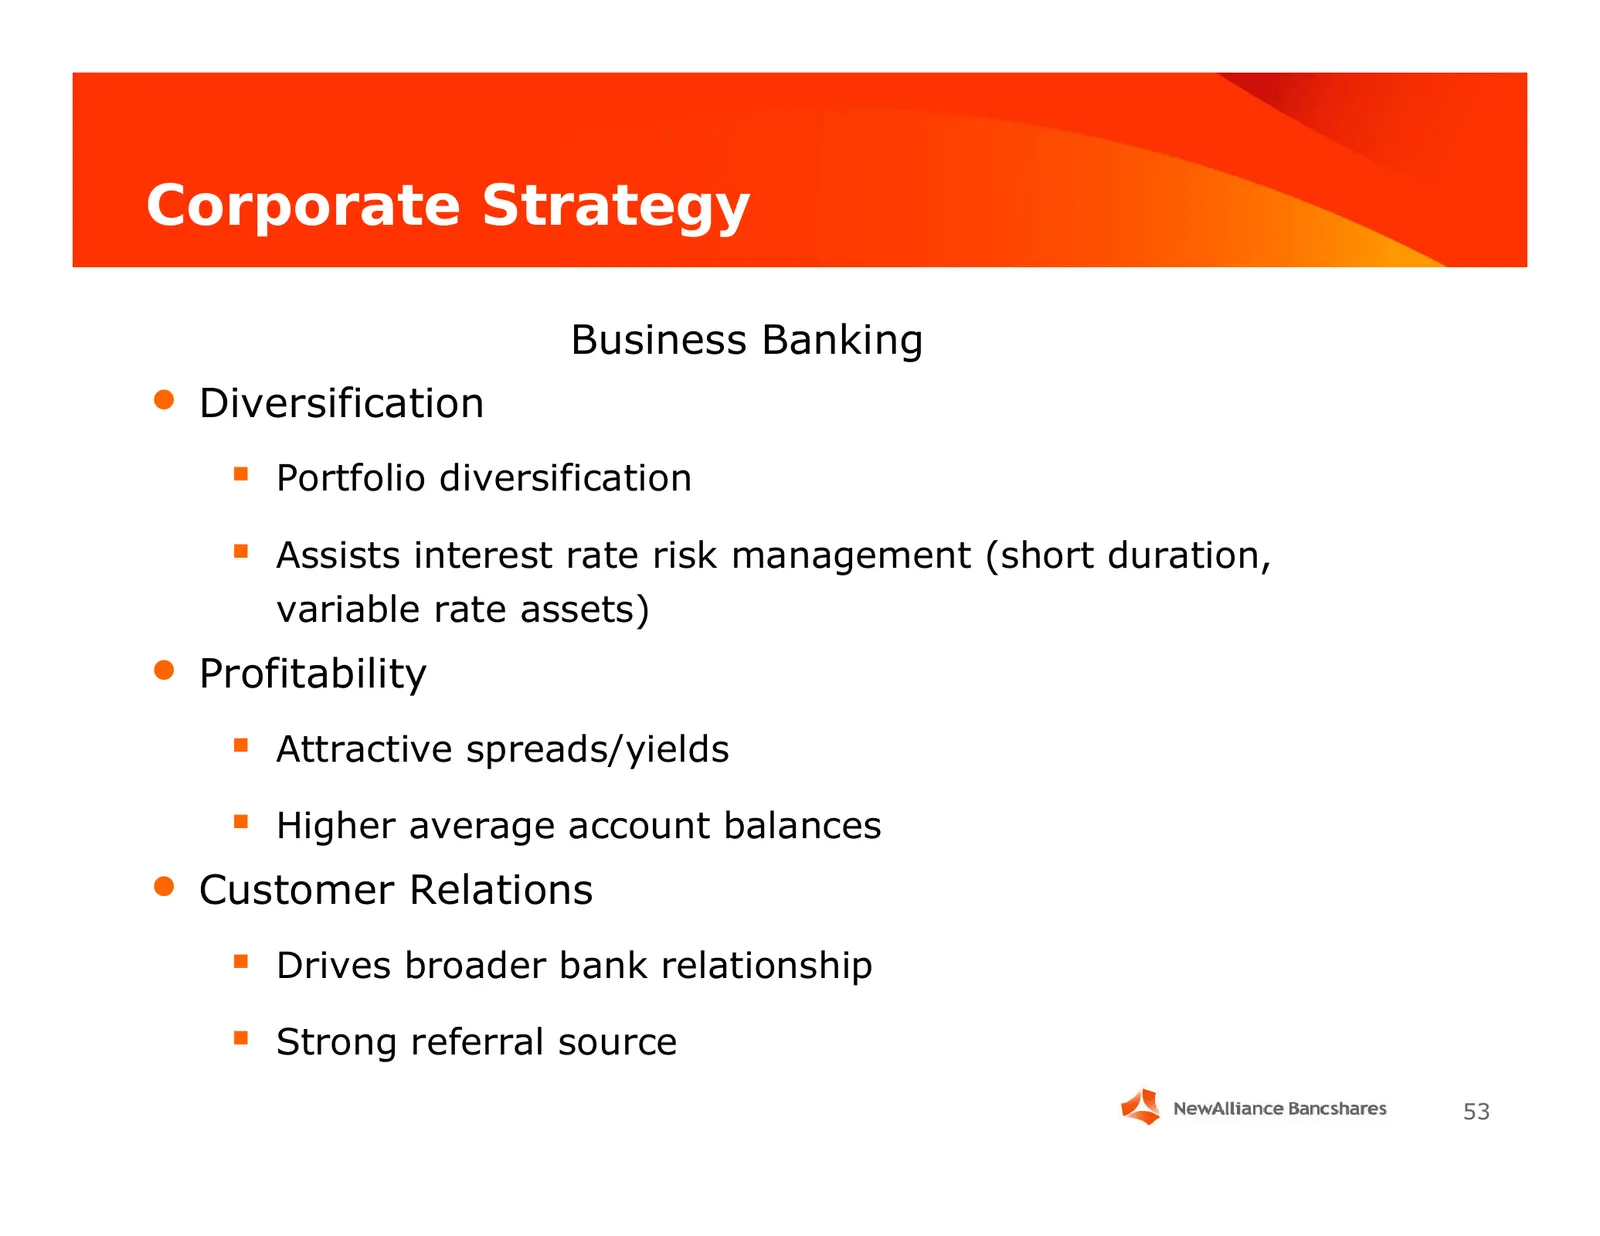
Corporate Strategy Business Banking • Diversification Portfolio diversification Assists interest rate risk management (short duration, variable rate assets) • Profitability Attractive spreads/yields Higher average account balances • Customer Relations Drives broader bank relationship Str
Slide 54: Commercial Division Yields 2nd Quarter 2005
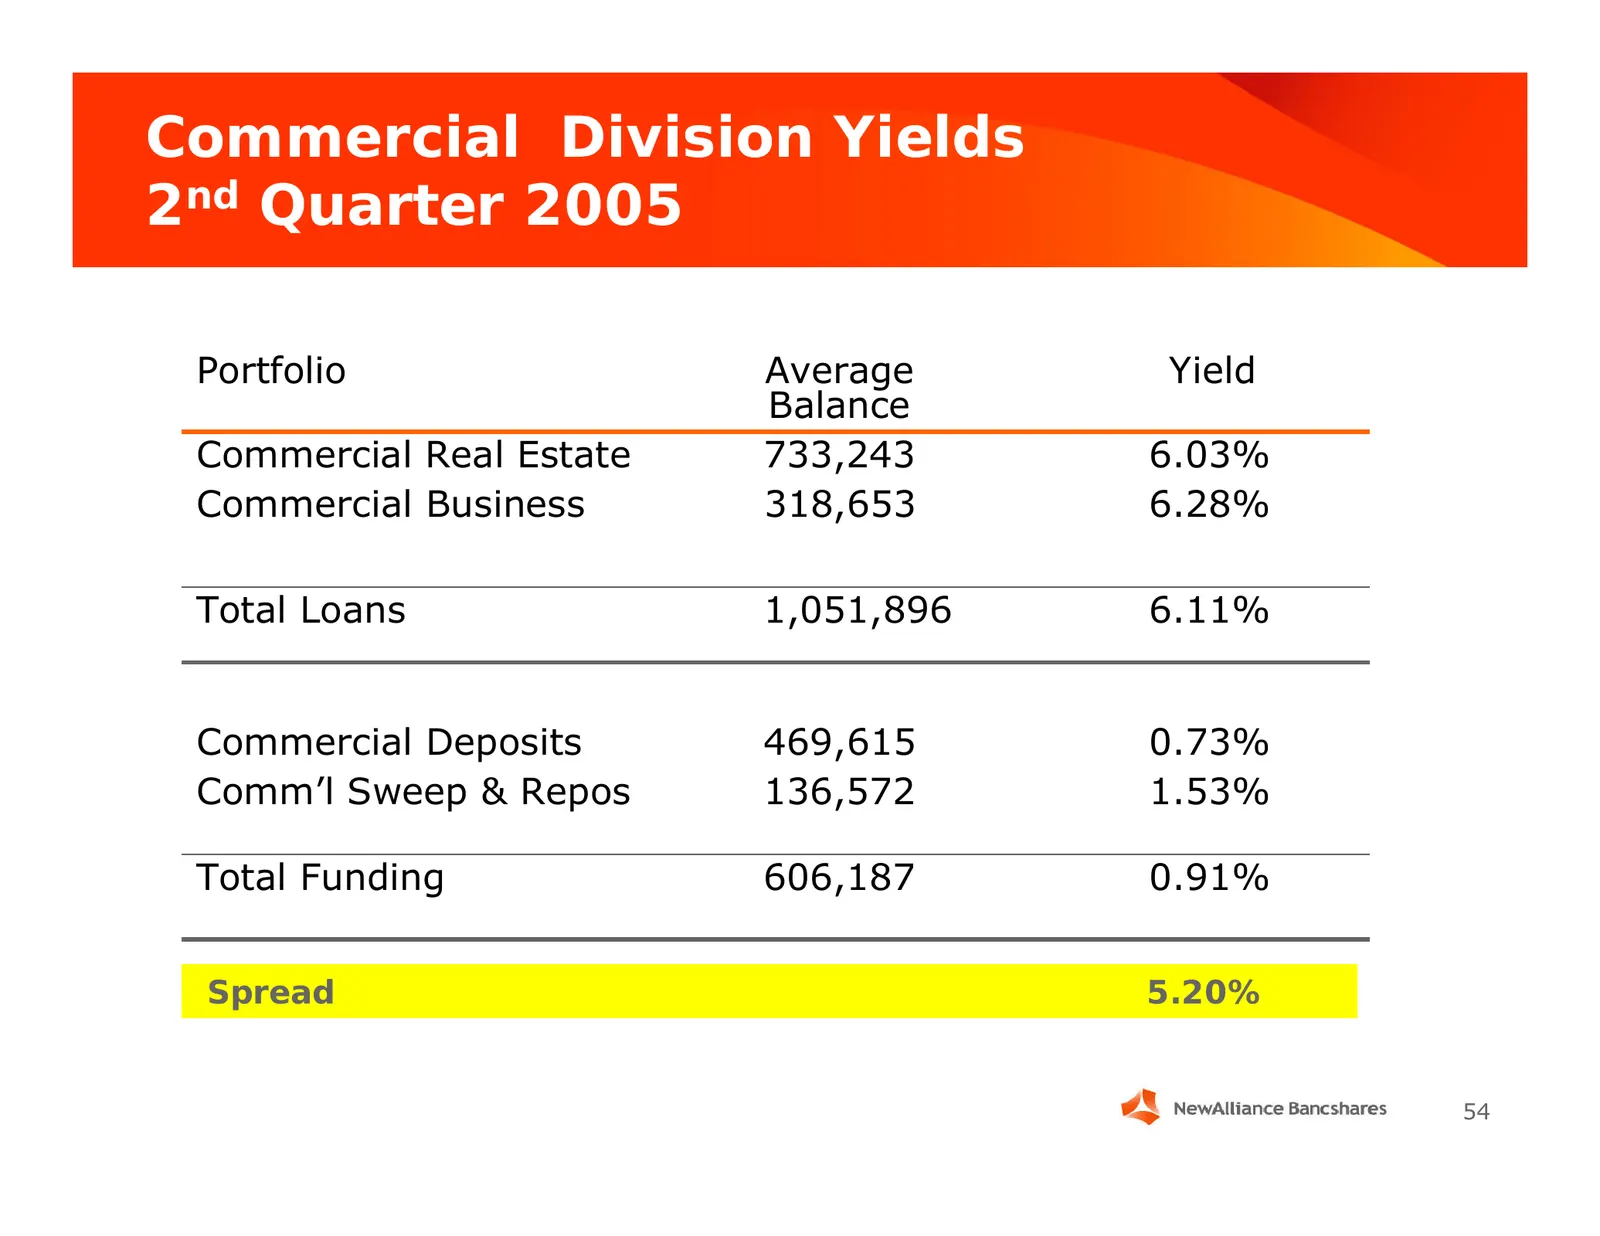
Commercial Division Yields 2nd Quarter 2005 Portfolio Average Yield Balance Commercial Real Estate 733,243 6.03% Commercial Business 318,653 6.28% Total Loans 1,051,896 6.11% Commercial Deposits 469,615 0.73% Comm’l Sweep & Repos 136,572 1.53% Total Funding 606,187 0.91% Spread 5.20% 54
Slide 55: Business Banking Product/Service Structure
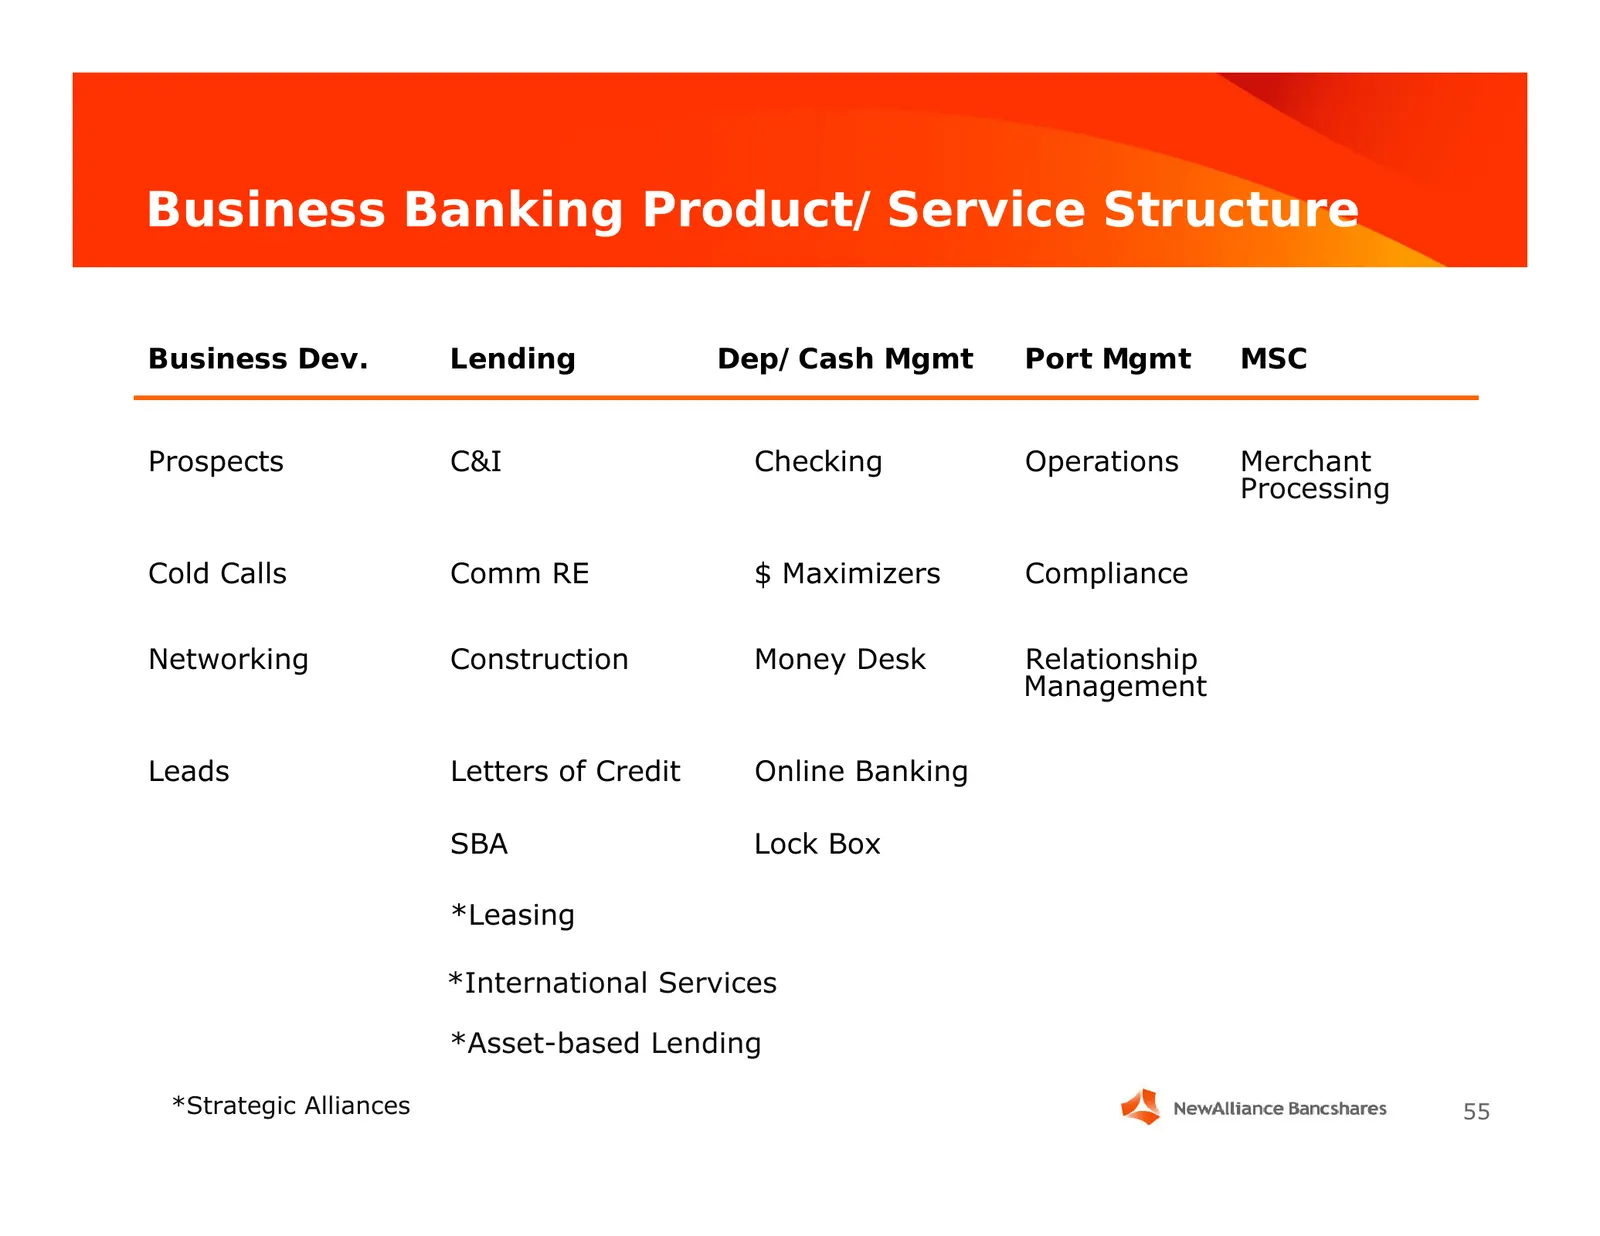
Business Banking Product/Service Structure Business Dev. Lending Dep/Cash Mgmt Port Mgmt MSC Prospects C&I Checking Operations Merchant Processing Cold Calls Comm RE $ Maximizers Compliance Networking Construction Money Desk Relationship Management Leads Letters of Credit Online Banking SBA Lock Box
Slide 56: Commercial Lending
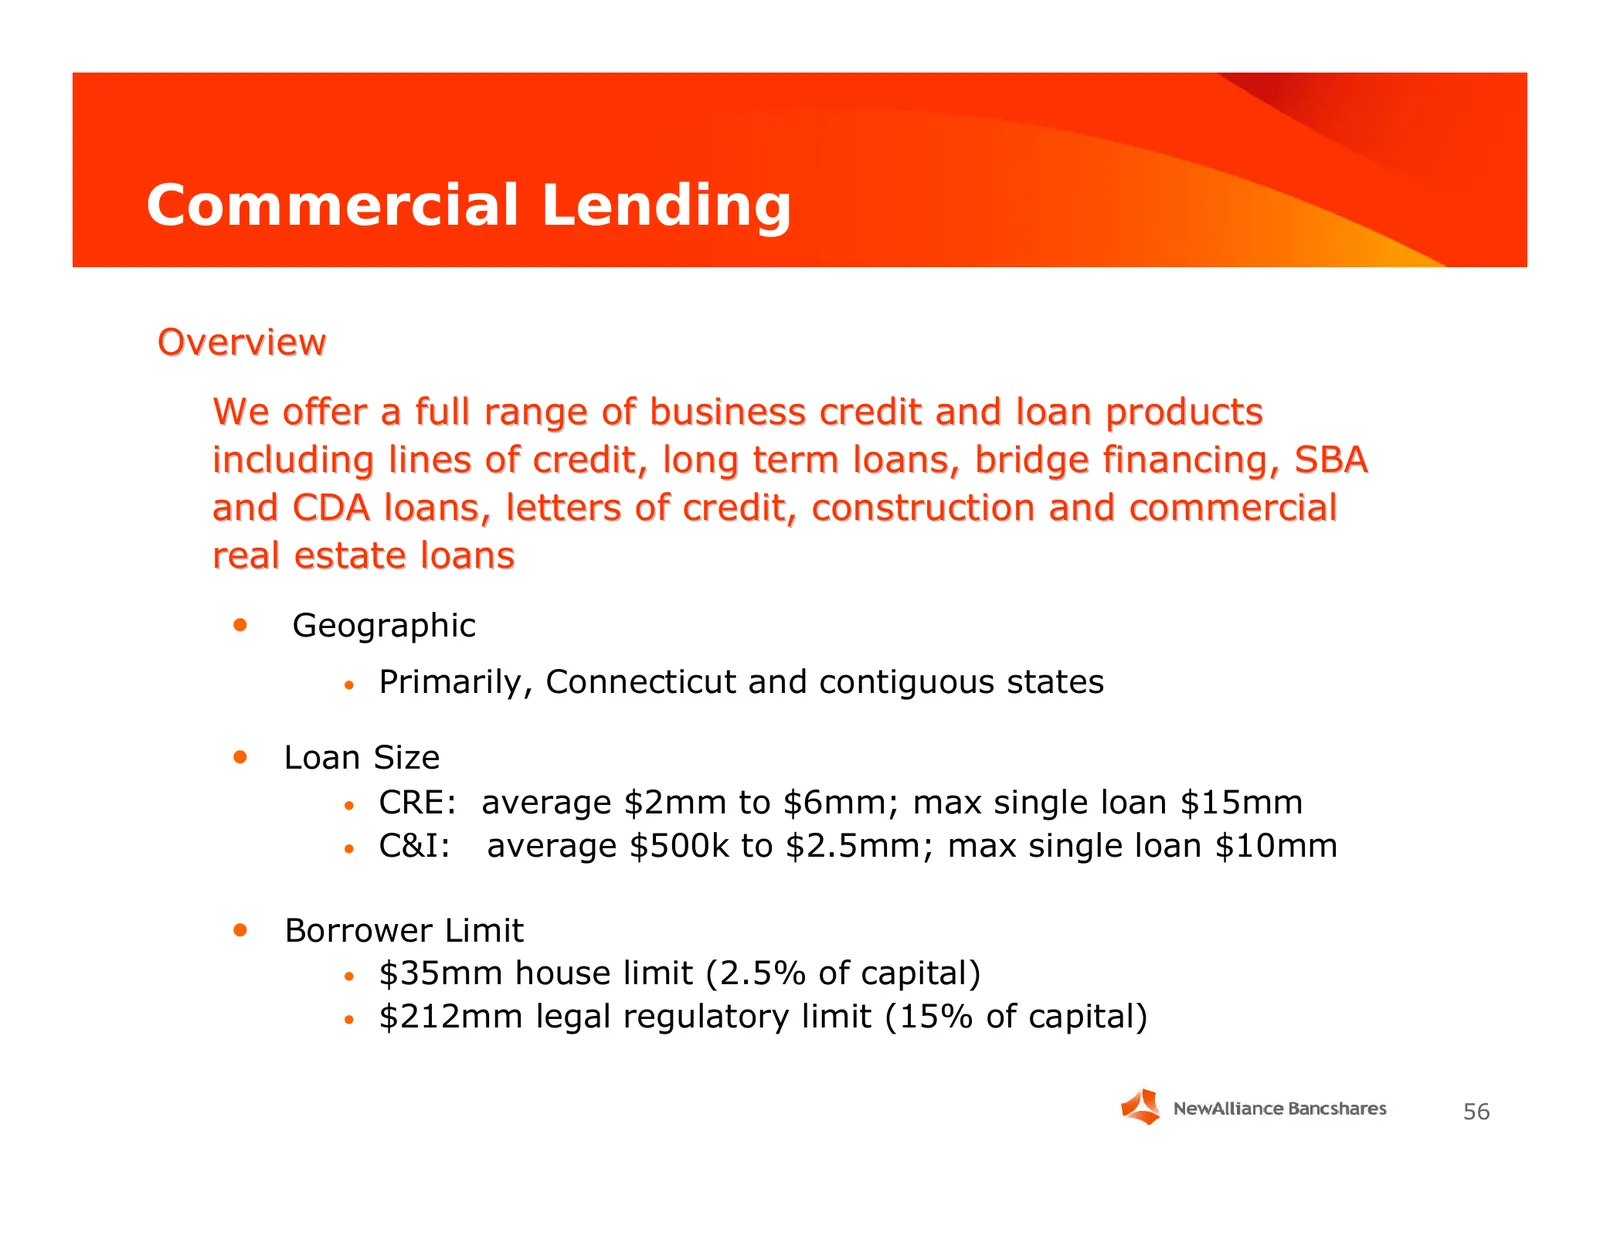
Commercial Lending Overview We offer a full range of business credit and loan products including lines of credit, long term loans, bridge financing, SBA and CDA loans, letters of credit, construction and commercial real estate loans • Geographic • Primarily, Connecticut and contiguous states • Loan
Slide 57: Commercial Loan Portfolios
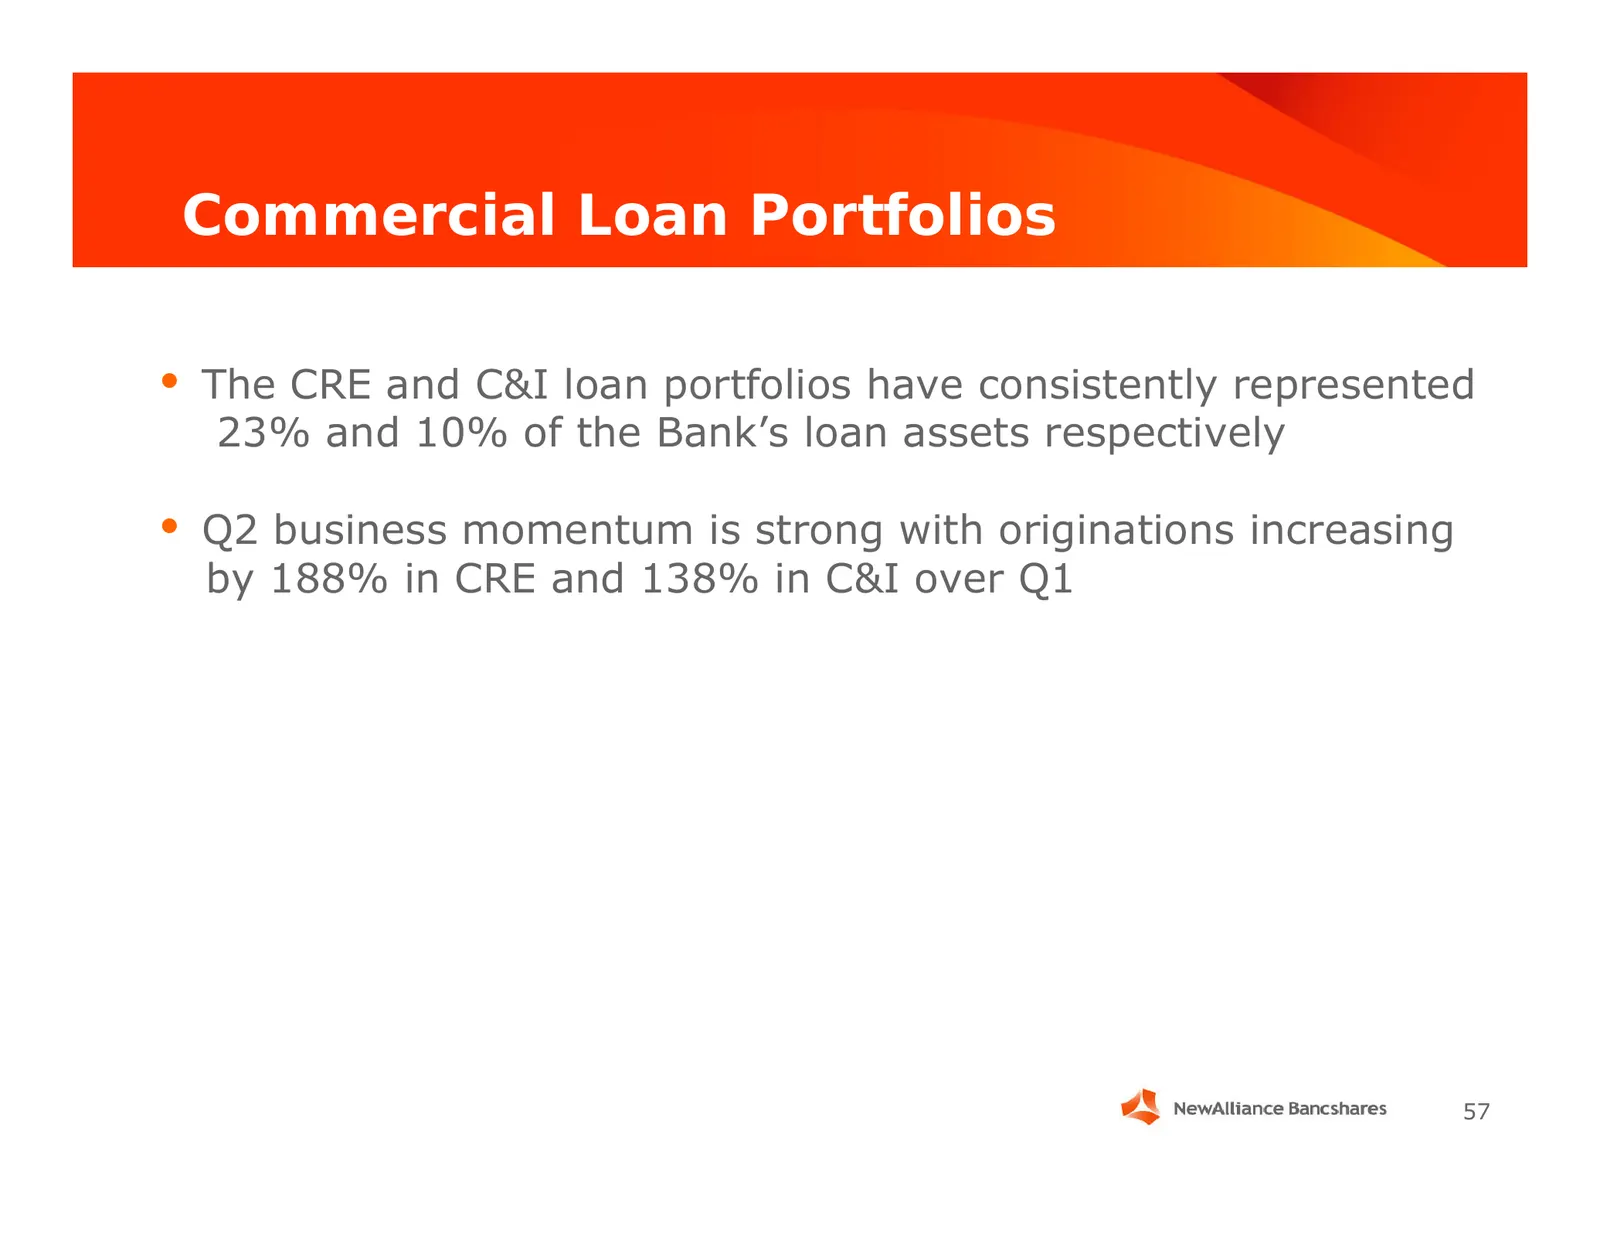
Commercial Loan Portfolios • The CRE and C&I loan portfolios have consistently represented 23% and 10% of the Bank’s loan assets respectively • Q2 business momentum is strong with originations increasing by 188% in CRE and 138% in C&I over Q1 57
Slide 58: Commercial Real Estate (CRE) Portfolio Diversity
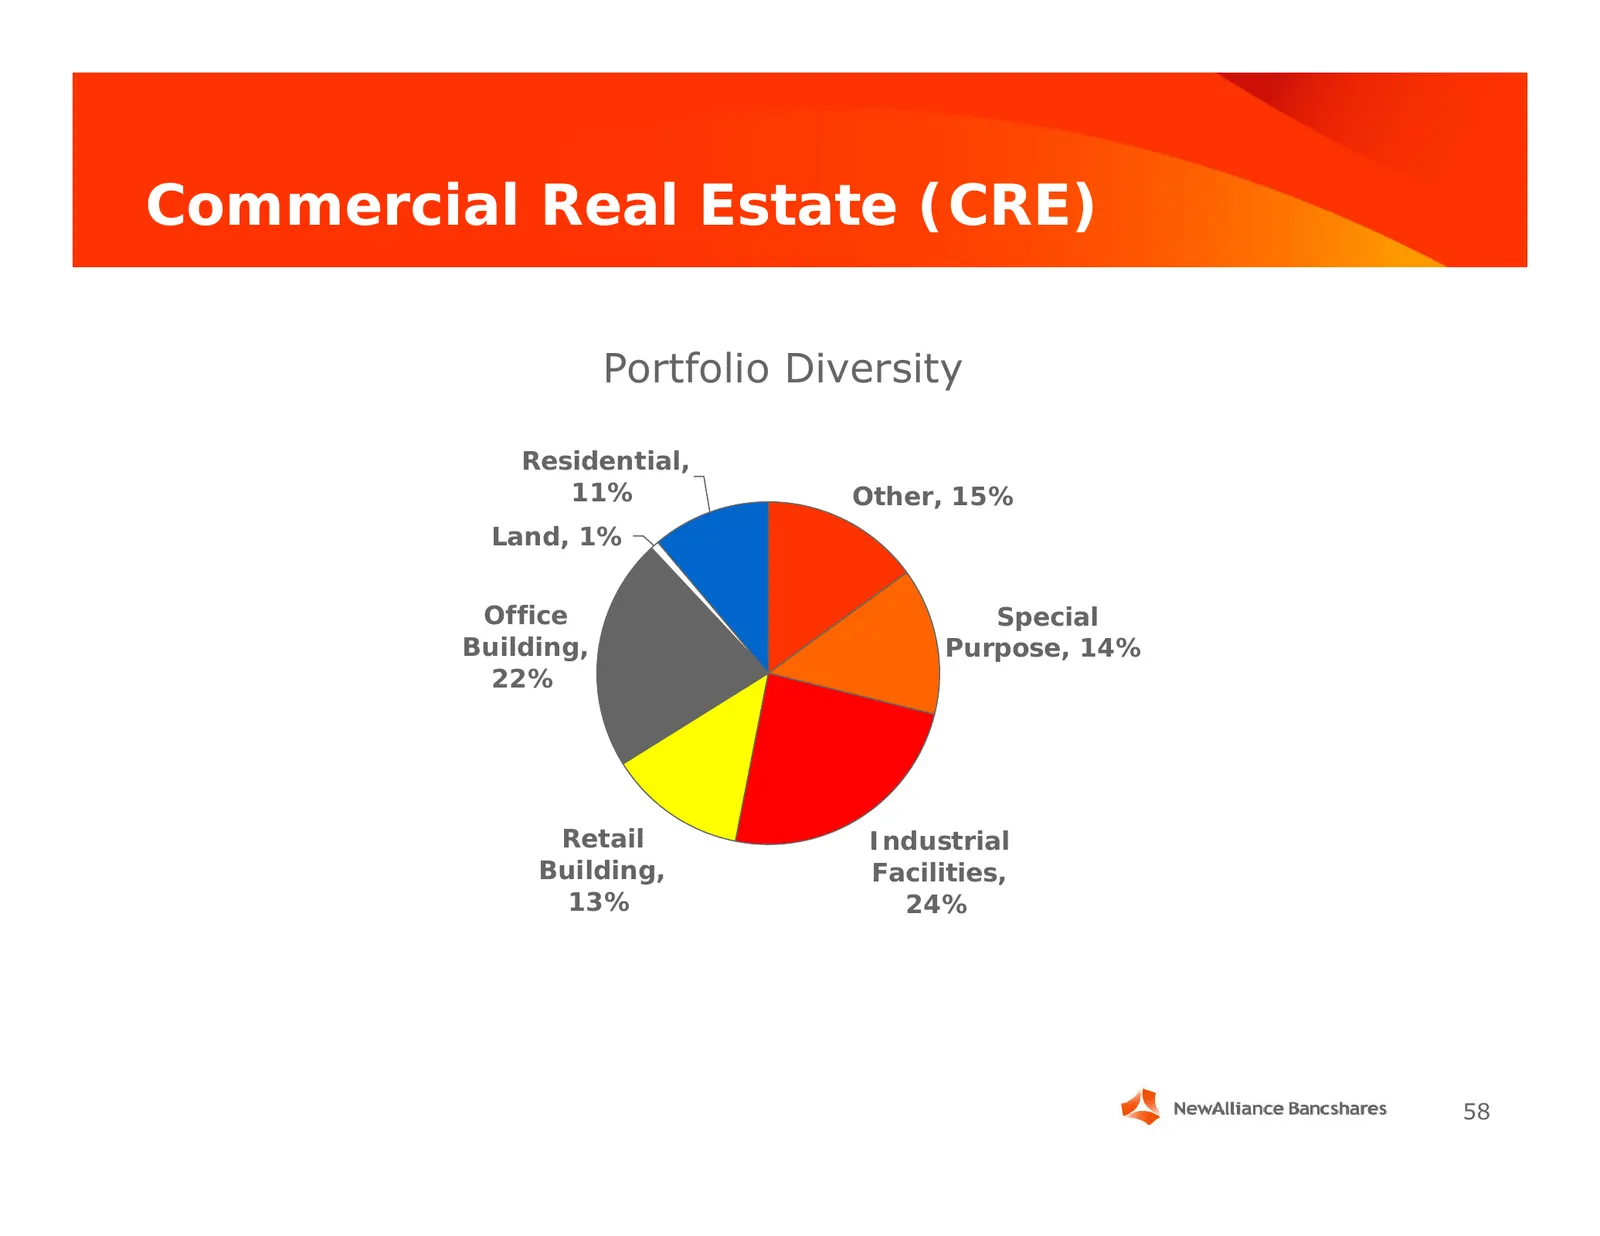
Commercial Real Estate (CRE) Portfolio Diversity Residential, 11% Other, 15% Land, 1% Office Special Building, Purpose, 14% 22% Retail Industrial Building, Facilities, 13% 24% 58
Slide 59: Commercial & Industrial Lending (C&I) Portfolio Diversity
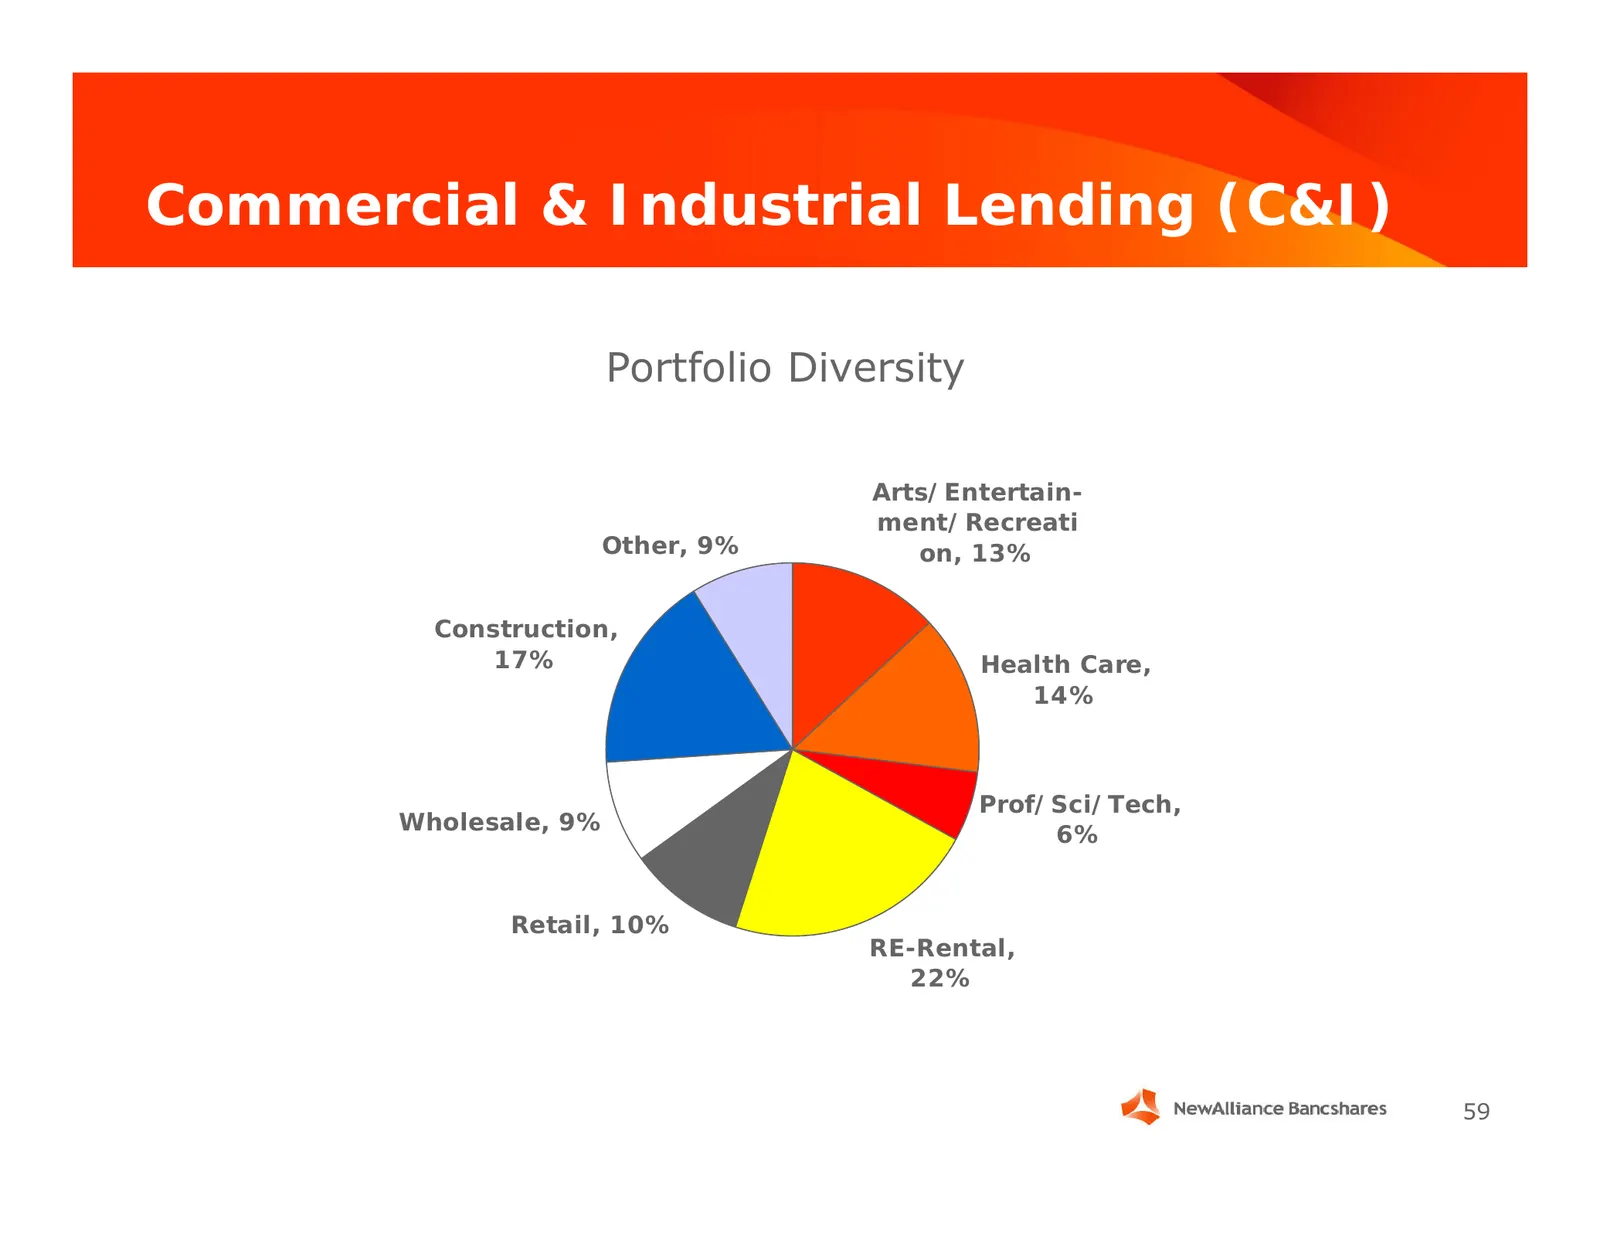
Commercial & Industrial Lending (C&I) Portfolio Diversity Arts/Entertain- ment/Recreati Other, 9% on, 13% Construction, 17% Health Care, 14% Prof/Sci/Tech, Wholesale, 9% 6% Retail, 10% RE-Rental, 22% 59
Slide 60: Business Deposits
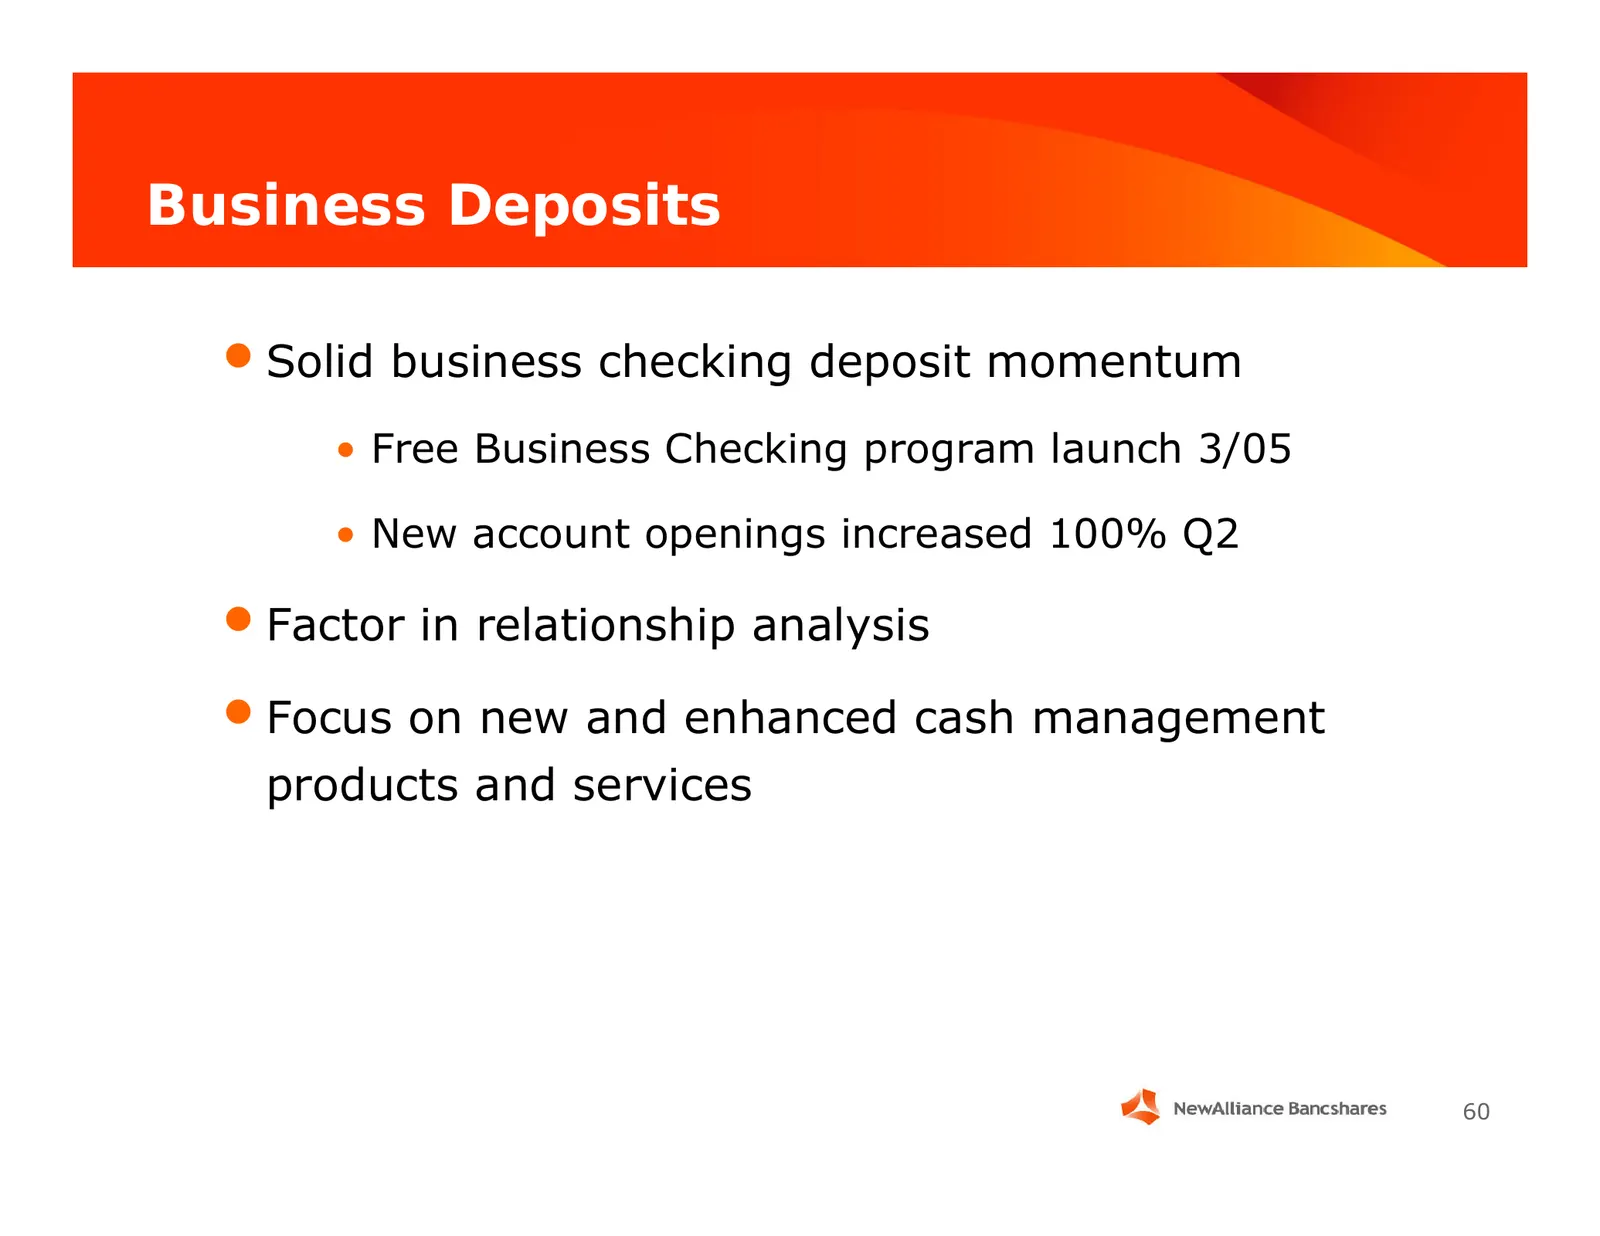
Business Deposits • Solid business checking deposit momentum • Free Business Checking program launch 3/05 • New account openings increased 100% Q2 • Factor in relationship analysis • Focus on new and enhanced cash management products and services 60
Slide 61: Merchant Services
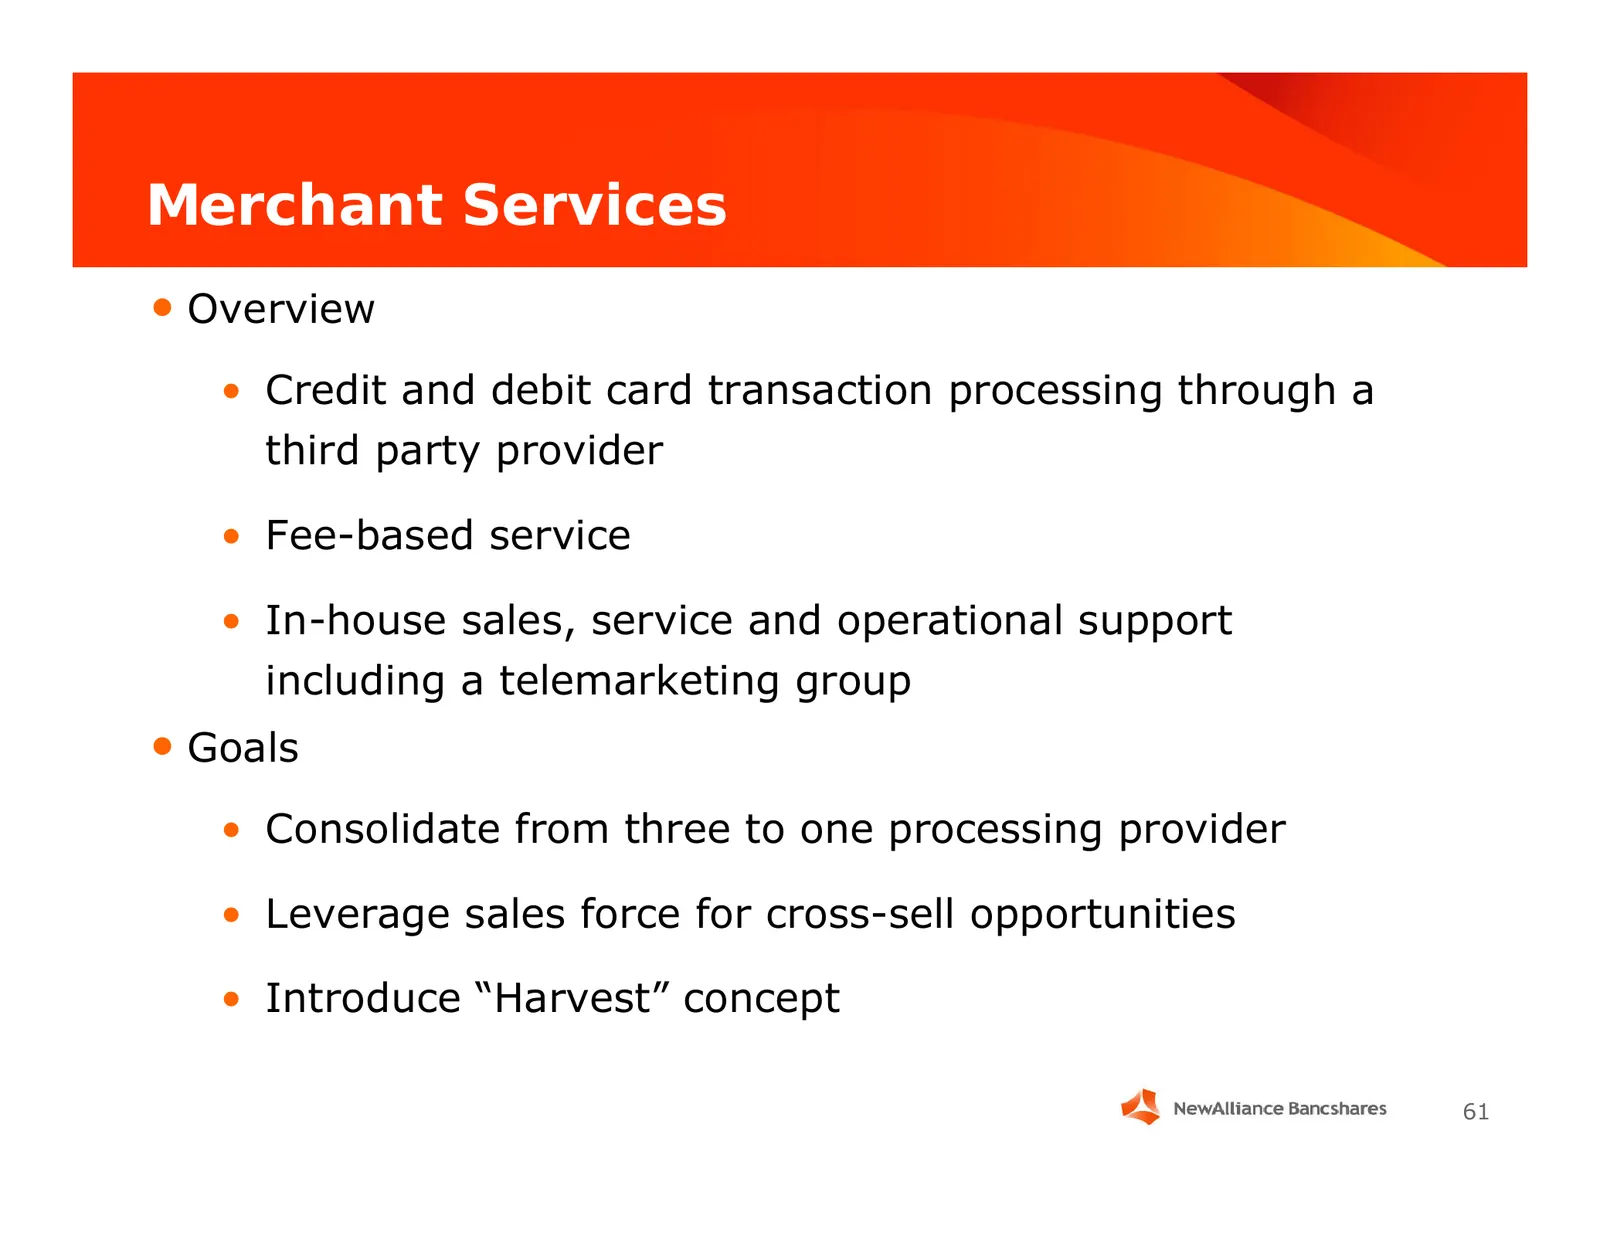
Merchant Services • Overview • Credit and debit card transaction processing through a third party provider • Fee-based service • In-house sales, service and operational support including a telemarketing group • Goals • Consolidate from three to one processing provider • Leverage sales force for cros
Slide 62: Business Banking Growth Opportunities
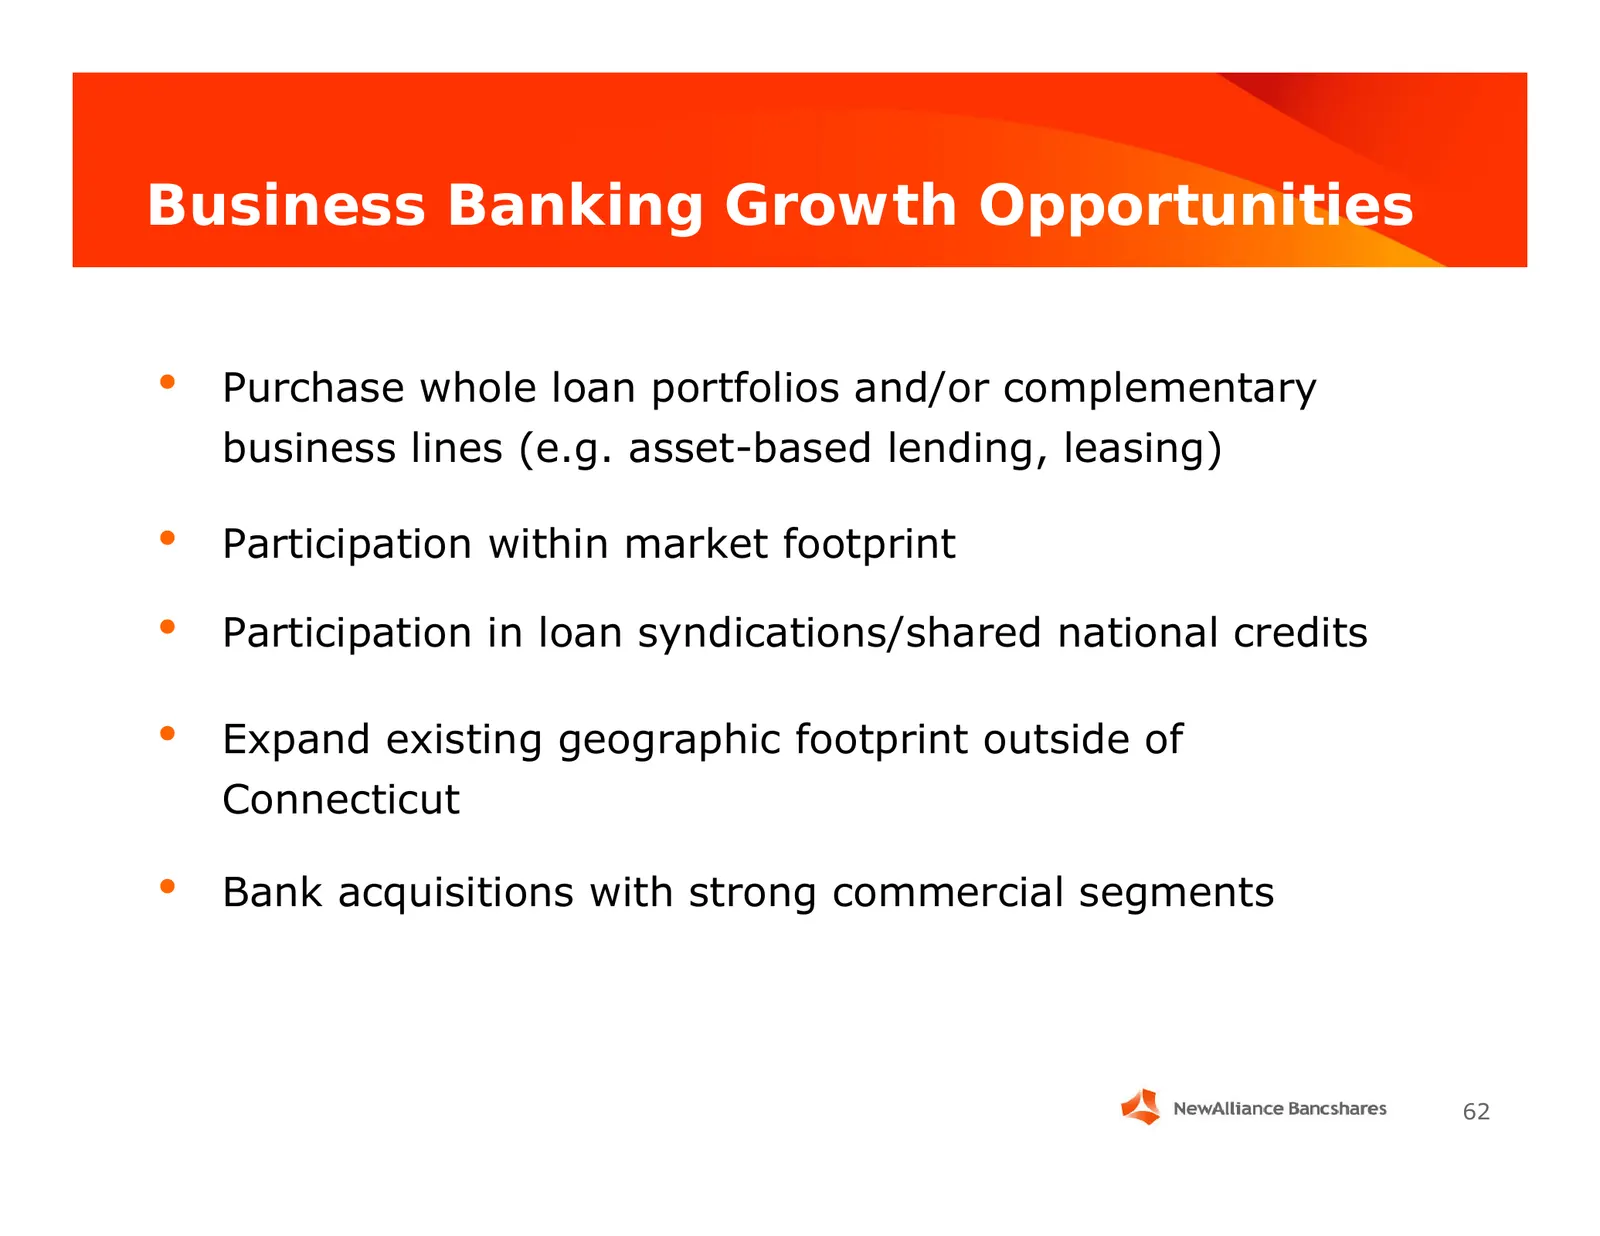
Business Banking Growth Opportunities • Purchase whole loan portfolios and/or complementary business lines (e.g. asset-based lending, leasing) • Participation within market footprint • Participation in loan syndications/shared national credits • Expand existing geographic footprint outside of Connec
Slide 63: Competitive Arena
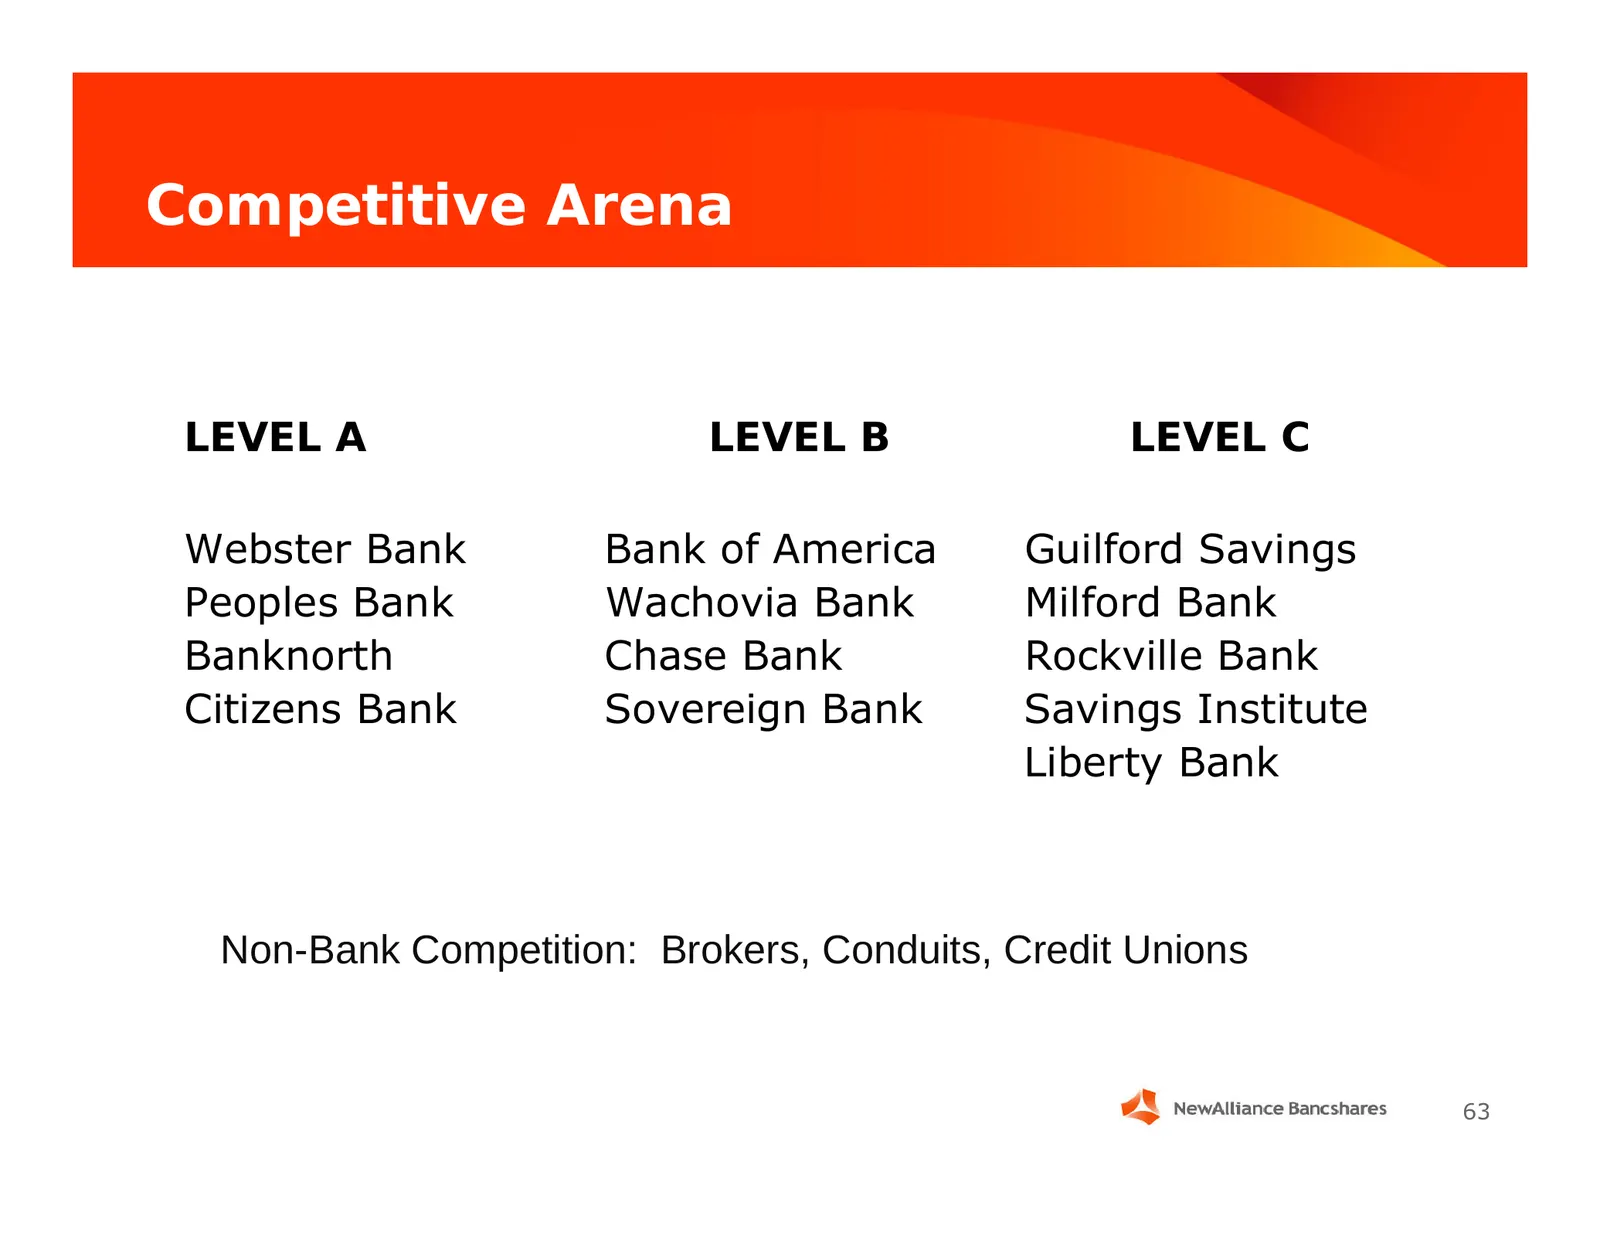
Competitive Arena LEVEL A LEVEL B LEVEL C Webster Bank Bank of America Guilford Savings Peoples Bank Wachovia Bank Milford Bank Banknorth Chase Bank Rockville Bank Citizens Bank Sovereign Bank Savings Institute Liberty Bank Non-Bank Competition: Brokers, Conduits, Credit Unions 63
Slide 64: Our Competitive Advantage
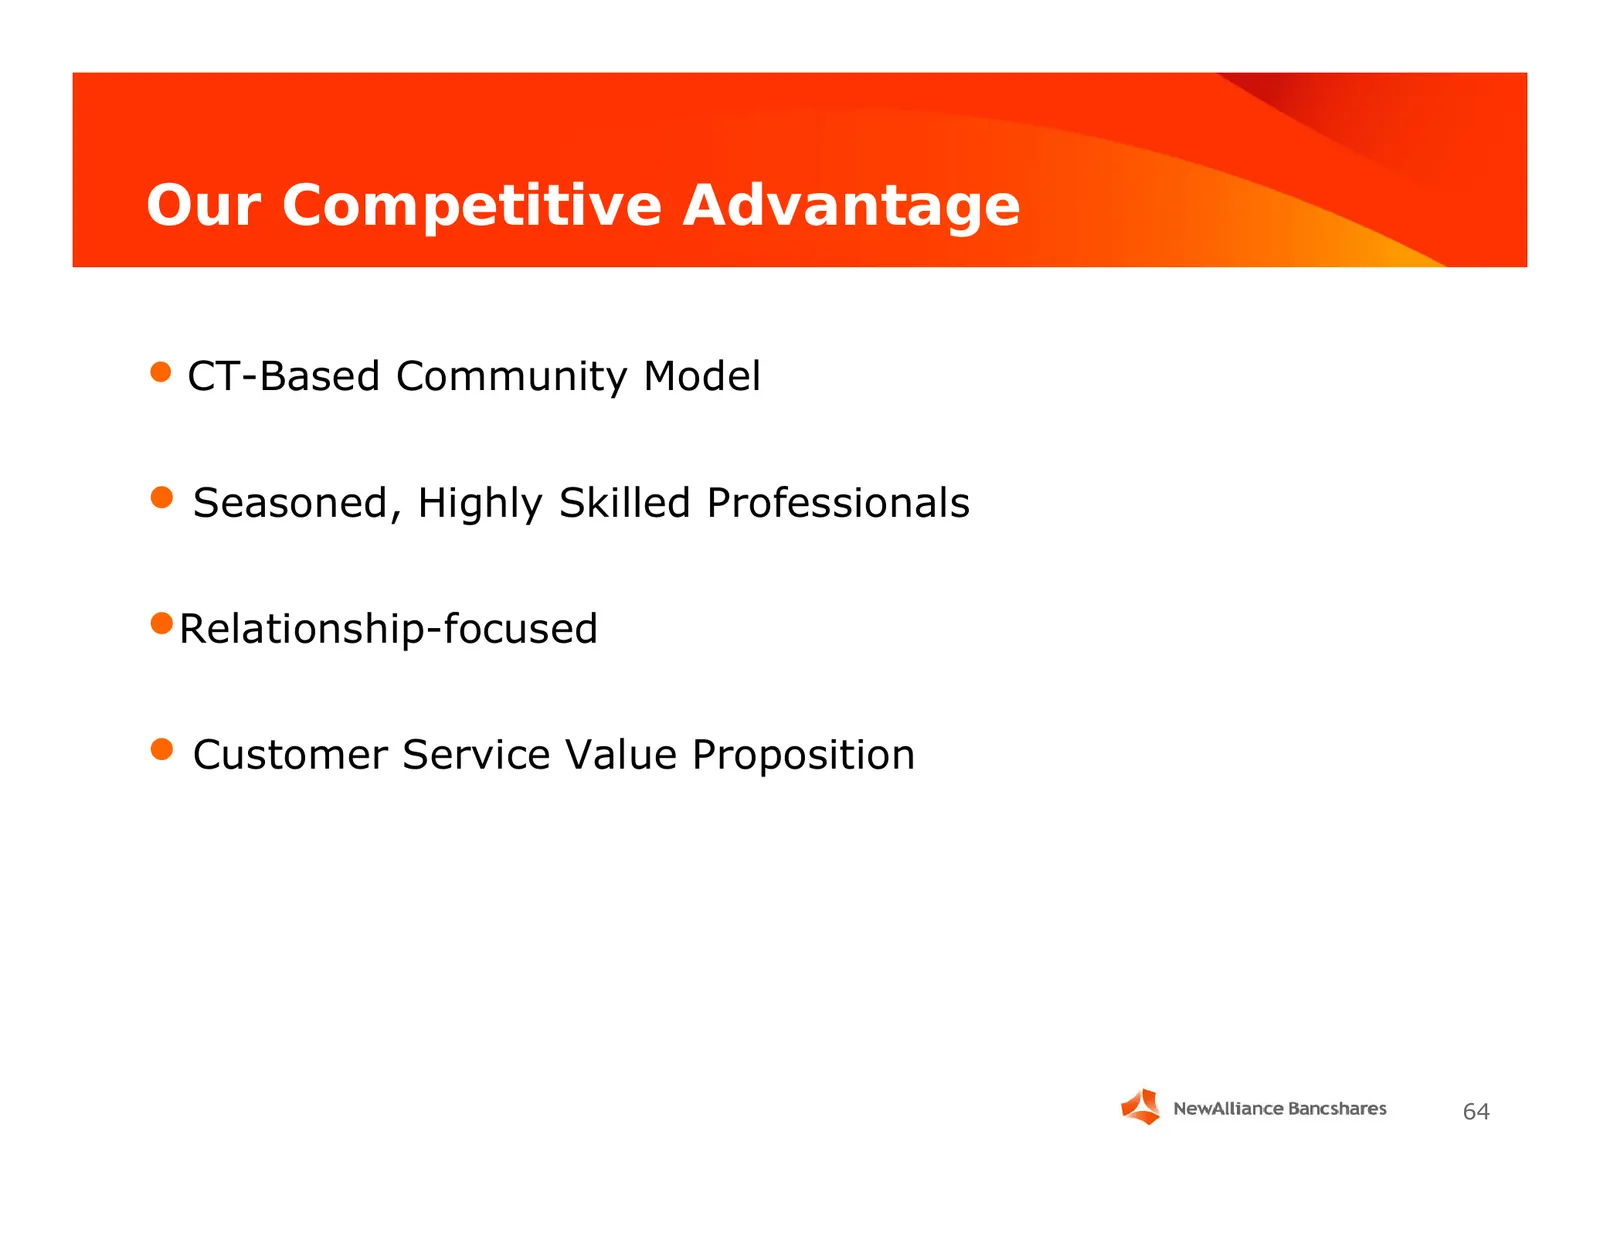
Our Competitive Advantage • CT-Based Community Model • Seasoned, Highly Skilled Professionals •Relationship-focused • Customer Service Value Proposition 64
Slide 65: Customer Acquisition
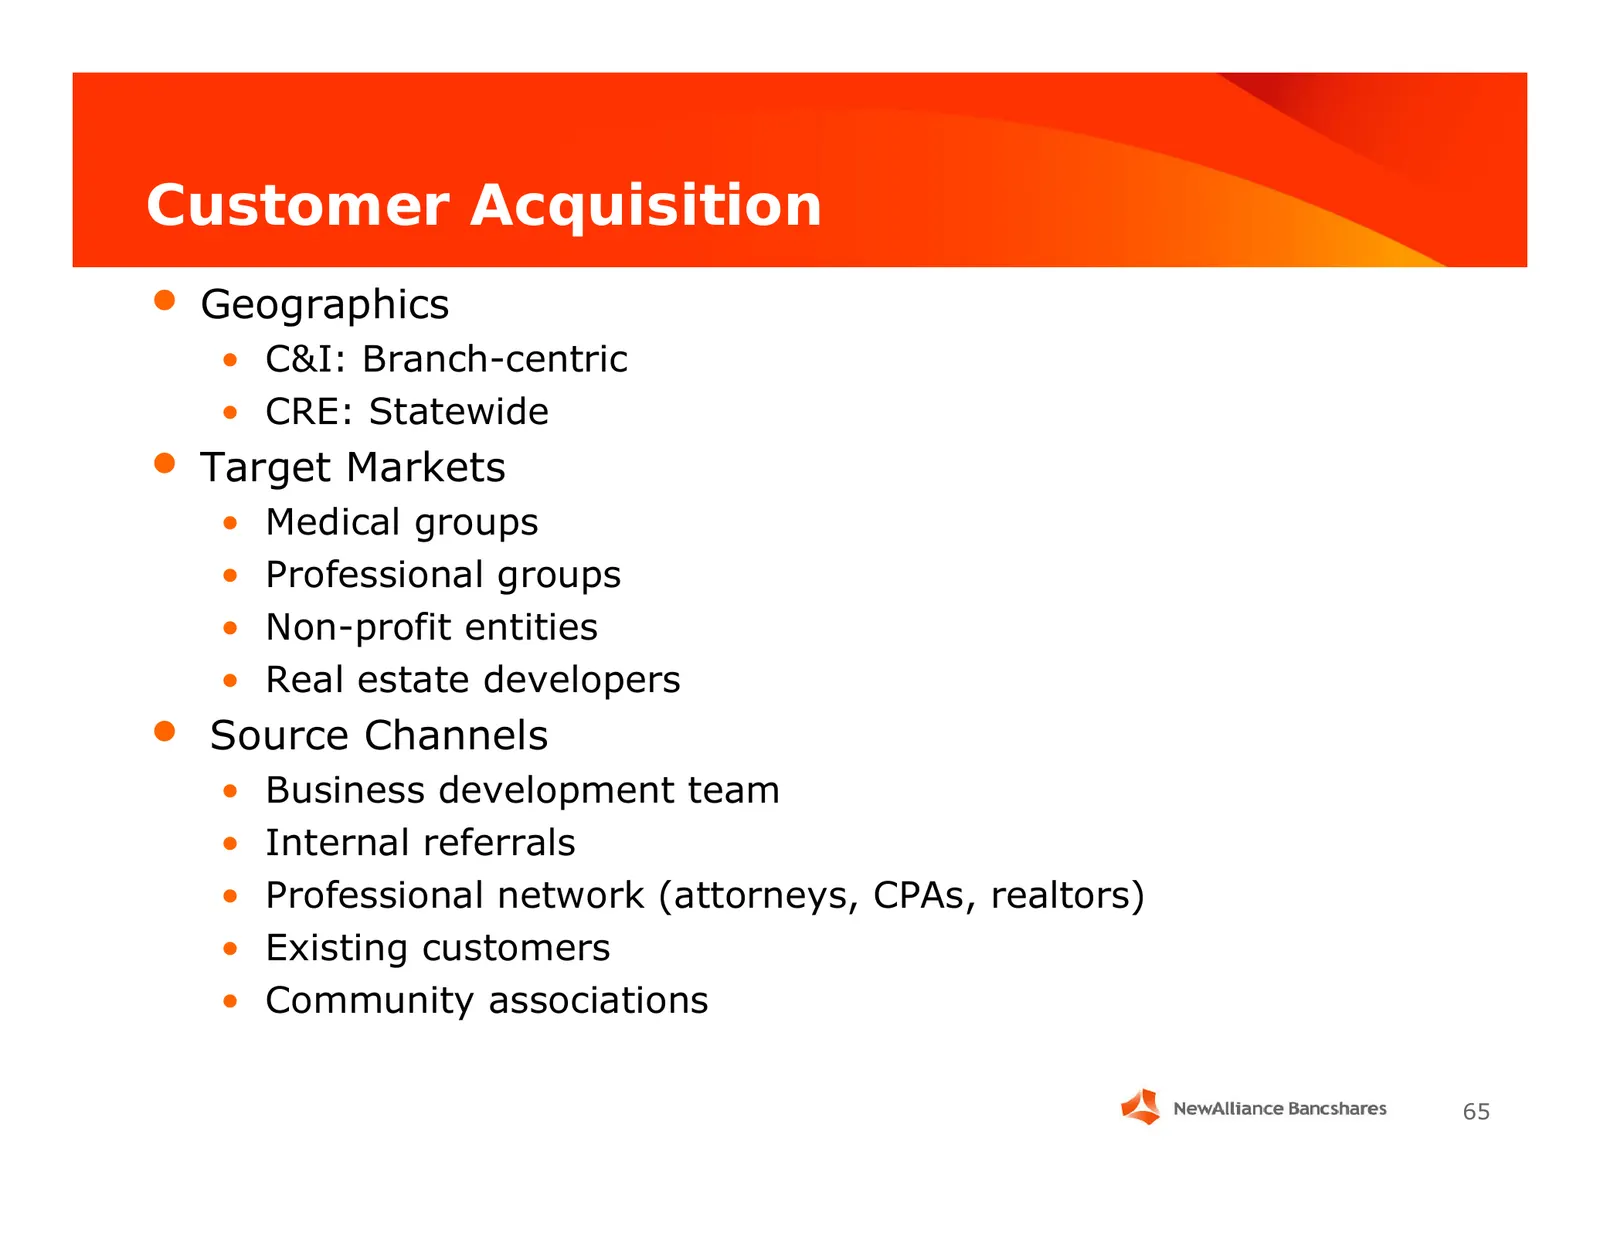
Customer Acquisition • Geographics • C&I: Branch-centric • CRE: Statewide • Target Markets • Medical groups • Professional groups • Non-profit entities • Real estate developers • Source Channels • Business development team • Internal referrals • Professional network (attorneys, CPAs, realtors) • Exi
Slide 66: Conclusion
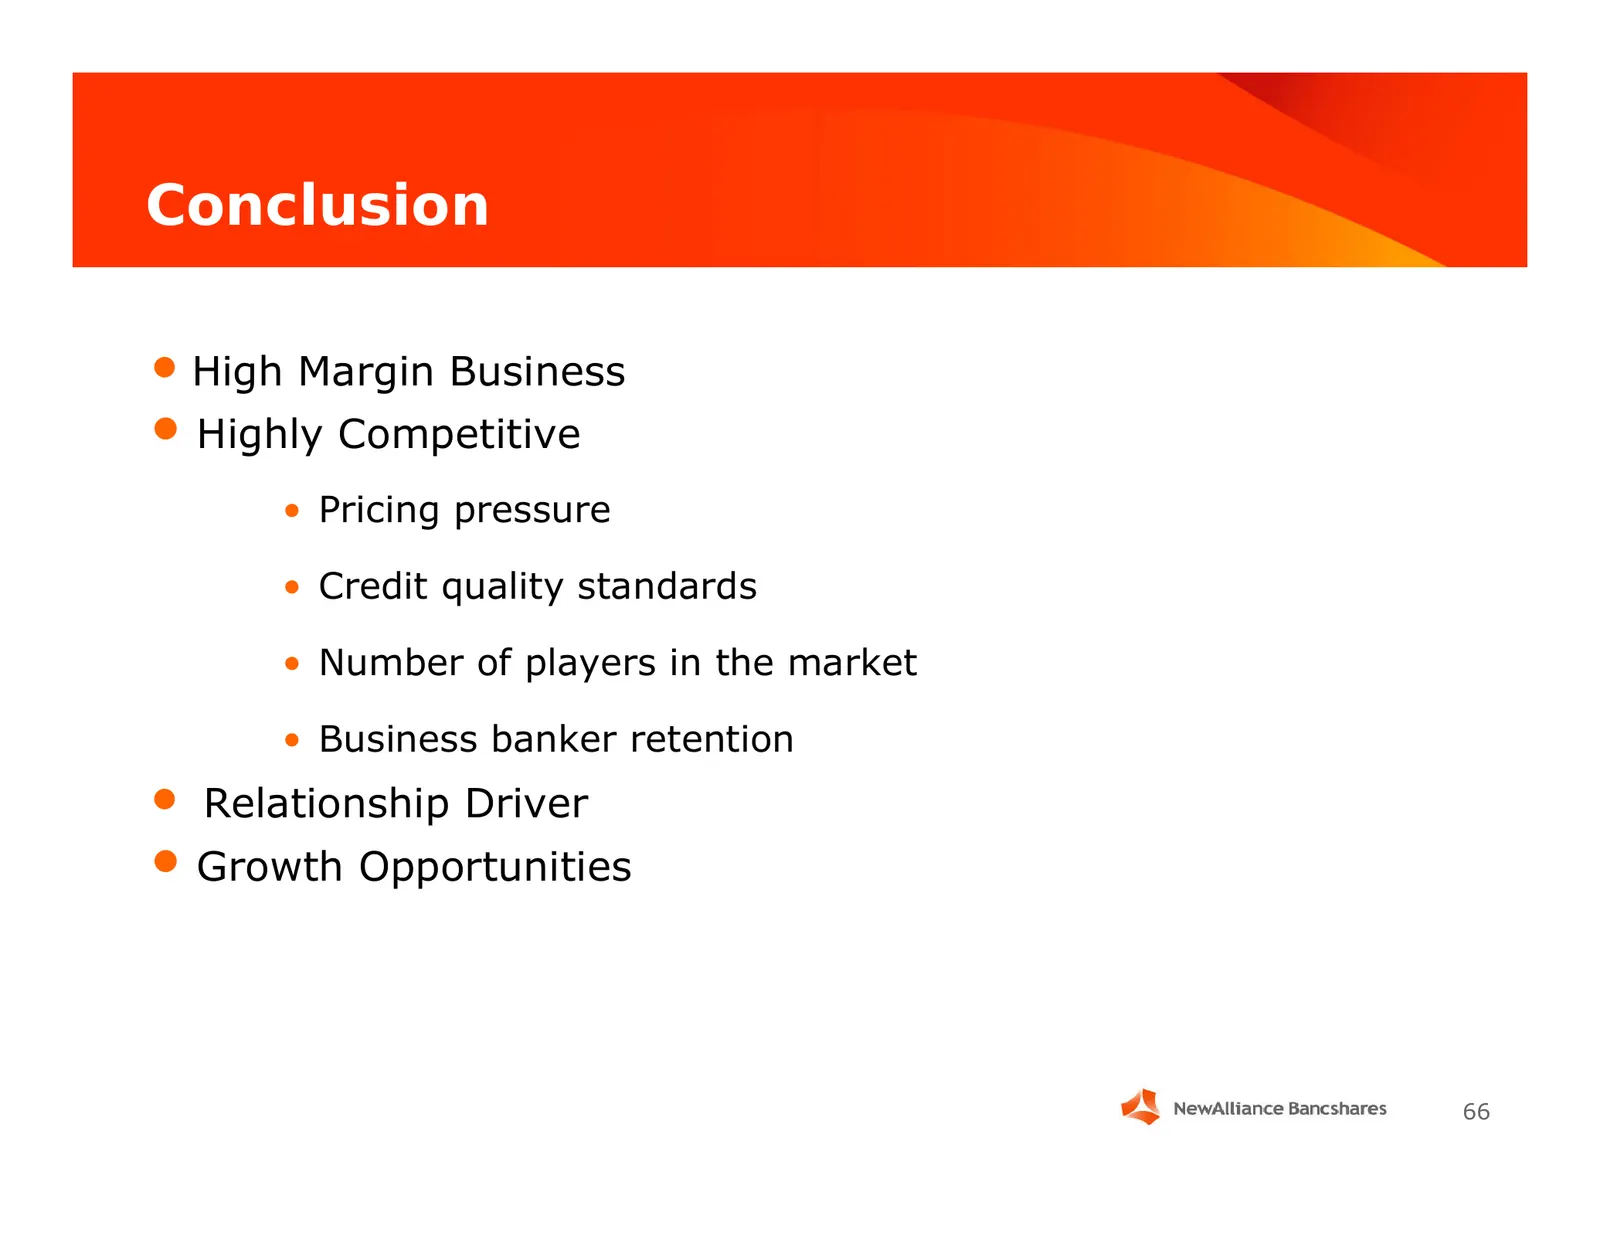
Conclusion • High Margin Business • Highly Competitive • Pricing pressure • Credit quality standards • Number of players in the market • Business banker retention • Relationship Driver • Growth Opportunities 66

Slide 67: Personal Banking
Personal Banking David H. Purcell Executive Vice President, Personal Banking
Slide 68: Personal Banking Philosophy
Personal Banking Philosophy Capital Ideas. Human Values. What does our tag line mean to retail audiences? For individual customers: We forge “new”, stronger customer alliances based upon our heritage of personalized service. We provide customized product advice, based upon a total understanding of o
Slide 69: Retail Strategy: Branch Channel
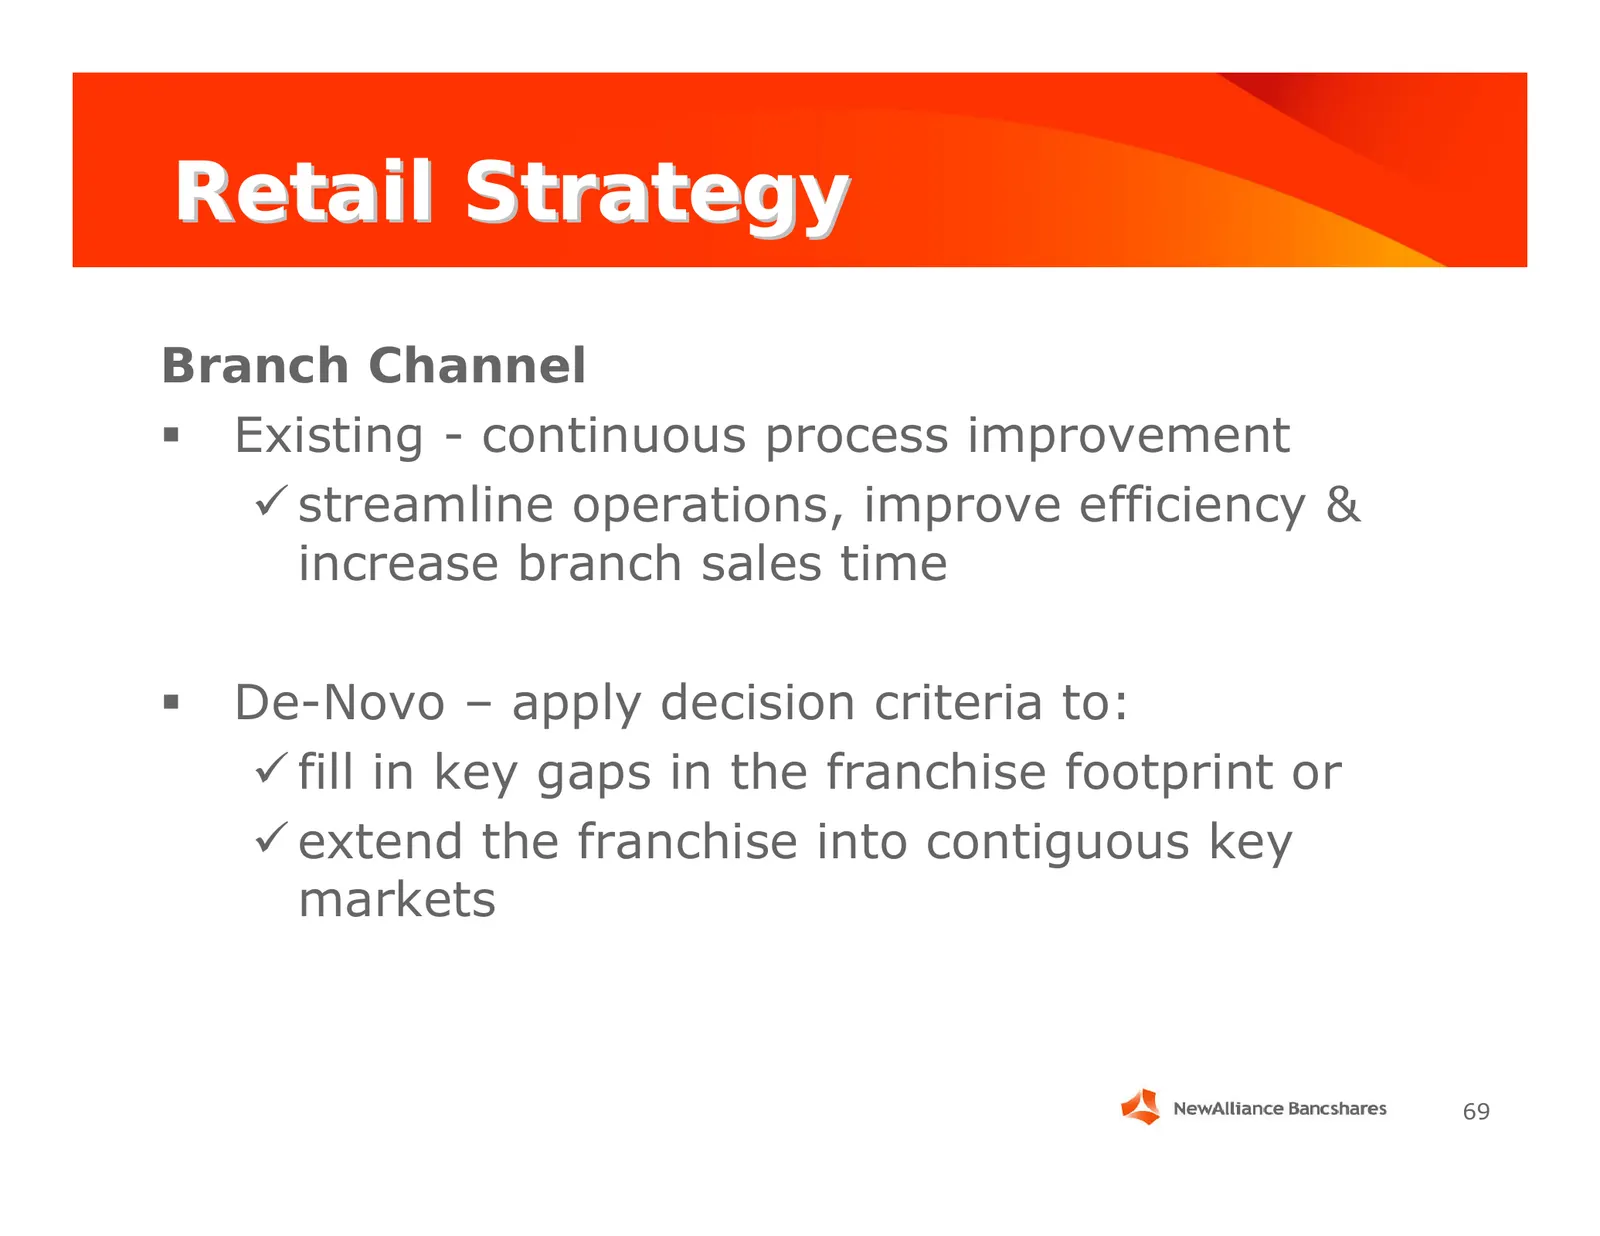
Retail Strategy Branch Channel Existing - continuous process improvement 9 streamline operations, improve efficiency & increase branch sales time De-Novo – apply decision criteria to: 9 fill in key gaps in the franchise footprint or 9 extend the franchise into contiguous key markets 69
Slide 70: Retail Strategy: Electronic Channel
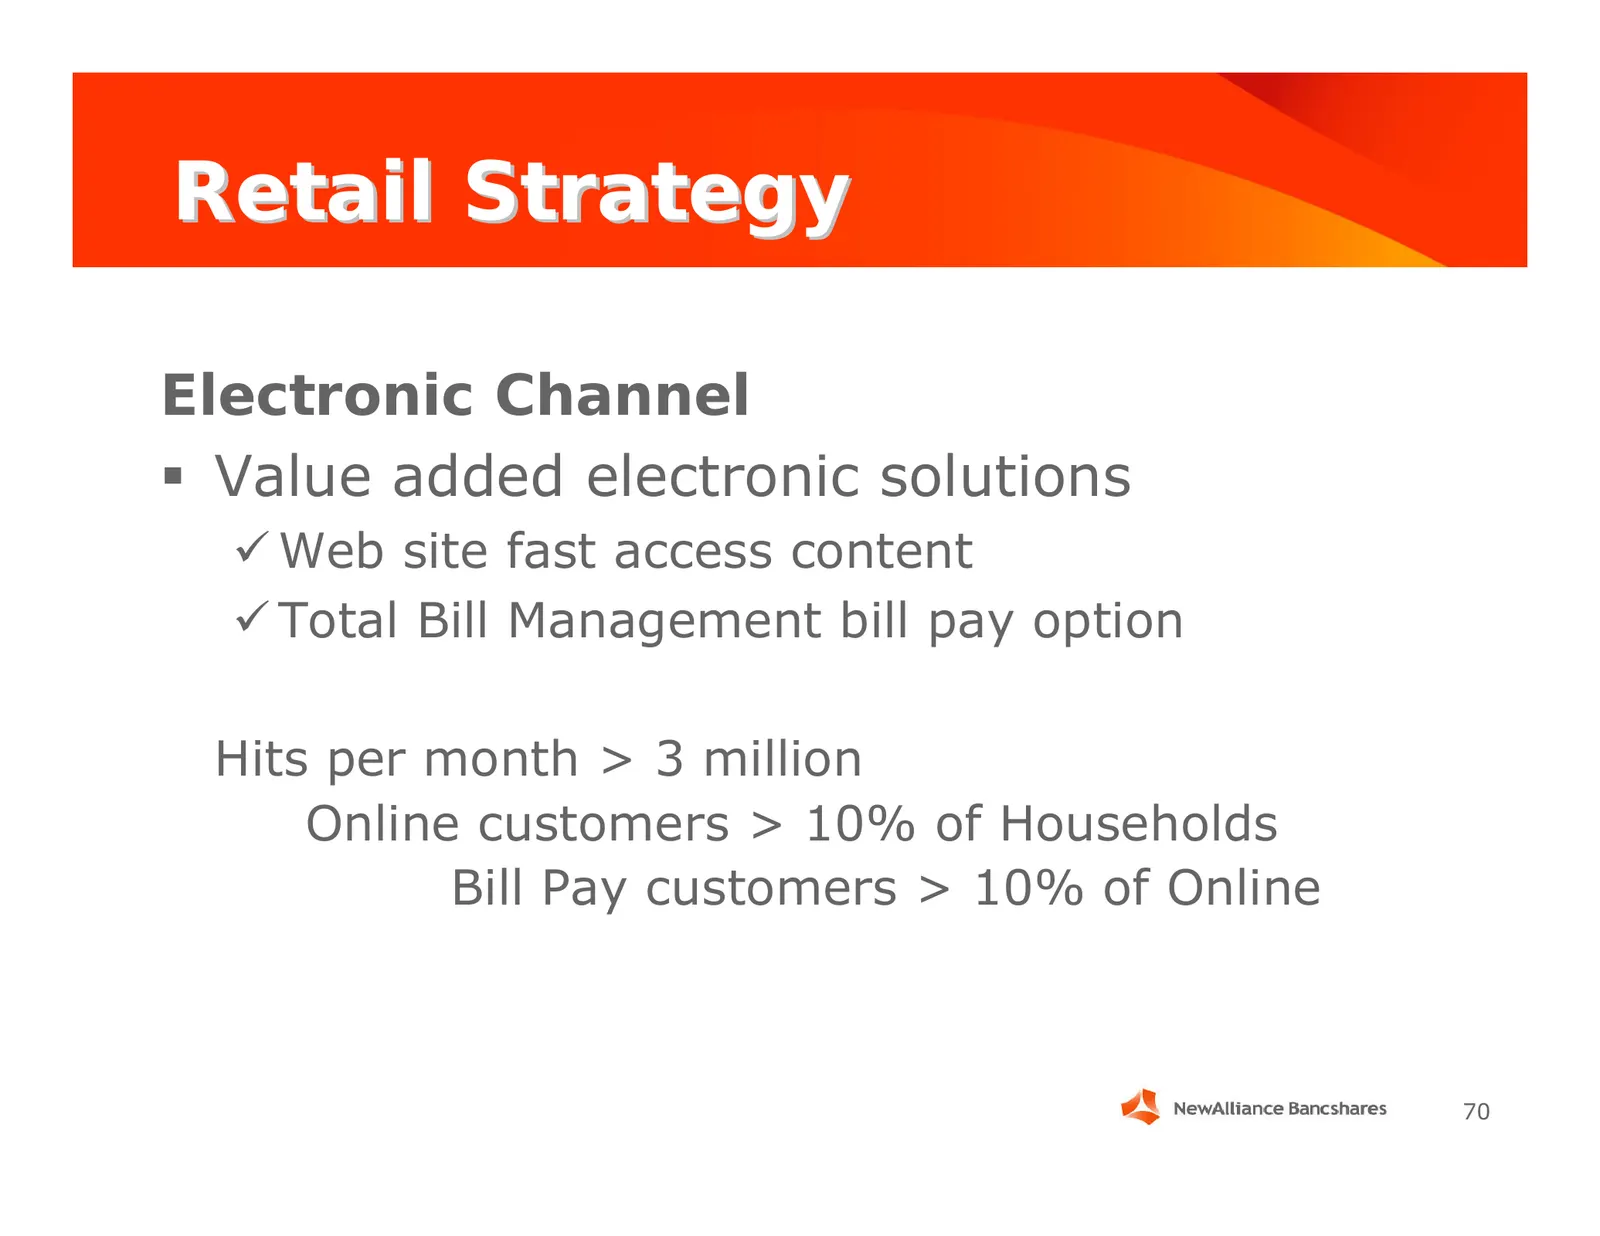
Retail Strategy Electronic Channel Value added electronic solutions 9 Web site fast access content 9 Total Bill Management bill pay option Hits per month > 3 million Online customers > 10% of Households Bill Pay customers > 10% of Online 70
Slide 71: Retail Strategy: Customer Acquisition – Deposits
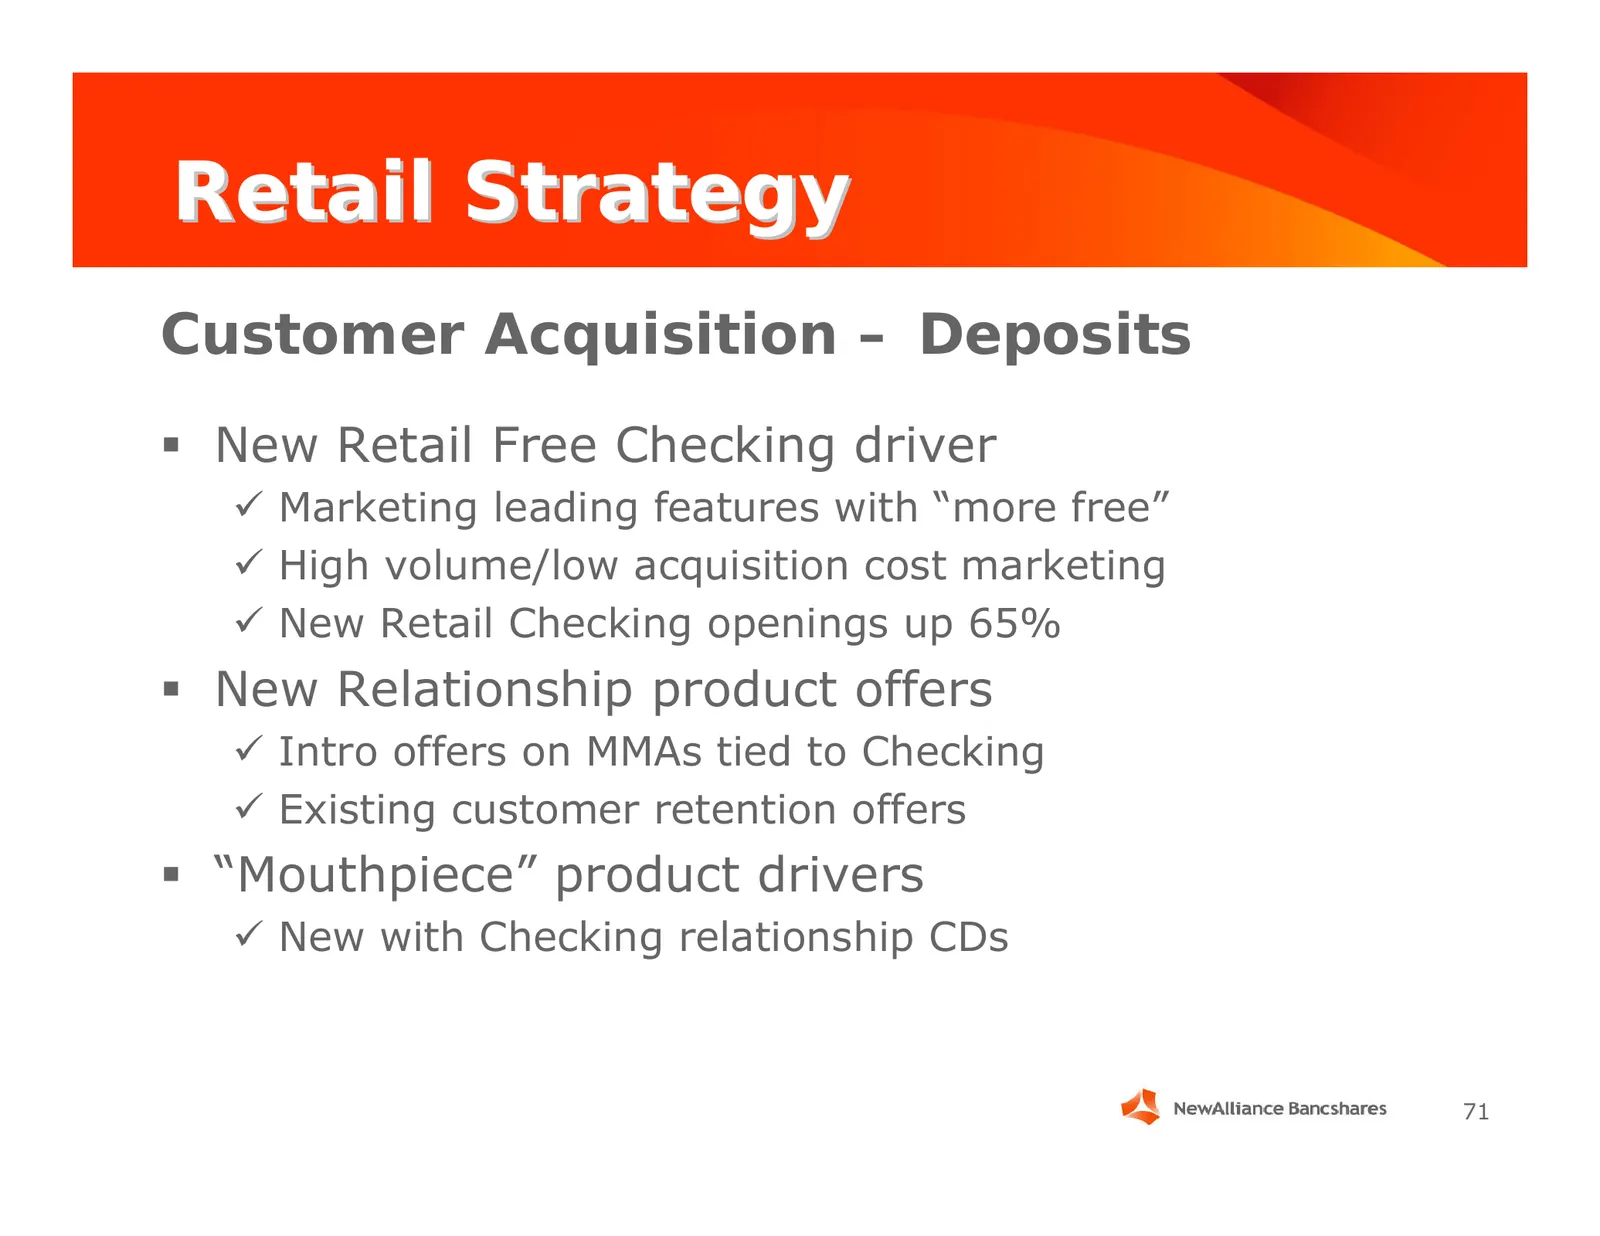
Retail Strategy Customer Acquisition – Deposits New Retail Free Checking driver 9 Marketing leading features with “more free” 9 High volume/low acquisition cost marketing 9 New Retail Checking openings up 65% New Relationship product offers 9 Intro offers on MMAs tied to Checking 9 Existing cust
Slide 72: Retail Strategy: Customer Acquisition – Loans
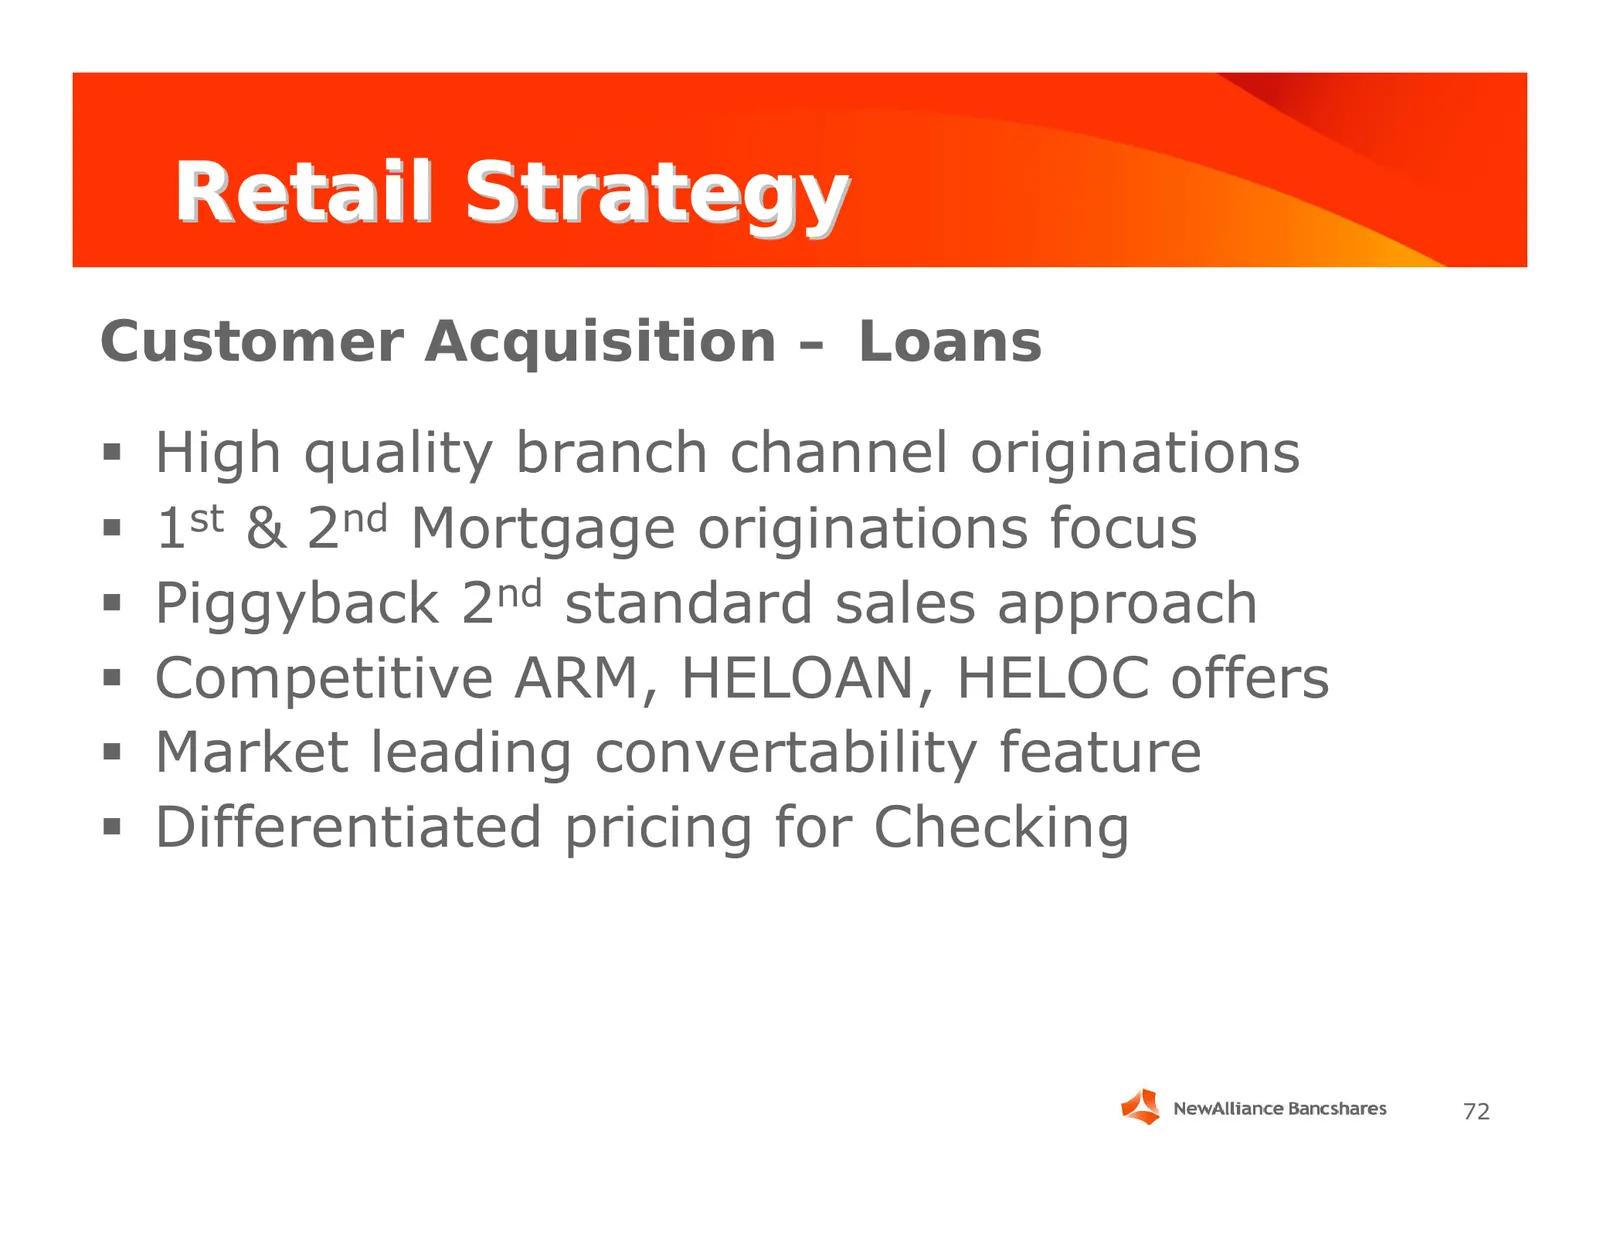
Retail Strategy Customer Acquisition – Loans High quality branch channel originations 1st & 2nd Mortgage originations focus Piggyback 2nd standard sales approach Competitive ARM, HELOAN, HELOC offers Market leading convertability feature Differentiated pricing for Checking 72
Slide 73: Retail Lending Concentration
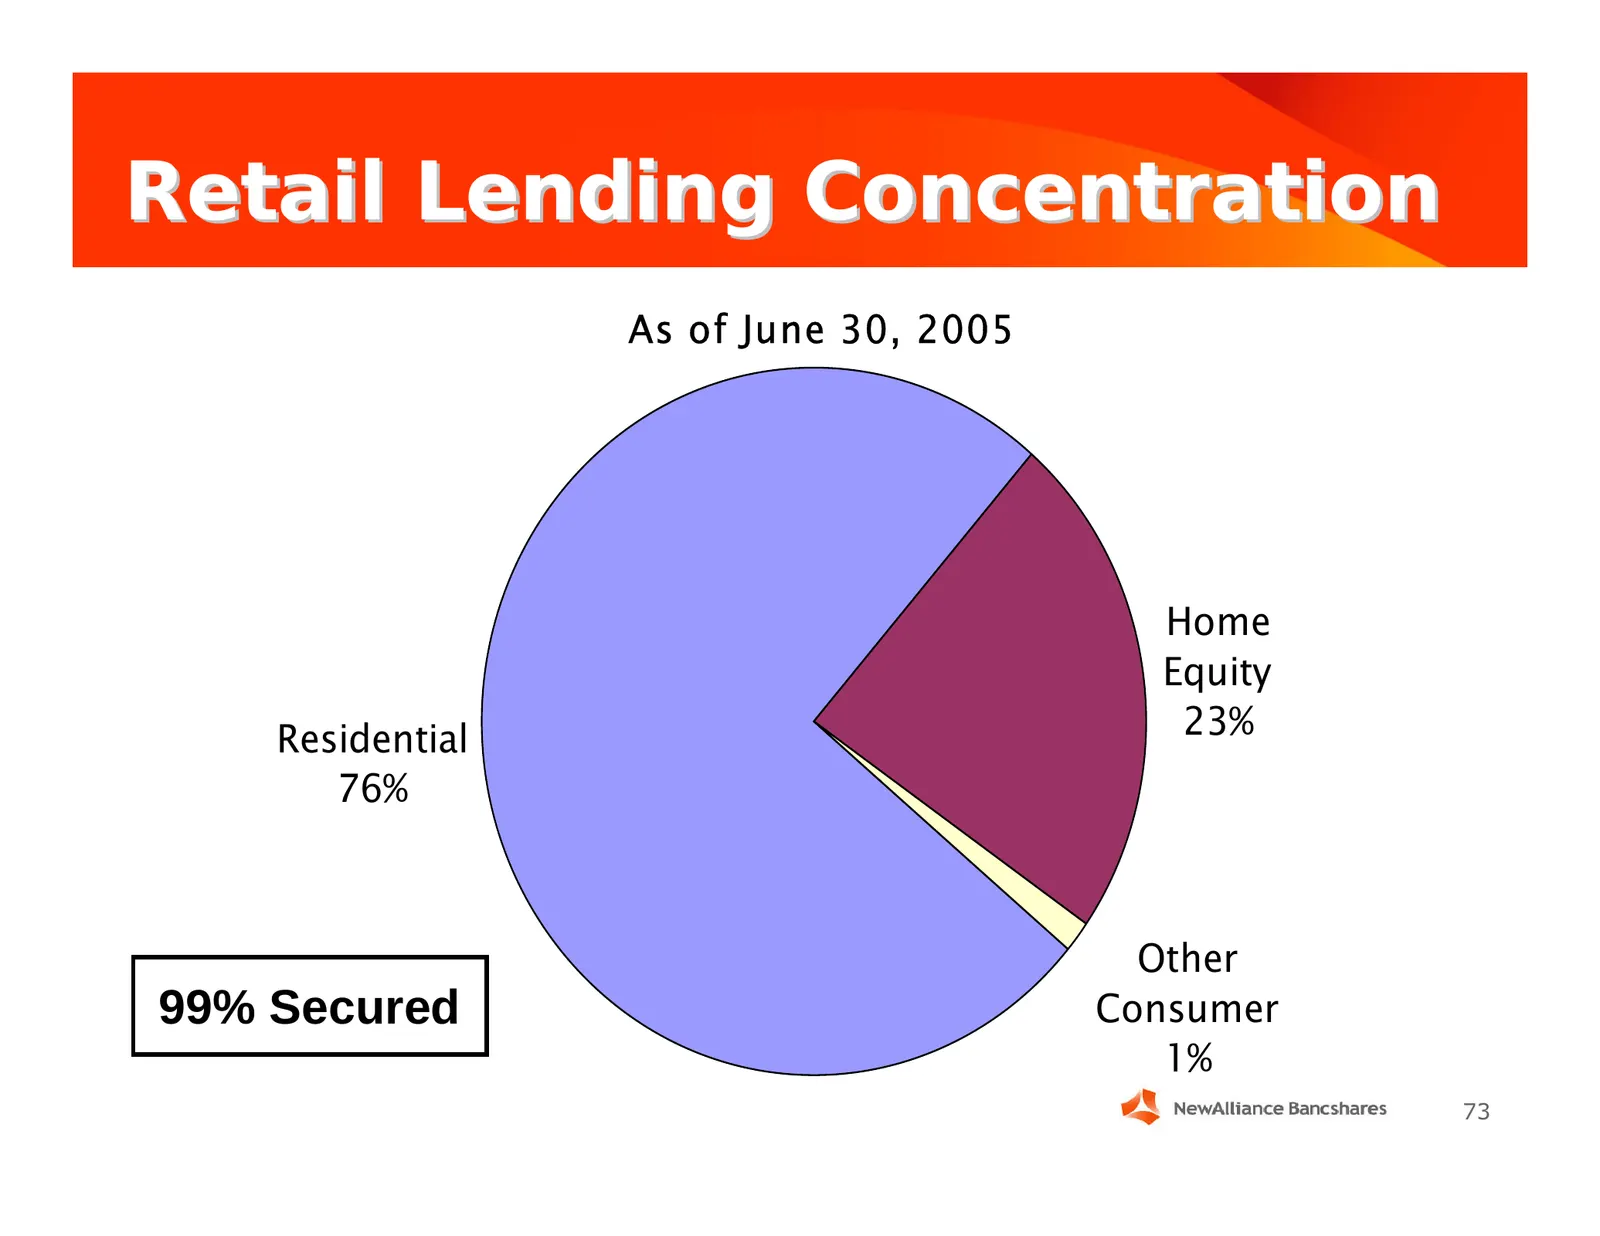
Retail Lending Concentration As of June 30, 2005 Home Equity Residential 23% 76% Other 99% Secured Consumer 1% 73
Slide 74: Sales Culture
Sales Culture Sales Financial needs based sales process Minimum sales standards established Sales per day per banker Needs analysis per day per banker Tele-consulting contacts per day per banker Referrals per week per banker & teller Sales incentives aligned with goals Referral sourc
Slide 75: Marketing Strategy
Marketing Strategy Marketing Product & Marketing aligned to promote: 9 Increasing brand awareness, new customer acquisition & retention, relationship product cross-sale, segment mix, share of wallet 2004 complete NAL Bank re-branding 9 Major TV & radio spots, extensive print media 2005 integra
Slide 76: NAL Advertising
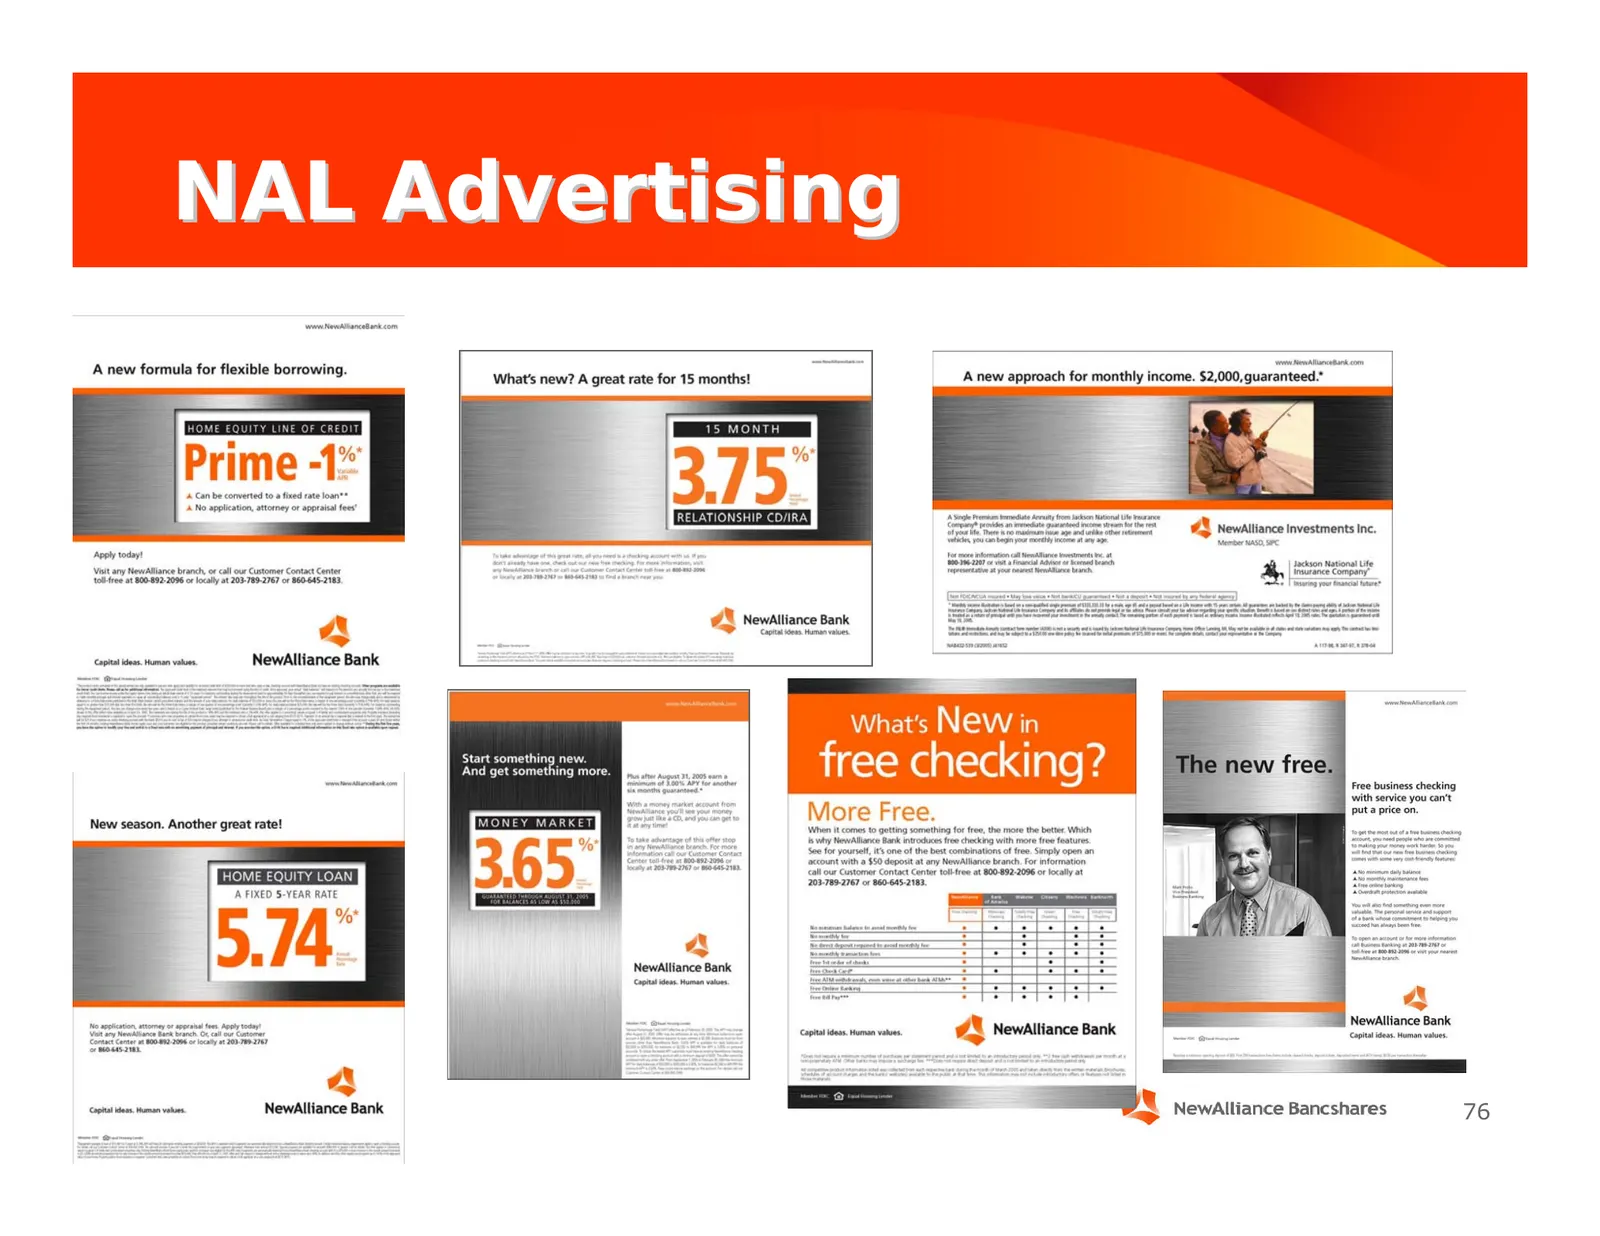
NAL Advertising wor NewAdianeeBank com A new formula for flexible borrowing. vw elancetiank com come. $2,000, guaranteed.” Prime -1% 4 Can be converted to a fixed rate loan** ‘A No application, attorney or appraisal fees’ Sada esa a sy a an sin se Sree eon nren gtcarcivere ten tctn’ —-Q NewAlliance

Slide 77: Competitive Environment
10 MONTH PLUS CD lites opportunity ‘our 7 day locations inside Super Stop & Shop, 8-MONTH CD/CD IRA B WACHOVIA. What they call free checking, we call a good start. We've got so much to offer small businesses. The official bank of pleasant surprises — for business. © crrzens Ravn With Free Business C
Slide 78: Competitive Advantage
Competitive Advantage Advantage: Branch channel depth of experience/customer knowledge Sales culture - total needs based approach Competitive Product Set Creative Brand and Product Integrated Marketing Electronic channel functionality Highly skilled center of expertise support 78
Slide 79: Growth Opportunities
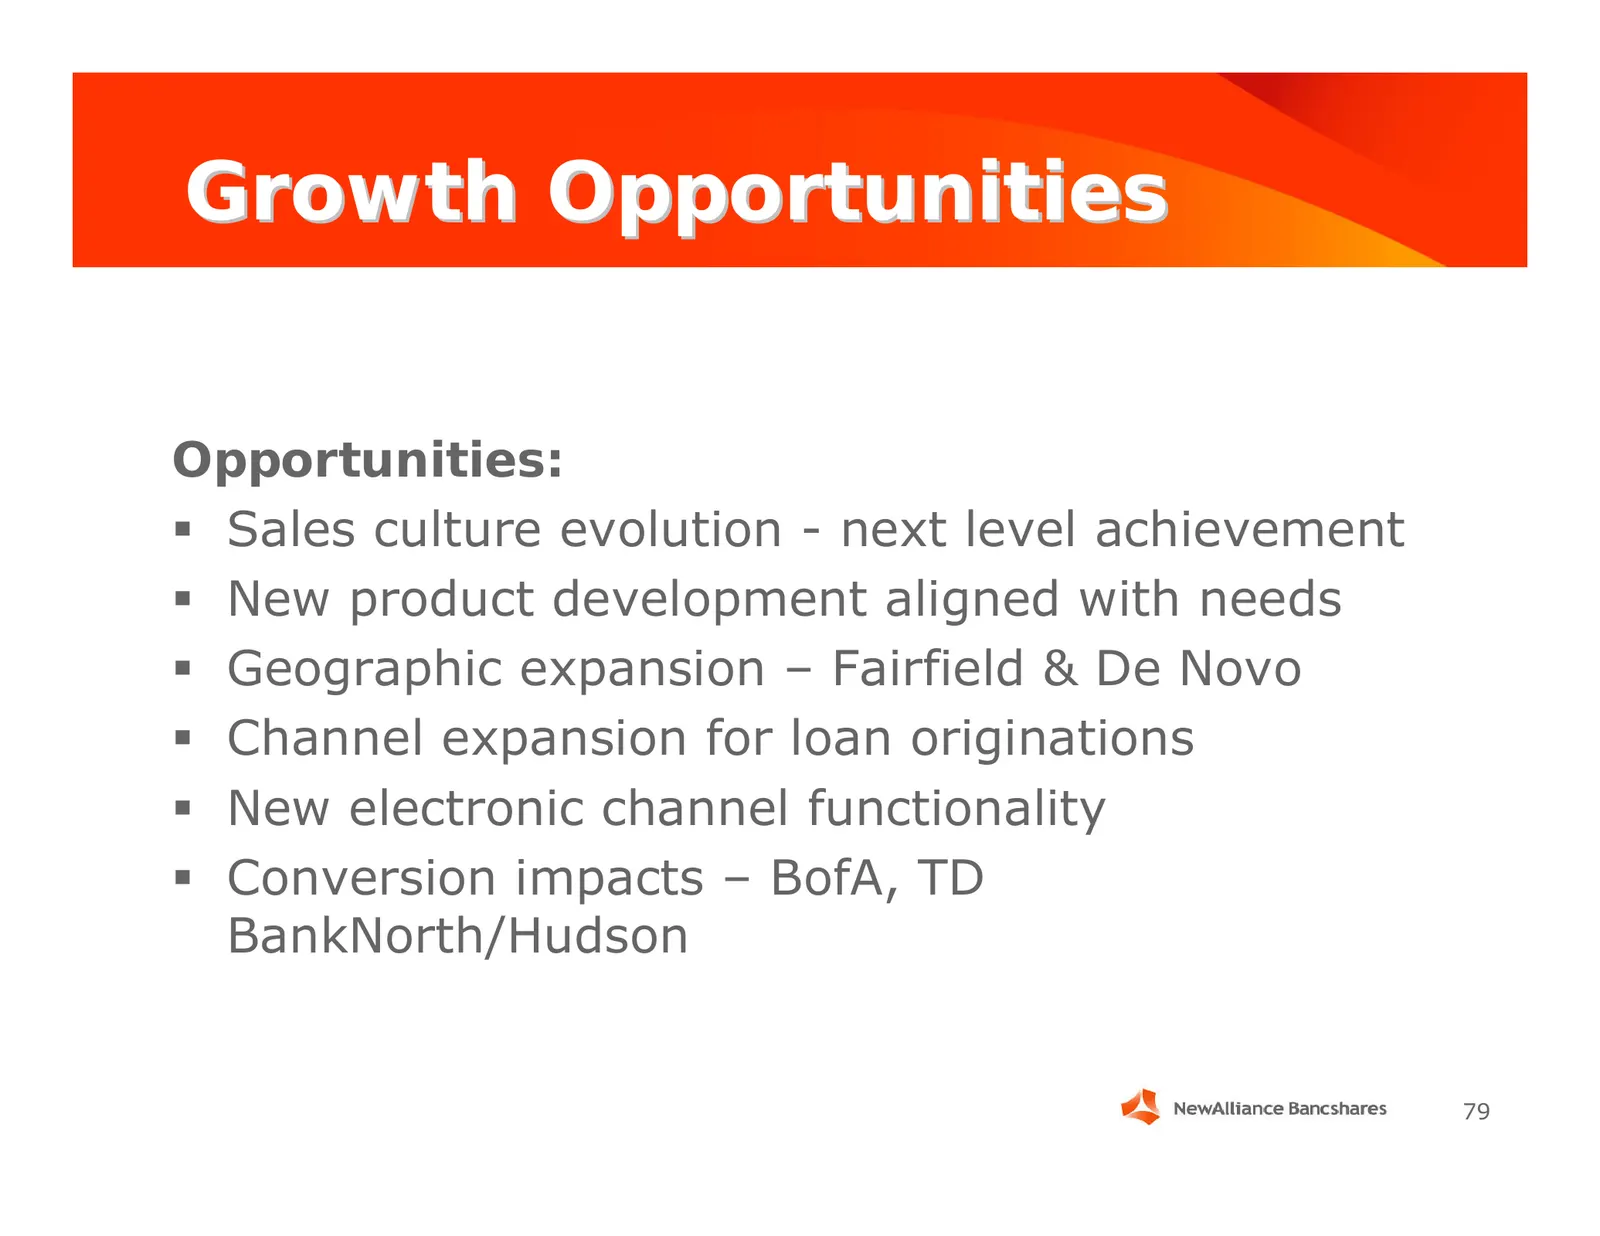
Growth Opportunities Opportunities: Sales culture evolution - next level achievement New product development aligned with needs Geographic expansion – Fairfield & De Novo Channel expansion for loan originations New electronic channel functionality Conversion impacts – BofA, TD BankNorth/

Slide 80: Wealth Management
Wealth Management J. Edward Diamond Executive Vice President, Wealth Management
Slide 81: Market Position
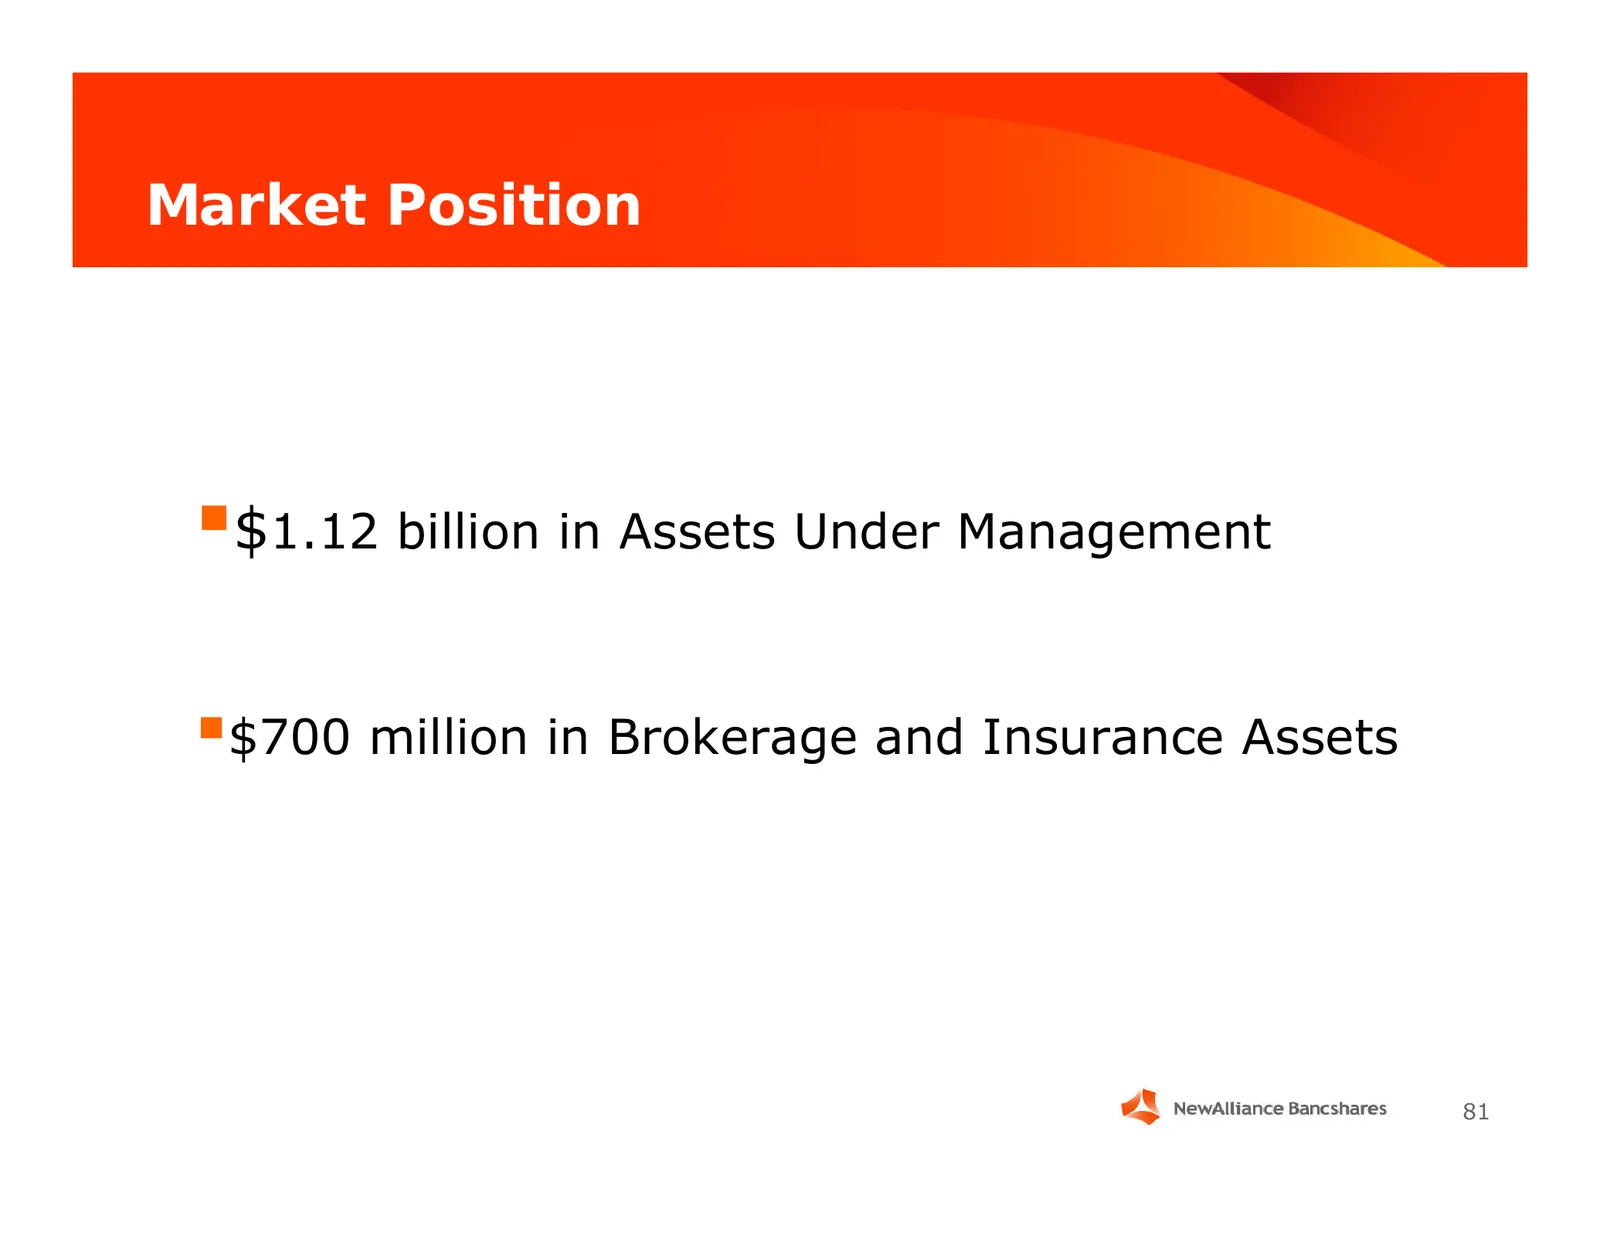
Market Position $1.12 billion in Assets Under Management $700 million in Brokerage and Insurance Assets 81
Slide 82: Trust Company of Connecticut Assets Under Management
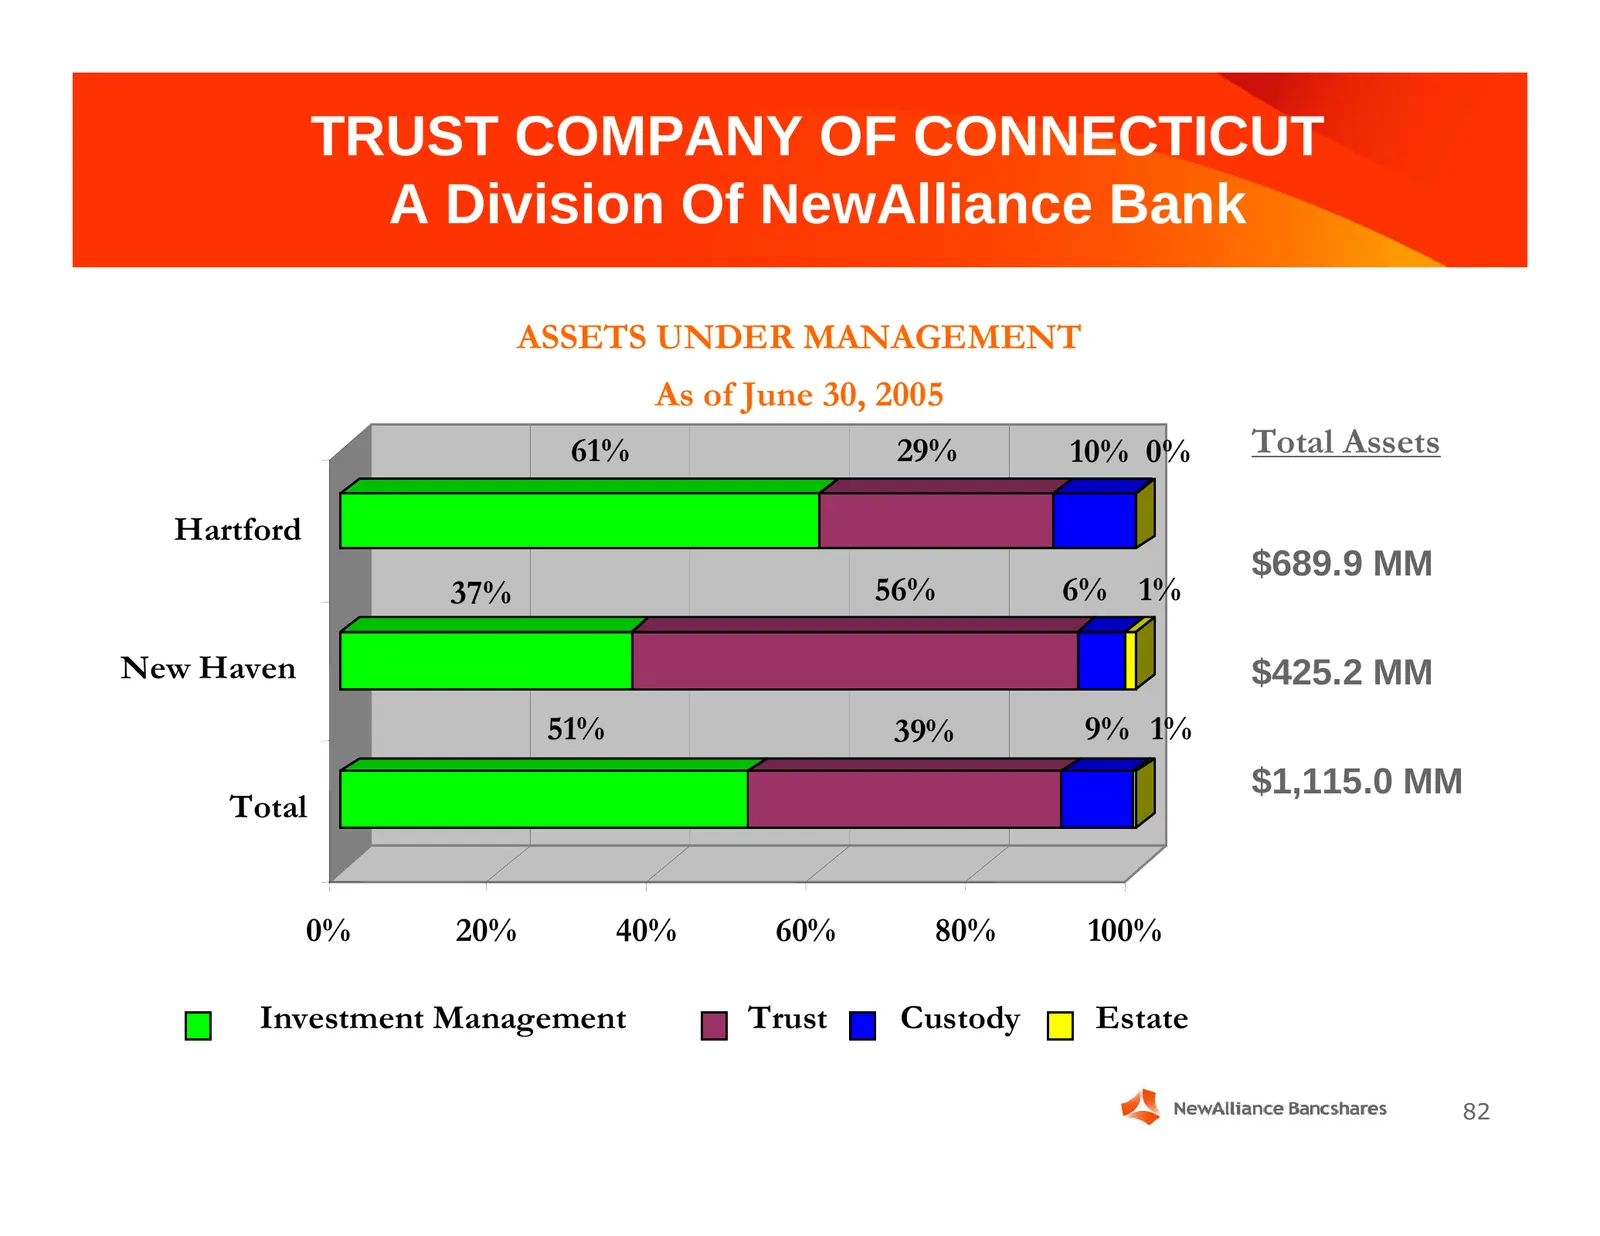
TRUST COMPANY OF CONNECTICUT A Division Of NewAlliance Bank ASSETS UNDER MANAGEMENT As of June 30, 2005 61% 29% 10% 0% Total Assets Hartford $689.9 MM 37% 56% 6% 1% New Haven $425.2 MM 51% 39% 9% 1% $1,115.0 MM Total 0% 20% 40% 60% 80% 100% Investment Management Trust Custody Estate 82
Slide 83: Distinctive Competencies
Distinctive Competencies Service Reputation Financial Strength Local Knowledge 83
Slide 84: Target Segments
Target Segments Wealth Segment Middle market businesses Selected institutions 84
Slide 85: Value Propositions
Value Propositions Personal service Investment depth and discipline Non-biased advice 85
Slide 86: Distribution Strategy
Distribution Strategy Relationship Managers with portfolio responsibility Dedicated Financial Consultants Increased reach in consumer banking Revenue sharing and variable compensation 86
Slide 87: Key Performance Measurements
Key Performance Measurements Asset growth Revenue growth Profit rate Client satisfaction 87
Slide 88: Sources of Growth
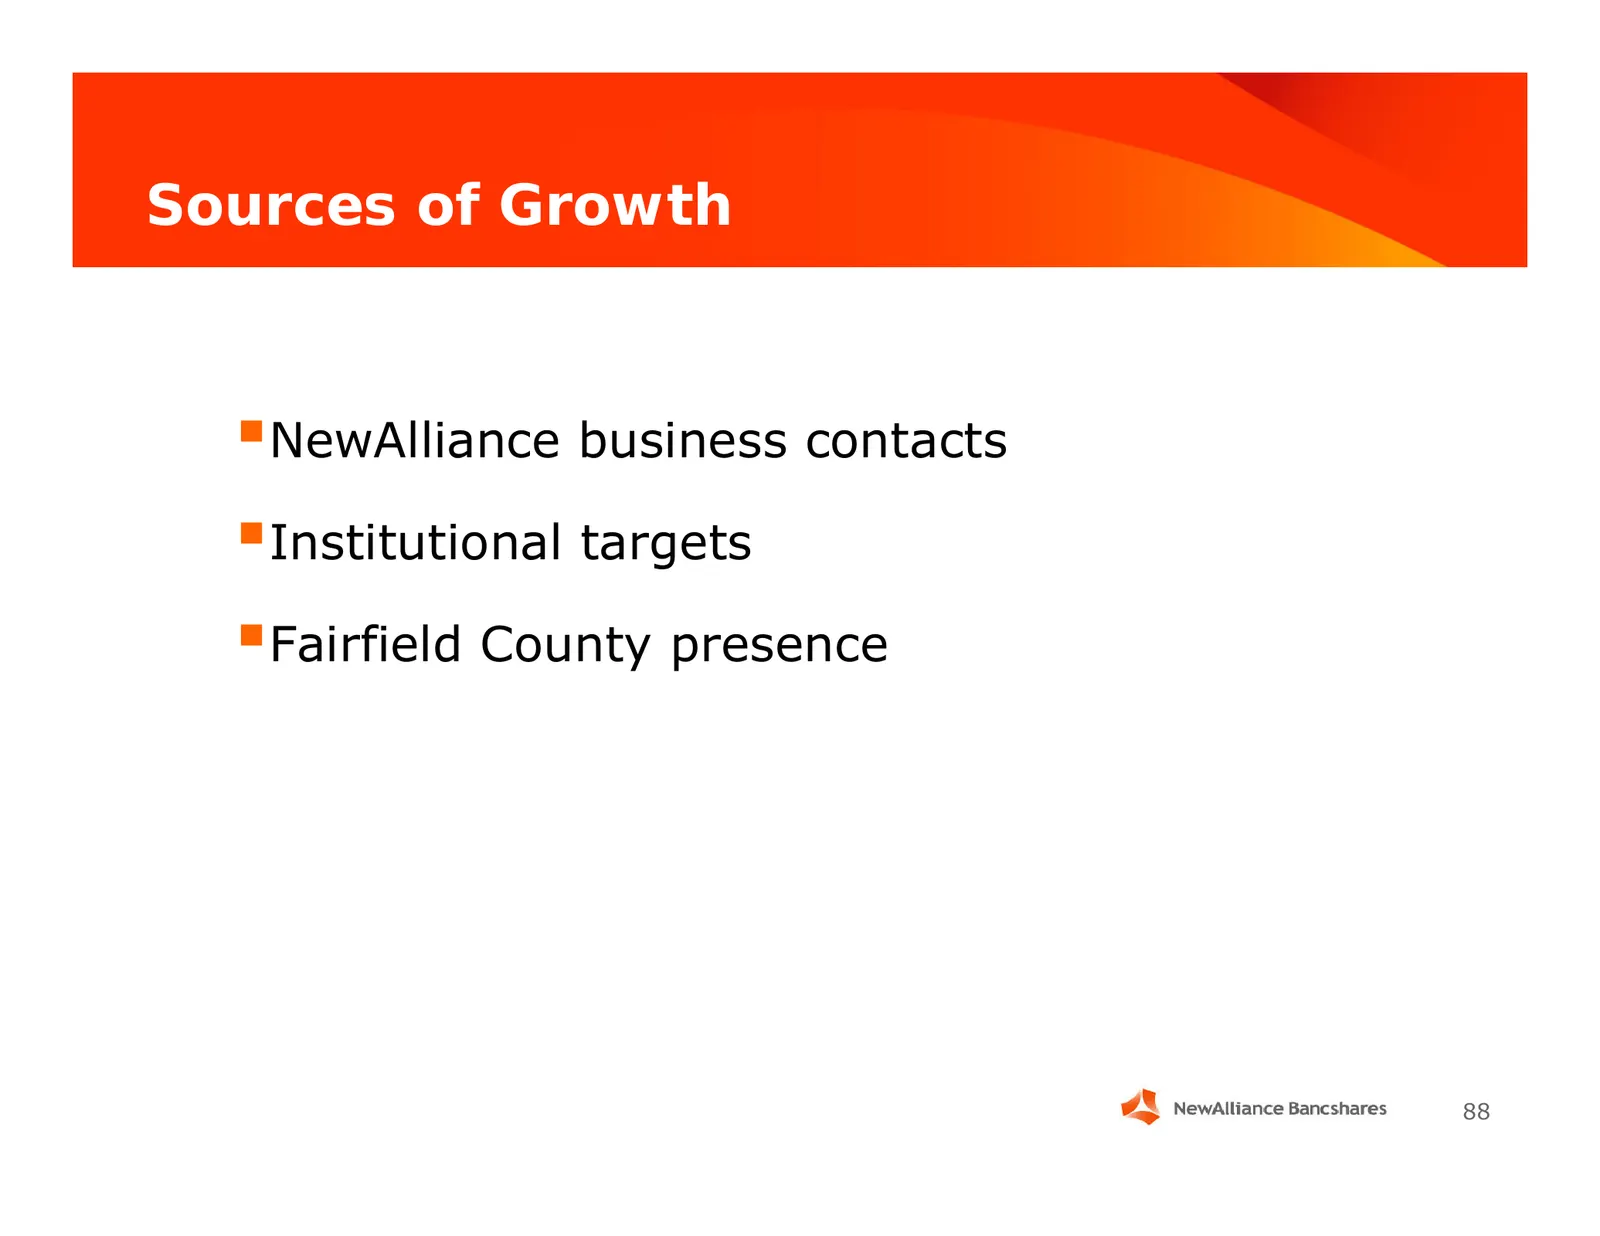
Sources of Growth NewAlliance business contacts Institutional targets Fairfield County presence 88

Slide 89: Capital ideas. Human values.
Capital ideas. Human values.
Source: SEC EDGAR · 8-K filed Aug 5, 2005
More decks from Newalliance Bancshares Inc
 Merger or Acquisition (November 2010)45 slides · Nov 18, 2010
 Stifel, Nicolaus & Company, Inc. Bank and Thrift Conference 201037 slides · Nov 3, 2010
 Merger or Acquisition (August 2010)25 slides · Aug 25, 2010
 Merger or Acquisition (August 2010)24 slides · Aug 19, 2010
 Merger or Acquisition (August 2010)23 slides · Aug 19, 2010
 Q2 2010 Earnings Presentation31 slides · Jul 28, 2010