Extended Stay America — Q1 2020 Earnings Presentation
15 slides from Extended Stay America's earnings presentation, May 6, 2020

Slide 1: Q1 2020 Earnings Summary
Q1 2020 Earnings Summary May 6, 2020 Extended Stay America, Inc. ESH Hospitality, Inc.
Slide 2: Important Disclosure Information
important disclosure information This presentation contains forward-looking statements within the meaning of the federal securities laws. These statements include, but are not limited to, statements related to our expectations regarding our business performance, business strategies, financial result
Slide 3: Q1 2020 Operating Results and Financial Highlights
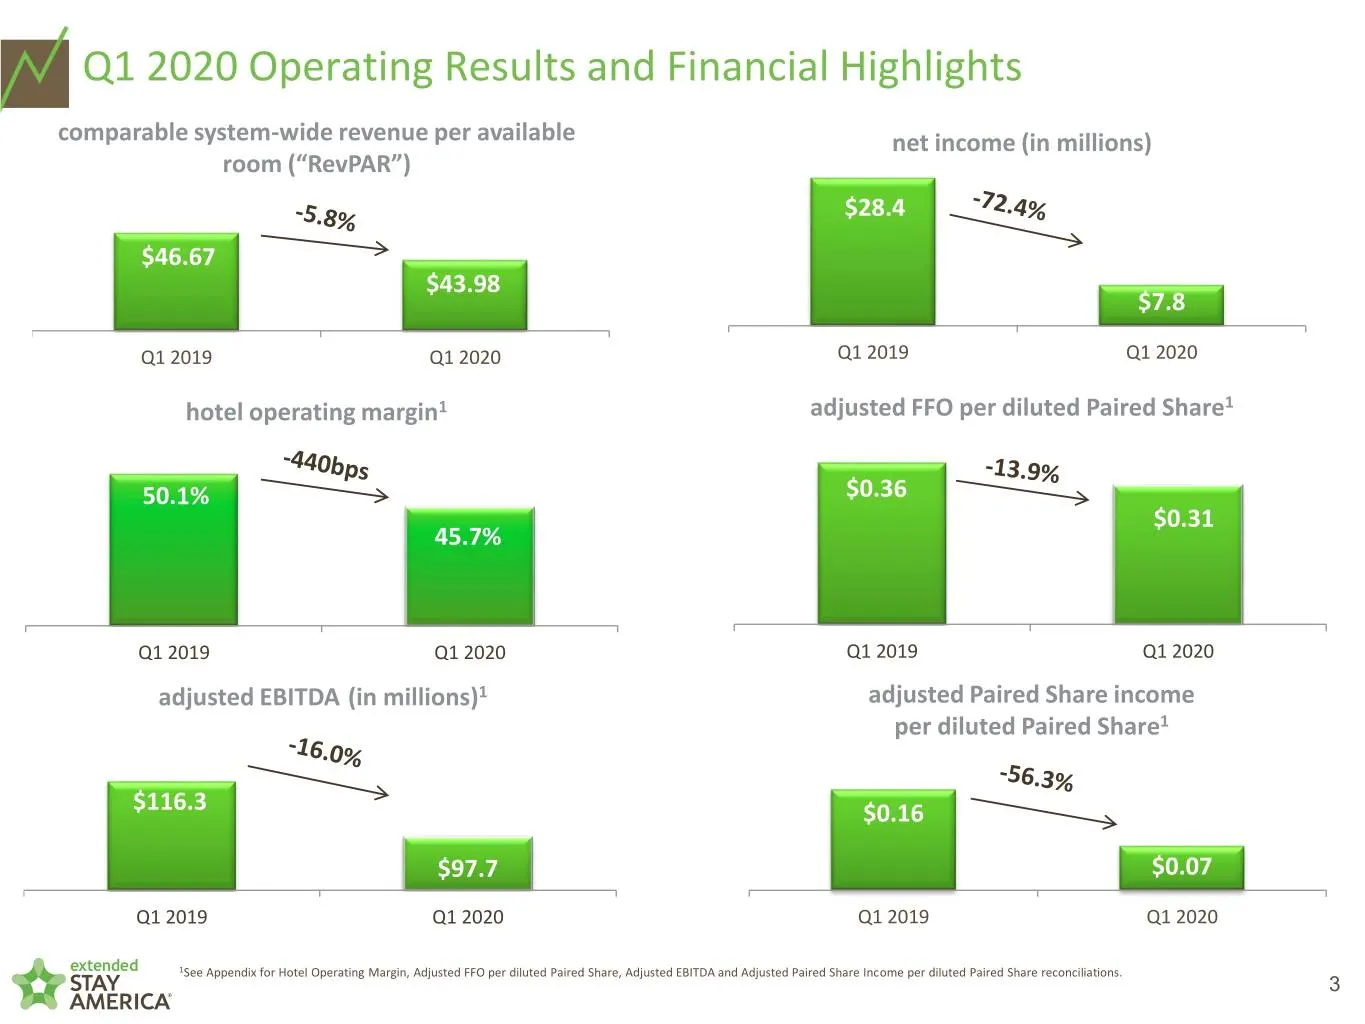
Q1 2020 Operating Results and Financial Highlights comparable system-wide revenue per available net income (in millions) room (“RevPAR”) $28.4 $46.67 $43.98 $7.8 Q1 2019 Q1 2020 Q1 2019 Q1 2020 hotel operating margin1 adjusted FFO per diluted Paired Share1 50.1% $0.36 $0.31 45.7% Q1 2019 Q1 2020 Q1
Slide 4: Outperforming industry, competitive set
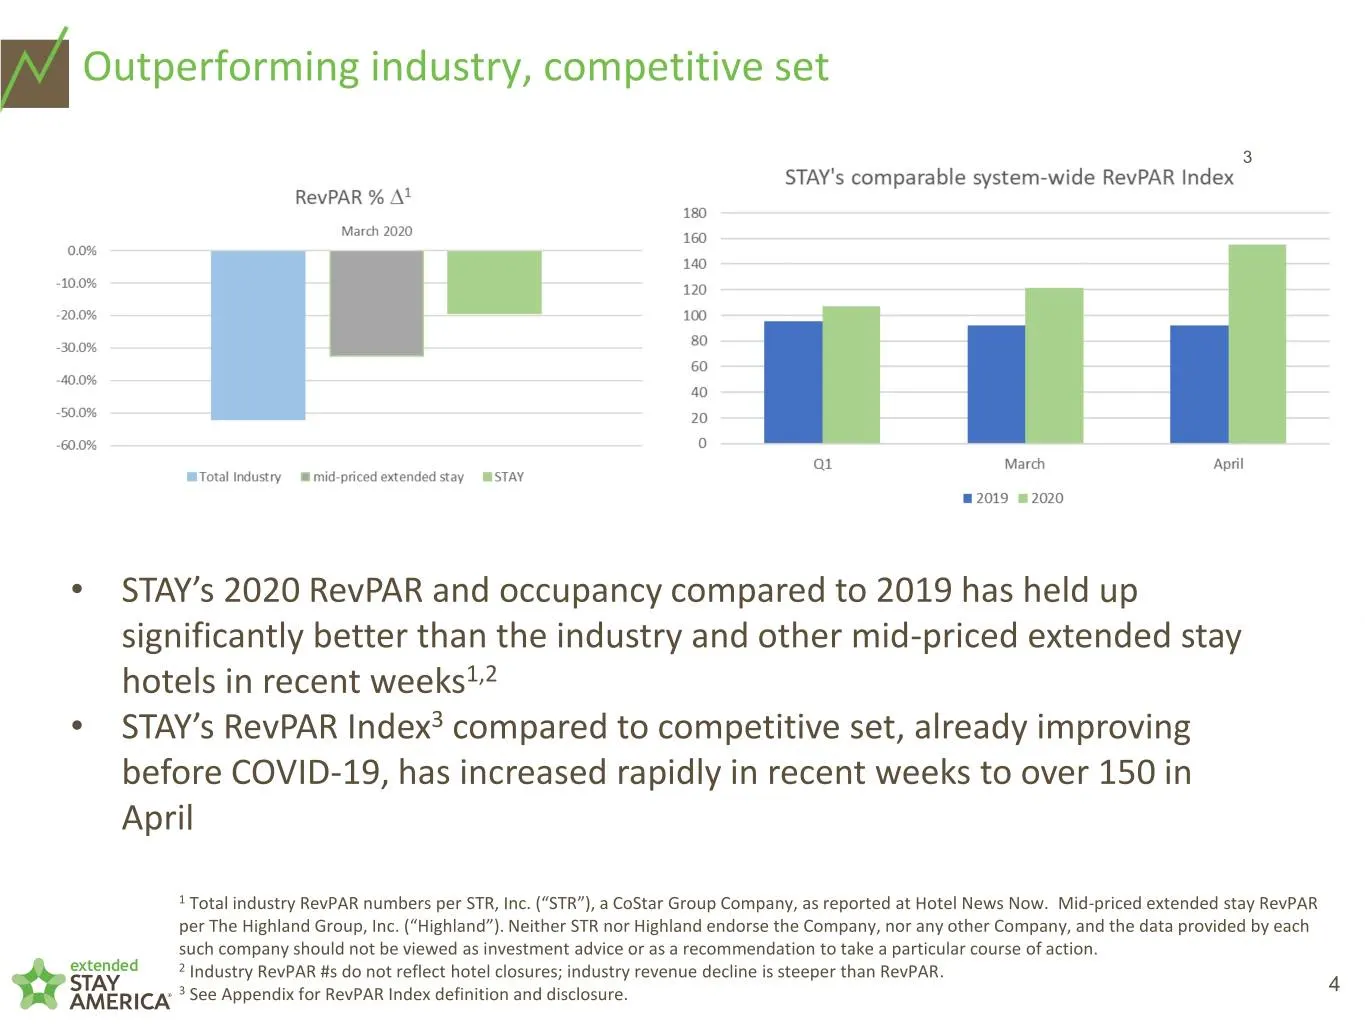
Outperforming industry, competitive set 3 • STAY’s 2020 RevPAR and occupancy compared to 2019 has held up significantly better than the industry and other mid-priced extended stay hotels in recent weeks1,2 • STAY’s RevPAR Index3 compared to competitive set, already improving before COVID-19, has inc
Slide 5: Well positioned in a challenging environment
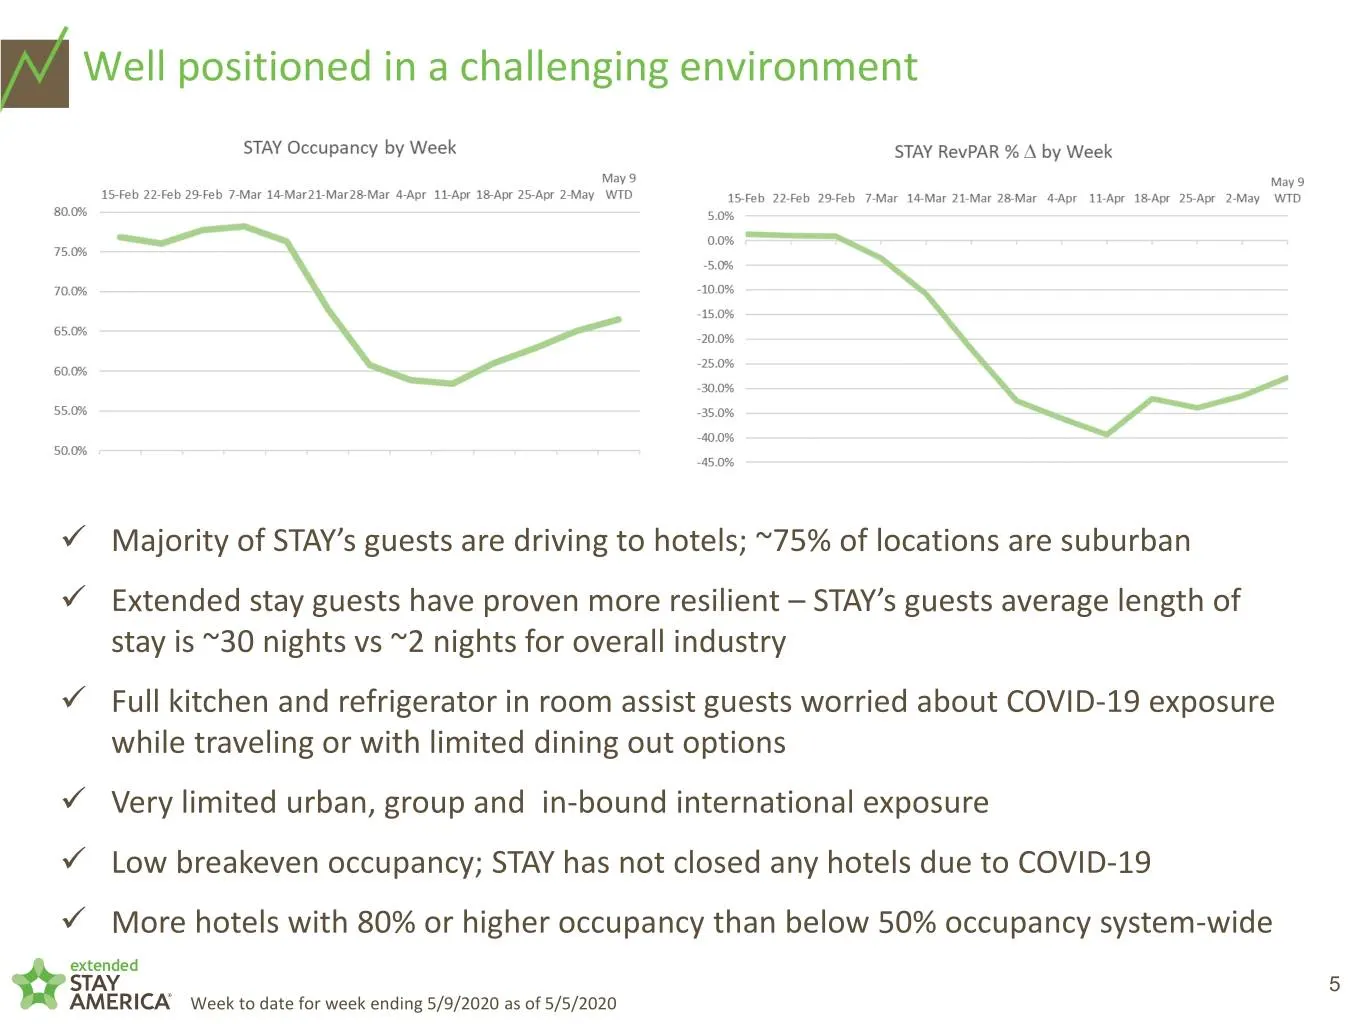
Well positioned in a challenging environment ✓ Majority of STAY’s guests are driving to hotels; ~75% of locations are suburban ✓ Extended stay guests have proven more resilient – STAY’s guests average length of stay is ~30 nights vs ~2 nights for overall industry ✓ Full kitchen and refrigerator in r
Slide 6: ESA's COVID-19 Action and Response Plans
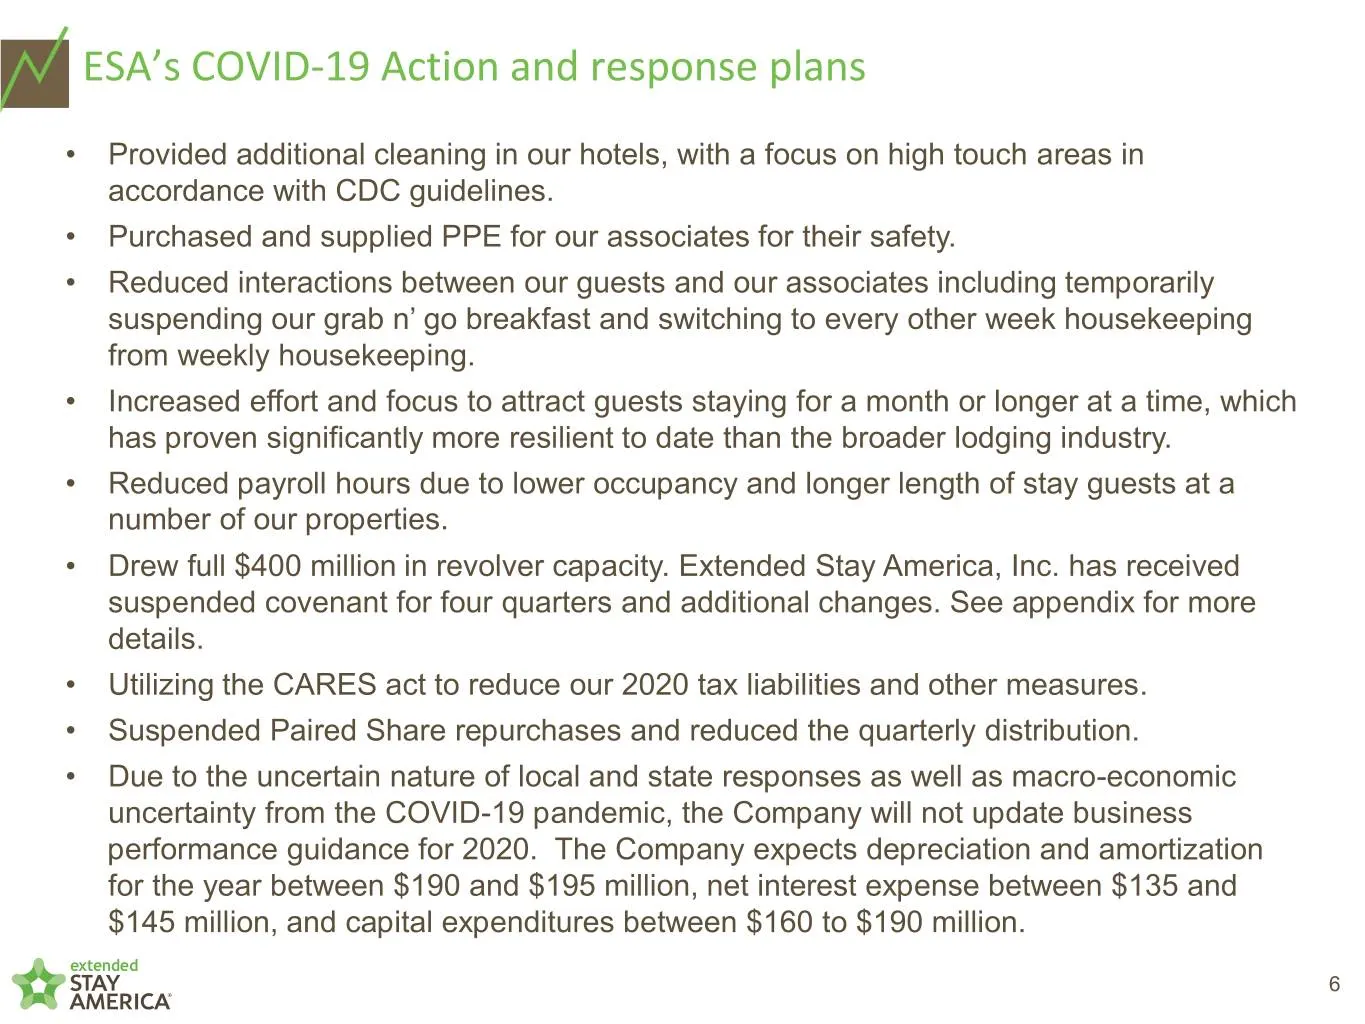
ESA’s COVID-19 Action and response plans • Provided additional cleaning in our hotels, with a focus on high touch areas in accordance with CDC guidelines. • Purchased and supplied PPE for our associates for their safety. • Reduced interactions between our guests and our associates including temporar
Slide 7: Balance Sheet Update as of March 31, 2020
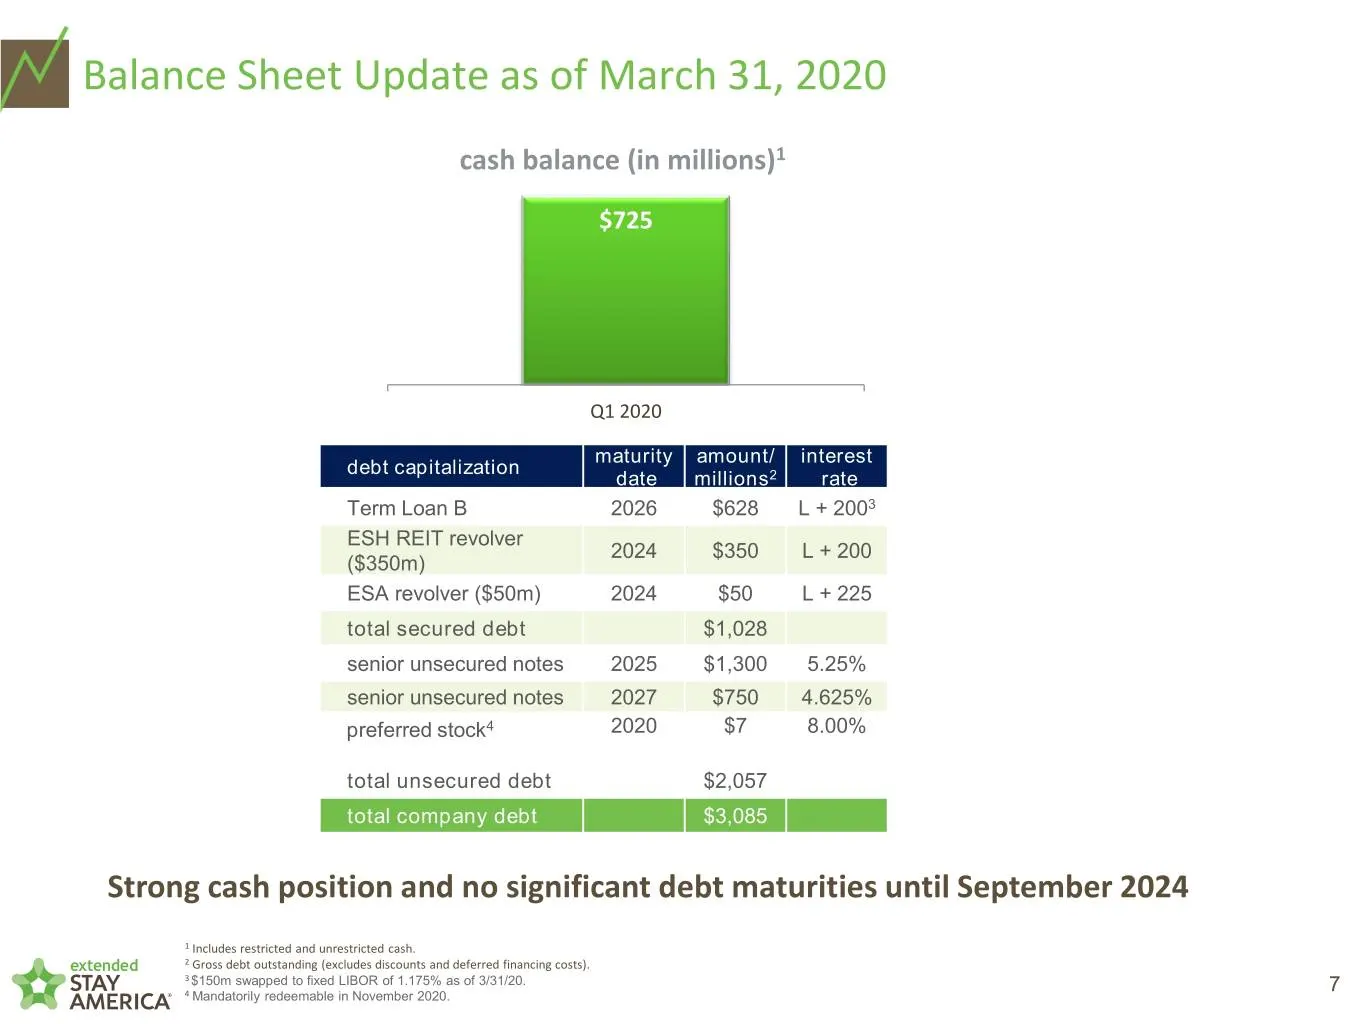
Balance Sheet Update as of March 31, 2020 cash balance (in millions)1 $725 Q1 2020 maturity amount/ interest debt capitalization date millions2 rate Term Loan B 2026 $628 L + 2003 ESH REIT revolver 2024 $350 L + 200 ($350m) ESA revolver ($50m) 2024 $50 L + 225 total secured debt $1,028 senior unsecu
Slide 8: Pipeline Update
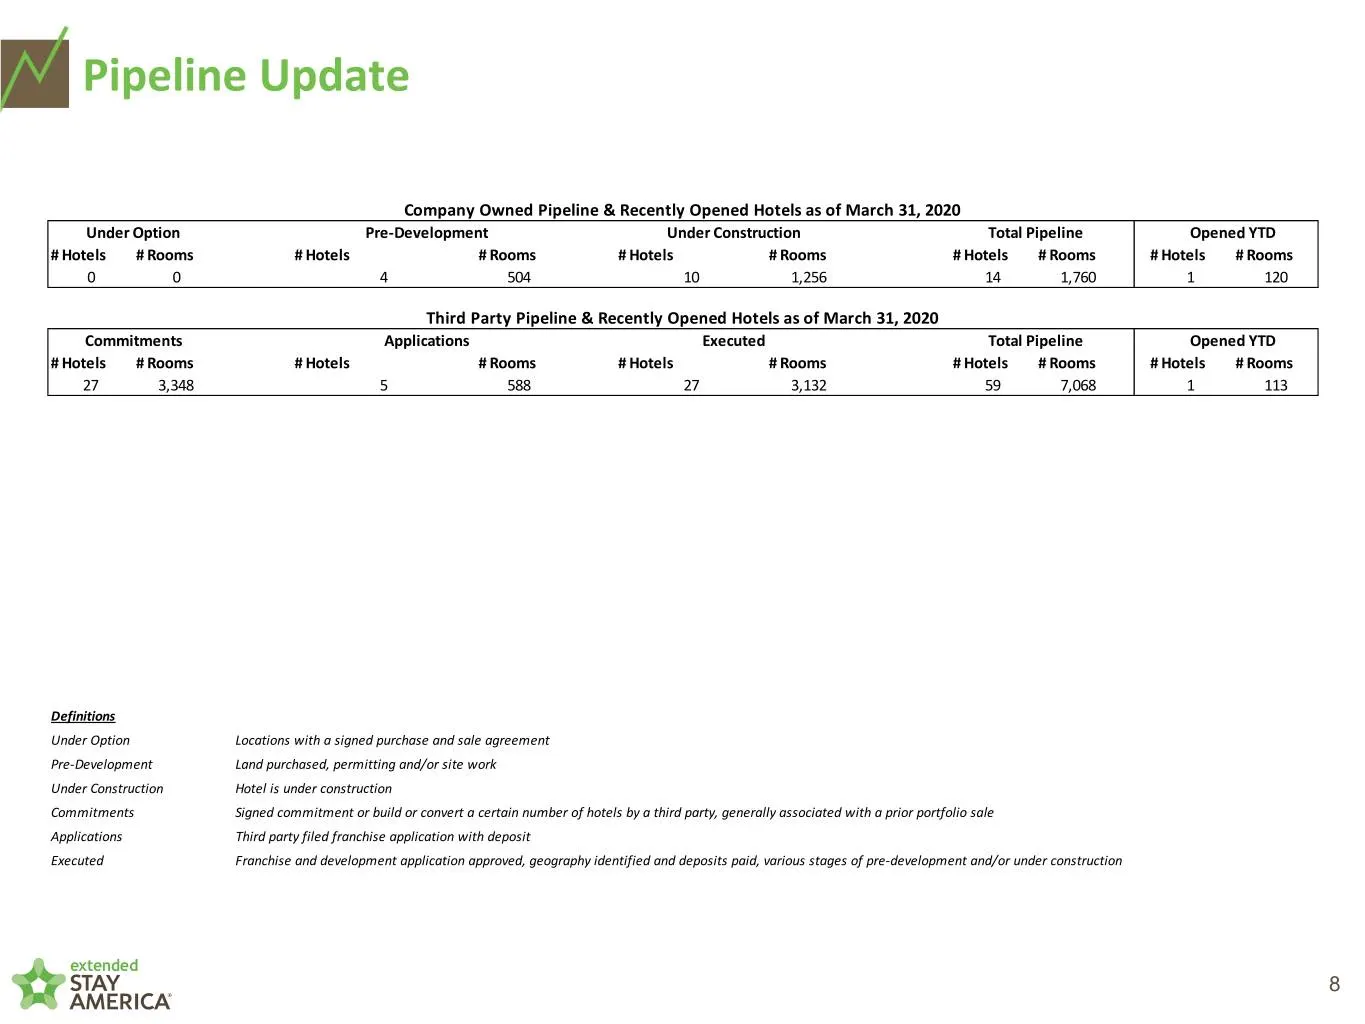
Pipeline Update Company Owned Pipeline & Recently Opened Hotels as of March 31, 2020 Under Option Pre-Development Under Construction Total Pipeline Opened YTD # Hotels # Rooms # Hotels # Rooms # Hotels # Rooms # Hotels # Rooms # Hotels # Rooms 0 0 4 504 10 1,256 14 1,760 1 120 Third Party Pipeline &

Slide 9: Appendix
appendix
Slide 10: RevPAR Index
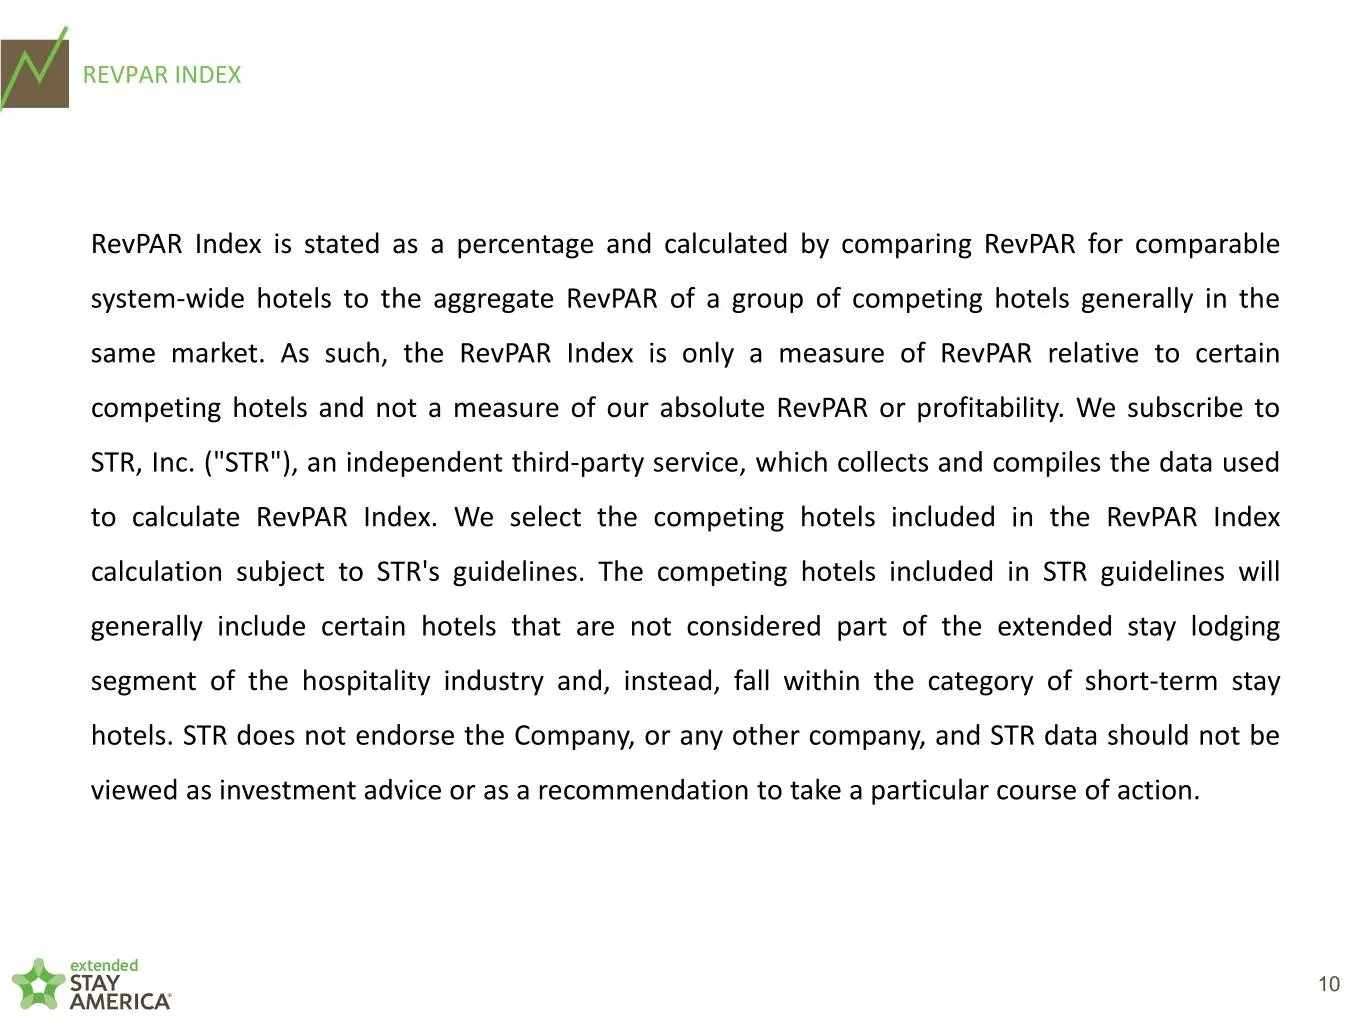
REVPAR INDEX RevPAR Index is stated as a percentage and calculated by comparing RevPAR for comparable system-wide hotels to the aggregate RevPAR of a group of competing hotels generally in the same market. As such, the RevPAR Index is only a measure of RevPAR relative to certain competing hotels and
Slide 11: Corporation Revolver Update
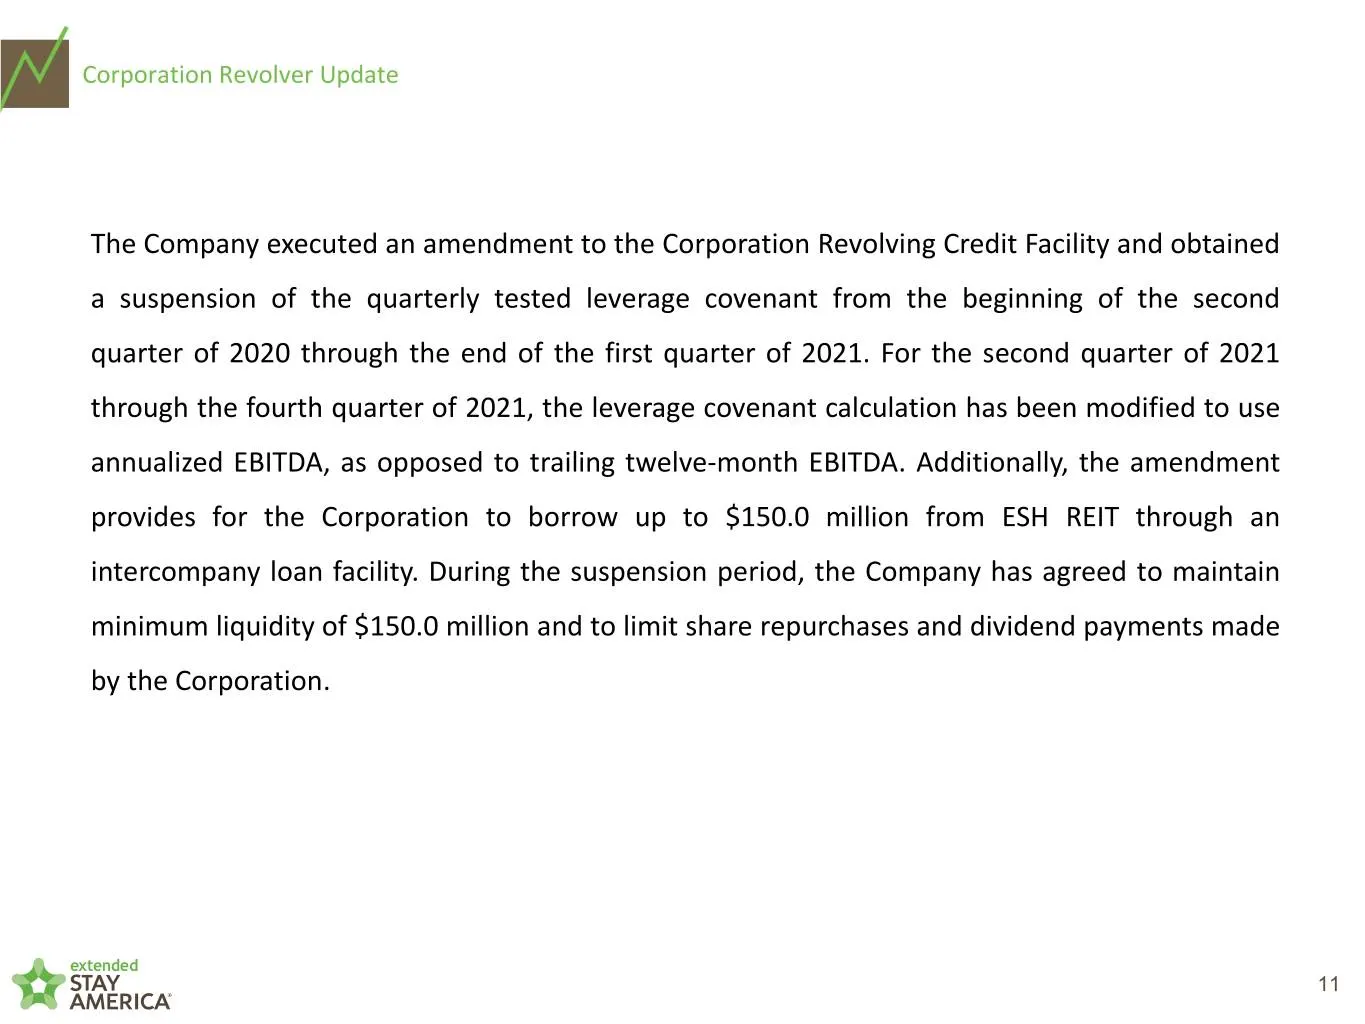
Corporation Revolver Update The Company executed an amendment to the Corporation Revolving Credit Facility and obtained a suspension of the quarterly tested leverage covenant from the beginning of the second quarter of 2020 through the end of the first quarter of 2021. For the second quarter of 2021
Slide 12: Non-GAAP Reconciliation of Net Income to Hotel Operating Profit and Margin
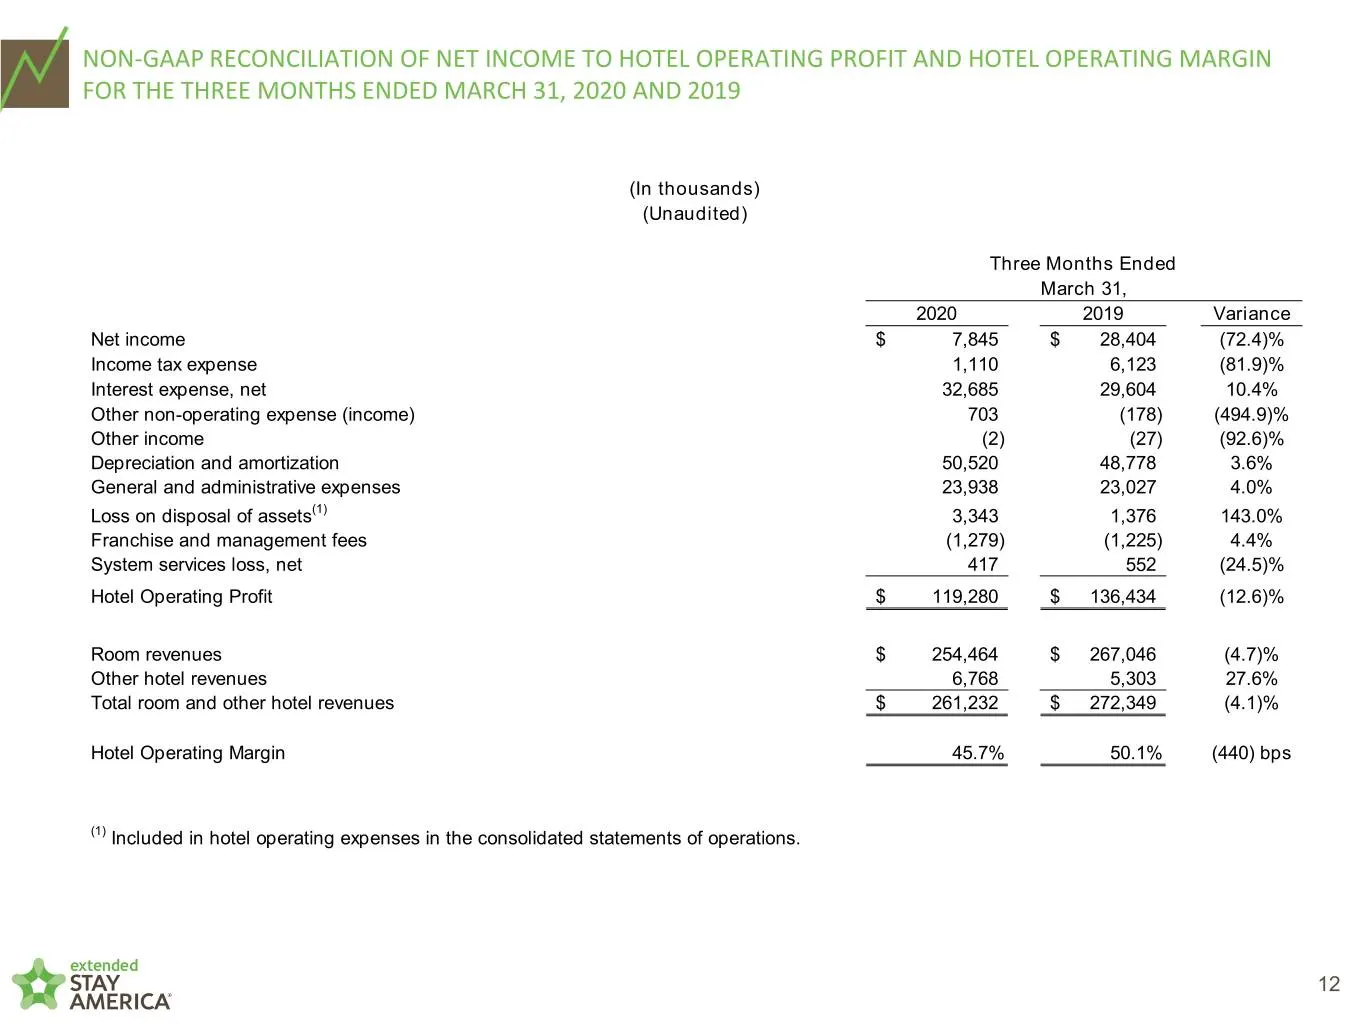
NON-GAAP RECONCILIATION OF NET INCOME TO HOTEL OPERATING PROFIT AND HOTEL OPERATING MARGIN FOR THE THREE MONTHS ENDED MARCH 31, 2020 AND 2019 (In thousands) (Unaudited) Three Months Ended March 31, 2020 2019 Variance Net income $ 7,845 $ 28,404 (72.4)% Income tax expense 1,110 6,123 (81.9)% Interest
Slide 13: Non-GAAP Reconciliation of Net Income to EBITDA and Adjusted EBITDA
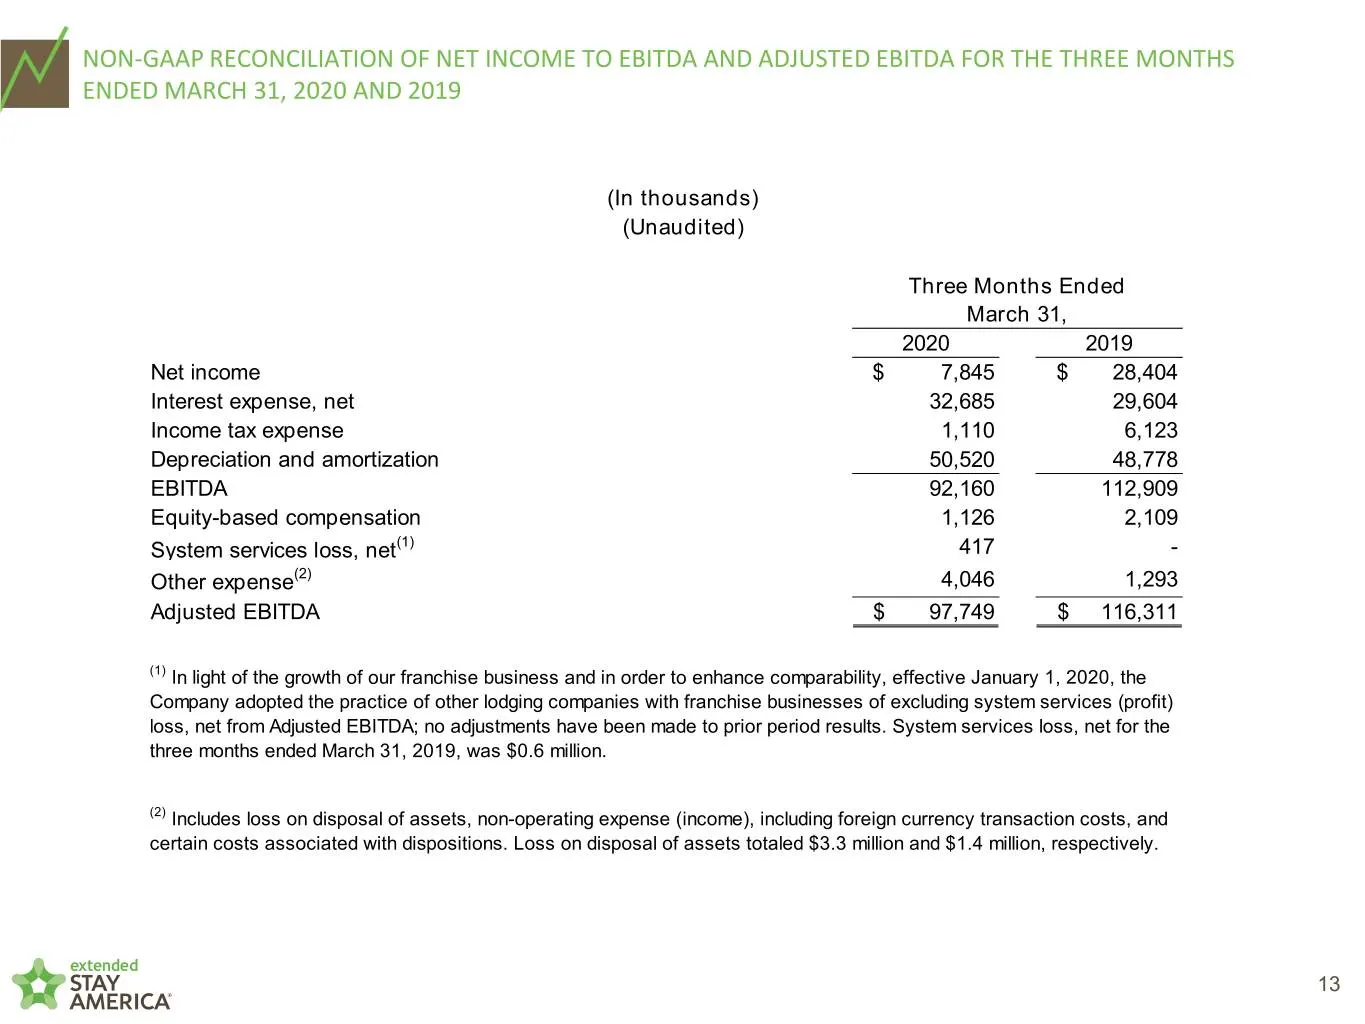
NON-GAAP RECONCILIATION OF NET INCOME TO EBITDA AND ADJUSTED EBITDA FOR THE THREE MONTHS ENDED MARCH 31, 2020 AND 2019 (In thousands) (Unaudited) Three Months Ended March 31, 2020 2019 Net income $ 7,845 $ 28,404 Interest expense, net 32,685 29,604 Income tax expense 1,110 6,123 Depreciation and amo
Slide 14: Non-GAAP Reconciliation to Funds from Operations and Adjusted FFO
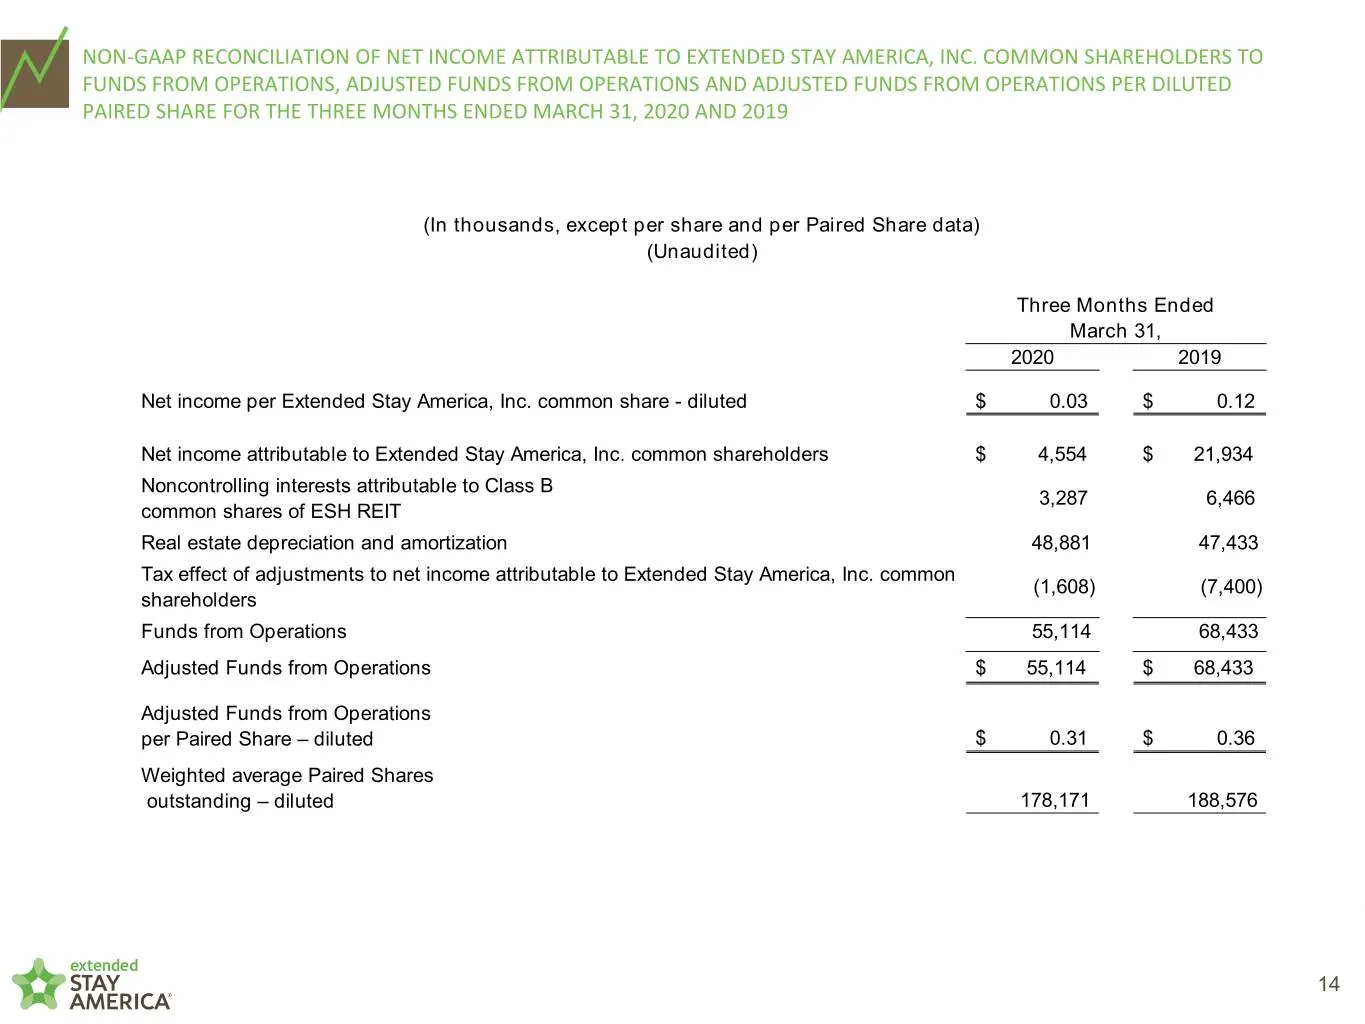
NON-GAAP RECONCILIATION OF NET INCOME ATTRIBUTABLE TO EXTENDED STAY AMERICA, INC. COMMON SHAREHOLDERS TO FUNDS FROM OPERATIONS, ADJUSTED FUNDS FROM OPERATIONS AND ADJUSTED FUNDS FROM OPERATIONS PER DILUTED PAIRED SHARE FOR THE THREE MONTHS ENDED MARCH 31, 2020 AND 2019 (In thousands, except per shar
Slide 15: Non-GAAP Reconciliation to Paired Share Income and Adjusted Paired Share Income
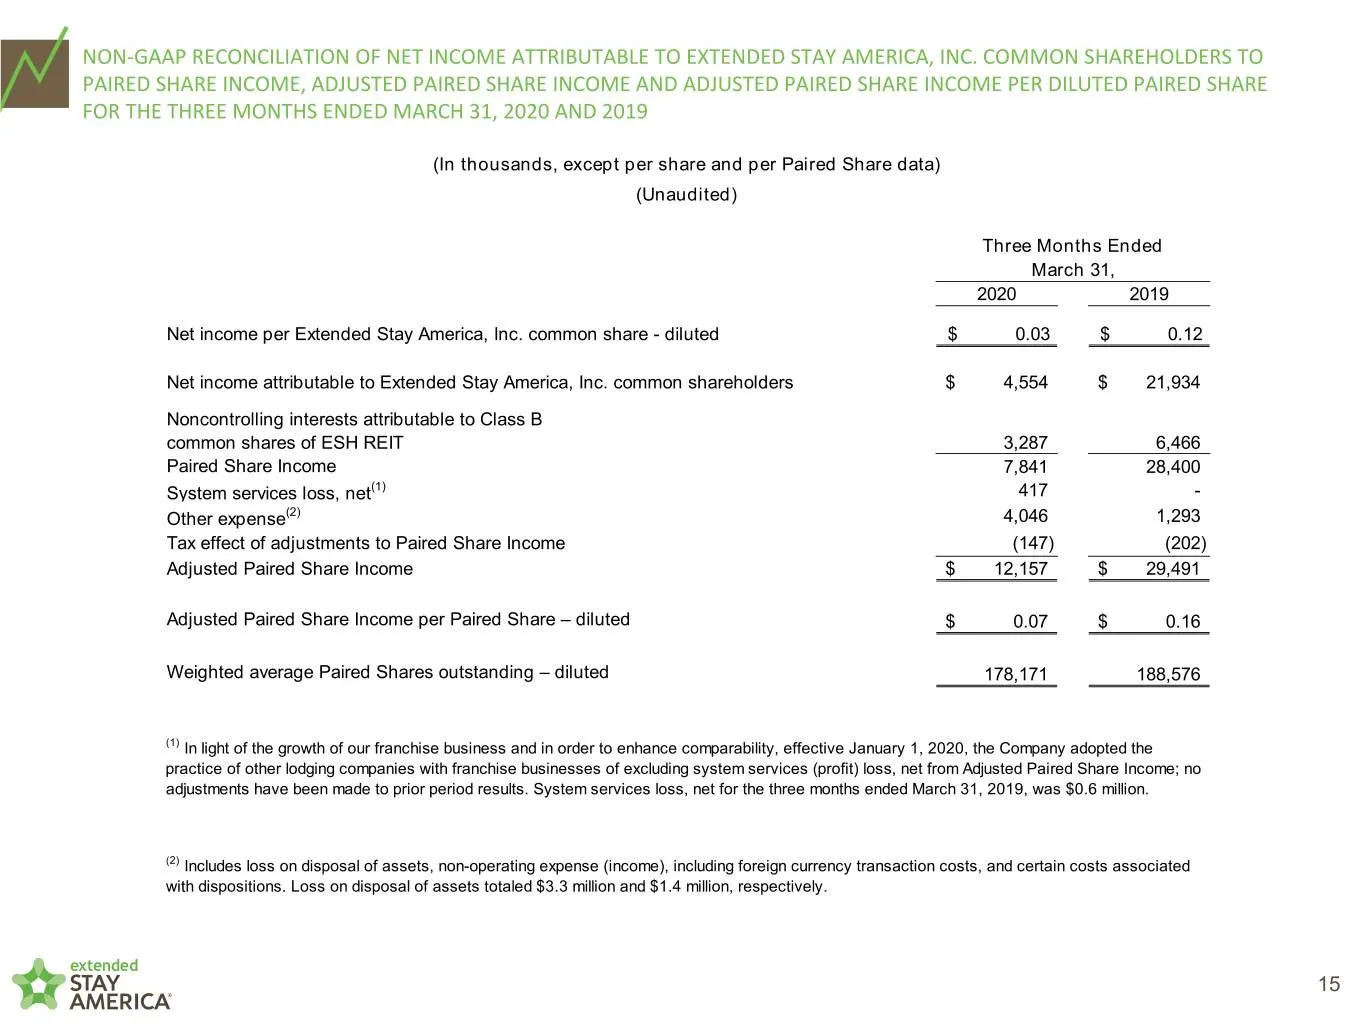
NON-GAAP RECONCILIATION OF NET INCOME ATTRIBUTABLE TO EXTENDED STAY AMERICA, INC. COMMON SHAREHOLDERS TO PAIRED SHARE INCOME, ADJUSTED PAIRED SHARE INCOME AND ADJUSTED PAIRED SHARE INCOME PER DILUTED PAIRED SHARE FOR THE THREE MONTHS ENDED MARCH 31, 2020 AND 2019 (In thousands, except per share and
Source: SEC EDGAR · 8-K filed May 6, 2020
More decks from Extended Stay America Inc
 Proxy Contest (May 2021)40 slides · May 19, 2021
 Proxy Contest (May 2021)97 slides · May 18, 2021
 Q4 2020 Earnings Presentation30 slides · Feb 25, 2021
 Q3 2020 Earnings Presentation15 slides · Nov 9, 2020
 Q2 2020 Earnings Presentation15 slides · Aug 10, 2020
 Q4 2019 Earnings Presentation16 slides · Feb 26, 2020