Professional — Q1 2020 Earnings Presentation
25 slides from Professional's earnings presentation, May 18, 2020
Slide 1: First Quarter 2020 Earnings Presentation
FIRST QUARTER 2020 EARNINGS PRESENTATION PAGE 1 EARNINGS PRESENTATION FIRST QUARTER 2020 PFHD:NASDAQ
Slide 2: Forward Looking Statements
FIRST QUARTER 2020 EARNINGS PRESENTATION PAGE 2 FORWARD LOOKING STATEMENTS ! This slide presentation contains forward-looking statements involving significant risks and uncertainties. Several important factors could cause actual results to differ materially from those in the forward- looking statement
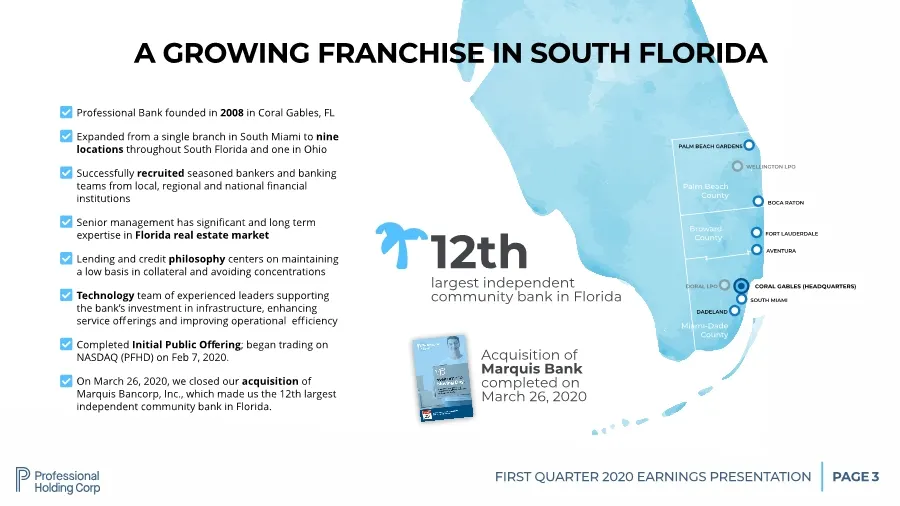
Slide 3: A Growing Franchise in South Florida
FIRST QUARTER 2020 EARNINGS PRESENTATION PAGE CORAL GABLES (HEADQUARTERS) SOUTH MIAMI FORT LAUDERDALE BOCA RATON WELLINGTON LPO DADELAND PALM BEACH GARDENS DORAL LPO Palm Beach County Broward County Miami-Dade County 3 A GROWING FRANCHISE IN SOUTH FLORIDA 12th largest independent community bank in F
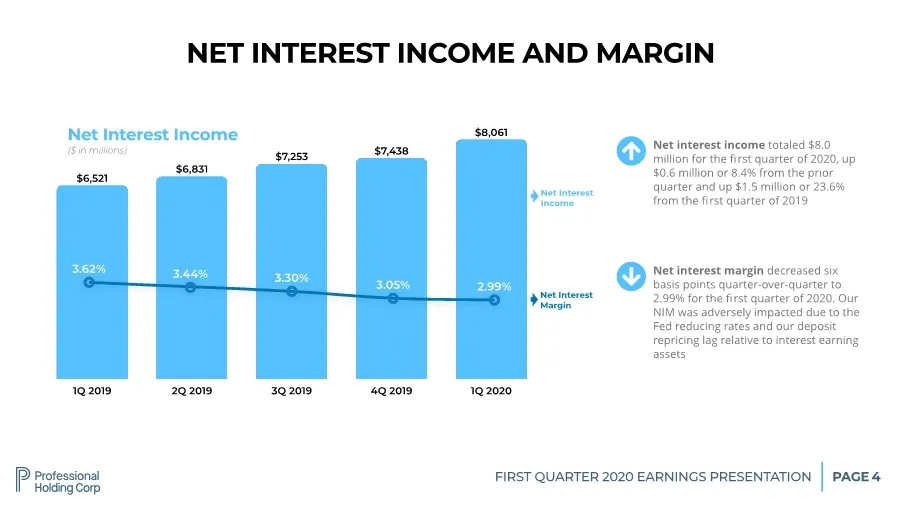
Slide 4: Net Interest Income and Margin
FIRST QUARTER 2020 EARNINGS PRESENTATION PAGE 4 1Q 2019 2Q 2019 3Q 2019 4Q 2019 1Q 2020 $8,061 $7,438 $7,253 $6,831 $6,521 NET INTEREST INCOME AND MARGIN Net Interest Income ($ in millions) Net Interest Income Net Interest Margin " Net interest income totaled $8.0 million for the first quarter of 202
Slide 5: Consistent Loan Growth
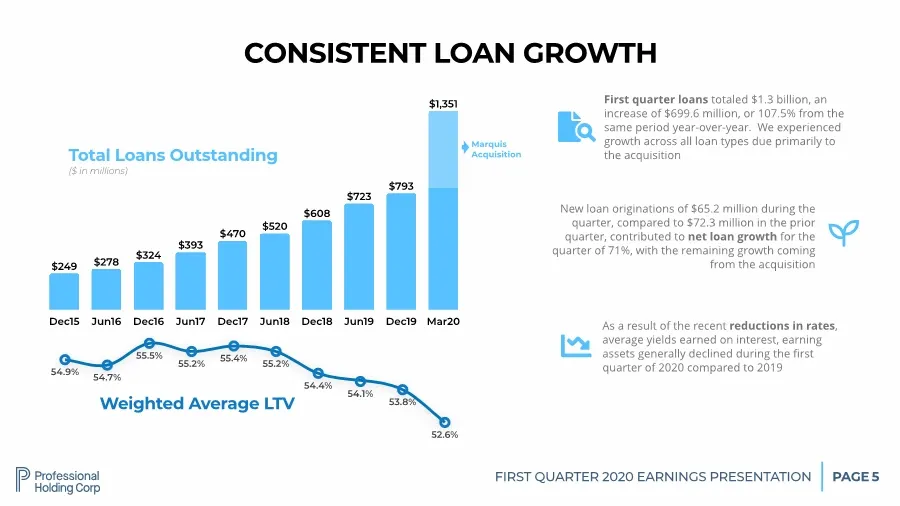
FIRST QUARTER 2020 EARNINGS PRESENTATION PAGE 5 Dec15 Jun16 Dec16 Jun17 Dec17 Jun18 Dec18 Jun19 Dec19 Mar20 $1,351 $793 $723 $608 $520 $470 $393 $324 $278 $249 CONSISTENT LOAN GROWTH Total Loans Outstanding ($ in millions) # First quarter loans totaled $1.3 billion, an increase of $699.6 million, or
Slide 6: Strong Deposit Franchise
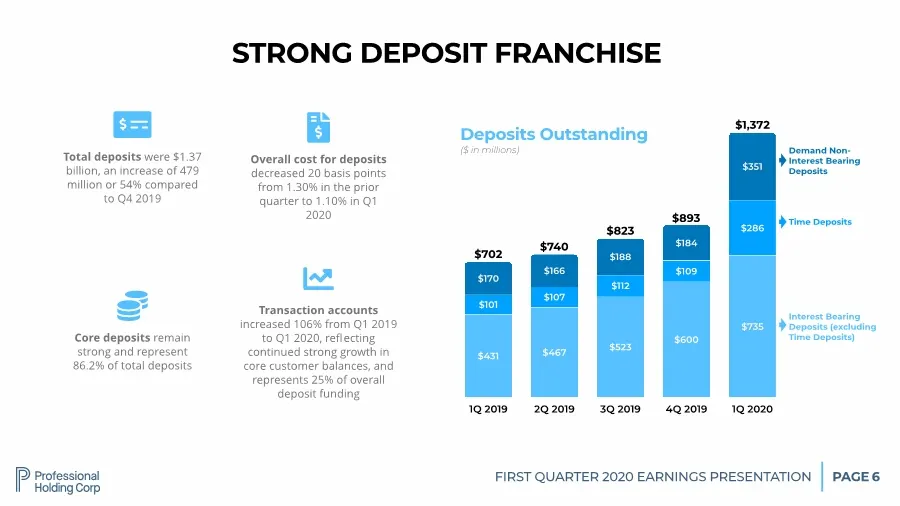
FIRST QUARTER 2020 EARNINGS PRESENTATION PAGE 6 1Q 2019 2Q 2019 3Q 2019 4Q 2019 1Q 2020 $351 $184 $188 $166 $170 $286 $109 $112 $107 $101 $735 $600 $523 $467 $431 STRONG DEPOSIT FRANCHISE Deposits Outstanding ($ in millions) $702 $740 $823 $893 $1,372 Interest Bearing Deposits (excluding Time Deposi
Slide 7: Average Deposit Balances and Cost
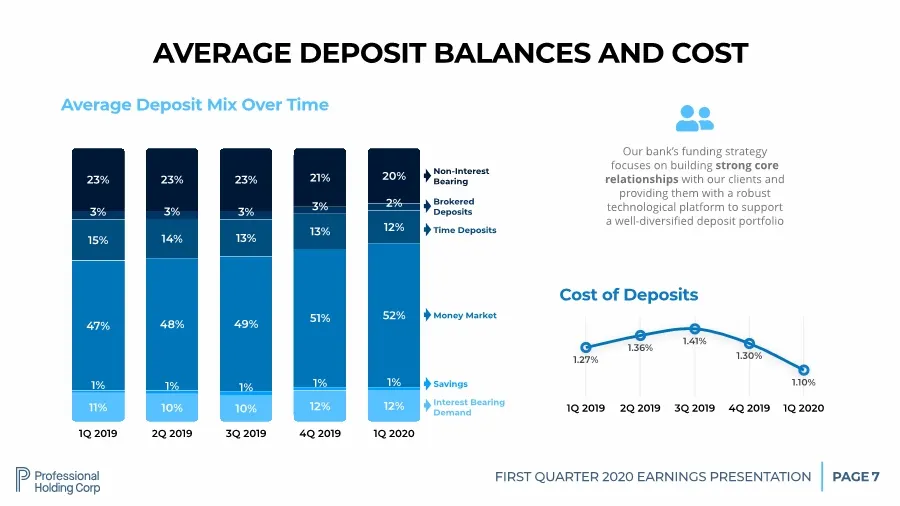
FIRST QUARTER 2020 EARNINGS PRESENTATION PAGE 7 1Q 2019 2Q 2019 3Q 2019 4Q 2019 1Q 2020 20% 21% 23% 23% 23% 2% 3% 3% 3% 3% 12% 13% 13% 14% 15% 52% 51% 49% 48% 47% 1% 1% 1% 1% 1% 12% 12% 10% 10% 11% Average Deposit Mix Over Time Interest Bearing Demand Savings Money Market Our bank’s funding strategy
Slide 8: Robust Asset Quality
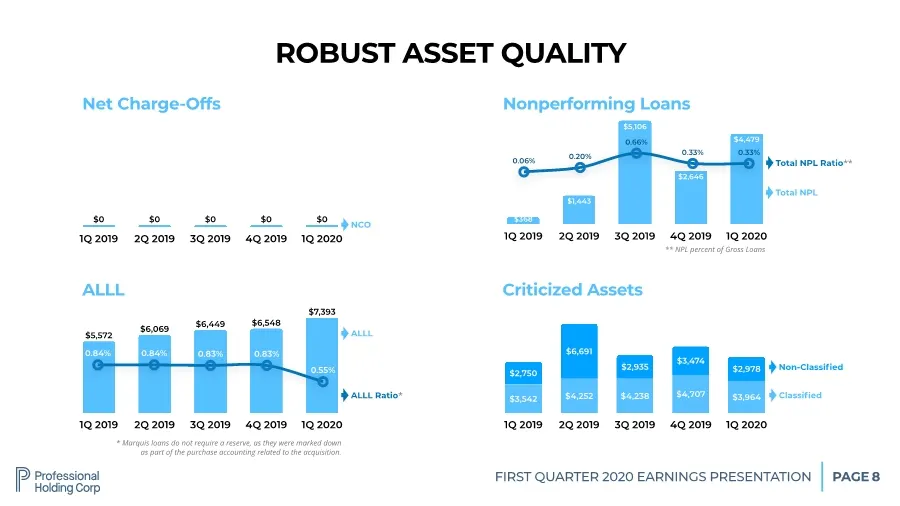
FIRST QUARTER 2020 EARNINGS PRESENTATION PAGE 8 1Q 2019 2Q 2019 3Q 2019 4Q 2019 1Q 2020 $7,393 $6,548 $6,449 $6,069 $5,572 ALLL ALLL ALLL Ratio* 0.55% 0.83% 0.83% 0.84% 0.84% ROBUST ASSET QUALITY 1Q 2019 2Q 2019 3Q 2019 4Q 2019 1Q 2020 $0 $0 $0 $0 $0 Net Charge-Offs NCO 1Q 2019 2Q 2019 3Q 2019 4Q 20
Slide 9: Digital Focus
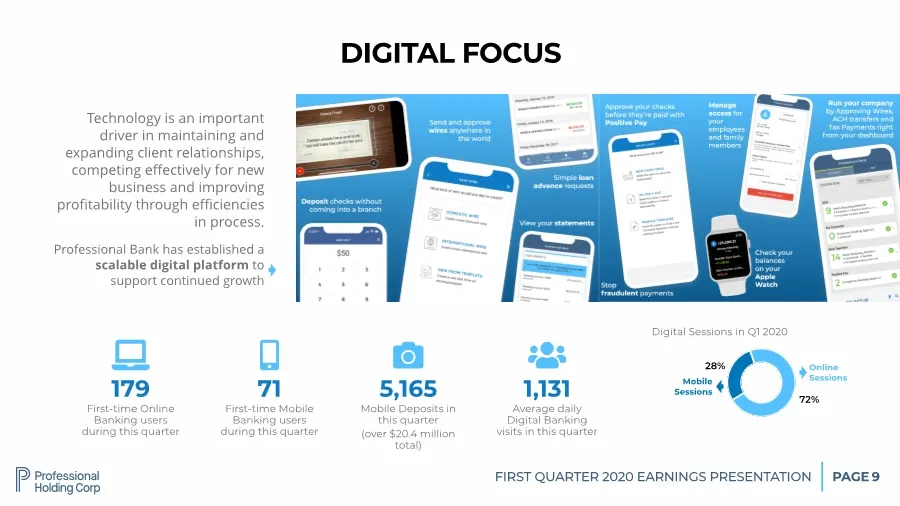
FIRST QUARTER 2020 EARNINGS PRESENTATION PAGE 9 DIGITAL FOCUS Technology is an important driver in maintaining and expanding client relationships, competing effectively for new business and improving profitability through efficiencies in process. Professional Bank has established a scalable digital plat
Slide 10: Steady Shareholder Value
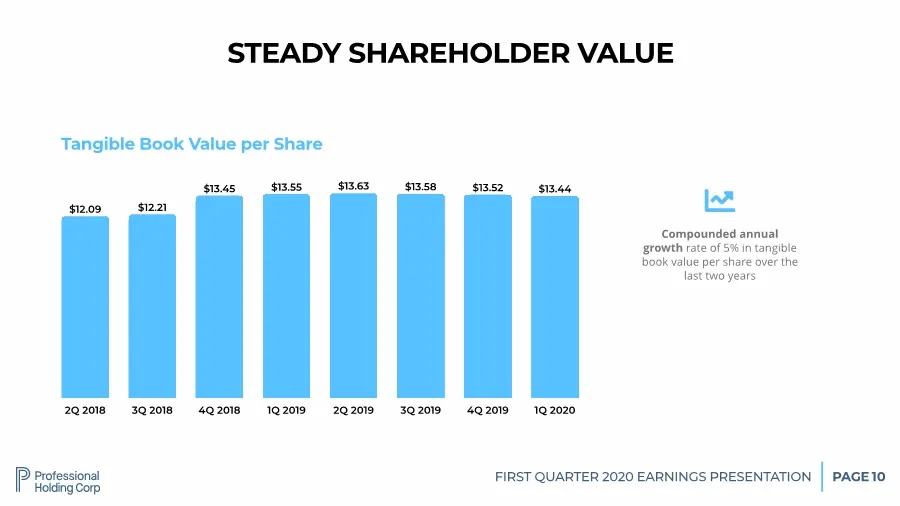
FIRST QUARTER 2020 EARNINGS PRESENTATION PAGE 10 2Q 2018 3Q 2018 4Q 2018 1Q 2019 2Q 2019 3Q 2019 4Q 2019 1Q 2020 $13.44 $13.52 $13.58 $13.63 $13.55 $13.45 $12.21 $12.09 STEADY SHAREHOLDER VALUE Tangible Book Value per Share % Compounded annual growth rate of 5% in tangible book value per share over
Slide 11: Loan Portfolio Highlights
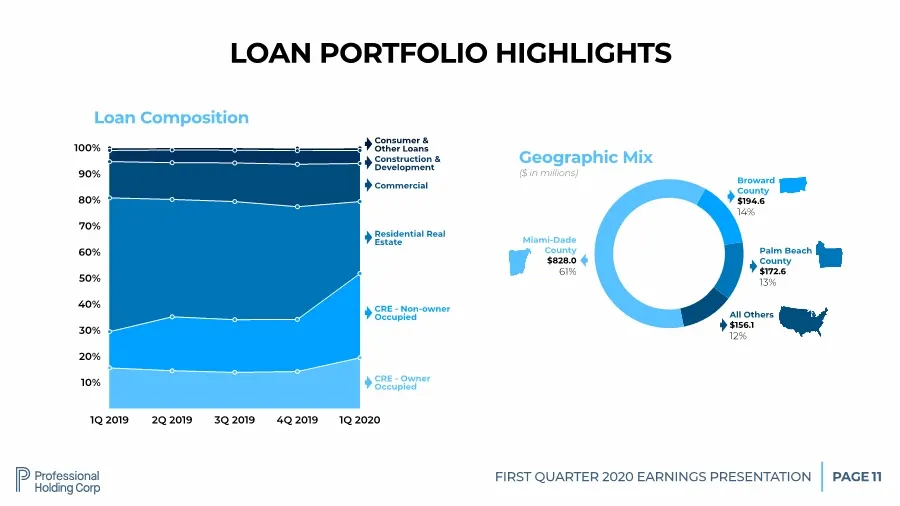
FIRST QUARTER 2020 EARNINGS PRESENTATION PAGE 11 Geographic Mix ($ in millions) Miami-Dade County $828.0 61% Broward County $194.6 14% Palm Beach County $172.6 13% LOAN PORTFOLIO HIGHLIGHTS 10% 20% 30% 40% 50% 60% 70% 80% 90% 100% 1Q 2019 2Q 2019 3Q 2019 4Q 2019 1Q 2020 Loan Composition CRE - Owner
Slide 12: Interest Rate Sensitivity
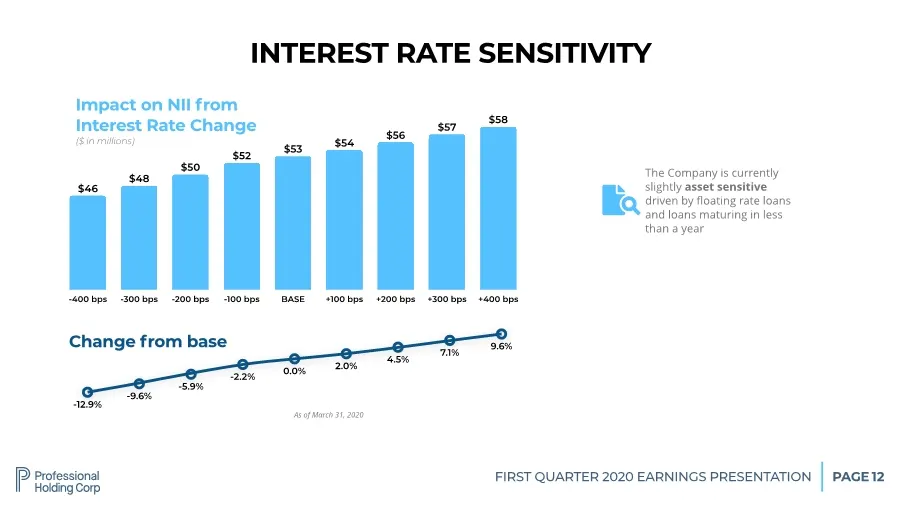
FIRST QUARTER 2020 EARNINGS PRESENTATION PAGE 12 -400 bps -300 bps -200 bps -100 bps BASE +100 bps +200 bps +300 bps +400 bps $58 $57 $56 $54 $53 $52 $50 $48 $46 INTEREST RATE SENSITIVITY Impact on NII from Interest Rate Change ($ in millions) # The Company is currently slightly asset sensitive driv
Slide 13: Asset Liability Management Trends
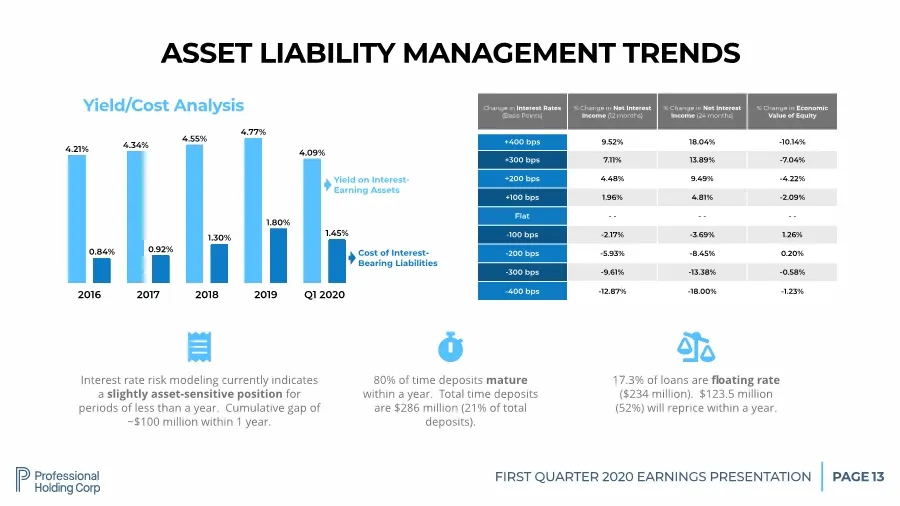
FIRST QUARTER 2020 EARNINGS PRESENTATION PAGE 13 Interest rate risk modeling currently indicates a slightly asset-sensitive position for periods of less than a year. Cumulative gap of ~$100 million within 1 year. & ASSET LIABILITY MANAGEMENT TRENDS 17.3% of loans are floating rate ($234 million). $12
Slide 14: Investment Portfolio
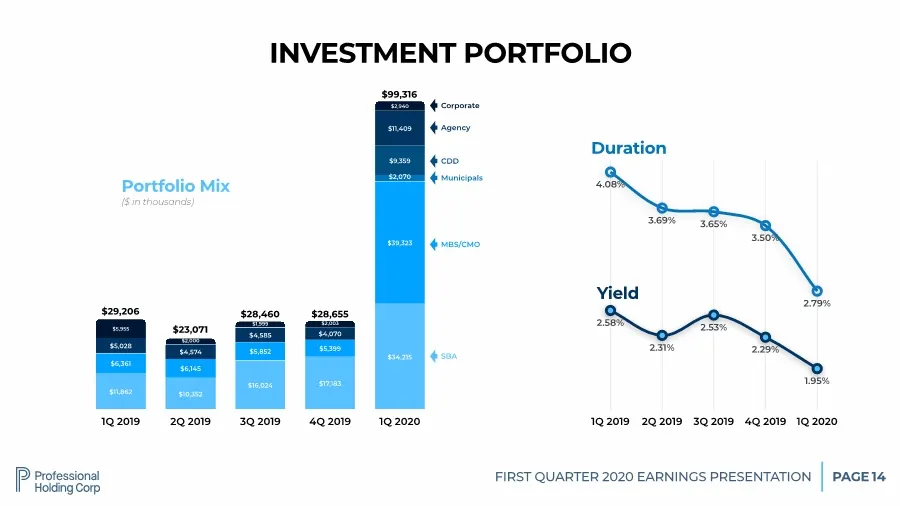
FIRST QUARTER 2020 EARNINGS PRESENTATION PAGE 14 1Q 2019 2Q 2019 3Q 2019 4Q 2019 1Q 2020 $2,940 $2,003 $1,999 $2,000 $5,955 $11,409 $4,070 $4,585 $4,574 $5,028 $9,359 $2,070 $39,323 $5,399 $5,852 $6,145 $6,361 $34,215 $17,183 $16,024 $10,352 $11,862 Portfolio Mix ($ in thousands) SBA MBS/CMO Municip
Slide 15: Spotlight: Digital Innovation Center
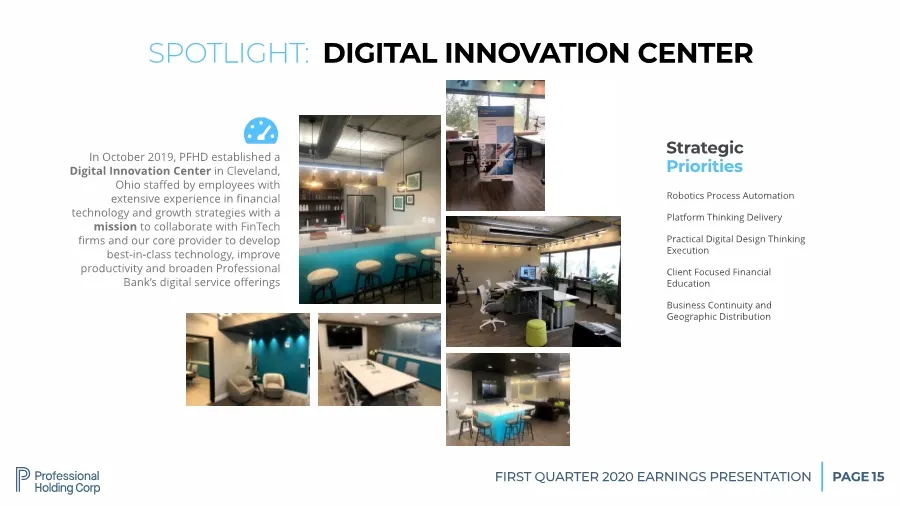
FIRST QUARTER 2020 EARNINGS PRESENTATION PAGE Professional Bank’s new Digital Innovation Center is designed as a flexible space to test new technologies, craft user experiences and push the boundaries of financial innovation. 15 SPOTLIGHT: DIGITAL INNOVATION CENTER Robotics Process Automation Platfo
Slide 16: Effects on Income & Expense of Bank Acquisition
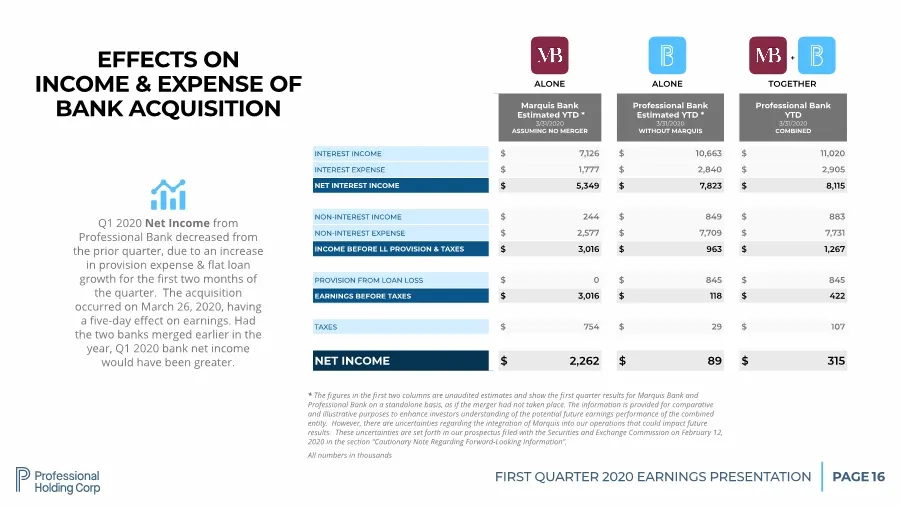
FIRST QUARTER 2020 EARNINGS PRESENTATION PAGE 16 EFFECTS ON INCOME & EXPENSE OF BANK ACQUISITION Marquis Bank Estimated YTD * 3/31/2020 ASSUMING NO MERGER Professional Bank Estimated YTD * 3/31/2020 WITHOUT MARQUIS Professional Bank YTD 3/31/2020 COMBINED INTEREST INCOME $ 7,126 $ 10,663 $ 11,020 IN

Slide 17: Operational Response and Bank Preparedness COVID-19
OPERATIONAL RESPONSE AND BANK PREPAREDNESS COVID-19
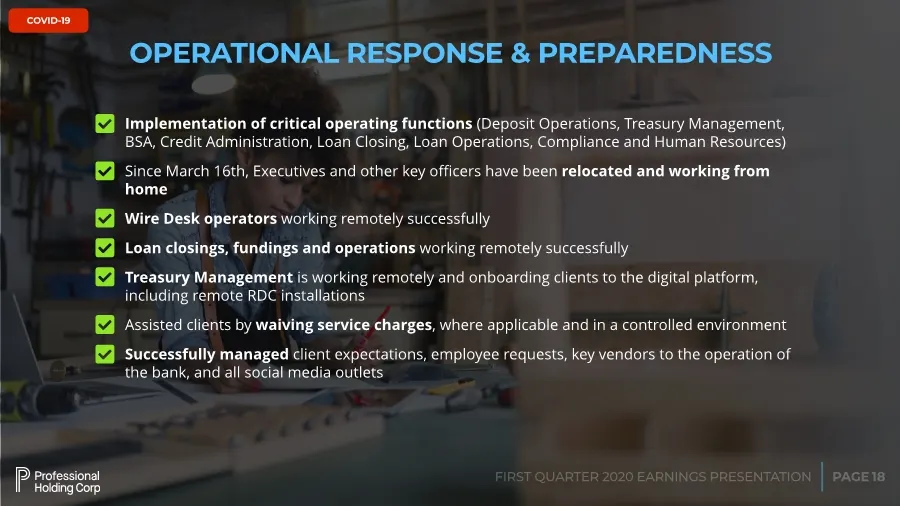
Slide 18: Operational Response & Preparedness
PAGE FIRST QUARTER 2020 EARNINGS PRESENTATION COVID-19 18 Implementation of critical operating functions (Deposit Operations, Treasury Management, BSA, Credit Administration, Loan Closing, Loan Operations, Compliance and Human Resources) Since March 16th, Executives and other key officers have been re
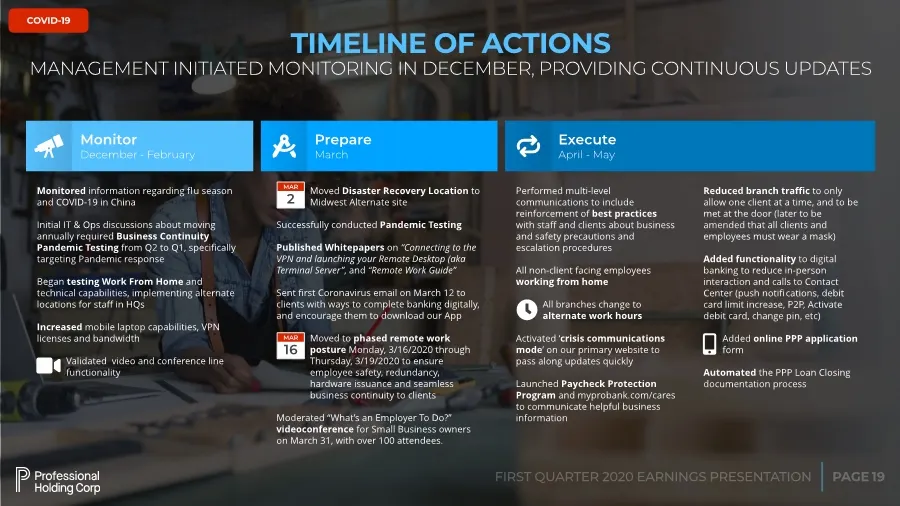
Slide 19: COVID-19 Timeline of Actions
PAGE FIRST QUARTER 2020 EARNINGS PRESENTATION COVID-19 19 TIMELINE OF ACTIONS MANAGEMENT INITIATED MONITORING IN DECEMBER, PROVIDING CONTINUOUS UPDATES Monitor December - February Prepare March Execute April - May 菉 , - Monitored information regarding flu season and COVID-19 in China Initial IT & Ops
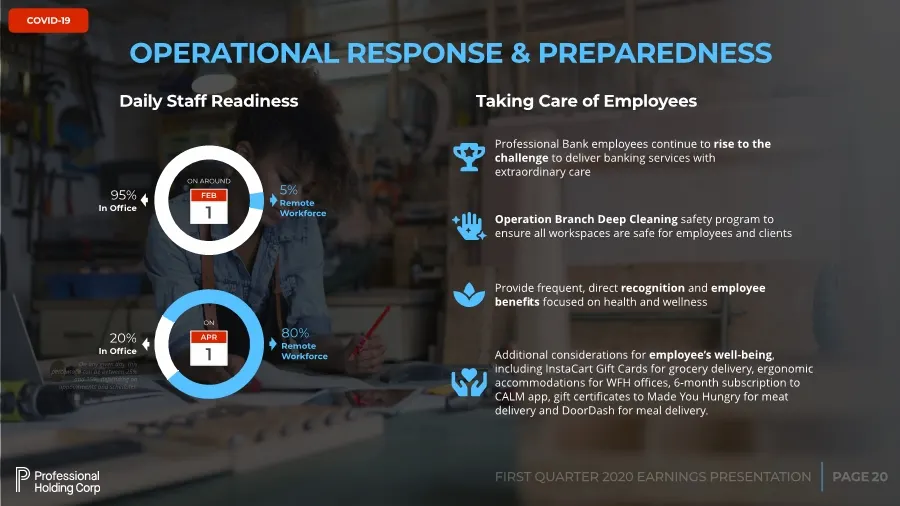
Slide 20: Daily Staff Readiness
PAGE FIRST QUARTER 2020 EARNINGS PRESENTATION COVID-19 20 Daily Staff Readiness 5% Remote Workforce 95% In Office OPERATIONAL RESPONSE & PREPAREDNESS .. Professional Bank employees continue to rise to the challenge to deliver banking services with extraordinary care Taking Care of Employees 諾 Operati
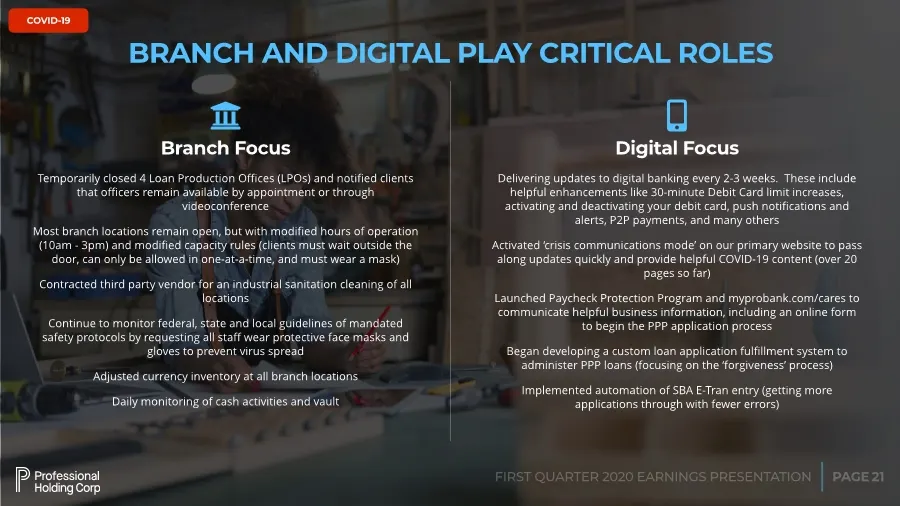
Slide 21: Branch and Digital Play Critical Roles
PAGE FIRST QUARTER 2020 EARNINGS PRESENTATION COVID-19 21 BRANCH AND DIGITAL PLAY CRITICAL ROLES 2 Temporarily closed 4 Loan Production Offices (LPOs) and notified clients that officers remain available by appointment or through videoconference Most branch locations remain open, but with modified hours of
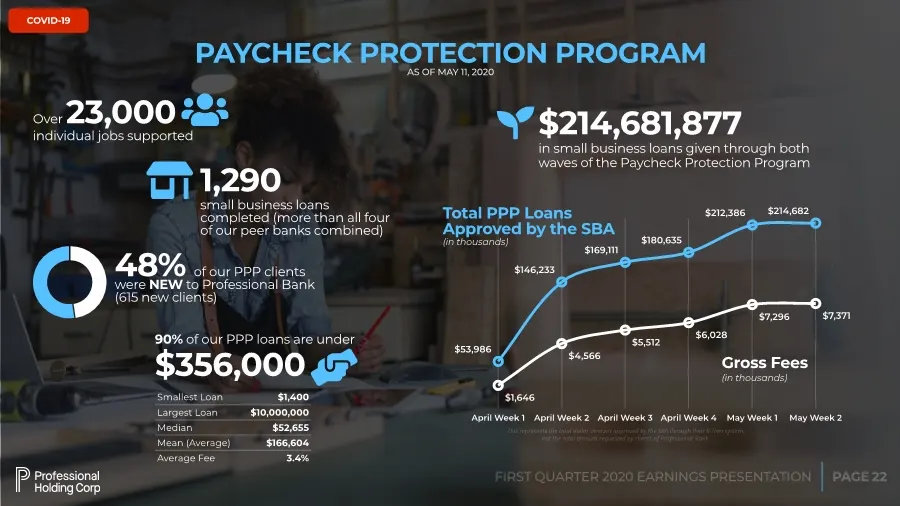
Slide 22: Paycheck Protection Program
PAGE FIRST QUARTER 2020 EARNINGS PRESENTATION COVID-19 22 Over 23,000 individual jobs supported , PAYCHECK PROTECTION PROGRAM AS OF MAY 11, 2020 1,290 small business loans completed (more than all four of our peer banks combined) / COVID-19 $214,681,877 in small business loans given through both wav
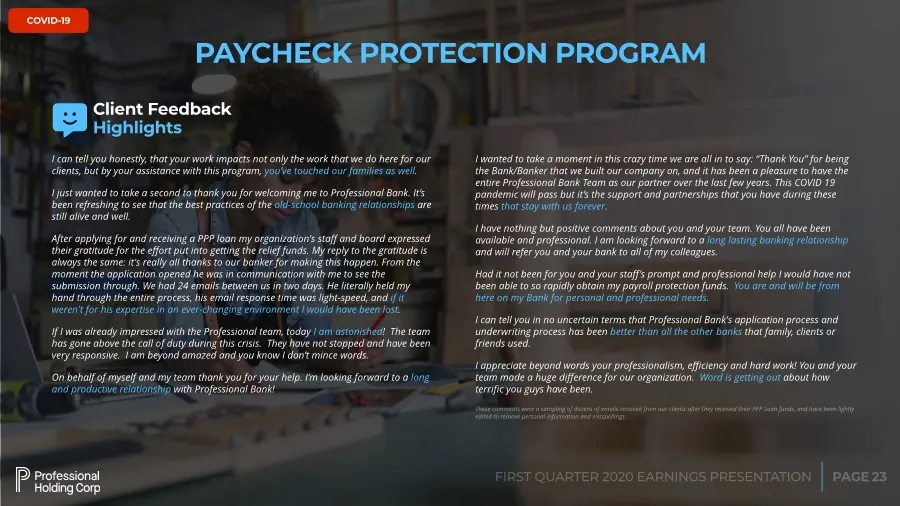
Slide 23: COVID-19 Client Testimonials
PAGE FIRST QUARTER 2020 EARNINGS PRESENTATION COVID-19 23 COVID-19 I can tell you honestly, that your work impacts not only the work that we do here for our clients, but by your assistance with this program, you’ve touched our families as well. I just wanted to take a second to thank you for welcomi
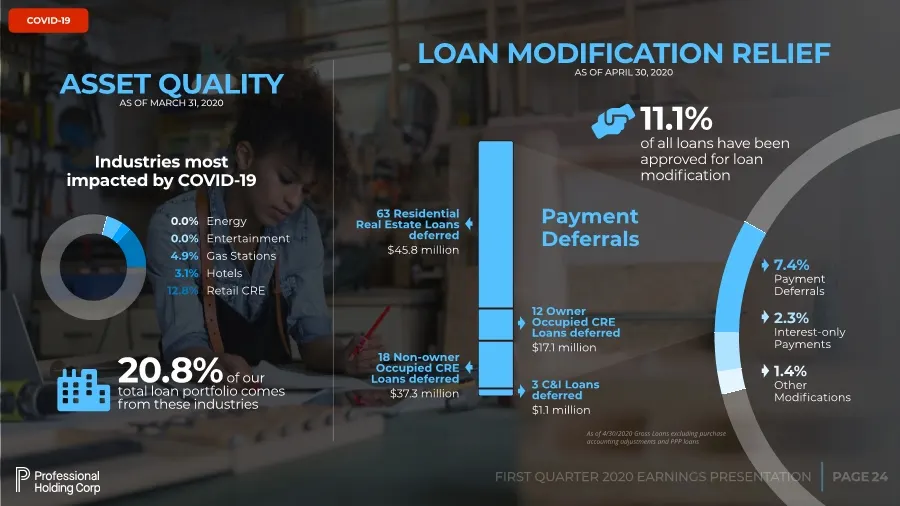
Slide 24: Asset Quality and Loan Modification Relief
PAGE FIRST QUARTER 2020 EARNINGS PRESENTATION COVID-19 24 ASSET QUALITY AS OF MARCH 31, 2020 Energy Entertainment Gas Stations Hotels Retail CRE Industries most impacted by COVID-19 20.8% of our total loan portfolio comes from these industries 2 0.0% 0.0% 4.9% 3.1% 12.8% 11.1% of all loans have been
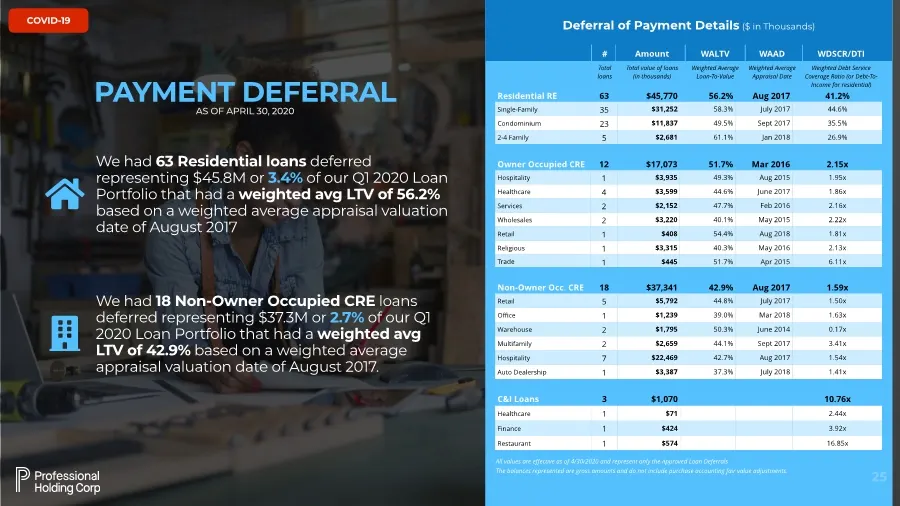
Slide 25: Approved Loan Deferrals by Loan Type
PAGE FIRST QUARTER 2020 EARNINGS PRESENTATION COVID-19 25 C&I Loans 3 $1,070 10.76x Healthcare 1 $71 2.44x Finance 1 $424 3.92x Restaurant 1 $574 16.85x All values are effective as of 4/30/2020 and represent only the Approved Loan Deferrals The balances represented are gross amounts and do not includ
Source: SEC EDGAR · 8-K filed May 18, 2020
More decks from Professional Holding Corp
 Q3 2022 Earnings Presentation19 slides · Oct 28, 2022
 Q2 2022 Earnings Presentation20 slides · Jul 28, 2022
 Q1 2022 Earnings Presentation21 slides · Apr 29, 2022
 Q4 2021 Earnings Presentation19 slides · Jan 27, 2022
 Q3 2021 Earnings Presentation19 slides · Oct 28, 2021
 Q2 2021 Earnings Presentation18 slides · Jul 29, 2021